Introduction
This is a report for the insert benchmark with 480M docs and 24 client(s). It is generated by scripts (bash, awk, sed) and Tufte might not be impressed. An overview of the insert benchmark is here and a short update is here. Below, by DBMS, I mean DBMS+version.config. An example is my8020.c10b40 where my means MySQL, 8020 is version 8.0.20 and c10b40 is the name for the configuration file.
The test server has 80 cores, hyperthreads enabled, 256G RAM and fast NVMe with XFS. The benchmark was run with 24 clients and there were 1 or 3 connections per client (1 for queries or inserts without rate limits, 1+1 for rate limited inserts+deletes). There are 24 tables, with a client per table. It loads 20M rows per-table without secondary indexes, creates secondary indexes, then inserts 50M rows per-table with a delete per insert to avoid growing the table. It then does 3 read+write tests for 3600s each that do queries as fast as possible with 100, 500 and then 1000 inserts/second/client concurrent with the queries and 1000 deletes/second to avoid growing the table. The database is cached by RocksDB.
The tested DBMS are:
- fbmy8028_ef5b9b101_jun23_hack.cy9cx_u - FB MySQL 8.0.28 compiled at git hash ef5b9b101 in June 2023 with RocksDB 8.3.1, cy9cx_u (base) config
- fbmy8028_ef5b9b101_jun23_hack.cy9cx_u_sd8k - FB MySQL 8.0.28 compiled at git hash ef5b9b101 in June 2023 with RocksDB 8.3.1, cy9cx_u config, adds rocksdb_compaction_sequential_deletes[_window]=8191/8192
- fbmy8028_ef5b9b101_jun23_hack.cy9cx_u_sd32k - FB MySQL 8.0.28 compiled at git hash ef5b9b101 in June 2023 with RocksDB 8.3.1, cy9cx_u config, adds rocksdb_compaction_sequential_deletes[_window]=32767/32768
- fbmy8028_ef5b9b101_jun23_hack.cy9cx_u_sd128k - FB MySQL 8.0.28 compiled at git hash ef5b9b101 in June 2023 with RocksDB 8.3.1, cy9cx_u config, adds rocksdb_compaction_sequential_deletes[_window]=131071/131072
Contents
- Summary
- l.i0: load without secondary indexes
- l.x: create secondary indexes
- l.i1: continue load after secondary indexes created
- q100.1: range queries with 100 insert/s per client
- q500.1: range queries with 500 insert/s per client
- q1000.1: range queries with 1000 insert/s per client
Summary
The numbers are inserts/s for l.i0 and l.i1, indexed docs (or rows) /s for l.x and queries/s for q100, q500, q1000. The values are the average rate over the entire test for inserts (IPS) and queries (QPS). The range of values for IPS and QPS is split into 3 parts: bottom 25%, middle 50%, top 25%. Values in the bottom 25% have a red background, values in the top 25% have a green background and values in the middle have no color. A gray background is used for values that can be ignored because the DBMS did not sustain the target insert rate. Red backgrounds are not used when the minimum value is within 80% of the max value.
| dbms | l.i0 | l.x | l.i1 | q100.1 | q500.1 | q1000.1 |
|---|---|---|---|---|---|---|
| fbmy8028_ef5b9b101_jun23_hack.cy9cx_u | 542986 | 1424629 | 57167 | 85962 | 78737 | 70439 |
| fbmy8028_ef5b9b101_jun23_hack.cy9cx_u_sd8k | 556844 | 1420414 | 57108 | 85978 | 77819 | 70251 |
| fbmy8028_ef5b9b101_jun23_hack.cy9cx_u_sd32k | 559440 | 1420414 | 57402 | 85617 | 77630 | 70149 |
| fbmy8028_ef5b9b101_jun23_hack.cy9cx_u_sd128k | 557491 | 1424629 | 57378 | 85606 | 78012 | 70540 |
This table has relative throughput, throughput for the DBMS relative to the DBMS in the first line, using the absolute throughput from the previous table. Values less than 0.95 have a yellow background. Values greater than 1.05 have a blue background.
| dbms | l.i0 | l.x | l.i1 | q100.1 | q500.1 | q1000.1 |
|---|---|---|---|---|---|---|
| fbmy8028_ef5b9b101_jun23_hack.cy9cx_u | 1.00 | 1.00 | 1.00 | 1.00 | 1.00 | 1.00 |
| fbmy8028_ef5b9b101_jun23_hack.cy9cx_u_sd8k | 1.03 | 1.00 | 1.00 | 1.00 | 0.99 | 1.00 |
| fbmy8028_ef5b9b101_jun23_hack.cy9cx_u_sd32k | 1.03 | 1.00 | 1.00 | 1.00 | 0.99 | 1.00 |
| fbmy8028_ef5b9b101_jun23_hack.cy9cx_u_sd128k | 1.03 | 1.00 | 1.00 | 1.00 | 0.99 | 1.00 |
This lists the average rate of inserts/s for the tests that do inserts concurrent with queries. For such tests the query rate is listed in the table above. The read+write tests are setup so that the insert rate should match the target rate every second. Cells that are not at least 95% of the target have a red background to indicate a failure to satisfy the target.
| dbms | q100.1 | q500.1 | q1000.1 |
|---|---|---|---|
| fbmy8028_ef5b9b101_jun23_hack.cy9cx_u | 2381 | 11907 | 23828 |
| fbmy8028_ef5b9b101_jun23_hack.cy9cx_u_sd8k | 2381 | 11907 | 23834 |
| fbmy8028_ef5b9b101_jun23_hack.cy9cx_u_sd32k | 2381 | 11911 | 23828 |
| fbmy8028_ef5b9b101_jun23_hack.cy9cx_u_sd128k | 2381 | 11907 | 23834 |
| target | 2400 | 12000 | 24000 |
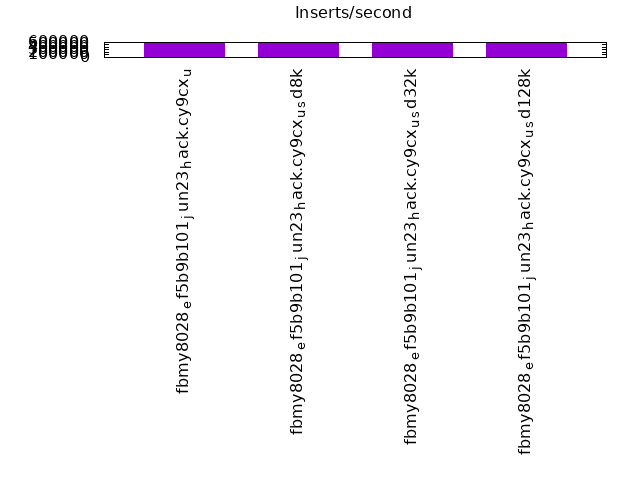
l.i0
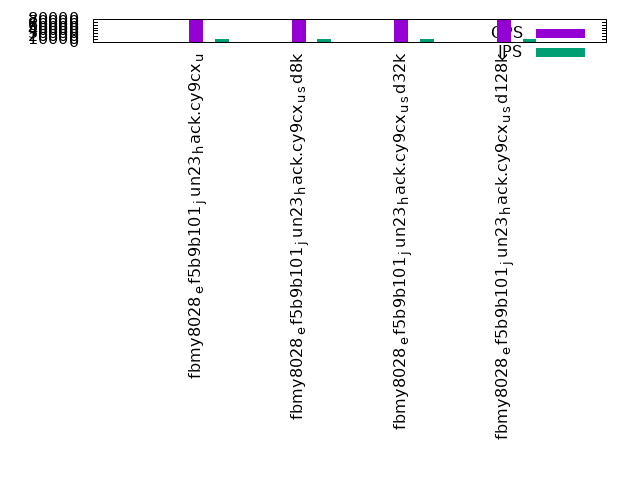
l.i0: load without secondary indexes. Graphs for performance per 1-second interval are here.
Average throughput:
Insert response time histogram: each cell has the percentage of responses that take <= the time in the header and max is the max response time in seconds. For the max column values in the top 25% of the range have a red background and in the bottom 25% of the range have a green background. The red background is not used when the min value is within 80% of the max value.
| dbms | 256us | 1ms | 4ms | 16ms | 64ms | 256ms | 1s | 4s | 16s | gt | max |
|---|---|---|---|---|---|---|---|---|---|---|---|
| fbmy8028_ef5b9b101_jun23_hack.cy9cx_u | 50.251 | 49.706 | 0.001 | 0.042 | 0.110 | ||||||
| fbmy8028_ef5b9b101_jun23_hack.cy9cx_u_sd8k | 53.087 | 46.869 | 0.001 | 0.042 | 0.127 | ||||||
| fbmy8028_ef5b9b101_jun23_hack.cy9cx_u_sd32k | 54.316 | 45.641 | 0.001 | 0.042 | 0.178 | ||||||
| fbmy8028_ef5b9b101_jun23_hack.cy9cx_u_sd128k | 53.142 | 46.815 | 0.001 | 0.042 | 0.098 |
Performance metrics for the DBMS listed above. Some are normalized by throughput, others are not. Legend for results is here.
ips	qps	rps	rmbps	wps	wmbps	rpq	rkbpq	wpi	wkbpi	csps	cpups	cspq	cpupq	dbgb1	dbgb2	rss	maxop	p50	p99	tag
542986	0	0	0.0	1731.0	122.7	0.000	0.000	0.003	0.231	351323	39.1	0.647	58	15.2	16.6	3.9	0.110	23577	13685	480m.fbmy8028_ef5b9b101_jun23_hack.cy9cx_u
556844	0	0	0.0	1784.4	129.7	0.000	0.000	0.003	0.239	340092	39.8	0.611	57	15.3	16.6	3.9	0.127	23876	15684	480m.fbmy8028_ef5b9b101_jun23_hack.cy9cx_u_sd8k
559440	0	0	0.0	1808.6	131.3	0.000	0.000	0.003	0.240	334243	39.8	0.597	57	15.6	16.9	4.0	0.178	24376	16284	480m.fbmy8028_ef5b9b101_jun23_hack.cy9cx_u_sd32k
557491	0	0	0.0	1801.5	129.2	0.000	0.000	0.003	0.237	333075	39.8	0.597	57	15.6	16.9	3.9	0.098	23876	15085	480m.fbmy8028_ef5b9b101_jun23_hack.cy9cx_u_sd128k
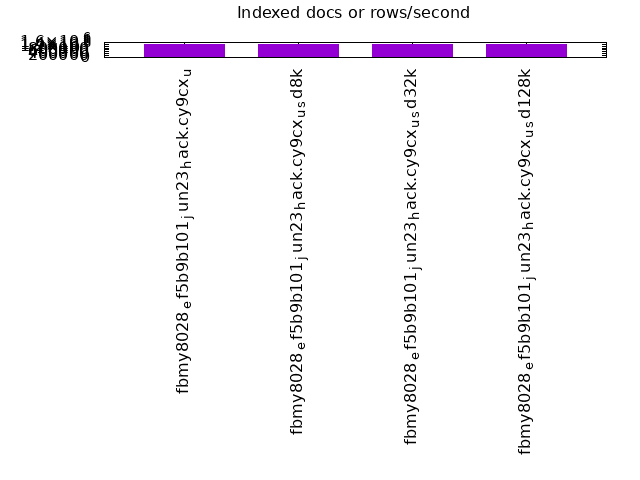
l.x
l.x: create secondary indexes.
Average throughput:
Performance metrics for the DBMS listed above. Some are normalized by throughput, others are not. Legend for results is here.
ips	qps	rps	rmbps	wps	wmbps	rpq	rkbpq	wpi	wkbpi	csps	cpups	cspq	cpupq	dbgb1	dbgb2	rss	maxop	p50	p99	tag
1424629	0	29	0.2	1832.2	127.4	0.000	0.000	0.001	0.092	35721	28.6	0.025	16	32.3	32.5	33.4	0.003	NA	NA	480m.fbmy8028_ef5b9b101_jun23_hack.cy9cx_u
1420414	0	29	0.2	1803.1	126.3	0.000	0.000	0.001	0.091	35278	27.8	0.025	16	32.3	32.5	33.4	0.003	NA	NA	480m.fbmy8028_ef5b9b101_jun23_hack.cy9cx_u_sd8k
1420414	0	29	0.2	1807.3	127.4	0.000	0.000	0.001	0.092	33580	27.4	0.024	15	32.3	32.5	33.5	0.003	NA	NA	480m.fbmy8028_ef5b9b101_jun23_hack.cy9cx_u_sd32k
1424629	0	30	0.2	1829.9	131.0	0.000	0.000	0.001	0.094	34135	28.2	0.024	16	32.3	32.5	33.5	0.004	NA	NA	480m.fbmy8028_ef5b9b101_jun23_hack.cy9cx_u_sd128k
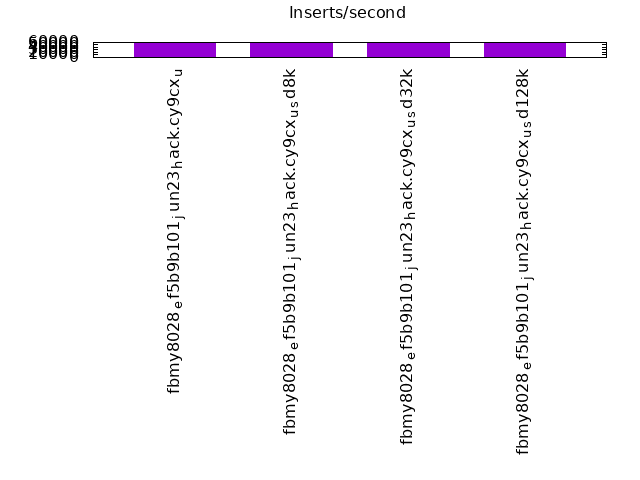
l.i1
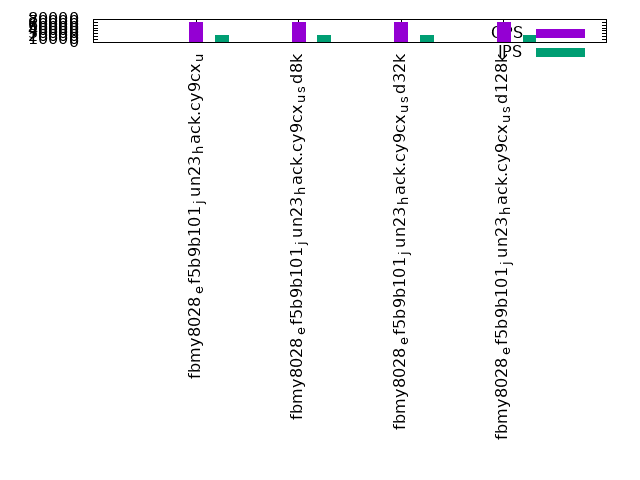
l.i1: continue load after secondary indexes created. Graphs for performance per 1-second interval are here.
Average throughput:
Insert response time histogram: each cell has the percentage of responses that take <= the time in the header and max is the max response time in seconds. For the max column values in the top 25% of the range have a red background and in the bottom 25% of the range have a green background. The red background is not used when the min value is within 80% of the max value.
| dbms | 256us | 1ms | 4ms | 16ms | 64ms | 256ms | 1s | 4s | 16s | gt | max |
|---|---|---|---|---|---|---|---|---|---|---|---|
| fbmy8028_ef5b9b101_jun23_hack.cy9cx_u | 0.025 | 10.867 | 88.636 | 0.465 | 0.007 | 0.367 | |||||
| fbmy8028_ef5b9b101_jun23_hack.cy9cx_u_sd8k | 0.022 | 10.421 | 89.213 | 0.337 | 0.006 | 0.361 | |||||
| fbmy8028_ef5b9b101_jun23_hack.cy9cx_u_sd32k | 0.023 | 11.065 | 88.524 | 0.366 | 0.019 | 0.001 | 1.360 | ||||
| fbmy8028_ef5b9b101_jun23_hack.cy9cx_u_sd128k | 0.024 | 11.048 | 88.541 | 0.362 | 0.025 | 0.832 |
Delete response time histogram: each cell has the percentage of responses that take <= the time in the header and max is the max response time in seconds. For the max column values in the top 25% of the range have a red background and in the bottom 25% of the range have a green background. The red background is not used when the min value is within 80% of the max value.
| dbms | 256us | 1ms | 4ms | 16ms | 64ms | 256ms | 1s | 4s | 16s | gt | max |
|---|---|---|---|---|---|---|---|---|---|---|---|
| fbmy8028_ef5b9b101_jun23_hack.cy9cx_u | 0.026 | 10.864 | 88.638 | 0.465 | 0.007 | 0.664 | |||||
| fbmy8028_ef5b9b101_jun23_hack.cy9cx_u_sd8k | 0.022 | 10.480 | 89.153 | 0.338 | 0.006 | 0.623 | |||||
| fbmy8028_ef5b9b101_jun23_hack.cy9cx_u_sd32k | 0.024 | 11.133 | 88.456 | 0.367 | 0.020 | 0.001 | 1.360 | ||||
| fbmy8028_ef5b9b101_jun23_hack.cy9cx_u_sd128k | 0.026 | 11.195 | 88.391 | 0.362 | 0.025 | 0.832 |
Performance metrics for the DBMS listed above. Some are normalized by throughput, others are not. Legend for results is here.
ips	qps	rps	rmbps	wps	wmbps	rpq	rkbpq	wpi	wkbpi	csps	cpups	cspq	cpupq	dbgb1	dbgb2	rss	maxop	p50	p99	tag
57167	0	75	1.0	1194.6	76.8	0.001	0.018	0.021	1.376	178525	18.4	3.123	257	41.4	42.4	178.2	0.367	2448	400	480m.fbmy8028_ef5b9b101_jun23_hack.cy9cx_u
57108	0	54	1.3	1274.4	82.4	0.001	0.023	0.022	1.477	178026	18.6	3.117	261	49.7	50.7	178.7	0.361	2448	449	480m.fbmy8028_ef5b9b101_jun23_hack.cy9cx_u_sd8k
57402	0	52	1.4	1273.9	81.7	0.001	0.026	0.022	1.457	174821	18.6	3.046	259	56.5	57.5	178.7	1.360	2497	350	480m.fbmy8028_ef5b9b101_jun23_hack.cy9cx_u_sd32k
57378	0	47	1.2	1286.7	83.7	0.001	0.022	0.022	1.495	168705	18.5	2.940	258	41.7	42.7	178.6	0.832	2497	400	480m.fbmy8028_ef5b9b101_jun23_hack.cy9cx_u_sd128k
q100.1
q100.1: range queries with 100 insert/s per client. Graphs for performance per 1-second interval are here.
Average throughput:
Query response time histogram: each cell has the percentage of responses that take <= the time in the header and max is the max response time in seconds. For max values in the top 25% of the range have a red background and in the bottom 25% of the range have a green background. The red background is not used when the min value is within 80% of the max value.
| dbms | 256us | 1ms | 4ms | 16ms | 64ms | 256ms | 1s | 4s | 16s | gt | max |
|---|---|---|---|---|---|---|---|---|---|---|---|
| fbmy8028_ef5b9b101_jun23_hack.cy9cx_u | 46.491 | 53.507 | 0.002 | nonzero | nonzero | 0.018 | |||||
| fbmy8028_ef5b9b101_jun23_hack.cy9cx_u_sd8k | 46.646 | 53.352 | 0.002 | nonzero | nonzero | 0.023 | |||||
| fbmy8028_ef5b9b101_jun23_hack.cy9cx_u_sd32k | 45.643 | 54.355 | 0.002 | nonzero | nonzero | 0.021 | |||||
| fbmy8028_ef5b9b101_jun23_hack.cy9cx_u_sd128k | 45.523 | 54.475 | 0.002 | nonzero | nonzero | 0.059 |
Insert response time histogram: each cell has the percentage of responses that take <= the time in the header and max is the max response time in seconds. For max values in the top 25% of the range have a red background and in the bottom 25% of the range have a green background. The red background is not used when the min value is within 80% of the max value.
| dbms | 256us | 1ms | 4ms | 16ms | 64ms | 256ms | 1s | 4s | 16s | gt | max |
|---|---|---|---|---|---|---|---|---|---|---|---|
| fbmy8028_ef5b9b101_jun23_hack.cy9cx_u | 99.656 | 0.344 | 0.008 | ||||||||
| fbmy8028_ef5b9b101_jun23_hack.cy9cx_u_sd8k | 99.872 | 0.125 | 0.003 | 0.057 | |||||||
| fbmy8028_ef5b9b101_jun23_hack.cy9cx_u_sd32k | 99.900 | 0.100 | 0.008 | ||||||||
| fbmy8028_ef5b9b101_jun23_hack.cy9cx_u_sd128k | 96.197 | 3.803 | 0.010 |
Delete response time histogram: each cell has the percentage of responses that take <= the time in the header and max is the max response time in seconds. For max values in the top 25% of the range have a red background and in the bottom 25% of the range have a green background. The red background is not used when the min value is within 80% of the max value.
| dbms | 256us | 1ms | 4ms | 16ms | 64ms | 256ms | 1s | 4s | 16s | gt | max |
|---|---|---|---|---|---|---|---|---|---|---|---|
| fbmy8028_ef5b9b101_jun23_hack.cy9cx_u | 99.815 | 0.183 | 0.002 | 0.040 | |||||||
| fbmy8028_ef5b9b101_jun23_hack.cy9cx_u_sd8k | 99.927 | 0.065 | 0.008 | 0.057 | |||||||
| fbmy8028_ef5b9b101_jun23_hack.cy9cx_u_sd32k | 99.950 | 0.049 | 0.001 | 0.077 | |||||||
| fbmy8028_ef5b9b101_jun23_hack.cy9cx_u_sd128k | 97.930 | 2.068 | 0.002 | 0.030 |
Performance metrics for the DBMS listed above. Some are normalized by throughput, others are not. Legend for results is here.
ips	qps	rps	rmbps	wps	wmbps	rpq	rkbpq	wpi	wkbpi	csps	cpups	cspq	cpupq	dbgb1	dbgb2	rss	maxop	p50	p99	tag
2381	85962	6	0.1	75.4	4.4	0.000	0.001	0.032	1.907	358976	32.6	4.176	303	36.6	38.6	179.5	0.018	3596	3229	480m.fbmy8028_ef5b9b101_jun23_hack.cy9cx_u
2381	85978	18	0.2	235.6	14.9	0.000	0.003	0.099	6.394	360749	33.4	4.196	311	37.4	39.4	180.6	0.023	3644	3277	480m.fbmy8028_ef5b9b101_jun23_hack.cy9cx_u_sd8k
2381	85617	62	0.7	109.1	6.5	0.001	0.008	0.046	2.797	358411	32.7	4.186	306	36.0	38.0	179.5	0.021	3580	3197	480m.fbmy8028_ef5b9b101_jun23_hack.cy9cx_u_sd32k
2381	85606	1	0.0	84.4	5.0	0.000	0.000	0.035	2.166	357628	32.7	4.178	306	36.0	38.0	179.7	0.059	3598	3213	480m.fbmy8028_ef5b9b101_jun23_hack.cy9cx_u_sd128k
q500.1
q500.1: range queries with 500 insert/s per client. Graphs for performance per 1-second interval are here.
Average throughput:
Query response time histogram: each cell has the percentage of responses that take <= the time in the header and max is the max response time in seconds. For max values in the top 25% of the range have a red background and in the bottom 25% of the range have a green background. The red background is not used when the min value is within 80% of the max value.
| dbms | 256us | 1ms | 4ms | 16ms | 64ms | 256ms | 1s | 4s | 16s | gt | max |
|---|---|---|---|---|---|---|---|---|---|---|---|
| fbmy8028_ef5b9b101_jun23_hack.cy9cx_u | 27.600 | 72.397 | 0.003 | nonzero | nonzero | 0.001 | 0.087 | ||||
| fbmy8028_ef5b9b101_jun23_hack.cy9cx_u_sd8k | 25.754 | 74.241 | 0.004 | nonzero | nonzero | 0.001 | 0.100 | ||||
| fbmy8028_ef5b9b101_jun23_hack.cy9cx_u_sd32k | 25.243 | 74.753 | 0.004 | nonzero | nonzero | 0.001 | 0.110 | ||||
| fbmy8028_ef5b9b101_jun23_hack.cy9cx_u_sd128k | 26.122 | 73.873 | 0.004 | nonzero | nonzero | 0.001 | 0.089 |
Insert response time histogram: each cell has the percentage of responses that take <= the time in the header and max is the max response time in seconds. For max values in the top 25% of the range have a red background and in the bottom 25% of the range have a green background. The red background is not used when the min value is within 80% of the max value.
| dbms | 256us | 1ms | 4ms | 16ms | 64ms | 256ms | 1s | 4s | 16s | gt | max |
|---|---|---|---|---|---|---|---|---|---|---|---|
| fbmy8028_ef5b9b101_jun23_hack.cy9cx_u | 21.075 | 77.467 | 1.457 | 0.001 | 0.091 | ||||||
| fbmy8028_ef5b9b101_jun23_hack.cy9cx_u_sd8k | 3.517 | 28.595 | 67.881 | 0.007 | 0.116 | ||||||
| fbmy8028_ef5b9b101_jun23_hack.cy9cx_u_sd32k | 4.595 | 24.617 | 70.783 | 0.005 | 0.127 | ||||||
| fbmy8028_ef5b9b101_jun23_hack.cy9cx_u_sd128k | 14.464 | 48.382 | 37.147 | 0.007 | 0.111 |
Delete response time histogram: each cell has the percentage of responses that take <= the time in the header and max is the max response time in seconds. For max values in the top 25% of the range have a red background and in the bottom 25% of the range have a green background. The red background is not used when the min value is within 80% of the max value.
| dbms | 256us | 1ms | 4ms | 16ms | 64ms | 256ms | 1s | 4s | 16s | gt | max |
|---|---|---|---|---|---|---|---|---|---|---|---|
| fbmy8028_ef5b9b101_jun23_hack.cy9cx_u | 22.922 | 75.626 | 1.449 | 0.003 | 0.214 | ||||||
| fbmy8028_ef5b9b101_jun23_hack.cy9cx_u_sd8k | 4.209 | 28.332 | 67.451 | 0.008 | 0.116 | ||||||
| fbmy8028_ef5b9b101_jun23_hack.cy9cx_u_sd32k | 5.110 | 24.467 | 70.418 | 0.005 | 0.123 | ||||||
| fbmy8028_ef5b9b101_jun23_hack.cy9cx_u_sd128k | 16.120 | 47.021 | 36.852 | 0.007 | 0.114 |
Performance metrics for the DBMS listed above. Some are normalized by throughput, others are not. Legend for results is here.
ips	qps	rps	rmbps	wps	wmbps	rpq	rkbpq	wpi	wkbpi	csps	cpups	cspq	cpupq	dbgb1	dbgb2	rss	maxop	p50	p99	tag
11907	78737	18	0.3	320.8	19.7	0.000	0.003	0.027	1.691	338754	34.8	4.302	354	36.8	38.2	183.1	0.087	3309	2925	480m.fbmy8028_ef5b9b101_jun23_hack.cy9cx_u
11907	77819	11	0.2	346.2	21.3	0.000	0.002	0.029	1.829	339821	35.2	4.367	362	36.2	37.6	184.0	0.100	3245	2813	480m.fbmy8028_ef5b9b101_jun23_hack.cy9cx_u_sd8k
11911	77630	10	0.2	337.4	20.8	0.000	0.003	0.028	1.792	339047	35.2	4.367	363	36.3	37.8	183.1	0.110	3245	2845	480m.fbmy8028_ef5b9b101_jun23_hack.cy9cx_u_sd32k
11907	78012	10	0.2	330.7	20.5	0.000	0.002	0.028	1.759	338485	35.1	4.339	360	36.4	37.8	183.0	0.089	3261	2861	480m.fbmy8028_ef5b9b101_jun23_hack.cy9cx_u_sd128k
q1000.1
q1000.1: range queries with 1000 insert/s per client. Graphs for performance per 1-second interval are here.
Average throughput:
Query response time histogram: each cell has the percentage of responses that take <= the time in the header and max is the max response time in seconds. For max values in the top 25% of the range have a red background and in the bottom 25% of the range have a green background. The red background is not used when the min value is within 80% of the max value.
| dbms | 256us | 1ms | 4ms | 16ms | 64ms | 256ms | 1s | 4s | 16s | gt | max |
|---|---|---|---|---|---|---|---|---|---|---|---|
| fbmy8028_ef5b9b101_jun23_hack.cy9cx_u | 12.392 | 87.589 | 0.019 | nonzero | nonzero | 0.064 | |||||
| fbmy8028_ef5b9b101_jun23_hack.cy9cx_u_sd8k | 12.219 | 87.762 | 0.019 | nonzero | nonzero | nonzero | 0.077 | ||||
| fbmy8028_ef5b9b101_jun23_hack.cy9cx_u_sd32k | 12.200 | 87.780 | 0.020 | nonzero | nonzero | nonzero | 0.090 | ||||
| fbmy8028_ef5b9b101_jun23_hack.cy9cx_u_sd128k | 12.651 | 87.330 | 0.019 | nonzero | nonzero | nonzero | 0.071 |
Insert response time histogram: each cell has the percentage of responses that take <= the time in the header and max is the max response time in seconds. For max values in the top 25% of the range have a red background and in the bottom 25% of the range have a green background. The red background is not used when the min value is within 80% of the max value.
| dbms | 256us | 1ms | 4ms | 16ms | 64ms | 256ms | 1s | 4s | 16s | gt | max |
|---|---|---|---|---|---|---|---|---|---|---|---|
| fbmy8028_ef5b9b101_jun23_hack.cy9cx_u | 2.995 | 11.699 | 85.306 | 0.056 | |||||||
| fbmy8028_ef5b9b101_jun23_hack.cy9cx_u_sd8k | 2.890 | 15.145 | 81.964 | 0.001 | 0.067 | ||||||
| fbmy8028_ef5b9b101_jun23_hack.cy9cx_u_sd32k | 1.381 | 11.984 | 86.632 | 0.003 | 0.127 | ||||||
| fbmy8028_ef5b9b101_jun23_hack.cy9cx_u_sd128k | 2.495 | 8.755 | 88.750 | 0.001 | 0.065 |
Delete response time histogram: each cell has the percentage of responses that take <= the time in the header and max is the max response time in seconds. For max values in the top 25% of the range have a red background and in the bottom 25% of the range have a green background. The red background is not used when the min value is within 80% of the max value.
| dbms | 256us | 1ms | 4ms | 16ms | 64ms | 256ms | 1s | 4s | 16s | gt | max |
|---|---|---|---|---|---|---|---|---|---|---|---|
| fbmy8028_ef5b9b101_jun23_hack.cy9cx_u | 3.021 | 11.715 | 85.263 | nonzero | nonzero | 0.293 | |||||
| fbmy8028_ef5b9b101_jun23_hack.cy9cx_u_sd8k | 2.998 | 15.057 | 81.943 | 0.001 | 0.198 | ||||||
| fbmy8028_ef5b9b101_jun23_hack.cy9cx_u_sd32k | 1.396 | 11.986 | 86.615 | 0.003 | 0.129 | ||||||
| fbmy8028_ef5b9b101_jun23_hack.cy9cx_u_sd128k | 2.507 | 8.785 | 88.707 | 0.002 | nonzero | 0.274 |
Performance metrics for the DBMS listed above. Some are normalized by throughput, others are not. Legend for results is here.
ips	qps	rps	rmbps	wps	wmbps	rpq	rkbpq	wpi	wkbpi	csps	cpups	cspq	cpupq	dbgb1	dbgb2	rss	maxop	p50	p99	tag
23828	70439	46	0.5	613.4	37.3	0.001	0.007	0.026	1.601	330765	39.1	4.696	444	37.5	38.2	185.5	0.064	2941	2509	480m.fbmy8028_ef5b9b101_jun23_hack.cy9cx_u
23834	70251	16	0.5	819.3	51.7	0.000	0.007	0.034	2.221	329148	39.7	4.685	452	36.7	37.3	185.9	0.077	2941	2478	480m.fbmy8028_ef5b9b101_jun23_hack.cy9cx_u_sd8k
23828	70149	16	0.5	762.3	48.3	0.000	0.008	0.032	2.075	328767	39.5	4.687	450	36.6	37.3	185.7	0.090	2941	2510	480m.fbmy8028_ef5b9b101_jun23_hack.cy9cx_u_sd32k
23834	70540	17	0.4	650.1	39.9	0.000	0.006	0.027	1.714	329510	39.0	4.671	442	36.9	37.5	185.7	0.071	2957	2541	480m.fbmy8028_ef5b9b101_jun23_hack.cy9cx_u_sd128k
l.i0
l.i0: load without secondary indexes
Performance metrics for all DBMS, not just the ones listed above. Some are normalized by throughput, others are not. Legend for results is here.
ips	qps	rps	rmbps	wps	wmbps	rpq	rkbpq	wpi	wkbpi	csps	cpups	cspq	cpupq	dbgb1	dbgb2	rss	maxop	p50	p99	tag
542986	0	0	0.0	1731.0	122.7	0.000	0.000	0.003	0.231	351323	39.1	0.647	58	15.2	16.6	3.9	0.110	23577	13685	480m.fbmy8028_ef5b9b101_jun23_hack.cy9cx_u
556844	0	0	0.0	1784.4	129.7	0.000	0.000	0.003	0.239	340092	39.8	0.611	57	15.3	16.6	3.9	0.127	23876	15684	480m.fbmy8028_ef5b9b101_jun23_hack.cy9cx_u_sd8k
559440	0	0	0.0	1808.6	131.3	0.000	0.000	0.003	0.240	334243	39.8	0.597	57	15.6	16.9	4.0	0.178	24376	16284	480m.fbmy8028_ef5b9b101_jun23_hack.cy9cx_u_sd32k
557491	0	0	0.0	1801.5	129.2	0.000	0.000	0.003	0.237	333075	39.8	0.597	57	15.6	16.9	3.9	0.098	23876	15085	480m.fbmy8028_ef5b9b101_jun23_hack.cy9cx_u_sd128k
l.x
l.x: create secondary indexes
Performance metrics for all DBMS, not just the ones listed above. Some are normalized by throughput, others are not. Legend for results is here.
ips	qps	rps	rmbps	wps	wmbps	rpq	rkbpq	wpi	wkbpi	csps	cpups	cspq	cpupq	dbgb1	dbgb2	rss	maxop	p50	p99	tag
1424629	0	29	0.2	1832.2	127.4	0.000	0.000	0.001	0.092	35721	28.6	0.025	16	32.3	32.5	33.4	0.003	NA	NA	480m.fbmy8028_ef5b9b101_jun23_hack.cy9cx_u
1420414	0	29	0.2	1803.1	126.3	0.000	0.000	0.001	0.091	35278	27.8	0.025	16	32.3	32.5	33.4	0.003	NA	NA	480m.fbmy8028_ef5b9b101_jun23_hack.cy9cx_u_sd8k
1420414	0	29	0.2	1807.3	127.4	0.000	0.000	0.001	0.092	33580	27.4	0.024	15	32.3	32.5	33.5	0.003	NA	NA	480m.fbmy8028_ef5b9b101_jun23_hack.cy9cx_u_sd32k
1424629	0	30	0.2	1829.9	131.0	0.000	0.000	0.001	0.094	34135	28.2	0.024	16	32.3	32.5	33.5	0.004	NA	NA	480m.fbmy8028_ef5b9b101_jun23_hack.cy9cx_u_sd128k
l.i1
l.i1: continue load after secondary indexes created
Performance metrics for all DBMS, not just the ones listed above. Some are normalized by throughput, others are not. Legend for results is here.
ips	qps	rps	rmbps	wps	wmbps	rpq	rkbpq	wpi	wkbpi	csps	cpups	cspq	cpupq	dbgb1	dbgb2	rss	maxop	p50	p99	tag
57167	0	75	1.0	1194.6	76.8	0.001	0.018	0.021	1.376	178525	18.4	3.123	257	41.4	42.4	178.2	0.367	2448	400	480m.fbmy8028_ef5b9b101_jun23_hack.cy9cx_u
57108	0	54	1.3	1274.4	82.4	0.001	0.023	0.022	1.477	178026	18.6	3.117	261	49.7	50.7	178.7	0.361	2448	449	480m.fbmy8028_ef5b9b101_jun23_hack.cy9cx_u_sd8k
57402	0	52	1.4	1273.9	81.7	0.001	0.026	0.022	1.457	174821	18.6	3.046	259	56.5	57.5	178.7	1.360	2497	350	480m.fbmy8028_ef5b9b101_jun23_hack.cy9cx_u_sd32k
57378	0	47	1.2	1286.7	83.7	0.001	0.022	0.022	1.495	168705	18.5	2.940	258	41.7	42.7	178.6	0.832	2497	400	480m.fbmy8028_ef5b9b101_jun23_hack.cy9cx_u_sd128k
q100.1
q100.1: range queries with 100 insert/s per client
Performance metrics for all DBMS, not just the ones listed above. Some are normalized by throughput, others are not. Legend for results is here.
ips	qps	rps	rmbps	wps	wmbps	rpq	rkbpq	wpi	wkbpi	csps	cpups	cspq	cpupq	dbgb1	dbgb2	rss	maxop	p50	p99	tag
2381	85962	6	0.1	75.4	4.4	0.000	0.001	0.032	1.907	358976	32.6	4.176	303	36.6	38.6	179.5	0.018	3596	3229	480m.fbmy8028_ef5b9b101_jun23_hack.cy9cx_u
2381	85978	18	0.2	235.6	14.9	0.000	0.003	0.099	6.394	360749	33.4	4.196	311	37.4	39.4	180.6	0.023	3644	3277	480m.fbmy8028_ef5b9b101_jun23_hack.cy9cx_u_sd8k
2381	85617	62	0.7	109.1	6.5	0.001	0.008	0.046	2.797	358411	32.7	4.186	306	36.0	38.0	179.5	0.021	3580	3197	480m.fbmy8028_ef5b9b101_jun23_hack.cy9cx_u_sd32k
2381	85606	1	0.0	84.4	5.0	0.000	0.000	0.035	2.166	357628	32.7	4.178	306	36.0	38.0	179.7	0.059	3598	3213	480m.fbmy8028_ef5b9b101_jun23_hack.cy9cx_u_sd128k
q500.1
q500.1: range queries with 500 insert/s per client
Performance metrics for all DBMS, not just the ones listed above. Some are normalized by throughput, others are not. Legend for results is here.
ips	qps	rps	rmbps	wps	wmbps	rpq	rkbpq	wpi	wkbpi	csps	cpups	cspq	cpupq	dbgb1	dbgb2	rss	maxop	p50	p99	tag
11907	78737	18	0.3	320.8	19.7	0.000	0.003	0.027	1.691	338754	34.8	4.302	354	36.8	38.2	183.1	0.087	3309	2925	480m.fbmy8028_ef5b9b101_jun23_hack.cy9cx_u
11907	77819	11	0.2	346.2	21.3	0.000	0.002	0.029	1.829	339821	35.2	4.367	362	36.2	37.6	184.0	0.100	3245	2813	480m.fbmy8028_ef5b9b101_jun23_hack.cy9cx_u_sd8k
11911	77630	10	0.2	337.4	20.8	0.000	0.003	0.028	1.792	339047	35.2	4.367	363	36.3	37.8	183.1	0.110	3245	2845	480m.fbmy8028_ef5b9b101_jun23_hack.cy9cx_u_sd32k
11907	78012	10	0.2	330.7	20.5	0.000	0.002	0.028	1.759	338485	35.1	4.339	360	36.4	37.8	183.0	0.089	3261	2861	480m.fbmy8028_ef5b9b101_jun23_hack.cy9cx_u_sd128k
q1000.1
q1000.1: range queries with 1000 insert/s per client
Performance metrics for all DBMS, not just the ones listed above. Some are normalized by throughput, others are not. Legend for results is here.
ips	qps	rps	rmbps	wps	wmbps	rpq	rkbpq	wpi	wkbpi	csps	cpups	cspq	cpupq	dbgb1	dbgb2	rss	maxop	p50	p99	tag
23828	70439	46	0.5	613.4	37.3	0.001	0.007	0.026	1.601	330765	39.1	4.696	444	37.5	38.2	185.5	0.064	2941	2509	480m.fbmy8028_ef5b9b101_jun23_hack.cy9cx_u
23834	70251	16	0.5	819.3	51.7	0.000	0.007	0.034	2.221	329148	39.7	4.685	452	36.7	37.3	185.9	0.077	2941	2478	480m.fbmy8028_ef5b9b101_jun23_hack.cy9cx_u_sd8k
23828	70149	16	0.5	762.3	48.3	0.000	0.008	0.032	2.075	328767	39.5	4.687	450	36.6	37.3	185.7	0.090	2941	2510	480m.fbmy8028_ef5b9b101_jun23_hack.cy9cx_u_sd32k
23834	70540	17	0.4	650.1	39.9	0.000	0.006	0.027	1.714	329510	39.0	4.671	442	36.9	37.5	185.7	0.071	2957	2541	480m.fbmy8028_ef5b9b101_jun23_hack.cy9cx_u_sd128k
l.i0
- l.i0: load without secondary indexes
- Legend for results is here.
- Each entry lists the percentage of responses that fit in that bucket (slower than max time for previous bucket, faster than min time for next bucket).
Insert response time histogram
256us	1ms	4ms	16ms	64ms	256ms	1s	4s	16s	gt	max	tag
0.000	0.000	50.251	49.706	0.001	0.042	0.000	0.000	0.000	0.000	0.110	fbmy8028_ef5b9b101_jun23_hack.cy9cx_u
0.000	0.000	53.087	46.869	0.001	0.042	0.000	0.000	0.000	0.000	0.127	fbmy8028_ef5b9b101_jun23_hack.cy9cx_u_sd8k
0.000	0.000	54.316	45.641	0.001	0.042	0.000	0.000	0.000	0.000	0.178	fbmy8028_ef5b9b101_jun23_hack.cy9cx_u_sd32k
0.000	0.000	53.142	46.815	0.001	0.042	0.000	0.000	0.000	0.000	0.098	fbmy8028_ef5b9b101_jun23_hack.cy9cx_u_sd128k
l.x
- l.x: create secondary indexes
- Legend for results is here.
- Each entry lists the percentage of responses that fit in that bucket (slower than max time for previous bucket, faster than min time for next bucket).
TODO - determine whether there is data for create index response time
l.i1
- l.i1: continue load after secondary indexes created
- Legend for results is here.
- Each entry lists the percentage of responses that fit in that bucket (slower than max time for previous bucket, faster than min time for next bucket).
Insert response time histogram
256us	1ms	4ms	16ms	64ms	256ms	1s	4s	16s	gt	max	tag
0.000	0.000	0.025	10.867	88.636	0.465	0.007	0.000	0.000	0.000	0.367	fbmy8028_ef5b9b101_jun23_hack.cy9cx_u
0.000	0.000	0.022	10.421	89.213	0.337	0.006	0.000	0.000	0.000	0.361	fbmy8028_ef5b9b101_jun23_hack.cy9cx_u_sd8k
0.000	0.000	0.023	11.065	88.524	0.366	0.019	0.001	0.000	0.000	1.360	fbmy8028_ef5b9b101_jun23_hack.cy9cx_u_sd32k
0.000	0.000	0.024	11.048	88.541	0.362	0.025	0.000	0.000	0.000	0.832	fbmy8028_ef5b9b101_jun23_hack.cy9cx_u_sd128k
Delete response time histogram
256us	1ms	4ms	16ms	64ms	256ms	1s	4s	16s	gt	max	tag
0.000	0.000	0.026	10.864	88.638	0.465	0.007	0.000	0.000	0.000	0.664	fbmy8028_ef5b9b101_jun23_hack.cy9cx_u
0.000	0.000	0.022	10.480	89.153	0.338	0.006	0.000	0.000	0.000	0.623	fbmy8028_ef5b9b101_jun23_hack.cy9cx_u_sd8k
0.000	0.000	0.024	11.133	88.456	0.367	0.020	0.001	0.000	0.000	1.360	fbmy8028_ef5b9b101_jun23_hack.cy9cx_u_sd32k
0.000	0.000	0.026	11.195	88.391	0.362	0.025	0.000	0.000	0.000	0.832	fbmy8028_ef5b9b101_jun23_hack.cy9cx_u_sd128k
q100.1
- q100.1: range queries with 100 insert/s per client
- Legend for results is here.
- Each entry lists the percentage of responses that fit in that bucket (slower than max time for previous bucket, faster than min time for next bucket).
Query response time histogram
256us	1ms	4ms	16ms	64ms	256ms	1s	4s	16s	gt	max	tag
46.491	53.507	0.002	nonzero	nonzero	0.000	0.000	0.000	0.000	0.000	0.018	fbmy8028_ef5b9b101_jun23_hack.cy9cx_u
46.646	53.352	0.002	nonzero	nonzero	0.000	0.000	0.000	0.000	0.000	0.023	fbmy8028_ef5b9b101_jun23_hack.cy9cx_u_sd8k
45.643	54.355	0.002	nonzero	nonzero	0.000	0.000	0.000	0.000	0.000	0.021	fbmy8028_ef5b9b101_jun23_hack.cy9cx_u_sd32k
45.523	54.475	0.002	nonzero	nonzero	0.000	0.000	0.000	0.000	0.000	0.059	fbmy8028_ef5b9b101_jun23_hack.cy9cx_u_sd128k
Insert response time histogram
256us	1ms	4ms	16ms	64ms	256ms	1s	4s	16s	gt	max	tag
0.000	0.000	99.656	0.344	0.000	0.000	0.000	0.000	0.000	0.000	0.008	fbmy8028_ef5b9b101_jun23_hack.cy9cx_u
0.000	0.000	99.872	0.125	0.003	0.000	0.000	0.000	0.000	0.000	0.057	fbmy8028_ef5b9b101_jun23_hack.cy9cx_u_sd8k
0.000	0.000	99.900	0.100	0.000	0.000	0.000	0.000	0.000	0.000	0.008	fbmy8028_ef5b9b101_jun23_hack.cy9cx_u_sd32k
0.000	0.000	96.197	3.803	0.000	0.000	0.000	0.000	0.000	0.000	0.010	fbmy8028_ef5b9b101_jun23_hack.cy9cx_u_sd128k
Delete response time histogram
256us	1ms	4ms	16ms	64ms	256ms	1s	4s	16s	gt	max	tag
0.000	0.000	99.815	0.183	0.002	0.000	0.000	0.000	0.000	0.000	0.040	fbmy8028_ef5b9b101_jun23_hack.cy9cx_u
0.000	0.000	99.927	0.065	0.008	0.000	0.000	0.000	0.000	0.000	0.057	fbmy8028_ef5b9b101_jun23_hack.cy9cx_u_sd8k
0.000	0.000	99.950	0.049	0.000	0.001	0.000	0.000	0.000	0.000	0.077	fbmy8028_ef5b9b101_jun23_hack.cy9cx_u_sd32k
0.000	0.000	97.930	2.068	0.002	0.000	0.000	0.000	0.000	0.000	0.030	fbmy8028_ef5b9b101_jun23_hack.cy9cx_u_sd128k
q500.1
- q500.1: range queries with 500 insert/s per client
- Legend for results is here.
- Each entry lists the percentage of responses that fit in that bucket (slower than max time for previous bucket, faster than min time for next bucket).
Query response time histogram
256us	1ms	4ms	16ms	64ms	256ms	1s	4s	16s	gt	max	tag
27.600	72.397	0.003	nonzero	nonzero	0.001	0.000	0.000	0.000	0.000	0.087	fbmy8028_ef5b9b101_jun23_hack.cy9cx_u
25.754	74.241	0.004	nonzero	nonzero	0.001	0.000	0.000	0.000	0.000	0.100	fbmy8028_ef5b9b101_jun23_hack.cy9cx_u_sd8k
25.243	74.753	0.004	nonzero	nonzero	0.001	0.000	0.000	0.000	0.000	0.110	fbmy8028_ef5b9b101_jun23_hack.cy9cx_u_sd32k
26.122	73.873	0.004	nonzero	nonzero	0.001	0.000	0.000	0.000	0.000	0.089	fbmy8028_ef5b9b101_jun23_hack.cy9cx_u_sd128k
Insert response time histogram
256us	1ms	4ms	16ms	64ms	256ms	1s	4s	16s	gt	max	tag
0.000	0.000	21.075	77.467	1.457	0.001	0.000	0.000	0.000	0.000	0.091	fbmy8028_ef5b9b101_jun23_hack.cy9cx_u
0.000	0.000	3.517	28.595	67.881	0.007	0.000	0.000	0.000	0.000	0.116	fbmy8028_ef5b9b101_jun23_hack.cy9cx_u_sd8k
0.000	0.000	4.595	24.617	70.783	0.005	0.000	0.000	0.000	0.000	0.127	fbmy8028_ef5b9b101_jun23_hack.cy9cx_u_sd32k
0.000	0.000	14.464	48.382	37.147	0.007	0.000	0.000	0.000	0.000	0.111	fbmy8028_ef5b9b101_jun23_hack.cy9cx_u_sd128k
Delete response time histogram
256us	1ms	4ms	16ms	64ms	256ms	1s	4s	16s	gt	max	tag
0.000	0.000	22.922	75.626	1.449	0.003	0.000	0.000	0.000	0.000	0.214	fbmy8028_ef5b9b101_jun23_hack.cy9cx_u
0.000	0.000	4.209	28.332	67.451	0.008	0.000	0.000	0.000	0.000	0.116	fbmy8028_ef5b9b101_jun23_hack.cy9cx_u_sd8k
0.000	0.000	5.110	24.467	70.418	0.005	0.000	0.000	0.000	0.000	0.123	fbmy8028_ef5b9b101_jun23_hack.cy9cx_u_sd32k
0.000	0.000	16.120	47.021	36.852	0.007	0.000	0.000	0.000	0.000	0.114	fbmy8028_ef5b9b101_jun23_hack.cy9cx_u_sd128k
q1000.1
- q1000.1: range queries with 1000 insert/s per client
- Legend for results is here.
- Each entry lists the percentage of responses that fit in that bucket (slower than max time for previous bucket, faster than min time for next bucket).
Query response time histogram
256us	1ms	4ms	16ms	64ms	256ms	1s	4s	16s	gt	max	tag
12.392	87.589	0.019	nonzero	nonzero	0.000	0.000	0.000	0.000	0.000	0.064	fbmy8028_ef5b9b101_jun23_hack.cy9cx_u
12.219	87.762	0.019	nonzero	nonzero	nonzero	0.000	0.000	0.000	0.000	0.077	fbmy8028_ef5b9b101_jun23_hack.cy9cx_u_sd8k
12.200	87.780	0.020	nonzero	nonzero	nonzero	0.000	0.000	0.000	0.000	0.090	fbmy8028_ef5b9b101_jun23_hack.cy9cx_u_sd32k
12.651	87.330	0.019	nonzero	nonzero	nonzero	0.000	0.000	0.000	0.000	0.071	fbmy8028_ef5b9b101_jun23_hack.cy9cx_u_sd128k
Insert response time histogram
256us	1ms	4ms	16ms	64ms	256ms	1s	4s	16s	gt	max	tag
0.000	0.000	2.995	11.699	85.306	0.000	0.000	0.000	0.000	0.000	0.056	fbmy8028_ef5b9b101_jun23_hack.cy9cx_u
0.000	0.000	2.890	15.145	81.964	0.001	0.000	0.000	0.000	0.000	0.067	fbmy8028_ef5b9b101_jun23_hack.cy9cx_u_sd8k
0.000	0.000	1.381	11.984	86.632	0.003	0.000	0.000	0.000	0.000	0.127	fbmy8028_ef5b9b101_jun23_hack.cy9cx_u_sd32k
0.000	0.000	2.495	8.755	88.750	0.001	0.000	0.000	0.000	0.000	0.065	fbmy8028_ef5b9b101_jun23_hack.cy9cx_u_sd128k
Delete response time histogram
256us	1ms	4ms	16ms	64ms	256ms	1s	4s	16s	gt	max	tag
0.000	0.000	3.021	11.715	85.263	nonzero	nonzero	0.000	0.000	0.000	0.293	fbmy8028_ef5b9b101_jun23_hack.cy9cx_u
0.000	0.000	2.998	15.057	81.943	0.001	0.000	0.000	0.000	0.000	0.198	fbmy8028_ef5b9b101_jun23_hack.cy9cx_u_sd8k
0.000	0.000	1.396	11.986	86.615	0.003	0.000	0.000	0.000	0.000	0.129	fbmy8028_ef5b9b101_jun23_hack.cy9cx_u_sd32k
0.000	0.000	2.507	8.785	88.707	0.002	nonzero	0.000	0.000	0.000	0.274	fbmy8028_ef5b9b101_jun23_hack.cy9cx_u_sd128k