Introduction
This is a report for the insert benchmark with 4000M docs and 8 client(s). It is generated by scripts (bash, awk, sed) and Tufte might not be impressed. An overview of the insert benchmark is here and a short update is here. Below, by DBMS, I mean DBMS+version.config. An example is my8020.c10b40 where my means MySQL, 8020 is version 8.0.20 and c10b40 is the name for the configuration file.
The test server is a c2-standard-30 from GCP with 15 cores, hyperthreads disabled, 120G RAM, XFS + SW RAID 0 on 4 NVMe devices (1.5TB). The benchmark was run with 8 client and there were 1 or 3 connections per client (1 for queries or inserts without rate limits, 1+1 for rate limited inserts+deletes). There are 8 tables, client per table. It loads 500M rows without secondary indexes, creates secondary indexes, then inserts 50M rows with a delete per insert to avoid growing the table. It then does 3 read+write tests for 7200s each that do queries as fast as possible with 100, 500 and then 1000 inserts/second/client concurrent with the queries and 1000 deletes/second to avoid growing the table. The database is larger than memory.
The tested DBMS are:
- my5651_rel.cy10a_gcp_c2s30 - InnoDB and MySQL 5.6.51, rel build, cy10a_gcp_c2s30 config, compiled with CMAKE_BUILD_TYPE=Release
- my5740_rel_lto.cy10a_gcp_c2s30 - InnoDB and MySQL 5.7.40, rel_lto build, cy10a_gcp_c2s30 config, compiled with CMAKE_BUILD_TYPE=Release
- my8033_rel_lto.cy10a_gcp_c2s30 - InnoDB and MySQL 8.0.33, rel_lto build, cy10a_gcp_c2s30 config, compiled with CMAKE_BUILD_TYPE=Release
- ps8033_rel_lto.cy10aps1_gcp_c2s30 - InnoDB and Percona Server 8.0.33, rel_lto build, cy10aps1_gcp_c2s30 config, compiled with CMAKE_BUILD_TYPE=Release, uses innodb_empty_free_list_algorithm=legacy
- ps8033_rel_lto.cy10aps2_gcp_c2s30 - InnoDB and Percona Server 8.0.33, rel_lto build, cy10aps1_gcp_c2s30 config, compiled with CMAKE_BUILD_TYPE=Release, uses innodb_empty_free_list_algorithm=backoff
Contents
- Summary
- l.i0: load without secondary indexes
- l.x: create secondary indexes
- l.i1: continue load after secondary indexes created
- q100.1: range queries with 100 insert/s per client
- q500.1: range queries with 500 insert/s per client
- q1000.1: range queries with 1000 insert/s per client
Summary
The numbers are inserts/s for l.i0 and l.i1, indexed docs (or rows) /s for l.x and queries/s for q*.2. The values are the average rate over the entire test for inserts (IPS) and queries (QPS). The range of values for IPS and QPS is split into 3 parts: bottom 25%, middle 50%, top 25%. Values in the bottom 25% have a red background, values in the top 25% have a green background and values in the middle have no color. A gray background is used for values that can be ignored because the DBMS did not sustain the target insert rate. Red backgrounds are not used when the minimum value is within 80% of the max value.
| dbms | l.i0 | l.x | l.i1 | q100.1 | q500.1 | q1000.1 |
|---|---|---|---|---|---|---|
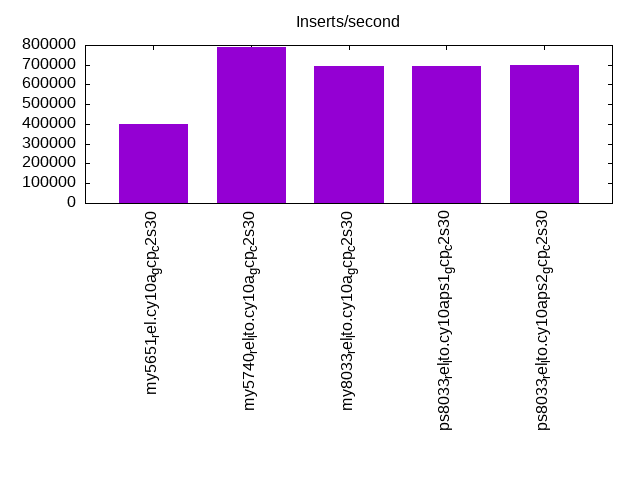
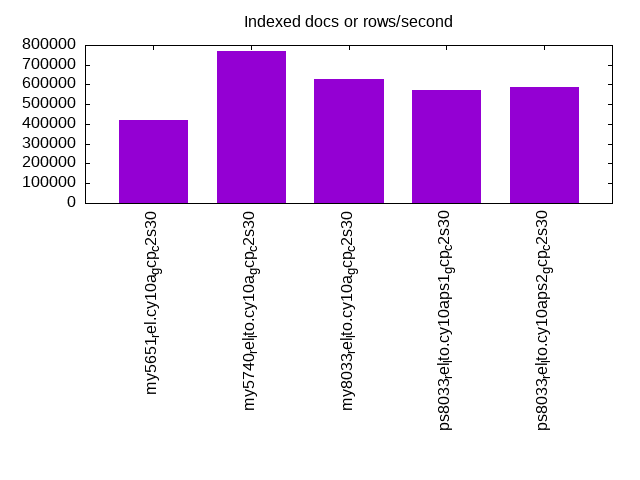
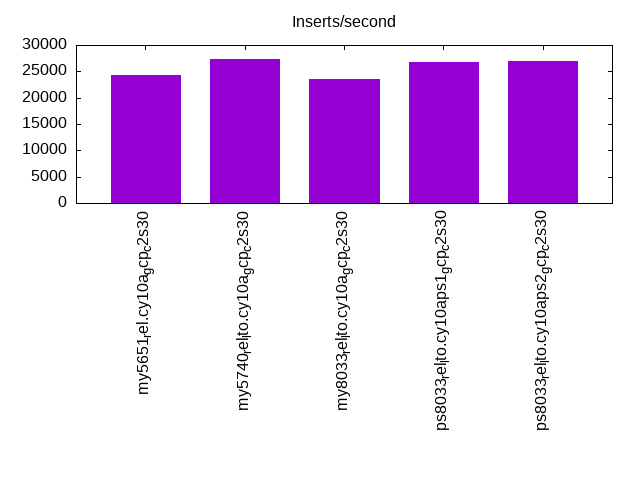
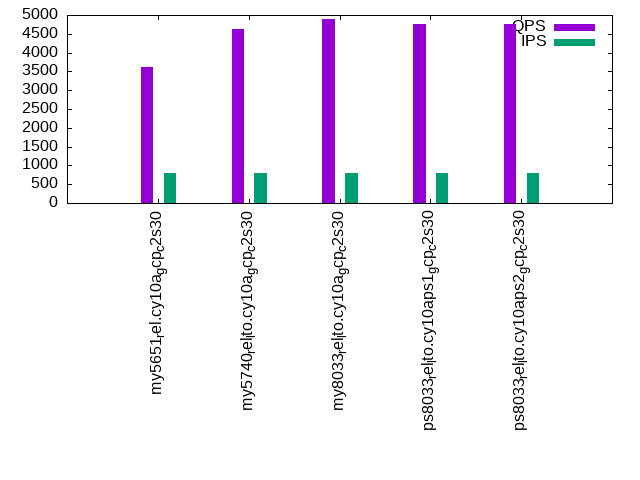
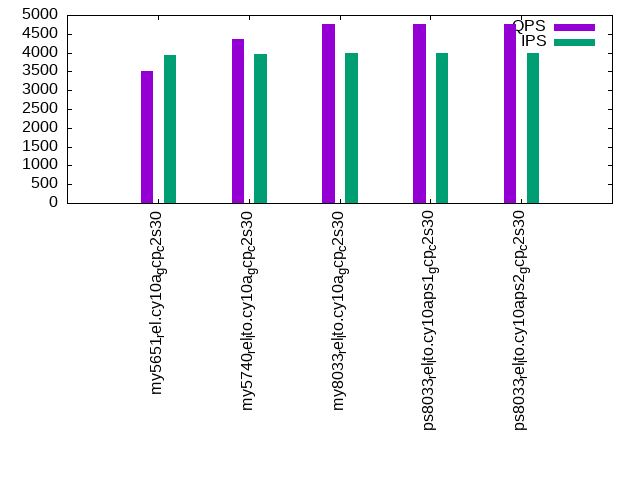
| my5651_rel.cy10a_gcp_c2s30 | 400681 | 420178 | 24337 | 3627 | 3522 | 3216 |
| my5740_rel_lto.cy10a_gcp_c2s30 | 788333 | 767774 | 27412 | 4634 | 4372 | 3903 |
| my8033_rel_lto.cy10a_gcp_c2s30 | 695531 | 629838 | 23567 | 4894 | 4763 | 4154 |
| ps8033_rel_lto.cy10aps1_gcp_c2s30 | 691563 | 573656 | 26679 | 4748 | 4773 | 4341 |
| ps8033_rel_lto.cy10aps2_gcp_c2s30 | 698080 | 585495 | 26938 | 4767 | 4762 | 4326 |
This table has relative throughput, throughput for the DBMS relative to the DBMS in the first line, using the absolute throughput from the previous table. Values less than 0.95 have a yellow background. Values greater than 1.05 have a blue background.
| dbms | l.i0 | l.x | l.i1 | q100.1 | q500.1 | q1000.1 |
|---|---|---|---|---|---|---|
| my5651_rel.cy10a_gcp_c2s30 | 1.00 | 1.00 | 1.00 | 1.00 | 1.00 | 1.00 |
| my5740_rel_lto.cy10a_gcp_c2s30 | 1.97 | 1.83 | 1.13 | 1.28 | 1.24 | 1.21 |
| my8033_rel_lto.cy10a_gcp_c2s30 | 1.74 | 1.50 | 0.97 | 1.35 | 1.35 | 1.29 |
| ps8033_rel_lto.cy10aps1_gcp_c2s30 | 1.73 | 1.37 | 1.10 | 1.31 | 1.36 | 1.35 |
| ps8033_rel_lto.cy10aps2_gcp_c2s30 | 1.74 | 1.39 | 1.11 | 1.31 | 1.35 | 1.35 |
This lists the average rate of inserts/s for the tests that do inserts concurrent with queries. For such tests the query rate is listed in the table above. The read+write tests are setup so that the insert rate should match the target rate every second. Cells that are not at least 95% of the target have a red background to indicate a failure to satisfy the target.
| dbms | q100.1 | q500.1 | q1000.1 |
|---|---|---|---|
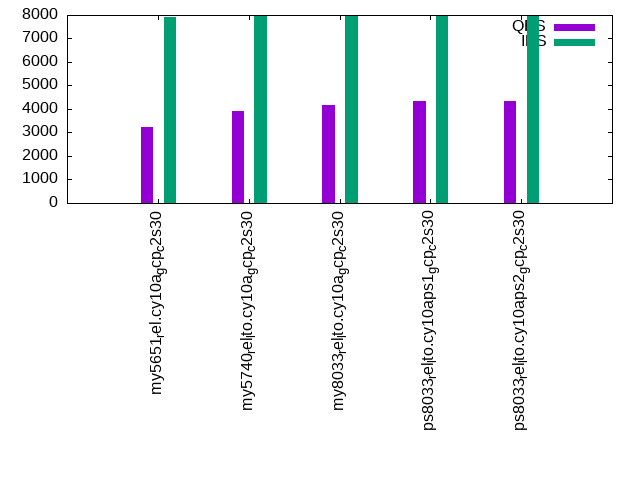
| my5651_rel.cy10a_gcp_c2s30 | 788 | 3933 | 7914 |
| my5740_rel_lto.cy10a_gcp_c2s30 | 788 | 3971 | 7940 |
| my8033_rel_lto.cy10a_gcp_c2s30 | 790 | 3978 | 7952 |
| ps8033_rel_lto.cy10aps1_gcp_c2s30 | 790 | 3977 | 7955 |
| ps8033_rel_lto.cy10aps2_gcp_c2s30 | 790 | 3980 | 7958 |
| target | 800 | 4000 | 8000 |
l.i0
l.i0: load without secondary indexes. Graphs for performance per 1-second interval are here.
Average throughput:
Insert response time histogram: each cell has the percentage of responses that take <= the time in the header and max is the max response time in seconds. For the max column values in the top 25% of the range have a red background and in the bottom 25% of the range have a green background. The red background is not used when the min value is within 80% of the max value.
| dbms | 256us | 1ms | 4ms | 16ms | 64ms | 256ms | 1s | 4s | 16s | gt | max |
|---|---|---|---|---|---|---|---|---|---|---|---|
| my5651_rel.cy10a_gcp_c2s30 | 0.173 | 99.451 | 0.182 | 0.179 | 0.015 | nonzero | 0.279 | ||||
| my5740_rel_lto.cy10a_gcp_c2s30 | 84.133 | 15.791 | 0.045 | 0.016 | 0.014 | 0.001 | 0.521 | ||||
| my8033_rel_lto.cy10a_gcp_c2s30 | 3.143 | 96.757 | 0.068 | 0.017 | 0.014 | 0.001 | 0.508 | ||||
| ps8033_rel_lto.cy10aps1_gcp_c2s30 | 2.456 | 97.446 | 0.065 | 0.020 | 0.013 | 0.001 | 0.316 | ||||
| ps8033_rel_lto.cy10aps2_gcp_c2s30 | 5.084 | 94.818 | 0.067 | 0.016 | 0.014 | nonzero | 0.301 |
Performance metrics for the DBMS listed above. Some are normalized by throughput, others are not. Legend for results is here.
ips	qps	rps	rmbps	wps	wmbps	rpq	rkbpq	wpi	wkbpi	csps	cpups	cspq	cpupq	dbgb1	dbgb2	rss	maxop	p50	p99	tag
400681	0	3144	12.3	1905.4	112.3	0.008	0.031	0.005	0.287	85698	43.1	0.214	16	263.1	391.6	85.7	0.279	50645	39657	4000m.my5651_rel.cy10a_gcp_c2s30
788333	0	0	0.0	3797.6	221.6	0.000	0.000	0.005	0.288	81322	73.9	0.103	14	263.1	391.6	86.8	0.521	101523	77015	4000m.my5740_rel_lto.cy10a_gcp_c2s30
695531	0	0	0.0	3649.7	199.6	0.000	0.000	0.005	0.294	226248	77.1	0.325	17	262.1	390.7	86.9	0.508	89403	68925	4000m.my8033_rel_lto.cy10a_gcp_c2s30
691563	0	0	0.0	3519.0	195.6	0.000	0.000	0.005	0.290	218170	77.0	0.315	17	262.1	390.7	86.9	0.316	88803	67327	4000m.ps8033_rel_lto.cy10aps1_gcp_c2s30
698080	0	0	0.0	3551.5	194.5	0.000	0.000	0.005	0.285	231541	77.2	0.332	17	262.1	390.7	86.9	0.301	89402	69158	4000m.ps8033_rel_lto.cy10aps2_gcp_c2s30
l.x
l.x: create secondary indexes.
Average throughput:
Performance metrics for the DBMS listed above. Some are normalized by throughput, others are not. Legend for results is here.
ips	qps	rps	rmbps	wps	wmbps	rpq	rkbpq	wpi	wkbpi	csps	cpups	cspq	cpupq	dbgb1	dbgb2	rss	maxop	p50	p99	tag
420178	0	2533	362.9	5060.5	528.6	0.006	0.884	0.012	1.288	16211	33.6	0.039	12	542.2	670.7	86.2	0.001	NA	NA	4000m.my5651_rel.cy10a_gcp_c2s30
767774	0	4049	673.2	7727.9	859.5	0.005	0.898	0.010	1.146	27558	30.0	0.036	6	588.3	716.8	87.3	0.032	NA	NA	4000m.my5740_rel_lto.cy10a_gcp_c2s30
629838	0	7938	691.9	13394.9	803.7	0.013	1.125	0.021	1.307	52484	56.4	0.083	13	586.1	714.7	87.0	0.004	NA	NA	4000m.my8033_rel_lto.cy10a_gcp_c2s30
573656	0	7299	614.9	11745.0	738.9	0.013	1.098	0.020	1.319	50149	59.9	0.087	16	586.1	714.7	87.1	0.004	NA	NA	4000m.ps8033_rel_lto.cy10aps1_gcp_c2s30
585495	0	7430	625.0	11861.5	764.5	0.013	1.093	0.020	1.337	50109	61.1	0.086	16	586.1	714.7	87.1	0.014	NA	NA	4000m.ps8033_rel_lto.cy10aps2_gcp_c2s30
l.i1
l.i1: continue load after secondary indexes created. Graphs for performance per 1-second interval are here.
Average throughput:
Insert response time histogram: each cell has the percentage of responses that take <= the time in the header and max is the max response time in seconds. For the max column values in the top 25% of the range have a red background and in the bottom 25% of the range have a green background. The red background is not used when the min value is within 80% of the max value.
| dbms | 256us | 1ms | 4ms | 16ms | 64ms | 256ms | 1s | 4s | 16s | gt | max |
|---|---|---|---|---|---|---|---|---|---|---|---|
| my5651_rel.cy10a_gcp_c2s30 | 0.375 | 71.391 | 25.857 | 2.361 | 0.016 | nonzero | nonzero | nonzero | 16.256 | ||
| my5740_rel_lto.cy10a_gcp_c2s30 | 1.785 | 77.103 | 18.698 | 2.398 | 0.016 | nonzero | nonzero | 14.511 | |||
| my8033_rel_lto.cy10a_gcp_c2s30 | 0.241 | 70.090 | 26.762 | 2.886 | 0.021 | 0.447 | |||||
| ps8033_rel_lto.cy10aps1_gcp_c2s30 | 1.033 | 81.240 | 15.490 | 1.763 | 0.474 | 0.001 | 2.191 | ||||
| ps8033_rel_lto.cy10aps2_gcp_c2s30 | 1.074 | 80.643 | 15.271 | 2.877 | 0.134 | nonzero | 1.055 |
Delete response time histogram: each cell has the percentage of responses that take <= the time in the header and max is the max response time in seconds. For the max column values in the top 25% of the range have a red background and in the bottom 25% of the range have a green background. The red background is not used when the min value is within 80% of the max value.
| dbms | 256us | 1ms | 4ms | 16ms | 64ms | 256ms | 1s | 4s | 16s | gt | max |
|---|---|---|---|---|---|---|---|---|---|---|---|
| my5651_rel.cy10a_gcp_c2s30 | 1.231 | 75.793 | 22.900 | 0.076 | nonzero | nonzero | nonzero | nonzero | 16.185 | ||
| my5740_rel_lto.cy10a_gcp_c2s30 | 7.626 | 79.783 | 12.517 | 0.073 | nonzero | 0.308 | |||||
| my8033_rel_lto.cy10a_gcp_c2s30 | 4.392 | 77.040 | 18.116 | 0.435 | 0.018 | 0.500 | |||||
| ps8033_rel_lto.cy10aps1_gcp_c2s30 | 5.892 | 82.229 | 11.302 | 0.440 | 0.136 | 0.001 | 2.168 | ||||
| ps8033_rel_lto.cy10aps2_gcp_c2s30 | 5.925 | 82.594 | 10.933 | 0.439 | 0.108 | nonzero | 1.090 |
Performance metrics for the DBMS listed above. Some are normalized by throughput, others are not. Legend for results is here.
ips	qps	rps	rmbps	wps	wmbps	rpq	rkbpq	wpi	wkbpi	csps	cpups	cspq	cpupq	dbgb1	dbgb2	rss	maxop	p50	p99	tag
24337	0	13348	199.3	25295.5	618.6	0.548	8.386	1.039	26.030	150939	43.7	6.202	269	837.0	1026.0	85.7	16.256	3646	250	4000m.my5651_rel.cy10a_gcp_c2s30
27412	0	14427	225.4	28126.9	663.0	0.526	8.421	1.026	24.768	140415	51.7	5.122	283	837.1	1026.8	87.3	14.511	4295	300	4000m.my5740_rel_lto.cy10a_gcp_c2s30
23567	0	13333	208.3	25956.0	622.3	0.566	9.052	1.101	27.041	198966	61.5	8.443	391	833.4	1023.8	87.0	0.447	3346	300	4000m.my8033_rel_lto.cy10a_gcp_c2s30
26679	0	13465	210.4	22260.0	662.2	0.505	8.075	0.834	25.418	197501	63.7	7.403	358	834.4	1024.8	87.0	2.191	3746	250	4000m.ps8033_rel_lto.cy10aps1_gcp_c2s30
26938	0	14039	219.4	23156.4	680.7	0.521	8.339	0.860	25.874	207527	64.0	7.704	356	833.9	1024.1	87.0	1.055	3846	300	4000m.ps8033_rel_lto.cy10aps2_gcp_c2s30
q100.1
q100.1: range queries with 100 insert/s per client. Graphs for performance per 1-second interval are here.
Average throughput:
Query response time histogram: each cell has the percentage of responses that take <= the time in the header and max is the max response time in seconds. For max values in the top 25% of the range have a red background and in the bottom 25% of the range have a green background. The red background is not used when the min value is within 80% of the max value.
| dbms | 256us | 1ms | 4ms | 16ms | 64ms | 256ms | 1s | 4s | 16s | gt | max |
|---|---|---|---|---|---|---|---|---|---|---|---|
| my5651_rel.cy10a_gcp_c2s30 | 39.996 | 2.338 | 40.010 | 17.639 | 0.017 | nonzero | nonzero | 0.321 | |||
| my5740_rel_lto.cy10a_gcp_c2s30 | 41.880 | 0.408 | 54.203 | 3.505 | 0.004 | nonzero | 0.225 | ||||
| my8033_rel_lto.cy10a_gcp_c2s30 | 39.742 | 2.947 | 54.991 | 2.293 | 0.027 | 0.001 | 0.222 | ||||
| ps8033_rel_lto.cy10aps1_gcp_c2s30 | 39.746 | 3.012 | 55.933 | 1.278 | 0.018 | 0.013 | nonzero | 0.664 | |||
| ps8033_rel_lto.cy10aps2_gcp_c2s30 | 39.842 | 2.921 | 55.686 | 1.516 | 0.031 | 0.004 | nonzero | 0.282 |
Insert response time histogram: each cell has the percentage of responses that take <= the time in the header and max is the max response time in seconds. For max values in the top 25% of the range have a red background and in the bottom 25% of the range have a green background. The red background is not used when the min value is within 80% of the max value.
| dbms | 256us | 1ms | 4ms | 16ms | 64ms | 256ms | 1s | 4s | 16s | gt | max |
|---|---|---|---|---|---|---|---|---|---|---|---|
| my5651_rel.cy10a_gcp_c2s30 | 31.187 | 67.795 | 1.016 | 0.002 | 0.068 | ||||||
| my5740_rel_lto.cy10a_gcp_c2s30 | 76.779 | 23.086 | 0.120 | 0.016 | 0.182 | ||||||
| my8033_rel_lto.cy10a_gcp_c2s30 | 59.472 | 39.415 | 0.998 | 0.114 | 0.001 | 0.256 | |||||
| ps8033_rel_lto.cy10aps1_gcp_c2s30 | 56.208 | 42.904 | 0.577 | 0.298 | 0.013 | 0.398 | |||||
| ps8033_rel_lto.cy10aps2_gcp_c2s30 | 59.265 | 39.907 | 0.622 | 0.206 | 0.001 | 0.333 |
Delete response time histogram: each cell has the percentage of responses that take <= the time in the header and max is the max response time in seconds. For max values in the top 25% of the range have a red background and in the bottom 25% of the range have a green background. The red background is not used when the min value is within 80% of the max value.
| dbms | 256us | 1ms | 4ms | 16ms | 64ms | 256ms | 1s | 4s | 16s | gt | max |
|---|---|---|---|---|---|---|---|---|---|---|---|
| my5651_rel.cy10a_gcp_c2s30 | 36.118 | 62.796 | 1.086 | 0.059 | |||||||
| my5740_rel_lto.cy10a_gcp_c2s30 | 81.159 | 18.740 | 0.095 | 0.007 | 0.174 | ||||||
| my8033_rel_lto.cy10a_gcp_c2s30 | 62.487 | 36.600 | 0.846 | 0.067 | 0.218 | ||||||
| ps8033_rel_lto.cy10aps1_gcp_c2s30 | 57.280 | 42.003 | 0.472 | 0.227 | 0.017 | 0.663 | |||||
| ps8033_rel_lto.cy10aps2_gcp_c2s30 | 61.497 | 37.831 | 0.535 | 0.137 | 0.001 | 0.332 |
Performance metrics for the DBMS listed above. Some are normalized by throughput, others are not. Legend for results is here.
ips	qps	rps	rmbps	wps	wmbps	rpq	rkbpq	wpi	wkbpi	csps	cpups	cspq	cpupq	dbgb1	dbgb2	rss	maxop	p50	p99	tag
788	3627	26970	421.1	17325.3	368.8	7.436	118.884	22.000	479.500	112965	22.4	31.146	926	837.0	1026.0	85.8	0.321	464	320	4000m.my5651_rel.cy10a_gcp_c2s30
788	4634	34448	538.3	16444.9	457.7	7.434	118.946	20.882	595.108	121784	19.0	26.282	615	837.1	1026.8	87.0	0.225	607	384	4000m.my5740_rel_lto.cy10a_gcp_c2s30
790	4894	35335	552.1	17791.2	450.4	7.220	115.519	22.523	583.824	152165	23.4	31.092	717	833.4	1024.2	87.0	0.222	639	336	4000m.my8033_rel_lto.cy10a_gcp_c2s30
790	4748	33518	523.7	14707.2	410.1	7.059	112.947	18.628	531.929	142904	22.3	30.096	704	834.4	1025.2	87.0	0.664	608	368	4000m.ps8033_rel_lto.cy10aps1_gcp_c2s30
790	4767	33664	526.0	14808.2	412.6	7.062	112.994	18.737	534.622	143889	22.3	30.186	702	833.9	1024.5	87.0	0.282	623	352	4000m.ps8033_rel_lto.cy10aps2_gcp_c2s30
q500.1
q500.1: range queries with 500 insert/s per client. Graphs for performance per 1-second interval are here.
Average throughput:
Query response time histogram: each cell has the percentage of responses that take <= the time in the header and max is the max response time in seconds. For max values in the top 25% of the range have a red background and in the bottom 25% of the range have a green background. The red background is not used when the min value is within 80% of the max value.
| dbms | 256us | 1ms | 4ms | 16ms | 64ms | 256ms | 1s | 4s | 16s | gt | max |
|---|---|---|---|---|---|---|---|---|---|---|---|
| my5651_rel.cy10a_gcp_c2s30 | 40.087 | 1.815 | 38.859 | 19.225 | 0.014 | 0.001 | nonzero | 0.284 | |||
| my5740_rel_lto.cy10a_gcp_c2s30 | 41.635 | 0.528 | 51.518 | 6.316 | 0.003 | 0.001 | 0.203 | ||||
| my8033_rel_lto.cy10a_gcp_c2s30 | 39.497 | 3.146 | 54.046 | 3.309 | 0.001 | nonzero | 0.191 | ||||
| ps8033_rel_lto.cy10aps1_gcp_c2s30 | 39.174 | 3.488 | 56.299 | 1.027 | 0.002 | 0.011 | nonzero | 0.299 | |||
| ps8033_rel_lto.cy10aps2_gcp_c2s30 | 38.998 | 3.628 | 56.176 | 1.185 | 0.013 | 0.001 | nonzero | 0.442 |
Insert response time histogram: each cell has the percentage of responses that take <= the time in the header and max is the max response time in seconds. For max values in the top 25% of the range have a red background and in the bottom 25% of the range have a green background. The red background is not used when the min value is within 80% of the max value.
| dbms | 256us | 1ms | 4ms | 16ms | 64ms | 256ms | 1s | 4s | 16s | gt | max |
|---|---|---|---|---|---|---|---|---|---|---|---|
| my5651_rel.cy10a_gcp_c2s30 | 58.780 | 41.117 | 0.103 | nonzero | 0.147 | ||||||
| my5740_rel_lto.cy10a_gcp_c2s30 | 85.928 | 14.054 | 0.018 | 0.029 | |||||||
| my8033_rel_lto.cy10a_gcp_c2s30 | 79.221 | 20.676 | 0.103 | 0.045 | |||||||
| ps8033_rel_lto.cy10aps1_gcp_c2s30 | 81.485 | 18.414 | 0.079 | 0.022 | nonzero | 0.299 | |||||
| ps8033_rel_lto.cy10aps2_gcp_c2s30 | 79.261 | 20.600 | 0.133 | 0.006 | 0.236 |
Delete response time histogram: each cell has the percentage of responses that take <= the time in the header and max is the max response time in seconds. For max values in the top 25% of the range have a red background and in the bottom 25% of the range have a green background. The red background is not used when the min value is within 80% of the max value.
| dbms | 256us | 1ms | 4ms | 16ms | 64ms | 256ms | 1s | 4s | 16s | gt | max |
|---|---|---|---|---|---|---|---|---|---|---|---|
| my5651_rel.cy10a_gcp_c2s30 | 65.123 | 34.713 | 0.164 | nonzero | 0.131 | ||||||
| my5740_rel_lto.cy10a_gcp_c2s30 | 90.381 | 9.588 | 0.032 | 0.038 | |||||||
| my8033_rel_lto.cy10a_gcp_c2s30 | 86.604 | 13.302 | 0.094 | 0.045 | |||||||
| ps8033_rel_lto.cy10aps1_gcp_c2s30 | 87.345 | 12.569 | 0.063 | 0.023 | 0.170 | ||||||
| ps8033_rel_lto.cy10aps2_gcp_c2s30 | 85.640 | 14.237 | 0.117 | 0.006 | 0.161 |
Performance metrics for the DBMS listed above. Some are normalized by throughput, others are not. Legend for results is here.
ips	qps	rps	rmbps	wps	wmbps	rpq	rkbpq	wpi	wkbpi	csps	cpups	cspq	cpupq	dbgb1	dbgb2	rss	maxop	p50	p99	tag
3933	3522	25914	403.4	19620.4	398.9	7.358	117.273	4.988	103.839	112476	22.0	31.934	937	837.0	1026.0	85.8	0.284	448	400	4000m.my5651_rel.cy10a_gcp_c2s30
3971	4372	32080	501.3	18035.7	478.4	7.338	117.406	4.542	123.365	116616	20.1	26.674	690	837.1	1026.8	86.9	0.203	544	495	4000m.my5740_rel_lto.cy10a_gcp_c2s30
3978	4763	33711	526.7	20020.7	483.9	7.078	113.244	5.033	124.578	153328	25.0	32.192	787	833.4	1026.4	87.0	0.191	591	527	4000m.my8033_rel_lto.cy10a_gcp_c2s30
3977	4773	32987	515.4	16142.0	451.9	6.911	110.570	4.059	116.359	147570	24.6	30.915	773	834.4	1027.5	87.0	0.299	607	511	4000m.ps8033_rel_lto.cy10aps1_gcp_c2s30
3980	4762	32968	515.1	16184.7	452.7	6.924	110.781	4.067	116.495	147856	24.6	31.052	775	833.9	1026.7	87.0	0.442	592	543	4000m.ps8033_rel_lto.cy10aps2_gcp_c2s30
q1000.1
q1000.1: range queries with 1000 insert/s per client. Graphs for performance per 1-second interval are here.
Average throughput:
Query response time histogram: each cell has the percentage of responses that take <= the time in the header and max is the max response time in seconds. For max values in the top 25% of the range have a red background and in the bottom 25% of the range have a green background. The red background is not used when the min value is within 80% of the max value.
| dbms | 256us | 1ms | 4ms | 16ms | 64ms | 256ms | 1s | 4s | 16s | gt | max |
|---|---|---|---|---|---|---|---|---|---|---|---|
| my5651_rel.cy10a_gcp_c2s30 | 39.031 | 1.443 | 35.524 | 23.961 | 0.038 | 0.003 | nonzero | 0.687 | |||
| my5740_rel_lto.cy10a_gcp_c2s30 | 40.209 | 0.694 | 48.057 | 11.016 | 0.022 | 0.002 | nonzero | 0.769 | |||
| my8033_rel_lto.cy10a_gcp_c2s30 | 36.466 | 4.759 | 50.820 | 7.928 | 0.026 | 0.001 | 0.219 | ||||
| ps8033_rel_lto.cy10aps1_gcp_c2s30 | 35.596 | 5.701 | 55.968 | 2.658 | 0.059 | 0.019 | nonzero | 0.320 | |||
| ps8033_rel_lto.cy10aps2_gcp_c2s30 | 35.838 | 5.442 | 55.356 | 3.277 | 0.084 | 0.003 | nonzero | 0.482 |
Insert response time histogram: each cell has the percentage of responses that take <= the time in the header and max is the max response time in seconds. For max values in the top 25% of the range have a red background and in the bottom 25% of the range have a green background. The red background is not used when the min value is within 80% of the max value.
| dbms | 256us | 1ms | 4ms | 16ms | 64ms | 256ms | 1s | 4s | 16s | gt | max |
|---|---|---|---|---|---|---|---|---|---|---|---|
| my5651_rel.cy10a_gcp_c2s30 | 40.542 | 59.084 | 0.360 | 0.014 | 0.200 | ||||||
| my5740_rel_lto.cy10a_gcp_c2s30 | 68.328 | 31.521 | 0.140 | 0.011 | 0.221 | ||||||
| my8033_rel_lto.cy10a_gcp_c2s30 | 53.437 | 45.783 | 0.772 | 0.007 | 0.113 | ||||||
| ps8033_rel_lto.cy10aps1_gcp_c2s30 | 64.237 | 35.328 | 0.368 | 0.067 | 0.237 | ||||||
| ps8033_rel_lto.cy10aps2_gcp_c2s30 | 69.430 | 30.109 | 0.439 | 0.022 | nonzero | 0.348 |
Delete response time histogram: each cell has the percentage of responses that take <= the time in the header and max is the max response time in seconds. For max values in the top 25% of the range have a red background and in the bottom 25% of the range have a green background. The red background is not used when the min value is within 80% of the max value.
| dbms | 256us | 1ms | 4ms | 16ms | 64ms | 256ms | 1s | 4s | 16s | gt | max |
|---|---|---|---|---|---|---|---|---|---|---|---|
| my5651_rel.cy10a_gcp_c2s30 | 47.913 | 51.674 | 0.400 | 0.013 | 0.178 | ||||||
| my5740_rel_lto.cy10a_gcp_c2s30 | 76.621 | 23.216 | 0.154 | 0.009 | 0.183 | ||||||
| my8033_rel_lto.cy10a_gcp_c2s30 | 65.153 | 34.148 | 0.692 | 0.006 | 0.101 | ||||||
| ps8033_rel_lto.cy10aps1_gcp_c2s30 | 74.038 | 25.602 | 0.295 | 0.065 | 0.242 | ||||||
| ps8033_rel_lto.cy10aps2_gcp_c2s30 | 78.736 | 20.867 | 0.378 | 0.019 | 0.210 |
Performance metrics for the DBMS listed above. Some are normalized by throughput, others are not. Legend for results is here.
ips	qps	rps	rmbps	wps	wmbps	rpq	rkbpq	wpi	wkbpi	csps	cpups	cspq	cpupq	dbgb1	dbgb2	rss	maxop	p50	p99	tag
7914	3216	25171	390.2	23349.9	470.1	7.827	124.257	2.950	60.822	122500	25.1	38.092	1171	837.0	1026.0	85.8	0.687	400	336	4000m.my5651_rel.cy10a_gcp_c2s30
7940	3903	29771	465.2	21394.4	526.8	7.628	122.051	2.694	67.934	122255	25.1	31.325	965	837.1	1026.8	86.9	0.769	495	416	4000m.my5740_rel_lto.cy10a_gcp_c2s30
7952	4154	30708	479.8	23364.8	531.5	7.393	118.291	2.938	68.445	158275	31.1	38.106	1123	833.4	1030.9	87.0	0.219	512	448	4000m.my8033_rel_lto.cy10a_gcp_c2s30
7955	4341	31535	492.7	18582.3	523.2	7.264	116.230	2.336	67.351	155618	31.4	35.848	1085	834.4	1031.9	87.0	0.320	544	432	4000m.ps8033_rel_lto.cy10aps1_gcp_c2s30
7958	4326	31539	492.8	18669.9	524.8	7.291	116.650	2.346	67.535	156104	31.0	36.086	1075	833.9	1031.2	87.0	0.482	544	288	4000m.ps8033_rel_lto.cy10aps2_gcp_c2s30
l.i0
l.i0: load without secondary indexes
Performance metrics for all DBMS, not just the ones listed above. Some are normalized by throughput, others are not. Legend for results is here.
ips	qps	rps	rmbps	wps	wmbps	rpq	rkbpq	wpi	wkbpi	csps	cpups	cspq	cpupq	dbgb1	dbgb2	rss	maxop	p50	p99	tag
400681	0	3144	12.3	1905.4	112.3	0.008	0.031	0.005	0.287	85698	43.1	0.214	16	263.1	391.6	85.7	0.279	50645	39657	4000m.my5651_rel.cy10a_gcp_c2s30
788333	0	0	0.0	3797.6	221.6	0.000	0.000	0.005	0.288	81322	73.9	0.103	14	263.1	391.6	86.8	0.521	101523	77015	4000m.my5740_rel_lto.cy10a_gcp_c2s30
695531	0	0	0.0	3649.7	199.6	0.000	0.000	0.005	0.294	226248	77.1	0.325	17	262.1	390.7	86.9	0.508	89403	68925	4000m.my8033_rel_lto.cy10a_gcp_c2s30
691563	0	0	0.0	3519.0	195.6	0.000	0.000	0.005	0.290	218170	77.0	0.315	17	262.1	390.7	86.9	0.316	88803	67327	4000m.ps8033_rel_lto.cy10aps1_gcp_c2s30
698080	0	0	0.0	3551.5	194.5	0.000	0.000	0.005	0.285	231541	77.2	0.332	17	262.1	390.7	86.9	0.301	89402	69158	4000m.ps8033_rel_lto.cy10aps2_gcp_c2s30
l.x
l.x: create secondary indexes
Performance metrics for all DBMS, not just the ones listed above. Some are normalized by throughput, others are not. Legend for results is here.
ips	qps	rps	rmbps	wps	wmbps	rpq	rkbpq	wpi	wkbpi	csps	cpups	cspq	cpupq	dbgb1	dbgb2	rss	maxop	p50	p99	tag
420178	0	2533	362.9	5060.5	528.6	0.006	0.884	0.012	1.288	16211	33.6	0.039	12	542.2	670.7	86.2	0.001	NA	NA	4000m.my5651_rel.cy10a_gcp_c2s30
767774	0	4049	673.2	7727.9	859.5	0.005	0.898	0.010	1.146	27558	30.0	0.036	6	588.3	716.8	87.3	0.032	NA	NA	4000m.my5740_rel_lto.cy10a_gcp_c2s30
629838	0	7938	691.9	13394.9	803.7	0.013	1.125	0.021	1.307	52484	56.4	0.083	13	586.1	714.7	87.0	0.004	NA	NA	4000m.my8033_rel_lto.cy10a_gcp_c2s30
573656	0	7299	614.9	11745.0	738.9	0.013	1.098	0.020	1.319	50149	59.9	0.087	16	586.1	714.7	87.1	0.004	NA	NA	4000m.ps8033_rel_lto.cy10aps1_gcp_c2s30
585495	0	7430	625.0	11861.5	764.5	0.013	1.093	0.020	1.337	50109	61.1	0.086	16	586.1	714.7	87.1	0.014	NA	NA	4000m.ps8033_rel_lto.cy10aps2_gcp_c2s30
l.i1
l.i1: continue load after secondary indexes created
Performance metrics for all DBMS, not just the ones listed above. Some are normalized by throughput, others are not. Legend for results is here.
ips	qps	rps	rmbps	wps	wmbps	rpq	rkbpq	wpi	wkbpi	csps	cpups	cspq	cpupq	dbgb1	dbgb2	rss	maxop	p50	p99	tag
24337	0	13348	199.3	25295.5	618.6	0.548	8.386	1.039	26.030	150939	43.7	6.202	269	837.0	1026.0	85.7	16.256	3646	250	4000m.my5651_rel.cy10a_gcp_c2s30
27412	0	14427	225.4	28126.9	663.0	0.526	8.421	1.026	24.768	140415	51.7	5.122	283	837.1	1026.8	87.3	14.511	4295	300	4000m.my5740_rel_lto.cy10a_gcp_c2s30
23567	0	13333	208.3	25956.0	622.3	0.566	9.052	1.101	27.041	198966	61.5	8.443	391	833.4	1023.8	87.0	0.447	3346	300	4000m.my8033_rel_lto.cy10a_gcp_c2s30
26679	0	13465	210.4	22260.0	662.2	0.505	8.075	0.834	25.418	197501	63.7	7.403	358	834.4	1024.8	87.0	2.191	3746	250	4000m.ps8033_rel_lto.cy10aps1_gcp_c2s30
26938	0	14039	219.4	23156.4	680.7	0.521	8.339	0.860	25.874	207527	64.0	7.704	356	833.9	1024.1	87.0	1.055	3846	300	4000m.ps8033_rel_lto.cy10aps2_gcp_c2s30
q100.1
q100.1: range queries with 100 insert/s per client
Performance metrics for all DBMS, not just the ones listed above. Some are normalized by throughput, others are not. Legend for results is here.
ips	qps	rps	rmbps	wps	wmbps	rpq	rkbpq	wpi	wkbpi	csps	cpups	cspq	cpupq	dbgb1	dbgb2	rss	maxop	p50	p99	tag
788	3627	26970	421.1	17325.3	368.8	7.436	118.884	22.000	479.500	112965	22.4	31.146	926	837.0	1026.0	85.8	0.321	464	320	4000m.my5651_rel.cy10a_gcp_c2s30
788	4634	34448	538.3	16444.9	457.7	7.434	118.946	20.882	595.108	121784	19.0	26.282	615	837.1	1026.8	87.0	0.225	607	384	4000m.my5740_rel_lto.cy10a_gcp_c2s30
790	4894	35335	552.1	17791.2	450.4	7.220	115.519	22.523	583.824	152165	23.4	31.092	717	833.4	1024.2	87.0	0.222	639	336	4000m.my8033_rel_lto.cy10a_gcp_c2s30
790	4748	33518	523.7	14707.2	410.1	7.059	112.947	18.628	531.929	142904	22.3	30.096	704	834.4	1025.2	87.0	0.664	608	368	4000m.ps8033_rel_lto.cy10aps1_gcp_c2s30
790	4767	33664	526.0	14808.2	412.6	7.062	112.994	18.737	534.622	143889	22.3	30.186	702	833.9	1024.5	87.0	0.282	623	352	4000m.ps8033_rel_lto.cy10aps2_gcp_c2s30
q500.1
q500.1: range queries with 500 insert/s per client
Performance metrics for all DBMS, not just the ones listed above. Some are normalized by throughput, others are not. Legend for results is here.
ips	qps	rps	rmbps	wps	wmbps	rpq	rkbpq	wpi	wkbpi	csps	cpups	cspq	cpupq	dbgb1	dbgb2	rss	maxop	p50	p99	tag
3933	3522	25914	403.4	19620.4	398.9	7.358	117.273	4.988	103.839	112476	22.0	31.934	937	837.0	1026.0	85.8	0.284	448	400	4000m.my5651_rel.cy10a_gcp_c2s30
3971	4372	32080	501.3	18035.7	478.4	7.338	117.406	4.542	123.365	116616	20.1	26.674	690	837.1	1026.8	86.9	0.203	544	495	4000m.my5740_rel_lto.cy10a_gcp_c2s30
3978	4763	33711	526.7	20020.7	483.9	7.078	113.244	5.033	124.578	153328	25.0	32.192	787	833.4	1026.4	87.0	0.191	591	527	4000m.my8033_rel_lto.cy10a_gcp_c2s30
3977	4773	32987	515.4	16142.0	451.9	6.911	110.570	4.059	116.359	147570	24.6	30.915	773	834.4	1027.5	87.0	0.299	607	511	4000m.ps8033_rel_lto.cy10aps1_gcp_c2s30
3980	4762	32968	515.1	16184.7	452.7	6.924	110.781	4.067	116.495	147856	24.6	31.052	775	833.9	1026.7	87.0	0.442	592	543	4000m.ps8033_rel_lto.cy10aps2_gcp_c2s30
q1000.1
q1000.1: range queries with 1000 insert/s per client
Performance metrics for all DBMS, not just the ones listed above. Some are normalized by throughput, others are not. Legend for results is here.
ips	qps	rps	rmbps	wps	wmbps	rpq	rkbpq	wpi	wkbpi	csps	cpups	cspq	cpupq	dbgb1	dbgb2	rss	maxop	p50	p99	tag
7914	3216	25171	390.2	23349.9	470.1	7.827	124.257	2.950	60.822	122500	25.1	38.092	1171	837.0	1026.0	85.8	0.687	400	336	4000m.my5651_rel.cy10a_gcp_c2s30
7940	3903	29771	465.2	21394.4	526.8	7.628	122.051	2.694	67.934	122255	25.1	31.325	965	837.1	1026.8	86.9	0.769	495	416	4000m.my5740_rel_lto.cy10a_gcp_c2s30
7952	4154	30708	479.8	23364.8	531.5	7.393	118.291	2.938	68.445	158275	31.1	38.106	1123	833.4	1030.9	87.0	0.219	512	448	4000m.my8033_rel_lto.cy10a_gcp_c2s30
7955	4341	31535	492.7	18582.3	523.2	7.264	116.230	2.336	67.351	155618	31.4	35.848	1085	834.4	1031.9	87.0	0.320	544	432	4000m.ps8033_rel_lto.cy10aps1_gcp_c2s30
7958	4326	31539	492.8	18669.9	524.8	7.291	116.650	2.346	67.535	156104	31.0	36.086	1075	833.9	1031.2	87.0	0.482	544	288	4000m.ps8033_rel_lto.cy10aps2_gcp_c2s30
l.i0
- l.i0: load without secondary indexes
- Legend for results is here.
- Each entry lists the percentage of responses that fit in that bucket (slower than max time for previous bucket, faster than min time for next bucket).
Insert response time histogram
256us	1ms	4ms	16ms	64ms	256ms	1s	4s	16s	gt	max	tag
0.000	0.173	99.451	0.182	0.179	0.015	nonzero	0.000	0.000	0.000	0.279	my5651_rel.cy10a_gcp_c2s30
0.000	84.133	15.791	0.045	0.016	0.014	0.001	0.000	0.000	0.000	0.521	my5740_rel_lto.cy10a_gcp_c2s30
0.000	3.143	96.757	0.068	0.017	0.014	0.001	0.000	0.000	0.000	0.508	my8033_rel_lto.cy10a_gcp_c2s30
0.000	2.456	97.446	0.065	0.020	0.013	0.001	0.000	0.000	0.000	0.316	ps8033_rel_lto.cy10aps1_gcp_c2s30
0.000	5.084	94.818	0.067	0.016	0.014	nonzero	0.000	0.000	0.000	0.301	ps8033_rel_lto.cy10aps2_gcp_c2s30
l.x
- l.x: create secondary indexes
- Legend for results is here.
- Each entry lists the percentage of responses that fit in that bucket (slower than max time for previous bucket, faster than min time for next bucket).
TODO - determine whether there is data for create index response time
l.i1
- l.i1: continue load after secondary indexes created
- Legend for results is here.
- Each entry lists the percentage of responses that fit in that bucket (slower than max time for previous bucket, faster than min time for next bucket).
Insert response time histogram
256us	1ms	4ms	16ms	64ms	256ms	1s	4s	16s	gt	max	tag
0.000	0.000	0.375	71.391	25.857	2.361	0.016	nonzero	nonzero	nonzero	16.256	my5651_rel.cy10a_gcp_c2s30
0.000	0.000	1.785	77.103	18.698	2.398	0.016	nonzero	nonzero	0.000	14.511	my5740_rel_lto.cy10a_gcp_c2s30
0.000	0.000	0.241	70.090	26.762	2.886	0.021	0.000	0.000	0.000	0.447	my8033_rel_lto.cy10a_gcp_c2s30
0.000	0.000	1.033	81.240	15.490	1.763	0.474	0.001	0.000	0.000	2.191	ps8033_rel_lto.cy10aps1_gcp_c2s30
0.000	0.000	1.074	80.643	15.271	2.877	0.134	nonzero	0.000	0.000	1.055	ps8033_rel_lto.cy10aps2_gcp_c2s30
Delete response time histogram
256us	1ms	4ms	16ms	64ms	256ms	1s	4s	16s	gt	max	tag
0.000	0.000	1.231	75.793	22.900	0.076	nonzero	nonzero	nonzero	nonzero	16.185	my5651_rel.cy10a_gcp_c2s30
0.000	0.000	7.626	79.783	12.517	0.073	nonzero	0.000	0.000	0.000	0.308	my5740_rel_lto.cy10a_gcp_c2s30
0.000	0.000	4.392	77.040	18.116	0.435	0.018	0.000	0.000	0.000	0.500	my8033_rel_lto.cy10a_gcp_c2s30
0.000	0.000	5.892	82.229	11.302	0.440	0.136	0.001	0.000	0.000	2.168	ps8033_rel_lto.cy10aps1_gcp_c2s30
0.000	0.000	5.925	82.594	10.933	0.439	0.108	nonzero	0.000	0.000	1.090	ps8033_rel_lto.cy10aps2_gcp_c2s30
q100.1
- q100.1: range queries with 100 insert/s per client
- Legend for results is here.
- Each entry lists the percentage of responses that fit in that bucket (slower than max time for previous bucket, faster than min time for next bucket).
Query response time histogram
256us	1ms	4ms	16ms	64ms	256ms	1s	4s	16s	gt	max	tag
39.996	2.338	40.010	17.639	0.017	nonzero	nonzero	0.000	0.000	0.000	0.321	my5651_rel.cy10a_gcp_c2s30
41.880	0.408	54.203	3.505	0.004	nonzero	0.000	0.000	0.000	0.000	0.225	my5740_rel_lto.cy10a_gcp_c2s30
39.742	2.947	54.991	2.293	0.027	0.001	0.000	0.000	0.000	0.000	0.222	my8033_rel_lto.cy10a_gcp_c2s30
39.746	3.012	55.933	1.278	0.018	0.013	nonzero	0.000	0.000	0.000	0.664	ps8033_rel_lto.cy10aps1_gcp_c2s30
39.842	2.921	55.686	1.516	0.031	0.004	nonzero	0.000	0.000	0.000	0.282	ps8033_rel_lto.cy10aps2_gcp_c2s30
Insert response time histogram
256us	1ms	4ms	16ms	64ms	256ms	1s	4s	16s	gt	max	tag
0.000	0.000	31.187	67.795	1.016	0.002	0.000	0.000	0.000	0.000	0.068	my5651_rel.cy10a_gcp_c2s30
0.000	0.000	76.779	23.086	0.120	0.016	0.000	0.000	0.000	0.000	0.182	my5740_rel_lto.cy10a_gcp_c2s30
0.000	0.000	59.472	39.415	0.998	0.114	0.001	0.000	0.000	0.000	0.256	my8033_rel_lto.cy10a_gcp_c2s30
0.000	0.000	56.208	42.904	0.577	0.298	0.013	0.000	0.000	0.000	0.398	ps8033_rel_lto.cy10aps1_gcp_c2s30
0.000	0.000	59.265	39.907	0.622	0.206	0.001	0.000	0.000	0.000	0.333	ps8033_rel_lto.cy10aps2_gcp_c2s30
Delete response time histogram
256us	1ms	4ms	16ms	64ms	256ms	1s	4s	16s	gt	max	tag
0.000	0.000	36.118	62.796	1.086	0.000	0.000	0.000	0.000	0.000	0.059	my5651_rel.cy10a_gcp_c2s30
0.000	0.000	81.159	18.740	0.095	0.007	0.000	0.000	0.000	0.000	0.174	my5740_rel_lto.cy10a_gcp_c2s30
0.000	0.000	62.487	36.600	0.846	0.067	0.000	0.000	0.000	0.000	0.218	my8033_rel_lto.cy10a_gcp_c2s30
0.000	0.000	57.280	42.003	0.472	0.227	0.017	0.000	0.000	0.000	0.663	ps8033_rel_lto.cy10aps1_gcp_c2s30
0.000	0.000	61.497	37.831	0.535	0.137	0.001	0.000	0.000	0.000	0.332	ps8033_rel_lto.cy10aps2_gcp_c2s30
q500.1
- q500.1: range queries with 500 insert/s per client
- Legend for results is here.
- Each entry lists the percentage of responses that fit in that bucket (slower than max time for previous bucket, faster than min time for next bucket).
Query response time histogram
256us	1ms	4ms	16ms	64ms	256ms	1s	4s	16s	gt	max	tag
40.087	1.815	38.859	19.225	0.014	0.001	nonzero	0.000	0.000	0.000	0.284	my5651_rel.cy10a_gcp_c2s30
41.635	0.528	51.518	6.316	0.003	0.001	0.000	0.000	0.000	0.000	0.203	my5740_rel_lto.cy10a_gcp_c2s30
39.497	3.146	54.046	3.309	0.001	nonzero	0.000	0.000	0.000	0.000	0.191	my8033_rel_lto.cy10a_gcp_c2s30
39.174	3.488	56.299	1.027	0.002	0.011	nonzero	0.000	0.000	0.000	0.299	ps8033_rel_lto.cy10aps1_gcp_c2s30
38.998	3.628	56.176	1.185	0.013	0.001	nonzero	0.000	0.000	0.000	0.442	ps8033_rel_lto.cy10aps2_gcp_c2s30
Insert response time histogram
256us	1ms	4ms	16ms	64ms	256ms	1s	4s	16s	gt	max	tag
0.000	0.000	58.780	41.117	0.103	nonzero	0.000	0.000	0.000	0.000	0.147	my5651_rel.cy10a_gcp_c2s30
0.000	0.000	85.928	14.054	0.018	0.000	0.000	0.000	0.000	0.000	0.029	my5740_rel_lto.cy10a_gcp_c2s30
0.000	0.000	79.221	20.676	0.103	0.000	0.000	0.000	0.000	0.000	0.045	my8033_rel_lto.cy10a_gcp_c2s30
0.000	0.000	81.485	18.414	0.079	0.022	nonzero	0.000	0.000	0.000	0.299	ps8033_rel_lto.cy10aps1_gcp_c2s30
0.000	0.000	79.261	20.600	0.133	0.006	0.000	0.000	0.000	0.000	0.236	ps8033_rel_lto.cy10aps2_gcp_c2s30
Delete response time histogram
256us	1ms	4ms	16ms	64ms	256ms	1s	4s	16s	gt	max	tag
0.000	0.000	65.123	34.713	0.164	nonzero	0.000	0.000	0.000	0.000	0.131	my5651_rel.cy10a_gcp_c2s30
0.000	0.000	90.381	9.588	0.032	0.000	0.000	0.000	0.000	0.000	0.038	my5740_rel_lto.cy10a_gcp_c2s30
0.000	0.000	86.604	13.302	0.094	0.000	0.000	0.000	0.000	0.000	0.045	my8033_rel_lto.cy10a_gcp_c2s30
0.000	0.000	87.345	12.569	0.063	0.023	0.000	0.000	0.000	0.000	0.170	ps8033_rel_lto.cy10aps1_gcp_c2s30
0.000	0.000	85.640	14.237	0.117	0.006	0.000	0.000	0.000	0.000	0.161	ps8033_rel_lto.cy10aps2_gcp_c2s30
q1000.1
- q1000.1: range queries with 1000 insert/s per client
- Legend for results is here.
- Each entry lists the percentage of responses that fit in that bucket (slower than max time for previous bucket, faster than min time for next bucket).
Query response time histogram
256us	1ms	4ms	16ms	64ms	256ms	1s	4s	16s	gt	max	tag
39.031	1.443	35.524	23.961	0.038	0.003	nonzero	0.000	0.000	0.000	0.687	my5651_rel.cy10a_gcp_c2s30
40.209	0.694	48.057	11.016	0.022	0.002	nonzero	0.000	0.000	0.000	0.769	my5740_rel_lto.cy10a_gcp_c2s30
36.466	4.759	50.820	7.928	0.026	0.001	0.000	0.000	0.000	0.000	0.219	my8033_rel_lto.cy10a_gcp_c2s30
35.596	5.701	55.968	2.658	0.059	0.019	nonzero	0.000	0.000	0.000	0.320	ps8033_rel_lto.cy10aps1_gcp_c2s30
35.838	5.442	55.356	3.277	0.084	0.003	nonzero	0.000	0.000	0.000	0.482	ps8033_rel_lto.cy10aps2_gcp_c2s30
Insert response time histogram
256us	1ms	4ms	16ms	64ms	256ms	1s	4s	16s	gt	max	tag
0.000	0.000	40.542	59.084	0.360	0.014	0.000	0.000	0.000	0.000	0.200	my5651_rel.cy10a_gcp_c2s30
0.000	0.000	68.328	31.521	0.140	0.011	0.000	0.000	0.000	0.000	0.221	my5740_rel_lto.cy10a_gcp_c2s30
0.000	0.000	53.437	45.783	0.772	0.007	0.000	0.000	0.000	0.000	0.113	my8033_rel_lto.cy10a_gcp_c2s30
0.000	0.000	64.237	35.328	0.368	0.067	0.000	0.000	0.000	0.000	0.237	ps8033_rel_lto.cy10aps1_gcp_c2s30
0.000	0.000	69.430	30.109	0.439	0.022	nonzero	0.000	0.000	0.000	0.348	ps8033_rel_lto.cy10aps2_gcp_c2s30
Delete response time histogram
256us	1ms	4ms	16ms	64ms	256ms	1s	4s	16s	gt	max	tag
0.000	0.000	47.913	51.674	0.400	0.013	0.000	0.000	0.000	0.000	0.178	my5651_rel.cy10a_gcp_c2s30
0.000	0.000	76.621	23.216	0.154	0.009	0.000	0.000	0.000	0.000	0.183	my5740_rel_lto.cy10a_gcp_c2s30
0.000	0.000	65.153	34.148	0.692	0.006	0.000	0.000	0.000	0.000	0.101	my8033_rel_lto.cy10a_gcp_c2s30
0.000	0.000	74.038	25.602	0.295	0.065	0.000	0.000	0.000	0.000	0.242	ps8033_rel_lto.cy10aps1_gcp_c2s30
0.000	0.000	78.736	20.867	0.378	0.019	0.000	0.000	0.000	0.000	0.210	ps8033_rel_lto.cy10aps2_gcp_c2s30