Introduction
This is a report for the insert benchmark with 800M docs and 1 client(s). It is generated by scripts (bash, awk, sed) and Tufte might not be impressed. An overview of the insert benchmark is here and a short update is here. Below, by DBMS, I mean DBMS+version.config. An example is my8020.c10b40 where my means MySQL, 8020 is version 8.0.20 and c10b40 is the name for the configuration file.
The test server has 8 AMD cores, 16G RAM and an NVMe SSD. It is described here as the Beelink. The benchmark was run with 1 client and there were 1 or 3 connections per client (1 for queries or inserts without rate limits, 1+1 for rate limited inserts+deletes). There is 1 table. It loads 800M rows without secondary indexes, creates secondary indexes, then inserts 10M rows with a delete per insert to avoid growing the table. It then does 3 read+write tests for 3600s each that do queries as fast as possible with 100, 500 and then 1000 inserts/second/client concurrent with the queries and 1000 deletes/second to avoid growing the table. The database is larger than memory.
The tested DBMS are:
- my5740_rel_lto.cy10a_bee - InnoDB and MySQL 5.7.40, rel_lto build, cy10a_bee config, compiled with CMAKE_BUILD_TYPE=Release, base config
- my5740_rel_lto.cy10a1_bee - InnoDB and MySQL 5.7.40, rel_lto build, cy10a1_bee config, compiled with CMAKE_BUILD_TYPE=Release, adds innodb_use_native_aio=off
- my5740_rel_lto.cy10a2_bee - InnoDB and MySQL 5.7.40, rel_lto build, cy10a2_bee config, compiled with CMAKE_BUILD_TYPE=Release, adds innodb_io_capacity=20k, innodb_io_capacity_max=40k
- my5740_rel_lto.cy10a3_bee - InnoDB and MySQL 5.7.40, rel_lto build, cy10a3_bee config, compiled with CMAKE_BUILD_TYPE=Release, adds innodb_io_capacity=20k, innodb_io_capacity_max=40k, innodb_flush_sync=OFF
- my5740_rel_lto.cy10a4_bee - InnoDB and MySQL 5.7.40, rel_lto build, cy10a4_bee config, compiled with CMAKE_BUILD_TYPE=Release, adds innodb_flush_method=fsync
Contents
- Summary
- l.i0: load without secondary indexes
- l.x: create secondary indexes
- l.i1: continue load after secondary indexes created
- q100.1: range queries with 100 insert/s per client
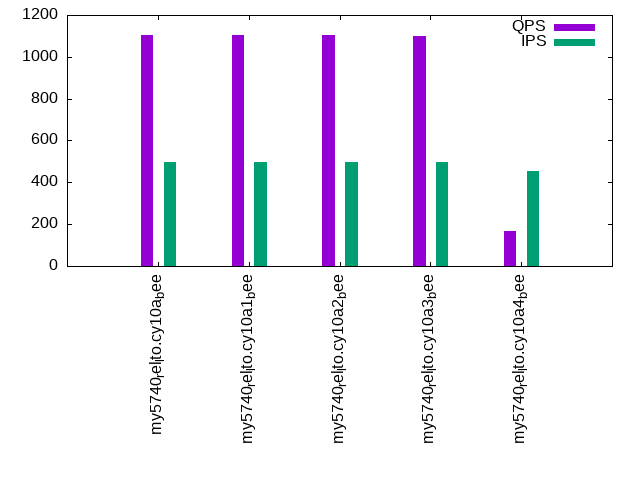
- q500.1: range queries with 500 insert/s per client
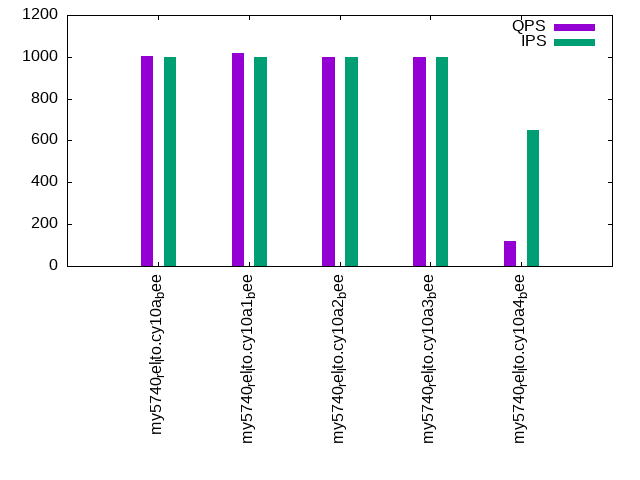
- q1000.1: range queries with 1000 insert/s per client
Summary
The numbers are inserts/s for l.i0 and l.i1, indexed docs (or rows) /s for l.x and queries/s for q100, q500, q1000. The values are the average rate over the entire test for inserts (IPS) and queries (QPS). The range of values for IPS and QPS is split into 3 parts: bottom 25%, middle 50%, top 25%. Values in the bottom 25% have a red background, values in the top 25% have a green background and values in the middle have no color. A gray background is used for values that can be ignored because the DBMS did not sustain the target insert rate. Red backgrounds are not used when the minimum value is within 80% of the max value.
| dbms | l.i0 | l.x | l.i1 | q100.1 | q500.1 | q1000.1 |
|---|---|---|---|---|---|---|
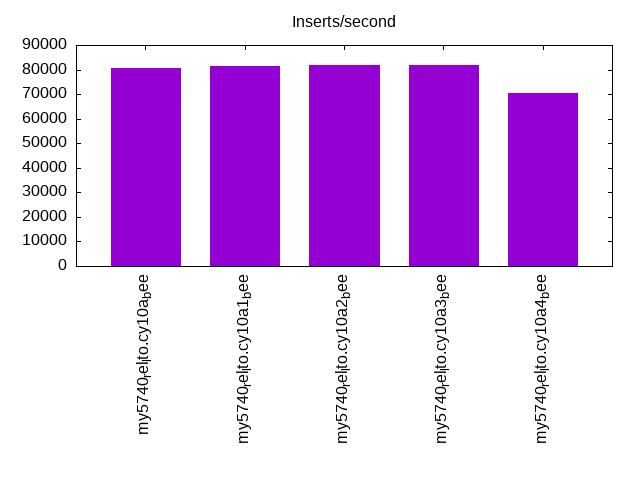
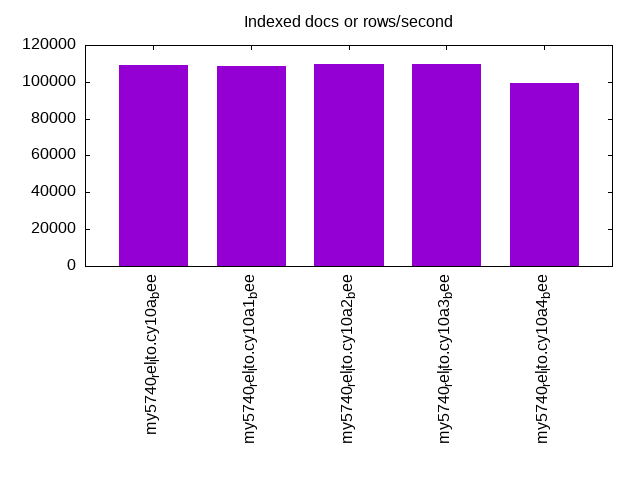
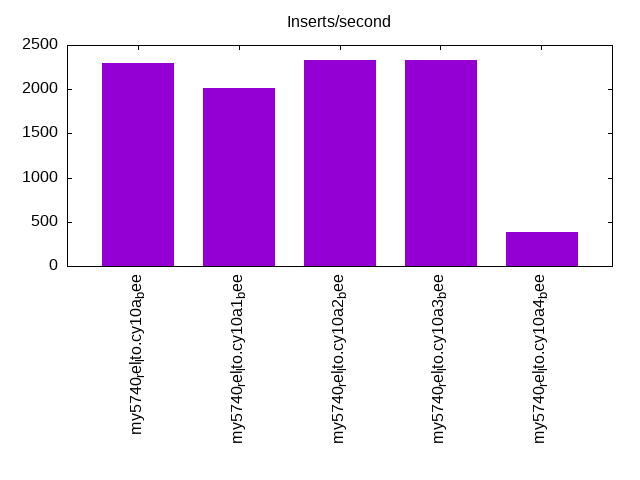
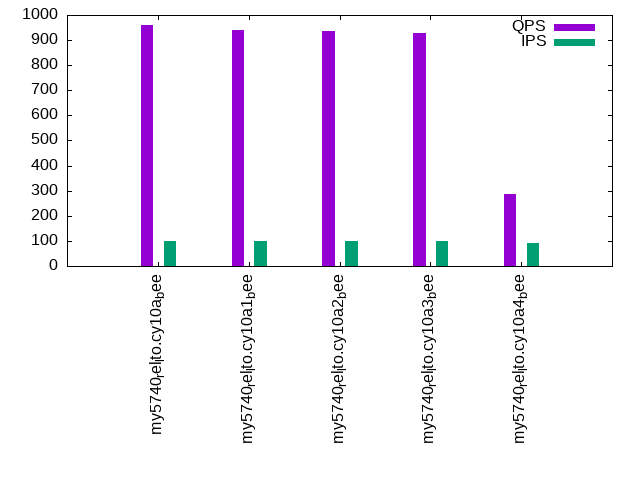
| my5740_rel_lto.cy10a_bee | 80718 | 109154 | 2292 | 960 | 1106 | 1002 |
| my5740_rel_lto.cy10a1_bee | 81641 | 108768 | 2017 | 939 | 1106 | 1017 |
| my5740_rel_lto.cy10a2_bee | 81883 | 109648 | 2327 | 935 | 1102 | 1001 |
| my5740_rel_lto.cy10a3_bee | 82001 | 109874 | 2326 | 930 | 1101 | 1001 |
| my5740_rel_lto.cy10a4_bee | 70584 | 99502 | 380 | 288 | 166 | 119 |
This table has relative throughput, throughput for the DBMS relative to the DBMS in the first line, using the absolute throughput from the previous table. Values less than 0.95 have a yellow background. Values greater than 1.05 have a blue background.
| dbms | l.i0 | l.x | l.i1 | q100.1 | q500.1 | q1000.1 |
|---|---|---|---|---|---|---|
| my5740_rel_lto.cy10a_bee | 1.00 | 1.00 | 1.00 | 1.00 | 1.00 | 1.00 |
| my5740_rel_lto.cy10a1_bee | 1.01 | 1.00 | 0.88 | 0.98 | 1.00 | 1.01 |
| my5740_rel_lto.cy10a2_bee | 1.01 | 1.00 | 1.02 | 0.97 | 1.00 | 1.00 |
| my5740_rel_lto.cy10a3_bee | 1.02 | 1.01 | 1.01 | 0.97 | 1.00 | 1.00 |
| my5740_rel_lto.cy10a4_bee | 0.87 | 0.91 | 0.17 | 0.30 | 0.15 | 0.12 |
This lists the average rate of inserts/s for the tests that do inserts concurrent with queries. For such tests the query rate is listed in the table above. The read+write tests are setup so that the insert rate should match the target rate every second. Cells that are not at least 95% of the target have a red background to indicate a failure to satisfy the target.
| dbms | q100.1 | q500.1 | q1000.1 |
|---|---|---|---|
| my5740_rel_lto.cy10a_bee | 100 | 499 | 998 |
| my5740_rel_lto.cy10a1_bee | 100 | 498 | 998 |
| my5740_rel_lto.cy10a2_bee | 100 | 499 | 998 |
| my5740_rel_lto.cy10a3_bee | 100 | 499 | 998 |
| my5740_rel_lto.cy10a4_bee | 92 | 456 | 652 |
| target | 100 | 500 | 1000 |
l.i0
l.i0: load without secondary indexes. Graphs for performance per 1-second interval are here.
Average throughput:
Insert response time histogram: each cell has the percentage of responses that take <= the time in the header and max is the max response time in seconds. For the max column values in the top 25% of the range have a red background and in the bottom 25% of the range have a green background. The red background is not used when the min value is within 80% of the max value.
| dbms | 256us | 1ms | 4ms | 16ms | 64ms | 256ms | 1s | 4s | 16s | gt | max |
|---|---|---|---|---|---|---|---|---|---|---|---|
| my5740_rel_lto.cy10a_bee | 0.333 | 99.336 | 0.193 | 0.136 | 0.002 | 0.142 | |||||
| my5740_rel_lto.cy10a1_bee | 0.565 | 99.103 | 0.197 | 0.132 | 0.002 | 0.124 | |||||
| my5740_rel_lto.cy10a2_bee | 0.719 | 98.953 | 0.189 | 0.137 | 0.002 | 0.128 | |||||
| my5740_rel_lto.cy10a3_bee | 0.745 | 98.925 | 0.192 | 0.136 | 0.002 | 0.128 | |||||
| my5740_rel_lto.cy10a4_bee | 0.354 | 97.452 | 2.040 | 0.152 | 0.002 | 0.113 |
Performance metrics for the DBMS listed above. Some are normalized by throughput, others are not. Legend for results is here.
ips	qps	rps	rmbps	wps	wmbps	rpq	rkbpq	wpi	wkbpi	csps	cpups	cspq	cpupq	dbgb1	dbgb2	rss	maxop	p50	p99	tag
80718	0	0	0.0	406.9	29.0	0.000	0.000	0.005	0.368	9027	21.4	0.112	21	52.6	93.1	10.9	0.142	81010	71080	800m.my5740_rel_lto.cy10a_bee
81641	0	0	0.0	411.1	29.3	0.000	0.000	0.005	0.368	8832	21.5	0.108	21	52.6	93.1	10.9	0.124	81808	72220	800m.my5740_rel_lto.cy10a1_bee
81883	0	0	0.0	412.7	29.4	0.000	0.000	0.005	0.368	9123	21.3	0.111	21	52.6	93.1	10.9	0.128	82211	71887	800m.my5740_rel_lto.cy10a2_bee
82001	0	0	0.0	412.9	29.4	0.000	0.000	0.005	0.367	9145	21.3	0.112	21	52.6	93.1	10.9	0.128	82303	72337	800m.my5740_rel_lto.cy10a3_bee
70584	0	0	0.0	128.3	25.4	0.000	0.000	0.002	0.368	7813	19.9	0.111	23	52.6	93.1	10.9	0.113	70918	62010	800m.my5740_rel_lto.cy10a4_bee
l.x
l.x: create secondary indexes.
Average throughput:
Performance metrics for the DBMS listed above. Some are normalized by throughput, others are not. Legend for results is here.
ips	qps	rps	rmbps	wps	wmbps	rpq	rkbpq	wpi	wkbpi	csps	cpups	cspq	cpupq	dbgb1	dbgb2	rss	maxop	p50	p99	tag
109154	0	654	102.5	905.8	122.8	0.006	0.962	0.008	1.152	6214	12.1	0.057	9	117.7	158.2	10.2	0.013	NA	NA	800m.my5740_rel_lto.cy10a_bee
108768	0	654	102.2	916.6	122.6	0.006	0.962	0.008	1.154	12043	12.6	0.111	9	117.7	158.2	10.2	0.015	NA	NA	800m.my5740_rel_lto.cy10a1_bee
109648	0	658	103.0	875.9	123.2	0.006	0.962	0.008	1.151	6176	12.1	0.056	9	117.7	158.2	10.2	0.014	NA	NA	800m.my5740_rel_lto.cy10a2_bee
109874	0	668	103.2	899.7	123.7	0.006	0.962	0.008	1.153	6208	12.0	0.057	9	117.7	158.2	10.2	0.010	NA	NA	800m.my5740_rel_lto.cy10a3_bee
99502	0	296	94.2	319.3	112.2	0.003	0.969	0.003	1.154	3320	11.4	0.033	9	117.7	158.2	10.3	0.013	NA	NA	800m.my5740_rel_lto.cy10a4_bee
l.i1
l.i1: continue load after secondary indexes created. Graphs for performance per 1-second interval are here.
Average throughput:
Insert response time histogram: each cell has the percentage of responses that take <= the time in the header and max is the max response time in seconds. For the max column values in the top 25% of the range have a red background and in the bottom 25% of the range have a green background. The red background is not used when the min value is within 80% of the max value.
| dbms | 256us | 1ms | 4ms | 16ms | 64ms | 256ms | 1s | 4s | 16s | gt | max |
|---|---|---|---|---|---|---|---|---|---|---|---|
| my5740_rel_lto.cy10a_bee | 52.790 | 43.975 | 3.234 | 0.001 | 0.363 | ||||||
| my5740_rel_lto.cy10a1_bee | 46.414 | 48.304 | 5.280 | 0.002 | 0.398 | ||||||
| my5740_rel_lto.cy10a2_bee | 53.372 | 43.201 | 3.426 | 0.001 | 0.425 | ||||||
| my5740_rel_lto.cy10a3_bee | 53.485 | 43.096 | 3.418 | 0.001 | 0.377 | ||||||
| my5740_rel_lto.cy10a4_bee | 5.930 | 58.778 | 21.895 | 11.601 | 1.796 | 2.561 |
Delete response time histogram: each cell has the percentage of responses that take <= the time in the header and max is the max response time in seconds. For the max column values in the top 25% of the range have a red background and in the bottom 25% of the range have a green background. The red background is not used when the min value is within 80% of the max value.
| dbms | 256us | 1ms | 4ms | 16ms | 64ms | 256ms | 1s | 4s | 16s | gt | max |
|---|---|---|---|---|---|---|---|---|---|---|---|
| my5740_rel_lto.cy10a_bee | 62.198 | 37.276 | 0.522 | 0.004 | 0.090 | ||||||
| my5740_rel_lto.cy10a1_bee | 69.164 | 30.377 | 0.443 | 0.017 | 0.149 | ||||||
| my5740_rel_lto.cy10a2_bee | 72.706 | 26.787 | 0.500 | 0.007 | 0.123 | ||||||
| my5740_rel_lto.cy10a3_bee | 71.933 | 27.556 | 0.504 | 0.006 | 0.100 | ||||||
| my5740_rel_lto.cy10a4_bee | 50.209 | 38.300 | 9.720 | 1.743 | 0.019 | 0.009 | 2.276 |
Performance metrics for the DBMS listed above. Some are normalized by throughput, others are not. Legend for results is here.
ips	qps	rps	rmbps	wps	wmbps	rpq	rkbpq	wpi	wkbpi	csps	cpups	cspq	cpupq	dbgb1	dbgb2	rss	maxop	p50	p99	tag
2292	0	8363	130.7	11475.6	365.4	3.649	58.383	5.007	163.234	56299	24.6	24.563	859	154.7	196.8	10.7	0.363	2297	699	800m.my5740_rel_lto.cy10a_bee
2017	0	7280	113.8	9996.7	318.7	3.610	57.753	4.956	161.796	53091	21.5	26.323	853	155.0	197.2	10.7	0.398	1998	549	800m.my5740_rel_lto.cy10a1_bee
2327	0	8748	136.7	11897.4	378.0	3.759	60.146	5.112	166.333	57771	24.8	24.824	853	155.3	197.2	10.7	0.425	2247	650	800m.my5740_rel_lto.cy10a2_bee
2326	0	8770	137.0	11914.5	378.6	3.770	60.323	5.122	166.667	57875	24.7	24.881	849	155.3	197.1	10.7	0.377	2198	650	800m.my5740_rel_lto.cy10a3_bee
380	0	1583	29.5	2073.8	67.0	4.160	79.520	5.452	180.272	13805	6.1	36.291	1283	154.1	195.8	10.2	2.561	250	0	800m.my5740_rel_lto.cy10a4_bee
q100.1
q100.1: range queries with 100 insert/s per client. Graphs for performance per 1-second interval are here.
Average throughput:
Query response time histogram: each cell has the percentage of responses that take <= the time in the header and max is the max response time in seconds. For max values in the top 25% of the range have a red background and in the bottom 25% of the range have a green background. The red background is not used when the min value is within 80% of the max value.
| dbms | 256us | 1ms | 4ms | 16ms | 64ms | 256ms | 1s | 4s | 16s | gt | max |
|---|---|---|---|---|---|---|---|---|---|---|---|
| my5740_rel_lto.cy10a_bee | 14.773 | 29.358 | 54.023 | 1.836 | 0.010 | nonzero | 0.339 | ||||
| my5740_rel_lto.cy10a1_bee | 11.115 | 31.917 | 55.036 | 1.902 | 0.029 | 0.001 | nonzero | 0.654 | |||
| my5740_rel_lto.cy10a2_bee | 12.099 | 31.145 | 54.718 | 2.028 | 0.010 | 0.044 | |||||
| my5740_rel_lto.cy10a3_bee | 11.980 | 31.179 | 54.782 | 2.048 | 0.010 | nonzero | 0.073 | ||||
| my5740_rel_lto.cy10a4_bee | 7.388 | 32.755 | 51.670 | 5.887 | 1.541 | 0.729 | 0.030 | 0.564 |
Insert response time histogram: each cell has the percentage of responses that take <= the time in the header and max is the max response time in seconds. For max values in the top 25% of the range have a red background and in the bottom 25% of the range have a green background. The red background is not used when the min value is within 80% of the max value.
| dbms | 256us | 1ms | 4ms | 16ms | 64ms | 256ms | 1s | 4s | 16s | gt | max |
|---|---|---|---|---|---|---|---|---|---|---|---|
| my5740_rel_lto.cy10a_bee | 1.833 | 90.444 | 7.708 | 0.014 | 0.345 | ||||||
| my5740_rel_lto.cy10a1_bee | 12.278 | 63.694 | 24.014 | 0.014 | 0.664 | ||||||
| my5740_rel_lto.cy10a2_bee | 11.806 | 79.653 | 8.542 | 0.127 | |||||||
| my5740_rel_lto.cy10a3_bee | 8.583 | 82.583 | 8.833 | 0.136 | |||||||
| my5740_rel_lto.cy10a4_bee | 5.014 | 55.819 | 28.444 | 10.653 | 0.069 | 1.476 |
Delete response time histogram: each cell has the percentage of responses that take <= the time in the header and max is the max response time in seconds. For max values in the top 25% of the range have a red background and in the bottom 25% of the range have a green background. The red background is not used when the min value is within 80% of the max value.
| dbms | 256us | 1ms | 4ms | 16ms | 64ms | 256ms | 1s | 4s | 16s | gt | max |
|---|---|---|---|---|---|---|---|---|---|---|---|
| my5740_rel_lto.cy10a_bee | 55.681 | 44.139 | 0.167 | 0.014 | 0.320 | ||||||
| my5740_rel_lto.cy10a1_bee | 48.792 | 50.681 | 0.500 | 0.014 | 0.014 | 0.625 | |||||
| my5740_rel_lto.cy10a2_bee | 57.514 | 42.333 | 0.153 | 0.035 | |||||||
| my5740_rel_lto.cy10a3_bee | 54.472 | 45.278 | 0.250 | 0.033 | |||||||
| my5740_rel_lto.cy10a4_bee | 6.583 | 70.431 | 18.236 | 4.667 | 0.083 | 0.393 |
Performance metrics for the DBMS listed above. Some are normalized by throughput, others are not. Legend for results is here.
ips	qps	rps	rmbps	wps	wmbps	rpq	rkbpq	wpi	wkbpi	csps	cpups	cspq	cpupq	dbgb1	dbgb2	rss	maxop	p50	p99	tag
100	960	11125	173.8	8111.3	211.9	11.590	185.434	81.276	2173.873	51133	15.2	53.269	1267	154.7	196.8	10.7	0.339	927	799	800m.my5740_rel_lto.cy10a_bee
100	939	11293	176.4	8013.5	216.5	12.030	192.480	80.538	2227.963	56213	16.3	59.884	1389	155.0	197.2	10.7	0.654	959	703	800m.my5740_rel_lto.cy10a1_bee
100	935	11686	182.6	8705.6	230.5	12.501	200.018	87.318	2367.437	53976	15.9	57.740	1361	155.3	197.2	10.7	0.044	927	767	800m.my5740_rel_lto.cy10a2_bee
100	930	11669	182.3	8768.3	230.9	12.541	200.652	87.947	2371.411	54102	15.9	58.143	1367	155.3	197.1	10.7	0.073	927	767	800m.my5740_rel_lto.cy10a3_bee
92	288	2918	73.0	2154.8	65.1	10.144	259.864	23.473	726.724	20134	8.0	69.984	2225	154.1	195.8	8.3	0.564	320	48	800m.my5740_rel_lto.cy10a4_bee
q500.1
q500.1: range queries with 500 insert/s per client. Graphs for performance per 1-second interval are here.
Average throughput:
Query response time histogram: each cell has the percentage of responses that take <= the time in the header and max is the max response time in seconds. For max values in the top 25% of the range have a red background and in the bottom 25% of the range have a green background. The red background is not used when the min value is within 80% of the max value.
| dbms | 256us | 1ms | 4ms | 16ms | 64ms | 256ms | 1s | 4s | 16s | gt | max |
|---|---|---|---|---|---|---|---|---|---|---|---|
| my5740_rel_lto.cy10a_bee | 13.448 | 32.971 | 52.766 | 0.811 | 0.004 | 0.043 | |||||
| my5740_rel_lto.cy10a1_bee | 13.729 | 32.547 | 52.861 | 0.858 | 0.005 | 0.041 | |||||
| my5740_rel_lto.cy10a2_bee | 13.160 | 33.144 | 52.876 | 0.816 | 0.004 | 0.047 | |||||
| my5740_rel_lto.cy10a3_bee | 12.020 | 34.213 | 52.941 | 0.822 | 0.004 | 0.045 | |||||
| my5740_rel_lto.cy10a4_bee | 5.874 | 31.905 | 50.600 | 6.014 | 3.570 | 1.820 | 0.218 | 0.642 |
Insert response time histogram: each cell has the percentage of responses that take <= the time in the header and max is the max response time in seconds. For max values in the top 25% of the range have a red background and in the bottom 25% of the range have a green background. The red background is not used when the min value is within 80% of the max value.
| dbms | 256us | 1ms | 4ms | 16ms | 64ms | 256ms | 1s | 4s | 16s | gt | max |
|---|---|---|---|---|---|---|---|---|---|---|---|
| my5740_rel_lto.cy10a_bee | 78.458 | 21.450 | 0.092 | 0.092 | |||||||
| my5740_rel_lto.cy10a1_bee | 55.308 | 43.514 | 1.178 | 0.137 | |||||||
| my5740_rel_lto.cy10a2_bee | 76.836 | 23.058 | 0.106 | 0.092 | |||||||
| my5740_rel_lto.cy10a3_bee | 76.039 | 23.817 | 0.144 | 0.085 | |||||||
| my5740_rel_lto.cy10a4_bee | 9.819 | 56.986 | 24.606 | 8.372 | 0.217 | 2.409 |
Delete response time histogram: each cell has the percentage of responses that take <= the time in the header and max is the max response time in seconds. For max values in the top 25% of the range have a red background and in the bottom 25% of the range have a green background. The red background is not used when the min value is within 80% of the max value.
| dbms | 256us | 1ms | 4ms | 16ms | 64ms | 256ms | 1s | 4s | 16s | gt | max |
|---|---|---|---|---|---|---|---|---|---|---|---|
| my5740_rel_lto.cy10a_bee | 94.283 | 5.708 | 0.008 | 0.056 | |||||||
| my5740_rel_lto.cy10a1_bee | 94.758 | 5.211 | 0.031 | 0.032 | |||||||
| my5740_rel_lto.cy10a2_bee | 93.444 | 6.544 | 0.011 | 0.033 | |||||||
| my5740_rel_lto.cy10a3_bee | 93.411 | 6.581 | 0.008 | 0.054 | |||||||
| my5740_rel_lto.cy10a4_bee | 29.547 | 48.706 | 16.633 | 5.031 | 0.067 | 0.017 | 2.078 |
Performance metrics for the DBMS listed above. Some are normalized by throughput, others are not. Legend for results is here.
ips	qps	rps	rmbps	wps	wmbps	rpq	rkbpq	wpi	wkbpi	csps	cpups	cspq	cpupq	dbgb1	dbgb2	rss	maxop	p50	p99	tag
499	1106	9272	144.9	4201.9	128.9	8.386	134.178	8.416	264.278	35712	11.7	32.301	847	154.7	196.8	10.7	0.043	1103	1036	800m.my5740_rel_lto.cy10a_bee
498	1106	9356	146.2	4342.2	133.3	8.455	135.284	8.716	274.020	39079	12.2	35.318	882	155.0	197.2	10.7	0.041	1103	959	800m.my5740_rel_lto.cy10a1_bee
499	1102	9309	145.5	4253.6	130.3	8.446	135.134	8.531	267.654	35579	11.8	32.280	856	155.3	197.2	10.7	0.047	1103	1023	800m.my5740_rel_lto.cy10a2_bee
499	1101	9297	145.3	4262.0	130.5	8.445	135.116	8.545	267.816	35578	11.9	32.318	865	155.3	197.1	10.7	0.045	1103	1023	800m.my5740_rel_lto.cy10a3_bee
456	166	2155	50.6	2010.4	58.8	12.975	312.195	4.408	131.999	16394	7.4	98.702	3564	154.1	195.8	9.2	0.642	176	16	800m.my5740_rel_lto.cy10a4_bee
q1000.1
q1000.1: range queries with 1000 insert/s per client. Graphs for performance per 1-second interval are here.
Average throughput:
Query response time histogram: each cell has the percentage of responses that take <= the time in the header and max is the max response time in seconds. For max values in the top 25% of the range have a red background and in the bottom 25% of the range have a green background. The red background is not used when the min value is within 80% of the max value.
| dbms | 256us | 1ms | 4ms | 16ms | 64ms | 256ms | 1s | 4s | 16s | gt | max |
|---|---|---|---|---|---|---|---|---|---|---|---|
| my5740_rel_lto.cy10a_bee | 12.627 | 30.859 | 54.970 | 1.535 | 0.009 | 0.049 | |||||
| my5740_rel_lto.cy10a1_bee | 13.526 | 30.037 | 54.876 | 1.551 | 0.009 | 0.047 | |||||
| my5740_rel_lto.cy10a2_bee | 11.723 | 31.813 | 54.895 | 1.561 | 0.009 | 0.052 | |||||
| my5740_rel_lto.cy10a3_bee | 11.491 | 31.969 | 54.965 | 1.565 | 0.009 | 0.045 | |||||
| my5740_rel_lto.cy10a4_bee | 5.055 | 32.130 | 49.321 | 6.507 | 3.990 | 2.531 | 0.466 | nonzero | 1.044 |
Insert response time histogram: each cell has the percentage of responses that take <= the time in the header and max is the max response time in seconds. For max values in the top 25% of the range have a red background and in the bottom 25% of the range have a green background. The red background is not used when the min value is within 80% of the max value.
| dbms | 256us | 1ms | 4ms | 16ms | 64ms | 256ms | 1s | 4s | 16s | gt | max |
|---|---|---|---|---|---|---|---|---|---|---|---|
| my5740_rel_lto.cy10a_bee | 68.386 | 31.526 | 0.088 | 0.096 | |||||||
| my5740_rel_lto.cy10a1_bee | 80.539 | 18.993 | 0.468 | 0.137 | |||||||
| my5740_rel_lto.cy10a2_bee | 67.435 | 32.476 | 0.089 | 0.114 | |||||||
| my5740_rel_lto.cy10a3_bee | 66.625 | 33.282 | 0.093 | 0.084 | |||||||
| my5740_rel_lto.cy10a4_bee | 36.272 | 38.972 | 17.807 | 6.853 | 0.096 | 3.102 |
Delete response time histogram: each cell has the percentage of responses that take <= the time in the header and max is the max response time in seconds. For max values in the top 25% of the range have a red background and in the bottom 25% of the range have a green background. The red background is not used when the min value is within 80% of the max value.
| dbms | 256us | 1ms | 4ms | 16ms | 64ms | 256ms | 1s | 4s | 16s | gt | max |
|---|---|---|---|---|---|---|---|---|---|---|---|
| my5740_rel_lto.cy10a_bee | 96.321 | 3.667 | 0.010 | 0.003 | 0.092 | ||||||
| my5740_rel_lto.cy10a1_bee | 96.958 | 3.004 | 0.036 | 0.001 | 0.067 | ||||||
| my5740_rel_lto.cy10a2_bee | 96.438 | 3.556 | 0.006 | 0.001 | 0.073 | ||||||
| my5740_rel_lto.cy10a3_bee | 96.347 | 3.636 | 0.015 | 0.001 | 0.083 | ||||||
| my5740_rel_lto.cy10a4_bee | 23.454 | 55.010 | 16.019 | 5.414 | 0.086 | 0.017 | 2.344 |
Performance metrics for the DBMS listed above. Some are normalized by throughput, others are not. Legend for results is here.
ips	qps	rps	rmbps	wps	wmbps	rpq	rkbpq	wpi	wkbpi	csps	cpups	cspq	cpupq	dbgb1	dbgb2	rss	maxop	p50	p99	tag
998	1002	11648	182.0	7160.7	219.1	11.631	186.095	7.175	224.800	50341	16.5	50.265	1318	154.7	196.8	10.7	0.049	1007	864	800m.my5740_rel_lto.cy10a_bee
998	1017	11752	183.6	7159.2	219.8	11.556	184.903	7.176	225.637	54098	16.8	53.199	1322	155.0	197.2	10.7	0.047	1023	911	800m.my5740_rel_lto.cy10a1_bee
998	1001	11689	182.6	7210.8	220.3	11.676	186.824	7.227	226.140	50181	16.5	50.125	1319	155.3	197.2	10.7	0.052	1007	895	800m.my5740_rel_lto.cy10a2_bee
998	1001	11685	182.6	7209.4	220.3	11.674	186.778	7.222	225.953	50173	16.4	50.123	1311	155.3	197.1	10.7	0.045	1007	895	800m.my5740_rel_lto.cy10a3_bee
652	119	1529	38.5	1719.9	50.4	12.805	330.189	2.639	79.102	12933	6.9	108.313	4623	157.4	199.3	9.8	1.044	112	0	800m.my5740_rel_lto.cy10a4_bee
l.i0
l.i0: load without secondary indexes
Performance metrics for all DBMS, not just the ones listed above. Some are normalized by throughput, others are not. Legend for results is here.
ips	qps	rps	rmbps	wps	wmbps	rpq	rkbpq	wpi	wkbpi	csps	cpups	cspq	cpupq	dbgb1	dbgb2	rss	maxop	p50	p99	tag
80718	0	0	0.0	406.9	29.0	0.000	0.000	0.005	0.368	9027	21.4	0.112	21	52.6	93.1	10.9	0.142	81010	71080	800m.my5740_rel_lto.cy10a_bee
81641	0	0	0.0	411.1	29.3	0.000	0.000	0.005	0.368	8832	21.5	0.108	21	52.6	93.1	10.9	0.124	81808	72220	800m.my5740_rel_lto.cy10a1_bee
81883	0	0	0.0	412.7	29.4	0.000	0.000	0.005	0.368	9123	21.3	0.111	21	52.6	93.1	10.9	0.128	82211	71887	800m.my5740_rel_lto.cy10a2_bee
82001	0	0	0.0	412.9	29.4	0.000	0.000	0.005	0.367	9145	21.3	0.112	21	52.6	93.1	10.9	0.128	82303	72337	800m.my5740_rel_lto.cy10a3_bee
70584	0	0	0.0	128.3	25.4	0.000	0.000	0.002	0.368	7813	19.9	0.111	23	52.6	93.1	10.9	0.113	70918	62010	800m.my5740_rel_lto.cy10a4_bee
l.x
l.x: create secondary indexes
Performance metrics for all DBMS, not just the ones listed above. Some are normalized by throughput, others are not. Legend for results is here.
ips	qps	rps	rmbps	wps	wmbps	rpq	rkbpq	wpi	wkbpi	csps	cpups	cspq	cpupq	dbgb1	dbgb2	rss	maxop	p50	p99	tag
109154	0	654	102.5	905.8	122.8	0.006	0.962	0.008	1.152	6214	12.1	0.057	9	117.7	158.2	10.2	0.013	NA	NA	800m.my5740_rel_lto.cy10a_bee
108768	0	654	102.2	916.6	122.6	0.006	0.962	0.008	1.154	12043	12.6	0.111	9	117.7	158.2	10.2	0.015	NA	NA	800m.my5740_rel_lto.cy10a1_bee
109648	0	658	103.0	875.9	123.2	0.006	0.962	0.008	1.151	6176	12.1	0.056	9	117.7	158.2	10.2	0.014	NA	NA	800m.my5740_rel_lto.cy10a2_bee
109874	0	668	103.2	899.7	123.7	0.006	0.962	0.008	1.153	6208	12.0	0.057	9	117.7	158.2	10.2	0.010	NA	NA	800m.my5740_rel_lto.cy10a3_bee
99502	0	296	94.2	319.3	112.2	0.003	0.969	0.003	1.154	3320	11.4	0.033	9	117.7	158.2	10.3	0.013	NA	NA	800m.my5740_rel_lto.cy10a4_bee
l.i1
l.i1: continue load after secondary indexes created
Performance metrics for all DBMS, not just the ones listed above. Some are normalized by throughput, others are not. Legend for results is here.
ips	qps	rps	rmbps	wps	wmbps	rpq	rkbpq	wpi	wkbpi	csps	cpups	cspq	cpupq	dbgb1	dbgb2	rss	maxop	p50	p99	tag
2292	0	8363	130.7	11475.6	365.4	3.649	58.383	5.007	163.234	56299	24.6	24.563	859	154.7	196.8	10.7	0.363	2297	699	800m.my5740_rel_lto.cy10a_bee
2017	0	7280	113.8	9996.7	318.7	3.610	57.753	4.956	161.796	53091	21.5	26.323	853	155.0	197.2	10.7	0.398	1998	549	800m.my5740_rel_lto.cy10a1_bee
2327	0	8748	136.7	11897.4	378.0	3.759	60.146	5.112	166.333	57771	24.8	24.824	853	155.3	197.2	10.7	0.425	2247	650	800m.my5740_rel_lto.cy10a2_bee
2326	0	8770	137.0	11914.5	378.6	3.770	60.323	5.122	166.667	57875	24.7	24.881	849	155.3	197.1	10.7	0.377	2198	650	800m.my5740_rel_lto.cy10a3_bee
380	0	1583	29.5	2073.8	67.0	4.160	79.520	5.452	180.272	13805	6.1	36.291	1283	154.1	195.8	10.2	2.561	250	0	800m.my5740_rel_lto.cy10a4_bee
q100.1
q100.1: range queries with 100 insert/s per client
Performance metrics for all DBMS, not just the ones listed above. Some are normalized by throughput, others are not. Legend for results is here.
ips	qps	rps	rmbps	wps	wmbps	rpq	rkbpq	wpi	wkbpi	csps	cpups	cspq	cpupq	dbgb1	dbgb2	rss	maxop	p50	p99	tag
100	960	11125	173.8	8111.3	211.9	11.590	185.434	81.276	2173.873	51133	15.2	53.269	1267	154.7	196.8	10.7	0.339	927	799	800m.my5740_rel_lto.cy10a_bee
100	939	11293	176.4	8013.5	216.5	12.030	192.480	80.538	2227.963	56213	16.3	59.884	1389	155.0	197.2	10.7	0.654	959	703	800m.my5740_rel_lto.cy10a1_bee
100	935	11686	182.6	8705.6	230.5	12.501	200.018	87.318	2367.437	53976	15.9	57.740	1361	155.3	197.2	10.7	0.044	927	767	800m.my5740_rel_lto.cy10a2_bee
100	930	11669	182.3	8768.3	230.9	12.541	200.652	87.947	2371.411	54102	15.9	58.143	1367	155.3	197.1	10.7	0.073	927	767	800m.my5740_rel_lto.cy10a3_bee
92	288	2918	73.0	2154.8	65.1	10.144	259.864	23.473	726.724	20134	8.0	69.984	2225	154.1	195.8	8.3	0.564	320	48	800m.my5740_rel_lto.cy10a4_bee
q500.1
q500.1: range queries with 500 insert/s per client
Performance metrics for all DBMS, not just the ones listed above. Some are normalized by throughput, others are not. Legend for results is here.
ips	qps	rps	rmbps	wps	wmbps	rpq	rkbpq	wpi	wkbpi	csps	cpups	cspq	cpupq	dbgb1	dbgb2	rss	maxop	p50	p99	tag
499	1106	9272	144.9	4201.9	128.9	8.386	134.178	8.416	264.278	35712	11.7	32.301	847	154.7	196.8	10.7	0.043	1103	1036	800m.my5740_rel_lto.cy10a_bee
498	1106	9356	146.2	4342.2	133.3	8.455	135.284	8.716	274.020	39079	12.2	35.318	882	155.0	197.2	10.7	0.041	1103	959	800m.my5740_rel_lto.cy10a1_bee
499	1102	9309	145.5	4253.6	130.3	8.446	135.134	8.531	267.654	35579	11.8	32.280	856	155.3	197.2	10.7	0.047	1103	1023	800m.my5740_rel_lto.cy10a2_bee
499	1101	9297	145.3	4262.0	130.5	8.445	135.116	8.545	267.816	35578	11.9	32.318	865	155.3	197.1	10.7	0.045	1103	1023	800m.my5740_rel_lto.cy10a3_bee
456	166	2155	50.6	2010.4	58.8	12.975	312.195	4.408	131.999	16394	7.4	98.702	3564	154.1	195.8	9.2	0.642	176	16	800m.my5740_rel_lto.cy10a4_bee
q1000.1
q1000.1: range queries with 1000 insert/s per client
Performance metrics for all DBMS, not just the ones listed above. Some are normalized by throughput, others are not. Legend for results is here.
ips	qps	rps	rmbps	wps	wmbps	rpq	rkbpq	wpi	wkbpi	csps	cpups	cspq	cpupq	dbgb1	dbgb2	rss	maxop	p50	p99	tag
998	1002	11648	182.0	7160.7	219.1	11.631	186.095	7.175	224.800	50341	16.5	50.265	1318	154.7	196.8	10.7	0.049	1007	864	800m.my5740_rel_lto.cy10a_bee
998	1017	11752	183.6	7159.2	219.8	11.556	184.903	7.176	225.637	54098	16.8	53.199	1322	155.0	197.2	10.7	0.047	1023	911	800m.my5740_rel_lto.cy10a1_bee
998	1001	11689	182.6	7210.8	220.3	11.676	186.824	7.227	226.140	50181	16.5	50.125	1319	155.3	197.2	10.7	0.052	1007	895	800m.my5740_rel_lto.cy10a2_bee
998	1001	11685	182.6	7209.4	220.3	11.674	186.778	7.222	225.953	50173	16.4	50.123	1311	155.3	197.1	10.7	0.045	1007	895	800m.my5740_rel_lto.cy10a3_bee
652	119	1529	38.5	1719.9	50.4	12.805	330.189	2.639	79.102	12933	6.9	108.313	4623	157.4	199.3	9.8	1.044	112	0	800m.my5740_rel_lto.cy10a4_bee
l.i0
- l.i0: load without secondary indexes
- Legend for results is here.
- Each entry lists the percentage of responses that fit in that bucket (slower than max time for previous bucket, faster than min time for next bucket).
Insert response time histogram
256us	1ms	4ms	16ms	64ms	256ms	1s	4s	16s	gt	max	tag
0.000	0.333	99.336	0.193	0.136	0.002	0.000	0.000	0.000	0.000	0.142	my5740_rel_lto.cy10a_bee
0.000	0.565	99.103	0.197	0.132	0.002	0.000	0.000	0.000	0.000	0.124	my5740_rel_lto.cy10a1_bee
0.000	0.719	98.953	0.189	0.137	0.002	0.000	0.000	0.000	0.000	0.128	my5740_rel_lto.cy10a2_bee
0.000	0.745	98.925	0.192	0.136	0.002	0.000	0.000	0.000	0.000	0.128	my5740_rel_lto.cy10a3_bee
0.000	0.354	97.452	2.040	0.152	0.002	0.000	0.000	0.000	0.000	0.113	my5740_rel_lto.cy10a4_bee
l.x
- l.x: create secondary indexes
- Legend for results is here.
- Each entry lists the percentage of responses that fit in that bucket (slower than max time for previous bucket, faster than min time for next bucket).
TODO - determine whether there is data for create index response time
l.i1
- l.i1: continue load after secondary indexes created
- Legend for results is here.
- Each entry lists the percentage of responses that fit in that bucket (slower than max time for previous bucket, faster than min time for next bucket).
Insert response time histogram
256us	1ms	4ms	16ms	64ms	256ms	1s	4s	16s	gt	max	tag
0.000	0.000	0.000	52.790	43.975	3.234	0.001	0.000	0.000	0.000	0.363	my5740_rel_lto.cy10a_bee
0.000	0.000	0.000	46.414	48.304	5.280	0.002	0.000	0.000	0.000	0.398	my5740_rel_lto.cy10a1_bee
0.000	0.000	0.000	53.372	43.201	3.426	0.001	0.000	0.000	0.000	0.425	my5740_rel_lto.cy10a2_bee
0.000	0.000	0.000	53.485	43.096	3.418	0.001	0.000	0.000	0.000	0.377	my5740_rel_lto.cy10a3_bee
0.000	0.000	0.000	5.930	58.778	21.895	11.601	1.796	0.000	0.000	2.561	my5740_rel_lto.cy10a4_bee
Delete response time histogram
256us	1ms	4ms	16ms	64ms	256ms	1s	4s	16s	gt	max	tag
0.000	0.000	62.198	37.276	0.522	0.004	0.000	0.000	0.000	0.000	0.090	my5740_rel_lto.cy10a_bee
0.000	0.000	69.164	30.377	0.443	0.017	0.000	0.000	0.000	0.000	0.149	my5740_rel_lto.cy10a1_bee
0.000	0.000	72.706	26.787	0.500	0.007	0.000	0.000	0.000	0.000	0.123	my5740_rel_lto.cy10a2_bee
0.000	0.000	71.933	27.556	0.504	0.006	0.000	0.000	0.000	0.000	0.100	my5740_rel_lto.cy10a3_bee
0.000	0.000	50.209	38.300	9.720	1.743	0.019	0.009	0.000	0.000	2.276	my5740_rel_lto.cy10a4_bee
q100.1
- q100.1: range queries with 100 insert/s per client
- Legend for results is here.
- Each entry lists the percentage of responses that fit in that bucket (slower than max time for previous bucket, faster than min time for next bucket).
Query response time histogram
256us	1ms	4ms	16ms	64ms	256ms	1s	4s	16s	gt	max	tag
14.773	29.358	54.023	1.836	0.010	0.000	nonzero	0.000	0.000	0.000	0.339	my5740_rel_lto.cy10a_bee
11.115	31.917	55.036	1.902	0.029	0.001	nonzero	0.000	0.000	0.000	0.654	my5740_rel_lto.cy10a1_bee
12.099	31.145	54.718	2.028	0.010	0.000	0.000	0.000	0.000	0.000	0.044	my5740_rel_lto.cy10a2_bee
11.980	31.179	54.782	2.048	0.010	nonzero	0.000	0.000	0.000	0.000	0.073	my5740_rel_lto.cy10a3_bee
7.388	32.755	51.670	5.887	1.541	0.729	0.030	0.000	0.000	0.000	0.564	my5740_rel_lto.cy10a4_bee
Insert response time histogram
256us	1ms	4ms	16ms	64ms	256ms	1s	4s	16s	gt	max	tag
0.000	0.000	0.000	1.833	90.444	7.708	0.014	0.000	0.000	0.000	0.345	my5740_rel_lto.cy10a_bee
0.000	0.000	0.000	12.278	63.694	24.014	0.014	0.000	0.000	0.000	0.664	my5740_rel_lto.cy10a1_bee
0.000	0.000	0.000	11.806	79.653	8.542	0.000	0.000	0.000	0.000	0.127	my5740_rel_lto.cy10a2_bee
0.000	0.000	0.000	8.583	82.583	8.833	0.000	0.000	0.000	0.000	0.136	my5740_rel_lto.cy10a3_bee
0.000	0.000	0.000	5.014	55.819	28.444	10.653	0.069	0.000	0.000	1.476	my5740_rel_lto.cy10a4_bee
Delete response time histogram
256us	1ms	4ms	16ms	64ms	256ms	1s	4s	16s	gt	max	tag
0.000	0.000	55.681	44.139	0.167	0.000	0.014	0.000	0.000	0.000	0.320	my5740_rel_lto.cy10a_bee
0.000	0.000	48.792	50.681	0.500	0.014	0.014	0.000	0.000	0.000	0.625	my5740_rel_lto.cy10a1_bee
0.000	0.000	57.514	42.333	0.153	0.000	0.000	0.000	0.000	0.000	0.035	my5740_rel_lto.cy10a2_bee
0.000	0.000	54.472	45.278	0.250	0.000	0.000	0.000	0.000	0.000	0.033	my5740_rel_lto.cy10a3_bee
0.000	0.000	6.583	70.431	18.236	4.667	0.083	0.000	0.000	0.000	0.393	my5740_rel_lto.cy10a4_bee
q500.1
- q500.1: range queries with 500 insert/s per client
- Legend for results is here.
- Each entry lists the percentage of responses that fit in that bucket (slower than max time for previous bucket, faster than min time for next bucket).
Query response time histogram
256us	1ms	4ms	16ms	64ms	256ms	1s	4s	16s	gt	max	tag
13.448	32.971	52.766	0.811	0.004	0.000	0.000	0.000	0.000	0.000	0.043	my5740_rel_lto.cy10a_bee
13.729	32.547	52.861	0.858	0.005	0.000	0.000	0.000	0.000	0.000	0.041	my5740_rel_lto.cy10a1_bee
13.160	33.144	52.876	0.816	0.004	0.000	0.000	0.000	0.000	0.000	0.047	my5740_rel_lto.cy10a2_bee
12.020	34.213	52.941	0.822	0.004	0.000	0.000	0.000	0.000	0.000	0.045	my5740_rel_lto.cy10a3_bee
5.874	31.905	50.600	6.014	3.570	1.820	0.218	0.000	0.000	0.000	0.642	my5740_rel_lto.cy10a4_bee
Insert response time histogram
256us	1ms	4ms	16ms	64ms	256ms	1s	4s	16s	gt	max	tag
0.000	0.000	0.000	78.458	21.450	0.092	0.000	0.000	0.000	0.000	0.092	my5740_rel_lto.cy10a_bee
0.000	0.000	0.000	55.308	43.514	1.178	0.000	0.000	0.000	0.000	0.137	my5740_rel_lto.cy10a1_bee
0.000	0.000	0.000	76.836	23.058	0.106	0.000	0.000	0.000	0.000	0.092	my5740_rel_lto.cy10a2_bee
0.000	0.000	0.000	76.039	23.817	0.144	0.000	0.000	0.000	0.000	0.085	my5740_rel_lto.cy10a3_bee
0.000	0.000	0.000	9.819	56.986	24.606	8.372	0.217	0.000	0.000	2.409	my5740_rel_lto.cy10a4_bee
Delete response time histogram
256us	1ms	4ms	16ms	64ms	256ms	1s	4s	16s	gt	max	tag
0.000	0.000	94.283	5.708	0.008	0.000	0.000	0.000	0.000	0.000	0.056	my5740_rel_lto.cy10a_bee
0.000	0.000	94.758	5.211	0.031	0.000	0.000	0.000	0.000	0.000	0.032	my5740_rel_lto.cy10a1_bee
0.000	0.000	93.444	6.544	0.011	0.000	0.000	0.000	0.000	0.000	0.033	my5740_rel_lto.cy10a2_bee
0.000	0.000	93.411	6.581	0.008	0.000	0.000	0.000	0.000	0.000	0.054	my5740_rel_lto.cy10a3_bee
0.000	0.000	29.547	48.706	16.633	5.031	0.067	0.017	0.000	0.000	2.078	my5740_rel_lto.cy10a4_bee
q1000.1
- q1000.1: range queries with 1000 insert/s per client
- Legend for results is here.
- Each entry lists the percentage of responses that fit in that bucket (slower than max time for previous bucket, faster than min time for next bucket).
Query response time histogram
256us	1ms	4ms	16ms	64ms	256ms	1s	4s	16s	gt	max	tag
12.627	30.859	54.970	1.535	0.009	0.000	0.000	0.000	0.000	0.000	0.049	my5740_rel_lto.cy10a_bee
13.526	30.037	54.876	1.551	0.009	0.000	0.000	0.000	0.000	0.000	0.047	my5740_rel_lto.cy10a1_bee
11.723	31.813	54.895	1.561	0.009	0.000	0.000	0.000	0.000	0.000	0.052	my5740_rel_lto.cy10a2_bee
11.491	31.969	54.965	1.565	0.009	0.000	0.000	0.000	0.000	0.000	0.045	my5740_rel_lto.cy10a3_bee
5.055	32.130	49.321	6.507	3.990	2.531	0.466	nonzero	0.000	0.000	1.044	my5740_rel_lto.cy10a4_bee
Insert response time histogram
256us	1ms	4ms	16ms	64ms	256ms	1s	4s	16s	gt	max	tag
0.000	0.000	0.000	68.386	31.526	0.088	0.000	0.000	0.000	0.000	0.096	my5740_rel_lto.cy10a_bee
0.000	0.000	0.000	80.539	18.993	0.468	0.000	0.000	0.000	0.000	0.137	my5740_rel_lto.cy10a1_bee
0.000	0.000	0.000	67.435	32.476	0.089	0.000	0.000	0.000	0.000	0.114	my5740_rel_lto.cy10a2_bee
0.000	0.000	0.000	66.625	33.282	0.093	0.000	0.000	0.000	0.000	0.084	my5740_rel_lto.cy10a3_bee
0.000	0.000	0.000	36.272	38.972	17.807	6.853	0.096	0.000	0.000	3.102	my5740_rel_lto.cy10a4_bee
Delete response time histogram
256us	1ms	4ms	16ms	64ms	256ms	1s	4s	16s	gt	max	tag
0.000	0.000	96.321	3.667	0.010	0.003	0.000	0.000	0.000	0.000	0.092	my5740_rel_lto.cy10a_bee
0.000	0.000	96.958	3.004	0.036	0.001	0.000	0.000	0.000	0.000	0.067	my5740_rel_lto.cy10a1_bee
0.000	0.000	96.438	3.556	0.006	0.001	0.000	0.000	0.000	0.000	0.073	my5740_rel_lto.cy10a2_bee
0.000	0.000	96.347	3.636	0.015	0.001	0.000	0.000	0.000	0.000	0.083	my5740_rel_lto.cy10a3_bee
0.000	0.000	23.454	55.010	16.019	5.414	0.086	0.017	0.000	0.000	2.344	my5740_rel_lto.cy10a4_bee