Introduction
This is a report for the insert benchmark with 20M docs and 1 client(s). It is generated by scripts (bash, awk, sed) and Tufte might not be impressed. An overview of the insert benchmark is here and a short update is here. Below, by DBMS, I mean DBMS+version.config. An example is my8020.c10b40 where my means MySQL, 8020 is version 8.0.20 and c10b40 is the name for the configuration file.
The test server has 8 AMD cores, 16G RAM and an NVMe SSD. It is described here as the Beelink. The benchmark was run with 1 client and there were 1 or 3 connections per client (1 for queries or inserts without rate limits, 1+1 for rate limited inserts+deletes). There is 1 table. It loads 20M rows without secondary indexes, creates secondary indexes, then inserts 50M rows with a delete per insert to avoid growing the table. It then does 3 read+write tests for 3600s each that do queries as fast as possible with 100, 500 and then 1000 inserts/second/client concurrent with the queries and 1000 deletes/second to avoid growing the table. The database is (or should be) cached by InnoDB.
The tested DBMS are:
- my5651_rel.cy10a_bee - InnoDB and MySQL 5.6.51, rel build, cy10a_bee config, compiled with CMAKE_BUILD_TYPE=Release, base config
my5651_rel.cy10a2_bee - InnoDB and MySQL 5.6.51, rel build, cy10a2_bee config, compiled with CMAKE_BUILD_TYPE=Release, adds innodb_io_capacity=20k, innodb_io_capacity_max=40k - my5651_rel.cy10a4_bee - InnoDB and MySQL 5.6.51, rel build, cy10a4_bee config, compiled with CMAKE_BUILD_TYPE=Release, adds innodb_flush_method=fsync
Contents
- Summary
- l.i0: load without secondary indexes
- l.x: create secondary indexes
- l.i1: continue load after secondary indexes created
- q100.1: range queries with 100 insert/s per client
- q500.1: range queries with 500 insert/s per client
- q1000.1: range queries with 1000 insert/s per client
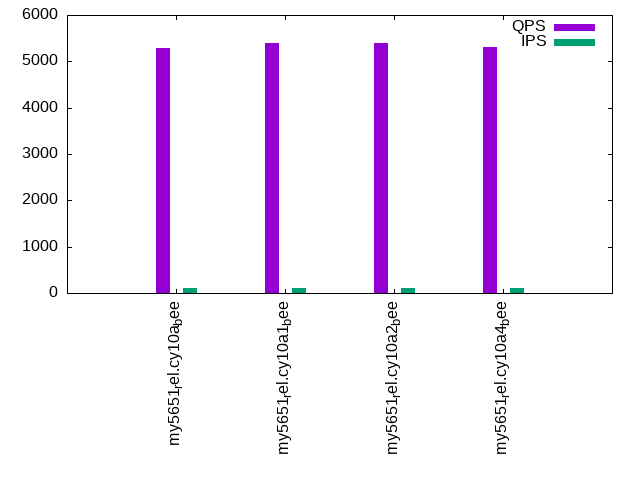
Summary
The numbers are inserts/s for l.i0 and l.i1, indexed docs (or rows) /s for l.x and queries/s for q100, q500, q1000. The values are the average rate over the entire test for inserts (IPS) and queries (QPS). The range of values for IPS and QPS is split into 3 parts: bottom 25%, middle 50%, top 25%. Values in the bottom 25% have a red background, values in the top 25% have a green background and values in the middle have no color. A gray background is used for values that can be ignored because the DBMS did not sustain the target insert rate. Red backgrounds are not used when the minimum value is within 80% of the max value.
| dbms | l.i0 | l.x | l.i1 | q100.1 | q500.1 | q1000.1 |
|---|---|---|---|---|---|---|
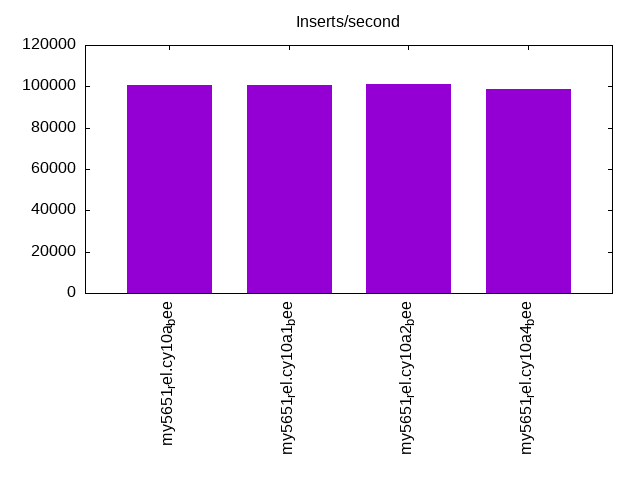
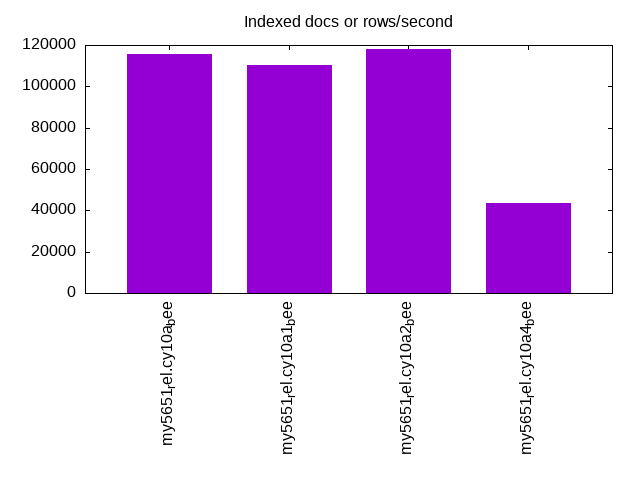
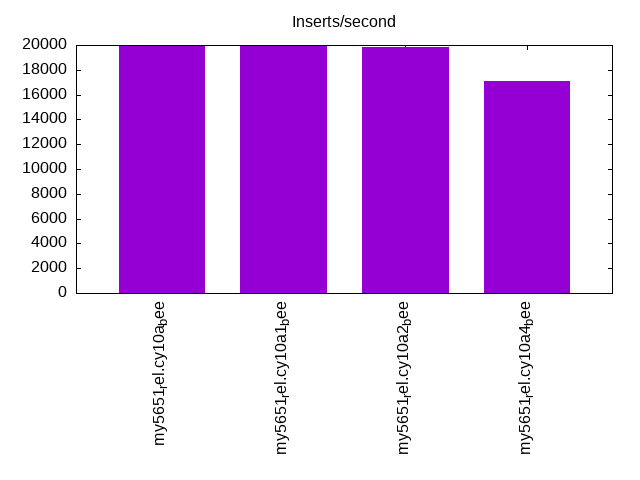
| my5651_rel.cy10a_bee | 100502 | 115517 | 19936 | 5290 | 5274 | 5292 |
| my5651_rel.cy10a1_bee | 100502 | 110440 | 19889 | 5404 | 5397 | 5400 |
| my5651_rel.cy10a2_bee | 101010 | 118235 | 19810 | 5392 | 5391 | 5456 |
| my5651_rel.cy10a4_bee | 98522 | 43506 | 17135 | 5304 | 5288 | 5242 |
This table has relative throughput, throughput for the DBMS relative to the DBMS in the first line, using the absolute throughput from the previous table. Values less than 0.95 have a yellow background. Values greater than 1.05 have a blue background.
| dbms | l.i0 | l.x | l.i1 | q100.1 | q500.1 | q1000.1 |
|---|---|---|---|---|---|---|
| my5651_rel.cy10a_bee | 1.00 | 1.00 | 1.00 | 1.00 | 1.00 | 1.00 |
| my5651_rel.cy10a1_bee | 1.00 | 0.96 | 1.00 | 1.02 | 1.02 | 1.02 |
| my5651_rel.cy10a2_bee | 1.01 | 1.02 | 0.99 | 1.02 | 1.02 | 1.03 |
| my5651_rel.cy10a4_bee | 0.98 | 0.38 | 0.86 | 1.00 | 1.00 | 0.99 |
This lists the average rate of inserts/s for the tests that do inserts concurrent with queries. For such tests the query rate is listed in the table above. The read+write tests are setup so that the insert rate should match the target rate every second. Cells that are not at least 95% of the target have a red background to indicate a failure to satisfy the target.
| dbms | q100.1 | q500.1 | q1000.1 |
|---|---|---|---|
| my5651_rel.cy10a_bee | 100 | 499 | 998 |
| my5651_rel.cy10a1_bee | 100 | 499 | 998 |
| my5651_rel.cy10a2_bee | 100 | 499 | 998 |
| my5651_rel.cy10a4_bee | 100 | 498 | 996 |
| target | 100 | 500 | 1000 |
l.i0
l.i0: load without secondary indexes. Graphs for performance per 1-second interval are here.
Average throughput:
Insert response time histogram: each cell has the percentage of responses that take <= the time in the header and max is the max response time in seconds. For the max column values in the top 25% of the range have a red background and in the bottom 25% of the range have a green background. The red background is not used when the min value is within 80% of the max value.
| dbms | 256us | 1ms | 4ms | 16ms | 64ms | 256ms | 1s | 4s | 16s | gt | max |
|---|---|---|---|---|---|---|---|---|---|---|---|
| my5651_rel.cy10a_bee | 92.000 | 7.895 | 0.101 | 0.001 | 0.003 | 0.097 | |||||
| my5651_rel.cy10a1_bee | 92.850 | 7.042 | 0.102 | 0.003 | 0.003 | 0.094 | |||||
| my5651_rel.cy10a2_bee | 92.834 | 7.060 | 0.102 | 0.001 | 0.003 | 0.112 | |||||
| my5651_rel.cy10a4_bee | 92.355 | 7.348 | 0.286 | 0.007 | 0.003 | 0.097 |
Performance metrics for the DBMS listed above. Some are normalized by throughput, others are not. Legend for results is here.
ips	qps	rps	rmbps	wps	wmbps	rpq	rkbpq	wpi	wkbpi	csps	cpups	cspq	cpupq	dbgb1	dbgb2	rss	maxop	p50	p99	tag
100502	0	879	3.4	52.8	22.9	0.009	0.035	0.001	0.233	11461	21.8	0.114	17	1.3	41.8	2.1	0.097	100890	82384	20m.my5651_rel.cy10a_bee
100502	0	885	3.5	53.2	23.0	0.009	0.035	0.001	0.235	11511	21.9	0.115	17	1.3	41.8	2.1	0.094	101488	88203	20m.my5651_rel.cy10a1_bee
101010	0	884	3.5	53.2	23.0	0.009	0.035	0.001	0.233	11563	21.9	0.114	17	1.3	41.8	2.1	0.112	101493	87604	20m.my5651_rel.cy10a2_bee
98522	0	868	3.4	54.1	22.6	0.009	0.035	0.001	0.235	11324	21.7	0.115	18	1.3	41.8	2.1	0.097	99799	62452	20m.my5651_rel.cy10a4_bee
l.x
l.x: create secondary indexes.
Average throughput:
Performance metrics for the DBMS listed above. Some are normalized by throughput, others are not. Legend for results is here.
ips	qps	rps	rmbps	wps	wmbps	rpq	rkbpq	wpi	wkbpi	csps	cpups	cspq	cpupq	dbgb1	dbgb2	rss	maxop	p50	p99	tag
115517	0	19	0.1	1305.5	120.1	0.000	0.001	0.011	1.064	3912	11.6	0.034	8	2.7	43.2	3.5	0.016	NA	NA	20m.my5651_rel.cy10a_bee
110440	0	24	0.1	368.0	115.2	0.000	0.001	0.003	1.068	1039	11.1	0.009	8	2.7	43.2	3.5	0.008	NA	NA	20m.my5651_rel.cy10a1_bee
118235	0	19	0.1	1325.4	121.8	0.000	0.001	0.011	1.054	4046	11.8	0.034	8	2.7	43.2	3.5	0.011	NA	NA	20m.my5651_rel.cy10a2_bee
43506	0	25	0.1	350.2	46.8	0.001	0.002	0.008	1.101	2204	5.6	0.051	10	2.7	43.2	3.5	0.029	NA	NA	20m.my5651_rel.cy10a4_bee
l.i1
l.i1: continue load after secondary indexes created. Graphs for performance per 1-second interval are here.
Average throughput:
Insert response time histogram: each cell has the percentage of responses that take <= the time in the header and max is the max response time in seconds. For the max column values in the top 25% of the range have a red background and in the bottom 25% of the range have a green background. The red background is not used when the min value is within 80% of the max value.
| dbms | 256us | 1ms | 4ms | 16ms | 64ms | 256ms | 1s | 4s | 16s | gt | max |
|---|---|---|---|---|---|---|---|---|---|---|---|
| my5651_rel.cy10a_bee | 96.471 | 3.374 | 0.153 | 0.003 | 0.098 | ||||||
| my5651_rel.cy10a1_bee | 96.243 | 3.594 | 0.161 | 0.002 | 0.097 | ||||||
| my5651_rel.cy10a2_bee | 96.180 | 3.653 | 0.166 | 0.002 | 0.101 | ||||||
| my5651_rel.cy10a4_bee | 93.384 | 5.652 | 0.963 | 0.001 | nonzero | 0.571 |
Delete response time histogram: each cell has the percentage of responses that take <= the time in the header and max is the max response time in seconds. For the max column values in the top 25% of the range have a red background and in the bottom 25% of the range have a green background. The red background is not used when the min value is within 80% of the max value.
| dbms | 256us | 1ms | 4ms | 16ms | 64ms | 256ms | 1s | 4s | 16s | gt | max |
|---|---|---|---|---|---|---|---|---|---|---|---|
| my5651_rel.cy10a_bee | 97.512 | 2.372 | 0.114 | 0.003 | 0.076 | ||||||
| my5651_rel.cy10a1_bee | 97.215 | 2.661 | 0.122 | 0.002 | 0.084 | ||||||
| my5651_rel.cy10a2_bee | 97.268 | 2.603 | 0.127 | 0.002 | 0.077 | ||||||
| my5651_rel.cy10a4_bee | 95.864 | 3.721 | 0.415 | 0.001 | 0.156 |
Performance metrics for the DBMS listed above. Some are normalized by throughput, others are not. Legend for results is here.
ips	qps	rps	rmbps	wps	wmbps	rpq	rkbpq	wpi	wkbpi	csps	cpups	cspq	cpupq	dbgb1	dbgb2	rss	maxop	p50	p99	tag
19936	0	670	2.6	980.1	54.7	0.034	0.134	0.049	2.809	14090	34.4	0.707	138	3.8	44.3	4.5	0.098	21276	4997	20m.my5651_rel.cy10a_bee
19889	0	670	2.6	844.7	54.5	0.034	0.135	0.042	2.808	12914	34.3	0.649	138	3.8	44.3	4.5	0.097	21226	4894	20m.my5651_rel.cy10a1_bee
19810	0	666	2.6	1132.4	59.2	0.034	0.134	0.057	3.059	14530	34.3	0.733	139	3.8	44.3	4.5	0.101	21034	4945	20m.my5651_rel.cy10a2_bee
17135	0	574	2.2	781.9	47.9	0.033	0.134	0.046	2.860	11533	30.8	0.673	144	3.8	44.3	4.5	0.571	17588	4994	20m.my5651_rel.cy10a4_bee
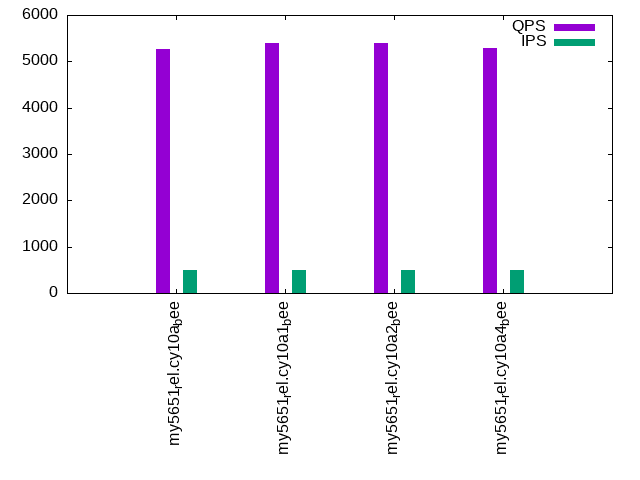
q100.1
q100.1: range queries with 100 insert/s per client. Graphs for performance per 1-second interval are here.
Average throughput:
Query response time histogram: each cell has the percentage of responses that take <= the time in the header and max is the max response time in seconds. For max values in the top 25% of the range have a red background and in the bottom 25% of the range have a green background. The red background is not used when the min value is within 80% of the max value.
| dbms | 256us | 1ms | 4ms | 16ms | 64ms | 256ms | 1s | 4s | 16s | gt | max |
|---|---|---|---|---|---|---|---|---|---|---|---|
| my5651_rel.cy10a_bee | 94.942 | 5.052 | 0.002 | 0.003 | nonzero | 0.016 | |||||
| my5651_rel.cy10a1_bee | 95.529 | 4.465 | 0.002 | 0.004 | 0.016 | ||||||
| my5651_rel.cy10a2_bee | 95.459 | 4.536 | 0.002 | 0.003 | nonzero | 0.023 | |||||
| my5651_rel.cy10a4_bee | 95.024 | 4.969 | 0.003 | 0.005 | nonzero | 0.022 |
Insert response time histogram: each cell has the percentage of responses that take <= the time in the header and max is the max response time in seconds. For max values in the top 25% of the range have a red background and in the bottom 25% of the range have a green background. The red background is not used when the min value is within 80% of the max value.
| dbms | 256us | 1ms | 4ms | 16ms | 64ms | 256ms | 1s | 4s | 16s | gt | max |
|---|---|---|---|---|---|---|---|---|---|---|---|
| my5651_rel.cy10a_bee | 52.278 | 46.847 | 0.875 | 0.026 | |||||||
| my5651_rel.cy10a1_bee | 55.625 | 43.875 | 0.500 | 0.023 | |||||||
| my5651_rel.cy10a2_bee | 50.375 | 48.222 | 1.403 | 0.031 | |||||||
| my5651_rel.cy10a4_bee | 61.681 | 37.653 | 0.667 | 0.038 |
Delete response time histogram: each cell has the percentage of responses that take <= the time in the header and max is the max response time in seconds. For max values in the top 25% of the range have a red background and in the bottom 25% of the range have a green background. The red background is not used when the min value is within 80% of the max value.
| dbms | 256us | 1ms | 4ms | 16ms | 64ms | 256ms | 1s | 4s | 16s | gt | max |
|---|---|---|---|---|---|---|---|---|---|---|---|
| my5651_rel.cy10a_bee | 53.806 | 45.819 | 0.375 | 0.024 | |||||||
| my5651_rel.cy10a1_bee | 56.028 | 43.847 | 0.125 | 0.021 | |||||||
| my5651_rel.cy10a2_bee | 51.264 | 48.014 | 0.722 | 0.031 | |||||||
| my5651_rel.cy10a4_bee | 80.431 | 19.333 | 0.236 | 0.028 |
Performance metrics for the DBMS listed above. Some are normalized by throughput, others are not. Legend for results is here.
ips	qps	rps	rmbps	wps	wmbps	rpq	rkbpq	wpi	wkbpi	csps	cpups	cspq	cpupq	dbgb1	dbgb2	rss	maxop	p50	p99	tag
100	5290	4	0.0	692.0	20.8	0.001	0.003	6.941	213.223	22694	13.1	4.290	198	3.8	44.3	4.5	0.016	5243	5066	20m.my5651_rel.cy10a_bee
100	5404	4	0.0	153.6	4.8	0.001	0.003	1.539	49.594	21101	12.9	3.905	191	3.8	44.3	4.5	0.016	5354	5178	20m.my5651_rel.cy10a1_bee
100	5392	4	0.0	709.0	21.2	0.001	0.003	7.111	218.218	23169	13.1	4.297	194	3.8	44.3	4.5	0.023	5354	5178	20m.my5651_rel.cy10a2_bee
100	5304	4	0.0	234.4	6.7	0.001	0.003	2.353	68.767	21041	13.2	3.967	199	3.8	44.3	4.5	0.022	5273	5097	20m.my5651_rel.cy10a4_bee
q500.1
q500.1: range queries with 500 insert/s per client. Graphs for performance per 1-second interval are here.
Average throughput:
Query response time histogram: each cell has the percentage of responses that take <= the time in the header and max is the max response time in seconds. For max values in the top 25% of the range have a red background and in the bottom 25% of the range have a green background. The red background is not used when the min value is within 80% of the max value.
| dbms | 256us | 1ms | 4ms | 16ms | 64ms | 256ms | 1s | 4s | 16s | gt | max |
|---|---|---|---|---|---|---|---|---|---|---|---|
| my5651_rel.cy10a_bee | 94.872 | 5.123 | 0.002 | 0.003 | 0.010 | ||||||
| my5651_rel.cy10a1_bee | 95.512 | 4.484 | 0.001 | 0.003 | 0.010 | ||||||
| my5651_rel.cy10a2_bee | 95.369 | 4.625 | 0.004 | 0.002 | nonzero | 0.024 | |||||
| my5651_rel.cy10a4_bee | 94.974 | 5.022 | 0.001 | 0.003 | 0.011 |
Insert response time histogram: each cell has the percentage of responses that take <= the time in the header and max is the max response time in seconds. For max values in the top 25% of the range have a red background and in the bottom 25% of the range have a green background. The red background is not used when the min value is within 80% of the max value.
| dbms | 256us | 1ms | 4ms | 16ms | 64ms | 256ms | 1s | 4s | 16s | gt | max |
|---|---|---|---|---|---|---|---|---|---|---|---|
| my5651_rel.cy10a_bee | 90.283 | 9.639 | 0.078 | 0.041 | |||||||
| my5651_rel.cy10a1_bee | 90.456 | 9.467 | 0.078 | 0.040 | |||||||
| my5651_rel.cy10a2_bee | 85.678 | 14.056 | 0.267 | 0.042 | |||||||
| my5651_rel.cy10a4_bee | 90.408 | 9.517 | 0.075 | 0.042 |
Delete response time histogram: each cell has the percentage of responses that take <= the time in the header and max is the max response time in seconds. For max values in the top 25% of the range have a red background and in the bottom 25% of the range have a green background. The red background is not used when the min value is within 80% of the max value.
| dbms | 256us | 1ms | 4ms | 16ms | 64ms | 256ms | 1s | 4s | 16s | gt | max |
|---|---|---|---|---|---|---|---|---|---|---|---|
| my5651_rel.cy10a_bee | 90.528 | 9.447 | 0.025 | 0.021 | |||||||
| my5651_rel.cy10a1_bee | 90.572 | 9.397 | 0.031 | 0.018 | |||||||
| my5651_rel.cy10a2_bee | 88.489 | 11.344 | 0.167 | 0.038 | |||||||
| my5651_rel.cy10a4_bee | 90.517 | 9.464 | 0.019 | 0.022 |
Performance metrics for the DBMS listed above. Some are normalized by throughput, others are not. Legend for results is here.
ips	qps	rps	rmbps	wps	wmbps	rpq	rkbpq	wpi	wkbpi	csps	cpups	cspq	cpupq	dbgb1	dbgb2	rss	maxop	p50	p99	tag
499	5274	17	0.1	49.3	1.9	0.003	0.013	0.099	3.985	20666	13.3	3.919	202	3.8	44.3	4.5	0.010	5229	5065	20m.my5651_rel.cy10a_bee
499	5397	17	0.1	2.8	0.5	0.003	0.012	0.006	1.105	20943	13.3	3.880	197	3.8	44.3	4.5	0.010	5354	5178	20m.my5651_rel.cy10a1_bee
499	5391	17	0.1	2103.2	63.8	0.003	0.012	4.217	131.060	28066	14.2	5.206	211	3.8	44.3	4.5	0.024	5353	5177	20m.my5651_rel.cy10a2_bee
498	5288	16	0.1	4.7	0.6	0.003	0.013	0.010	1.229	20593	13.4	3.894	203	3.8	44.3	4.5	0.011	5258	5082	20m.my5651_rel.cy10a4_bee
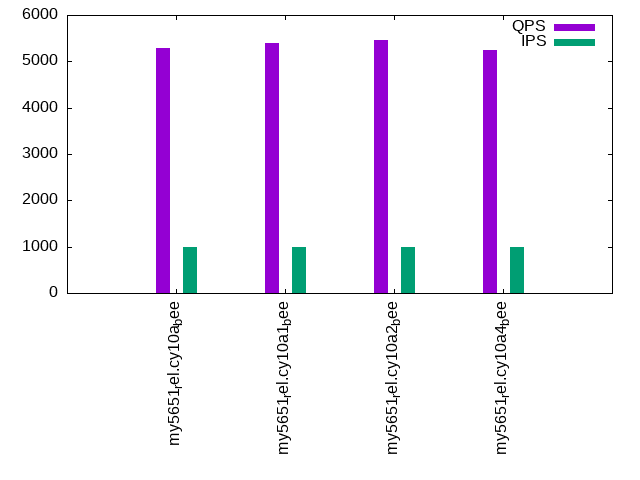
q1000.1
q1000.1: range queries with 1000 insert/s per client. Graphs for performance per 1-second interval are here.
Average throughput:
Query response time histogram: each cell has the percentage of responses that take <= the time in the header and max is the max response time in seconds. For max values in the top 25% of the range have a red background and in the bottom 25% of the range have a green background. The red background is not used when the min value is within 80% of the max value.
| dbms | 256us | 1ms | 4ms | 16ms | 64ms | 256ms | 1s | 4s | 16s | gt | max |
|---|---|---|---|---|---|---|---|---|---|---|---|
| my5651_rel.cy10a_bee | 94.613 | 5.381 | 0.003 | 0.003 | nonzero | 0.017 | |||||
| my5651_rel.cy10a1_bee | 95.305 | 4.687 | 0.004 | 0.003 | nonzero | 0.019 | |||||
| my5651_rel.cy10a2_bee | 95.409 | 4.580 | 0.007 | 0.003 | nonzero | 0.017 | |||||
| my5651_rel.cy10a4_bee | 94.489 | 5.495 | 0.005 | 0.012 | nonzero | 0.028 |
Insert response time histogram: each cell has the percentage of responses that take <= the time in the header and max is the max response time in seconds. For max values in the top 25% of the range have a red background and in the bottom 25% of the range have a green background. The red background is not used when the min value is within 80% of the max value.
| dbms | 256us | 1ms | 4ms | 16ms | 64ms | 256ms | 1s | 4s | 16s | gt | max |
|---|---|---|---|---|---|---|---|---|---|---|---|
| my5651_rel.cy10a_bee | 92.889 | 7.017 | 0.094 | 0.041 | |||||||
| my5651_rel.cy10a1_bee | 92.224 | 7.700 | 0.076 | 0.050 | |||||||
| my5651_rel.cy10a2_bee | 88.418 | 11.410 | 0.172 | 0.040 | |||||||
| my5651_rel.cy10a4_bee | 90.519 | 8.782 | 0.699 | 0.063 |
Delete response time histogram: each cell has the percentage of responses that take <= the time in the header and max is the max response time in seconds. For max values in the top 25% of the range have a red background and in the bottom 25% of the range have a green background. The red background is not used when the min value is within 80% of the max value.
| dbms | 256us | 1ms | 4ms | 16ms | 64ms | 256ms | 1s | 4s | 16s | gt | max |
|---|---|---|---|---|---|---|---|---|---|---|---|
| my5651_rel.cy10a_bee | 93.389 | 6.569 | 0.042 | 0.022 | |||||||
| my5651_rel.cy10a1_bee | 92.910 | 7.049 | 0.042 | 0.050 | |||||||
| my5651_rel.cy10a2_bee | 89.940 | 9.949 | 0.111 | 0.041 | |||||||
| my5651_rel.cy10a4_bee | 92.356 | 7.339 | 0.306 | 0.061 |
Performance metrics for the DBMS listed above. Some are normalized by throughput, others are not. Legend for results is here.
ips	qps	rps	rmbps	wps	wmbps	rpq	rkbpq	wpi	wkbpi	csps	cpups	cspq	cpupq	dbgb1	dbgb2	rss	maxop	p50	p99	tag
998	5292	33	0.1	398.1	12.9	0.006	0.025	0.399	13.241	22110	14.5	4.178	219	3.8	44.3	4.5	0.017	5242	5051	20m.my5651_rel.cy10a_bee
998	5400	33	0.1	652.9	21.0	0.006	0.024	0.654	21.575	22456	14.7	4.159	218	3.8	44.3	4.5	0.019	5354	5147	20m.my5651_rel.cy10a1_bee
998	5456	33	0.1	2754.9	84.0	0.006	0.024	2.761	86.213	30686	15.4	5.625	226	3.8	44.3	4.5	0.017	5404	5193	20m.my5651_rel.cy10a2_bee
996	5242	33	0.1	221.3	7.7	0.006	0.025	0.222	7.883	21103	14.5	4.026	221	3.8	44.3	4.5	0.028	5213	4877	20m.my5651_rel.cy10a4_bee
l.i0
l.i0: load without secondary indexes
Performance metrics for all DBMS, not just the ones listed above. Some are normalized by throughput, others are not. Legend for results is here.
ips	qps	rps	rmbps	wps	wmbps	rpq	rkbpq	wpi	wkbpi	csps	cpups	cspq	cpupq	dbgb1	dbgb2	rss	maxop	p50	p99	tag
100502	0	879	3.4	52.8	22.9	0.009	0.035	0.001	0.233	11461	21.8	0.114	17	1.3	41.8	2.1	0.097	100890	82384	20m.my5651_rel.cy10a_bee
100502	0	885	3.5	53.2	23.0	0.009	0.035	0.001	0.235	11511	21.9	0.115	17	1.3	41.8	2.1	0.094	101488	88203	20m.my5651_rel.cy10a1_bee
101010	0	884	3.5	53.2	23.0	0.009	0.035	0.001	0.233	11563	21.9	0.114	17	1.3	41.8	2.1	0.112	101493	87604	20m.my5651_rel.cy10a2_bee
98522	0	868	3.4	54.1	22.6	0.009	0.035	0.001	0.235	11324	21.7	0.115	18	1.3	41.8	2.1	0.097	99799	62452	20m.my5651_rel.cy10a4_bee
l.x
l.x: create secondary indexes
Performance metrics for all DBMS, not just the ones listed above. Some are normalized by throughput, others are not. Legend for results is here.
ips	qps	rps	rmbps	wps	wmbps	rpq	rkbpq	wpi	wkbpi	csps	cpups	cspq	cpupq	dbgb1	dbgb2	rss	maxop	p50	p99	tag
115517	0	19	0.1	1305.5	120.1	0.000	0.001	0.011	1.064	3912	11.6	0.034	8	2.7	43.2	3.5	0.016	NA	NA	20m.my5651_rel.cy10a_bee
110440	0	24	0.1	368.0	115.2	0.000	0.001	0.003	1.068	1039	11.1	0.009	8	2.7	43.2	3.5	0.008	NA	NA	20m.my5651_rel.cy10a1_bee
118235	0	19	0.1	1325.4	121.8	0.000	0.001	0.011	1.054	4046	11.8	0.034	8	2.7	43.2	3.5	0.011	NA	NA	20m.my5651_rel.cy10a2_bee
43506	0	25	0.1	350.2	46.8	0.001	0.002	0.008	1.101	2204	5.6	0.051	10	2.7	43.2	3.5	0.029	NA	NA	20m.my5651_rel.cy10a4_bee
l.i1
l.i1: continue load after secondary indexes created
Performance metrics for all DBMS, not just the ones listed above. Some are normalized by throughput, others are not. Legend for results is here.
ips	qps	rps	rmbps	wps	wmbps	rpq	rkbpq	wpi	wkbpi	csps	cpups	cspq	cpupq	dbgb1	dbgb2	rss	maxop	p50	p99	tag
19936	0	670	2.6	980.1	54.7	0.034	0.134	0.049	2.809	14090	34.4	0.707	138	3.8	44.3	4.5	0.098	21276	4997	20m.my5651_rel.cy10a_bee
19889	0	670	2.6	844.7	54.5	0.034	0.135	0.042	2.808	12914	34.3	0.649	138	3.8	44.3	4.5	0.097	21226	4894	20m.my5651_rel.cy10a1_bee
19810	0	666	2.6	1132.4	59.2	0.034	0.134	0.057	3.059	14530	34.3	0.733	139	3.8	44.3	4.5	0.101	21034	4945	20m.my5651_rel.cy10a2_bee
17135	0	574	2.2	781.9	47.9	0.033	0.134	0.046	2.860	11533	30.8	0.673	144	3.8	44.3	4.5	0.571	17588	4994	20m.my5651_rel.cy10a4_bee
q100.1
q100.1: range queries with 100 insert/s per client
Performance metrics for all DBMS, not just the ones listed above. Some are normalized by throughput, others are not. Legend for results is here.
ips	qps	rps	rmbps	wps	wmbps	rpq	rkbpq	wpi	wkbpi	csps	cpups	cspq	cpupq	dbgb1	dbgb2	rss	maxop	p50	p99	tag
100	5290	4	0.0	692.0	20.8	0.001	0.003	6.941	213.223	22694	13.1	4.290	198	3.8	44.3	4.5	0.016	5243	5066	20m.my5651_rel.cy10a_bee
100	5404	4	0.0	153.6	4.8	0.001	0.003	1.539	49.594	21101	12.9	3.905	191	3.8	44.3	4.5	0.016	5354	5178	20m.my5651_rel.cy10a1_bee
100	5392	4	0.0	709.0	21.2	0.001	0.003	7.111	218.218	23169	13.1	4.297	194	3.8	44.3	4.5	0.023	5354	5178	20m.my5651_rel.cy10a2_bee
100	5304	4	0.0	234.4	6.7	0.001	0.003	2.353	68.767	21041	13.2	3.967	199	3.8	44.3	4.5	0.022	5273	5097	20m.my5651_rel.cy10a4_bee
q500.1
q500.1: range queries with 500 insert/s per client
Performance metrics for all DBMS, not just the ones listed above. Some are normalized by throughput, others are not. Legend for results is here.
ips	qps	rps	rmbps	wps	wmbps	rpq	rkbpq	wpi	wkbpi	csps	cpups	cspq	cpupq	dbgb1	dbgb2	rss	maxop	p50	p99	tag
499	5274	17	0.1	49.3	1.9	0.003	0.013	0.099	3.985	20666	13.3	3.919	202	3.8	44.3	4.5	0.010	5229	5065	20m.my5651_rel.cy10a_bee
499	5397	17	0.1	2.8	0.5	0.003	0.012	0.006	1.105	20943	13.3	3.880	197	3.8	44.3	4.5	0.010	5354	5178	20m.my5651_rel.cy10a1_bee
499	5391	17	0.1	2103.2	63.8	0.003	0.012	4.217	131.060	28066	14.2	5.206	211	3.8	44.3	4.5	0.024	5353	5177	20m.my5651_rel.cy10a2_bee
498	5288	16	0.1	4.7	0.6	0.003	0.013	0.010	1.229	20593	13.4	3.894	203	3.8	44.3	4.5	0.011	5258	5082	20m.my5651_rel.cy10a4_bee
q1000.1
q1000.1: range queries with 1000 insert/s per client
Performance metrics for all DBMS, not just the ones listed above. Some are normalized by throughput, others are not. Legend for results is here.
ips	qps	rps	rmbps	wps	wmbps	rpq	rkbpq	wpi	wkbpi	csps	cpups	cspq	cpupq	dbgb1	dbgb2	rss	maxop	p50	p99	tag
998	5292	33	0.1	398.1	12.9	0.006	0.025	0.399	13.241	22110	14.5	4.178	219	3.8	44.3	4.5	0.017	5242	5051	20m.my5651_rel.cy10a_bee
998	5400	33	0.1	652.9	21.0	0.006	0.024	0.654	21.575	22456	14.7	4.159	218	3.8	44.3	4.5	0.019	5354	5147	20m.my5651_rel.cy10a1_bee
998	5456	33	0.1	2754.9	84.0	0.006	0.024	2.761	86.213	30686	15.4	5.625	226	3.8	44.3	4.5	0.017	5404	5193	20m.my5651_rel.cy10a2_bee
996	5242	33	0.1	221.3	7.7	0.006	0.025	0.222	7.883	21103	14.5	4.026	221	3.8	44.3	4.5	0.028	5213	4877	20m.my5651_rel.cy10a4_bee
l.i0
- l.i0: load without secondary indexes
- Legend for results is here.
- Each entry lists the percentage of responses that fit in that bucket (slower than max time for previous bucket, faster than min time for next bucket).
Insert response time histogram
256us	1ms	4ms	16ms	64ms	256ms	1s	4s	16s	gt	max	tag
0.000	92.000	7.895	0.101	0.001	0.003	0.000	0.000	0.000	0.000	0.097	my5651_rel.cy10a_bee
0.000	92.850	7.042	0.102	0.003	0.003	0.000	0.000	0.000	0.000	0.094	my5651_rel.cy10a1_bee
0.000	92.834	7.060	0.102	0.001	0.003	0.000	0.000	0.000	0.000	0.112	my5651_rel.cy10a2_bee
0.000	92.355	7.348	0.286	0.007	0.003	0.000	0.000	0.000	0.000	0.097	my5651_rel.cy10a4_bee
l.x
- l.x: create secondary indexes
- Legend for results is here.
- Each entry lists the percentage of responses that fit in that bucket (slower than max time for previous bucket, faster than min time for next bucket).
TODO - determine whether there is data for create index response time
l.i1
- l.i1: continue load after secondary indexes created
- Legend for results is here.
- Each entry lists the percentage of responses that fit in that bucket (slower than max time for previous bucket, faster than min time for next bucket).
Insert response time histogram
256us	1ms	4ms	16ms	64ms	256ms	1s	4s	16s	gt	max	tag
0.000	0.000	96.471	3.374	0.153	0.003	0.000	0.000	0.000	0.000	0.098	my5651_rel.cy10a_bee
0.000	0.000	96.243	3.594	0.161	0.002	0.000	0.000	0.000	0.000	0.097	my5651_rel.cy10a1_bee
0.000	0.000	96.180	3.653	0.166	0.002	0.000	0.000	0.000	0.000	0.101	my5651_rel.cy10a2_bee
0.000	0.000	93.384	5.652	0.963	0.001	nonzero	0.000	0.000	0.000	0.571	my5651_rel.cy10a4_bee
Delete response time histogram
256us	1ms	4ms	16ms	64ms	256ms	1s	4s	16s	gt	max	tag
0.000	0.000	97.512	2.372	0.114	0.003	0.000	0.000	0.000	0.000	0.076	my5651_rel.cy10a_bee
0.000	0.000	97.215	2.661	0.122	0.002	0.000	0.000	0.000	0.000	0.084	my5651_rel.cy10a1_bee
0.000	0.000	97.268	2.603	0.127	0.002	0.000	0.000	0.000	0.000	0.077	my5651_rel.cy10a2_bee
0.000	0.000	95.864	3.721	0.415	0.001	0.000	0.000	0.000	0.000	0.156	my5651_rel.cy10a4_bee
q100.1
- q100.1: range queries with 100 insert/s per client
- Legend for results is here.
- Each entry lists the percentage of responses that fit in that bucket (slower than max time for previous bucket, faster than min time for next bucket).
Query response time histogram
256us	1ms	4ms	16ms	64ms	256ms	1s	4s	16s	gt	max	tag
94.942	5.052	0.002	0.003	nonzero	0.000	0.000	0.000	0.000	0.000	0.016	my5651_rel.cy10a_bee
95.529	4.465	0.002	0.004	0.000	0.000	0.000	0.000	0.000	0.000	0.016	my5651_rel.cy10a1_bee
95.459	4.536	0.002	0.003	nonzero	0.000	0.000	0.000	0.000	0.000	0.023	my5651_rel.cy10a2_bee
95.024	4.969	0.003	0.005	nonzero	0.000	0.000	0.000	0.000	0.000	0.022	my5651_rel.cy10a4_bee
Insert response time histogram
256us	1ms	4ms	16ms	64ms	256ms	1s	4s	16s	gt	max	tag
0.000	0.000	52.278	46.847	0.875	0.000	0.000	0.000	0.000	0.000	0.026	my5651_rel.cy10a_bee
0.000	0.000	55.625	43.875	0.500	0.000	0.000	0.000	0.000	0.000	0.023	my5651_rel.cy10a1_bee
0.000	0.000	50.375	48.222	1.403	0.000	0.000	0.000	0.000	0.000	0.031	my5651_rel.cy10a2_bee
0.000	0.000	61.681	37.653	0.667	0.000	0.000	0.000	0.000	0.000	0.038	my5651_rel.cy10a4_bee
Delete response time histogram
256us	1ms	4ms	16ms	64ms	256ms	1s	4s	16s	gt	max	tag
0.000	0.000	53.806	45.819	0.375	0.000	0.000	0.000	0.000	0.000	0.024	my5651_rel.cy10a_bee
0.000	0.000	56.028	43.847	0.125	0.000	0.000	0.000	0.000	0.000	0.021	my5651_rel.cy10a1_bee
0.000	0.000	51.264	48.014	0.722	0.000	0.000	0.000	0.000	0.000	0.031	my5651_rel.cy10a2_bee
0.000	0.000	80.431	19.333	0.236	0.000	0.000	0.000	0.000	0.000	0.028	my5651_rel.cy10a4_bee
q500.1
- q500.1: range queries with 500 insert/s per client
- Legend for results is here.
- Each entry lists the percentage of responses that fit in that bucket (slower than max time for previous bucket, faster than min time for next bucket).
Query response time histogram
256us	1ms	4ms	16ms	64ms	256ms	1s	4s	16s	gt	max	tag
94.872	5.123	0.002	0.003	0.000	0.000	0.000	0.000	0.000	0.000	0.010	my5651_rel.cy10a_bee
95.512	4.484	0.001	0.003	0.000	0.000	0.000	0.000	0.000	0.000	0.010	my5651_rel.cy10a1_bee
95.369	4.625	0.004	0.002	nonzero	0.000	0.000	0.000	0.000	0.000	0.024	my5651_rel.cy10a2_bee
94.974	5.022	0.001	0.003	0.000	0.000	0.000	0.000	0.000	0.000	0.011	my5651_rel.cy10a4_bee
Insert response time histogram
256us	1ms	4ms	16ms	64ms	256ms	1s	4s	16s	gt	max	tag
0.000	0.000	90.283	9.639	0.078	0.000	0.000	0.000	0.000	0.000	0.041	my5651_rel.cy10a_bee
0.000	0.000	90.456	9.467	0.078	0.000	0.000	0.000	0.000	0.000	0.040	my5651_rel.cy10a1_bee
0.000	0.000	85.678	14.056	0.267	0.000	0.000	0.000	0.000	0.000	0.042	my5651_rel.cy10a2_bee
0.000	0.000	90.408	9.517	0.075	0.000	0.000	0.000	0.000	0.000	0.042	my5651_rel.cy10a4_bee
Delete response time histogram
256us	1ms	4ms	16ms	64ms	256ms	1s	4s	16s	gt	max	tag
0.000	0.000	90.528	9.447	0.025	0.000	0.000	0.000	0.000	0.000	0.021	my5651_rel.cy10a_bee
0.000	0.000	90.572	9.397	0.031	0.000	0.000	0.000	0.000	0.000	0.018	my5651_rel.cy10a1_bee
0.000	0.000	88.489	11.344	0.167	0.000	0.000	0.000	0.000	0.000	0.038	my5651_rel.cy10a2_bee
0.000	0.000	90.517	9.464	0.019	0.000	0.000	0.000	0.000	0.000	0.022	my5651_rel.cy10a4_bee
q1000.1
- q1000.1: range queries with 1000 insert/s per client
- Legend for results is here.
- Each entry lists the percentage of responses that fit in that bucket (slower than max time for previous bucket, faster than min time for next bucket).
Query response time histogram
256us	1ms	4ms	16ms	64ms	256ms	1s	4s	16s	gt	max	tag
94.613	5.381	0.003	0.003	nonzero	0.000	0.000	0.000	0.000	0.000	0.017	my5651_rel.cy10a_bee
95.305	4.687	0.004	0.003	nonzero	0.000	0.000	0.000	0.000	0.000	0.019	my5651_rel.cy10a1_bee
95.409	4.580	0.007	0.003	nonzero	0.000	0.000	0.000	0.000	0.000	0.017	my5651_rel.cy10a2_bee
94.489	5.495	0.005	0.012	nonzero	0.000	0.000	0.000	0.000	0.000	0.028	my5651_rel.cy10a4_bee
Insert response time histogram
256us	1ms	4ms	16ms	64ms	256ms	1s	4s	16s	gt	max	tag
0.000	0.000	92.889	7.017	0.094	0.000	0.000	0.000	0.000	0.000	0.041	my5651_rel.cy10a_bee
0.000	0.000	92.224	7.700	0.076	0.000	0.000	0.000	0.000	0.000	0.050	my5651_rel.cy10a1_bee
0.000	0.000	88.418	11.410	0.172	0.000	0.000	0.000	0.000	0.000	0.040	my5651_rel.cy10a2_bee
0.000	0.000	90.519	8.782	0.699	0.000	0.000	0.000	0.000	0.000	0.063	my5651_rel.cy10a4_bee
Delete response time histogram
256us	1ms	4ms	16ms	64ms	256ms	1s	4s	16s	gt	max	tag
0.000	0.000	93.389	6.569	0.042	0.000	0.000	0.000	0.000	0.000	0.022	my5651_rel.cy10a_bee
0.000	0.000	92.910	7.049	0.042	0.000	0.000	0.000	0.000	0.000	0.050	my5651_rel.cy10a1_bee
0.000	0.000	89.940	9.949	0.111	0.000	0.000	0.000	0.000	0.000	0.041	my5651_rel.cy10a2_bee
0.000	0.000	92.356	7.339	0.306	0.000	0.000	0.000	0.000	0.000	0.061	my5651_rel.cy10a4_bee