Introduction
This is a report for the insert benchmark with 20M docs and 1 client(s). It is generated by scripts (bash, awk, sed) and Tufte might not be impressed. An overview of the insert benchmark is here and a short update is here. Below, by DBMS, I mean DBMS+version.config. An example is my8020.c10b40 where my means MySQL, 8020 is version 8.0.20 and c10b40 is the name for the configuration file.
The test server has 8 AMD cores, 16G RAM and an NVMe SSD. It is described here as the Beelink. The benchmark was run with 1 client and there were 1 or 3 connections per client (1 for queries or inserts without rate limits, 1+1 for rate limited inserts+deletes). There is 1 table. It loads 20M rows without secondary indexes, creates secondary indexes, then inserts 50M rows with a delete per insert to avoid growing the table. It then does 3 read+write tests for 3600s each that do queries as fast as possible with 100, 500 and then 1000 inserts/second/client concurrent with the queries and 1000 deletes/second to avoid growing the table. The database is (or should be) cached by InnoDB.
The tested DBMS are:
- my5651_rel.cy10a_bee - InnoDB and MySQL 5.6.51, rel build, cy10a_bee config, compiled with CMAKE_BUILD_TYPE=Release, base config
- my5740_rel_lto.cy10a_bee - InnoDB and MySQL 5.7.40, rel_lto build, cy10a_bee config, compiled with CMAKE_BUILD_TYPE=Release, base config
- my8033_rel_lto.cy10a_bee - InnoDB and MySQL 8.0.33, rel_lto build, cy10a_bee config, compiled with CMAKE_BUILD_TYPE=Release, base config
Contents
- Summary
- l.i0: load without secondary indexes
- l.x: create secondary indexes
- l.i1: continue load after secondary indexes created
- q100.1: range queries with 100 insert/s per client
- q500.1: range queries with 500 insert/s per client
- q1000.1: range queries with 1000 insert/s per client
Summary
The numbers are inserts/s for l.i0 and l.i1, indexed docs (or rows) /s for l.x and queries/s for q100, q500, q1000. The values are the average rate over the entire test for inserts (IPS) and queries (QPS). The range of values for IPS and QPS is split into 3 parts: bottom 25%, middle 50%, top 25%. Values in the bottom 25% have a red background, values in the top 25% have a green background and values in the middle have no color. A gray background is used for values that can be ignored because the DBMS did not sustain the target insert rate. Red backgrounds are not used when the minimum value is within 80% of the max value.
| dbms | l.i0 | l.x | l.i1 | q100.1 | q500.1 | q1000.1 |
|---|---|---|---|---|---|---|
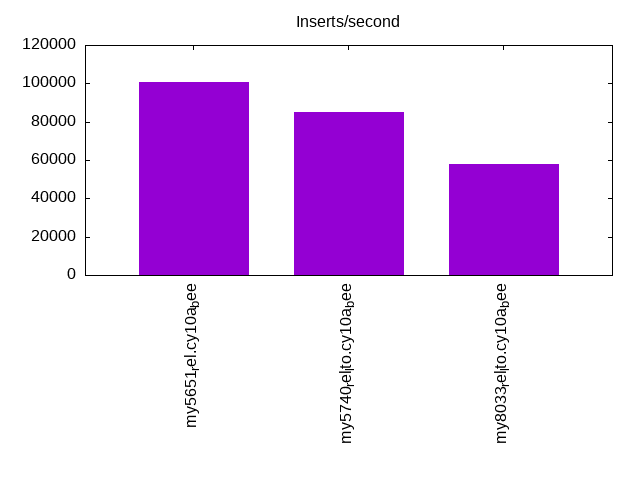
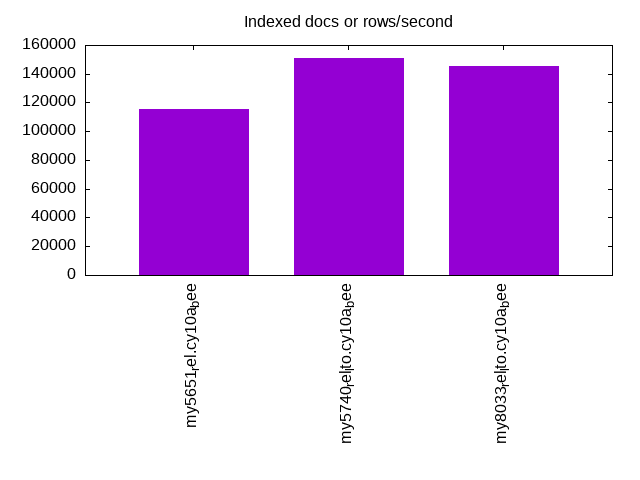
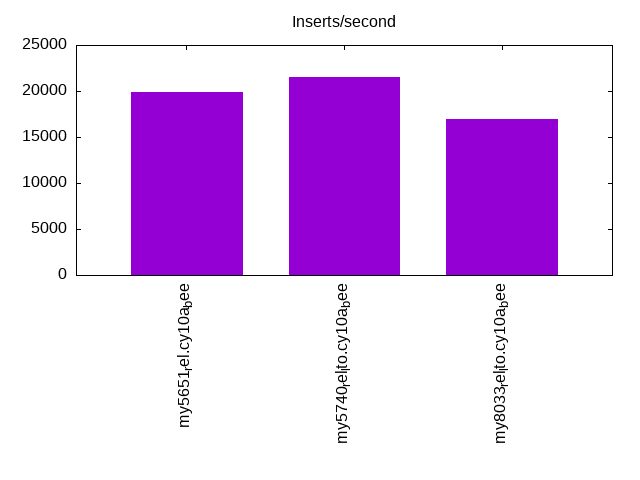
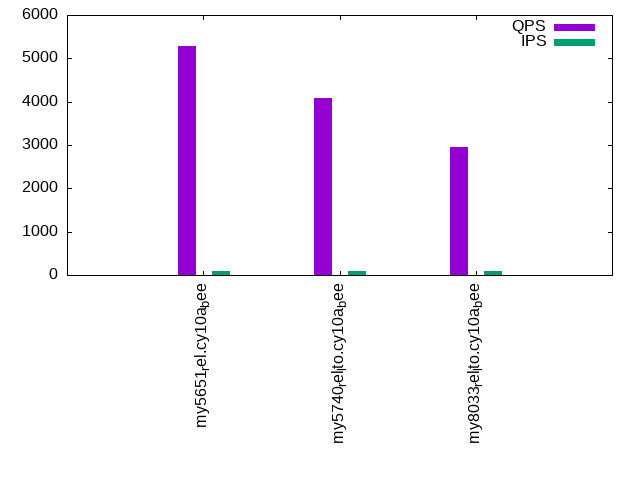
| my5651_rel.cy10a_bee | 100502 | 115517 | 19936 | 5290 | 5274 | 5292 |
| my5740_rel_lto.cy10a_bee | 85106 | 151128 | 21515 | 4093 | 4045 | 4108 |
| my8033_rel_lto.cy10a_bee | 58140 | 145652 | 16966 | 2953 | 2962 | 2983 |
This table has relative throughput, throughput for the DBMS relative to the DBMS in the first line, using the absolute throughput from the previous table. Values less than 0.95 have a yellow background. Values greater than 1.05 have a blue background.
| dbms | l.i0 | l.x | l.i1 | q100.1 | q500.1 | q1000.1 |
|---|---|---|---|---|---|---|
| my5651_rel.cy10a_bee | 1.00 | 1.00 | 1.00 | 1.00 | 1.00 | 1.00 |
| my5740_rel_lto.cy10a_bee | 0.85 | 1.31 | 1.08 | 0.77 | 0.77 | 0.78 |
| my8033_rel_lto.cy10a_bee | 0.58 | 1.26 | 0.85 | 0.56 | 0.56 | 0.56 |
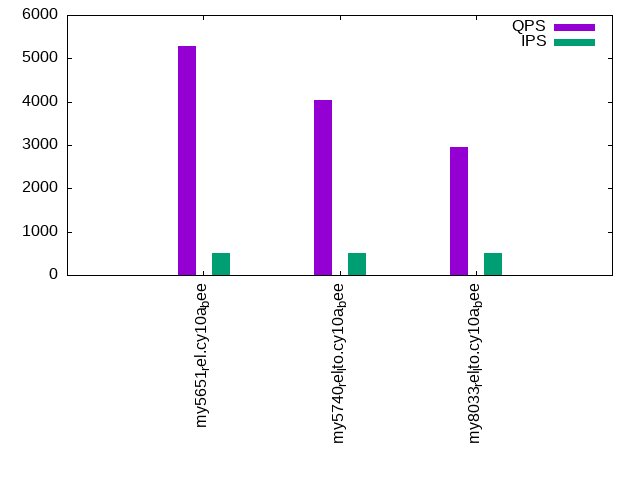
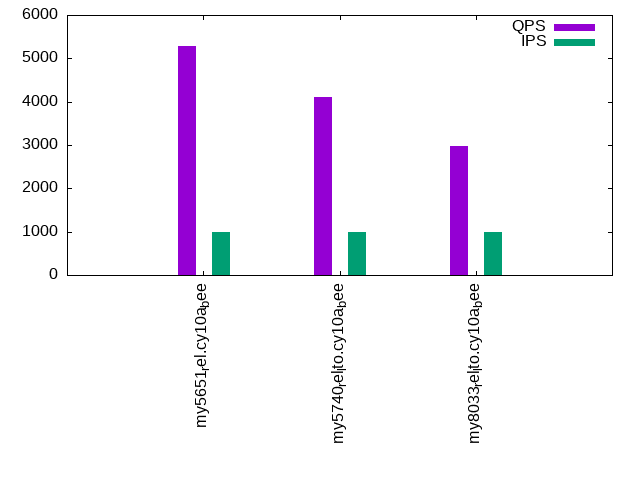
This lists the average rate of inserts/s for the tests that do inserts concurrent with queries. For such tests the query rate is listed in the table above. The read+write tests are setup so that the insert rate should match the target rate every second. Cells that are not at least 95% of the target have a red background to indicate a failure to satisfy the target.
| dbms | q100.1 | q500.1 | q1000.1 |
|---|---|---|---|
| my5651_rel.cy10a_bee | 100 | 499 | 998 |
| my5740_rel_lto.cy10a_bee | 100 | 499 | 998 |
| my8033_rel_lto.cy10a_bee | 100 | 499 | 997 |
| target | 100 | 500 | 1000 |
l.i0
l.i0: load without secondary indexes. Graphs for performance per 1-second interval are here.
Average throughput:
Insert response time histogram: each cell has the percentage of responses that take <= the time in the header and max is the max response time in seconds. For the max column values in the top 25% of the range have a red background and in the bottom 25% of the range have a green background. The red background is not used when the min value is within 80% of the max value.
| dbms | 256us | 1ms | 4ms | 16ms | 64ms | 256ms | 1s | 4s | 16s | gt | max |
|---|---|---|---|---|---|---|---|---|---|---|---|
| my5651_rel.cy10a_bee | 92.000 | 7.895 | 0.101 | 0.001 | 0.003 | 0.097 | |||||
| my5740_rel_lto.cy10a_bee | 5.303 | 94.348 | 0.204 | 0.143 | 0.003 | 0.103 | |||||
| my8033_rel_lto.cy10a_bee | 99.412 | 0.429 | 0.155 | 0.003 | 0.088 |
Performance metrics for the DBMS listed above. Some are normalized by throughput, others are not. Legend for results is here.
ips	qps	rps	rmbps	wps	wmbps	rpq	rkbpq	wpi	wkbpi	csps	cpups	cspq	cpupq	dbgb1	dbgb2	rss	maxop	p50	p99	tag
100502	0	879	3.4	52.8	22.9	0.009	0.035	0.001	0.233	11461	21.8	0.114	17	1.3	41.8	2.1	0.097	100890	82384	20m.my5651_rel.cy10a_bee
85106	0	0	0.0	134.2	21.6	0.000	0.000	0.002	0.259	8389	20.9	0.099	20	1.3	41.8	2.3	0.103	85636	48747	20m.my5740_rel_lto.cy10a_bee
58140	0	0	0.0	288.0	20.2	0.000	0.000	0.005	0.356	6745	20.3	0.116	28	1.3	9.9	2.5	0.088	58436	40395	20m.my8033_rel_lto.cy10a_bee
l.x
l.x: create secondary indexes.
Average throughput:
Performance metrics for the DBMS listed above. Some are normalized by throughput, others are not. Legend for results is here.
ips	qps	rps	rmbps	wps	wmbps	rpq	rkbpq	wpi	wkbpi	csps	cpups	cspq	cpupq	dbgb1	dbgb2	rss	maxop	p50	p99	tag
115517	0	19	0.1	1305.5	120.1	0.000	0.001	0.011	1.064	3912	11.6	0.034	8	2.7	43.2	3.5	0.016	NA	NA	20m.my5651_rel.cy10a_bee
151128	0	0	0.0	1576.3	134.7	0.000	0.000	0.010	0.912	9030	12.4	0.060	7	3.0	43.5	3.7	0.021	NA	NA	20m.my5740_rel_lto.cy10a_bee
145652	0	732	47.6	2494.5	147.1	0.005	0.335	0.017	1.034	10009	42.2	0.069	23	3.0	11.5	3.9	0.011	NA	NA	20m.my8033_rel_lto.cy10a_bee
l.i1
l.i1: continue load after secondary indexes created. Graphs for performance per 1-second interval are here.
Average throughput:
Insert response time histogram: each cell has the percentage of responses that take <= the time in the header and max is the max response time in seconds. For the max column values in the top 25% of the range have a red background and in the bottom 25% of the range have a green background. The red background is not used when the min value is within 80% of the max value.
| dbms | 256us | 1ms | 4ms | 16ms | 64ms | 256ms | 1s | 4s | 16s | gt | max |
|---|---|---|---|---|---|---|---|---|---|---|---|
| my5651_rel.cy10a_bee | 96.471 | 3.374 | 0.153 | 0.003 | 0.098 | ||||||
| my5740_rel_lto.cy10a_bee | 97.850 | 2.084 | 0.062 | 0.003 | 0.091 | ||||||
| my8033_rel_lto.cy10a_bee | 95.814 | 3.989 | 0.195 | 0.002 | 0.105 |
Delete response time histogram: each cell has the percentage of responses that take <= the time in the header and max is the max response time in seconds. For the max column values in the top 25% of the range have a red background and in the bottom 25% of the range have a green background. The red background is not used when the min value is within 80% of the max value.
| dbms | 256us | 1ms | 4ms | 16ms | 64ms | 256ms | 1s | 4s | 16s | gt | max |
|---|---|---|---|---|---|---|---|---|---|---|---|
| my5651_rel.cy10a_bee | 97.512 | 2.372 | 0.114 | 0.003 | 0.076 | ||||||
| my5740_rel_lto.cy10a_bee | 98.475 | 1.509 | 0.012 | 0.003 | 0.091 | ||||||
| my8033_rel_lto.cy10a_bee | 97.072 | 2.853 | 0.075 | 0.001 | 0.104 |
Performance metrics for the DBMS listed above. Some are normalized by throughput, others are not. Legend for results is here.
ips	qps	rps	rmbps	wps	wmbps	rpq	rkbpq	wpi	wkbpi	csps	cpups	cspq	cpupq	dbgb1	dbgb2	rss	maxop	p50	p99	tag
19936	0	670	2.6	980.1	54.7	0.034	0.134	0.049	2.809	14090	34.4	0.707	138	3.8	44.3	4.5	0.098	21276	4997	20m.my5651_rel.cy10a_bee
21515	0	0	0.0	1102.1	58.2	0.000	0.000	0.051	2.772	12216	37.8	0.568	141	4.4	45.0	5.5	0.091	22026	6143	20m.my5740_rel_lto.cy10a_bee
16966	0	31	0.5	3605.0	118.0	0.002	0.030	0.212	7.119	18949	36.3	1.117	171	4.3	13.1	5.6	0.105	17640	4345	20m.my8033_rel_lto.cy10a_bee
q100.1
q100.1: range queries with 100 insert/s per client. Graphs for performance per 1-second interval are here.
Average throughput:
Query response time histogram: each cell has the percentage of responses that take <= the time in the header and max is the max response time in seconds. For max values in the top 25% of the range have a red background and in the bottom 25% of the range have a green background. The red background is not used when the min value is within 80% of the max value.
| dbms | 256us | 1ms | 4ms | 16ms | 64ms | 256ms | 1s | 4s | 16s | gt | max |
|---|---|---|---|---|---|---|---|---|---|---|---|
| my5651_rel.cy10a_bee | 94.942 | 5.052 | 0.002 | 0.003 | nonzero | 0.016 | |||||
| my5740_rel_lto.cy10a_bee | 70.073 | 29.927 | nonzero | nonzero | 0.005 | ||||||
| my8033_rel_lto.cy10a_bee | 17.846 | 82.153 | 0.001 | nonzero | 0.005 |
Insert response time histogram: each cell has the percentage of responses that take <= the time in the header and max is the max response time in seconds. For max values in the top 25% of the range have a red background and in the bottom 25% of the range have a green background. The red background is not used when the min value is within 80% of the max value.
| dbms | 256us | 1ms | 4ms | 16ms | 64ms | 256ms | 1s | 4s | 16s | gt | max |
|---|---|---|---|---|---|---|---|---|---|---|---|
| my5651_rel.cy10a_bee | 52.278 | 46.847 | 0.875 | 0.026 | |||||||
| my5740_rel_lto.cy10a_bee | 99.625 | 0.375 | 0.012 | ||||||||
| my8033_rel_lto.cy10a_bee | 99.417 | 0.569 | 0.014 | 0.017 |
Delete response time histogram: each cell has the percentage of responses that take <= the time in the header and max is the max response time in seconds. For max values in the top 25% of the range have a red background and in the bottom 25% of the range have a green background. The red background is not used when the min value is within 80% of the max value.
| dbms | 256us | 1ms | 4ms | 16ms | 64ms | 256ms | 1s | 4s | 16s | gt | max |
|---|---|---|---|---|---|---|---|---|---|---|---|
| my5651_rel.cy10a_bee | 53.806 | 45.819 | 0.375 | 0.024 | |||||||
| my5740_rel_lto.cy10a_bee | 99.639 | 0.361 | 0.013 | ||||||||
| my8033_rel_lto.cy10a_bee | 99.542 | 0.458 | 0.013 |
Performance metrics for the DBMS listed above. Some are normalized by throughput, others are not. Legend for results is here.
ips	qps	rps	rmbps	wps	wmbps	rpq	rkbpq	wpi	wkbpi	csps	cpups	cspq	cpupq	dbgb1	dbgb2	rss	maxop	p50	p99	tag
100	5290	4	0.0	692.0	20.8	0.001	0.003	6.941	213.223	22694	13.1	4.290	198	3.8	44.3	4.5	0.016	5243	5066	20m.my5651_rel.cy10a_bee
100	4093	0	0.0	19.8	0.6	0.000	0.000	0.199	6.362	15903	12.5	3.886	244	4.4	45.0	5.5	0.005	4046	3836	20m.my5740_rel_lto.cy10a_bee
100	2953	0	0.0	66.2	1.6	0.000	0.000	0.663	16.320	11905	12.5	4.032	339	4.3	13.1	5.7	0.005	2938	2812	20m.my8033_rel_lto.cy10a_bee
q500.1
q500.1: range queries with 500 insert/s per client. Graphs for performance per 1-second interval are here.
Average throughput:
Query response time histogram: each cell has the percentage of responses that take <= the time in the header and max is the max response time in seconds. For max values in the top 25% of the range have a red background and in the bottom 25% of the range have a green background. The red background is not used when the min value is within 80% of the max value.
| dbms | 256us | 1ms | 4ms | 16ms | 64ms | 256ms | 1s | 4s | 16s | gt | max |
|---|---|---|---|---|---|---|---|---|---|---|---|
| my5651_rel.cy10a_bee | 94.872 | 5.123 | 0.002 | 0.003 | 0.010 | ||||||
| my5740_rel_lto.cy10a_bee | 69.074 | 30.926 | nonzero | nonzero | 0.005 | ||||||
| my8033_rel_lto.cy10a_bee | 18.029 | 81.970 | 0.001 | nonzero | 0.008 |
Insert response time histogram: each cell has the percentage of responses that take <= the time in the header and max is the max response time in seconds. For max values in the top 25% of the range have a red background and in the bottom 25% of the range have a green background. The red background is not used when the min value is within 80% of the max value.
| dbms | 256us | 1ms | 4ms | 16ms | 64ms | 256ms | 1s | 4s | 16s | gt | max |
|---|---|---|---|---|---|---|---|---|---|---|---|
| my5651_rel.cy10a_bee | 90.283 | 9.639 | 0.078 | 0.041 | |||||||
| my5740_rel_lto.cy10a_bee | 99.589 | 0.408 | 0.003 | 0.057 | |||||||
| my8033_rel_lto.cy10a_bee | 99.086 | 0.892 | 0.022 | 0.041 |
Delete response time histogram: each cell has the percentage of responses that take <= the time in the header and max is the max response time in seconds. For max values in the top 25% of the range have a red background and in the bottom 25% of the range have a green background. The red background is not used when the min value is within 80% of the max value.
| dbms | 256us | 1ms | 4ms | 16ms | 64ms | 256ms | 1s | 4s | 16s | gt | max |
|---|---|---|---|---|---|---|---|---|---|---|---|
| my5651_rel.cy10a_bee | 90.528 | 9.447 | 0.025 | 0.021 | |||||||
| my5740_rel_lto.cy10a_bee | 99.717 | 0.281 | 0.003 | 0.054 | |||||||
| my8033_rel_lto.cy10a_bee | 99.492 | 0.494 | 0.014 | 0.051 |
Performance metrics for the DBMS listed above. Some are normalized by throughput, others are not. Legend for results is here.
ips	qps	rps	rmbps	wps	wmbps	rpq	rkbpq	wpi	wkbpi	csps	cpups	cspq	cpupq	dbgb1	dbgb2	rss	maxop	p50	p99	tag
499	5274	17	0.1	49.3	1.9	0.003	0.013	0.099	3.985	20666	13.3	3.919	202	3.8	44.3	4.5	0.010	5229	5065	20m.my5651_rel.cy10a_bee
499	4045	0	0.0	22.2	1.1	0.000	0.000	0.044	2.216	15818	13.6	3.910	269	4.4	45.0	5.5	0.005	4011	3820	20m.my5740_rel_lto.cy10a_bee
499	2962	0	0.0	184.0	5.1	0.000	0.000	0.369	10.503	12411	13.5	4.190	365	4.3	13.1	5.7	0.008	2941	2798	20m.my8033_rel_lto.cy10a_bee
q1000.1
q1000.1: range queries with 1000 insert/s per client. Graphs for performance per 1-second interval are here.
Average throughput:
Query response time histogram: each cell has the percentage of responses that take <= the time in the header and max is the max response time in seconds. For max values in the top 25% of the range have a red background and in the bottom 25% of the range have a green background. The red background is not used when the min value is within 80% of the max value.
| dbms | 256us | 1ms | 4ms | 16ms | 64ms | 256ms | 1s | 4s | 16s | gt | max |
|---|---|---|---|---|---|---|---|---|---|---|---|
| my5651_rel.cy10a_bee | 94.613 | 5.381 | 0.003 | 0.003 | nonzero | 0.017 | |||||
| my5740_rel_lto.cy10a_bee | 70.407 | 29.592 | 0.001 | nonzero | 0.004 | ||||||
| my8033_rel_lto.cy10a_bee | 20.116 | 79.881 | 0.003 | nonzero | 0.008 |
Insert response time histogram: each cell has the percentage of responses that take <= the time in the header and max is the max response time in seconds. For max values in the top 25% of the range have a red background and in the bottom 25% of the range have a green background. The red background is not used when the min value is within 80% of the max value.
| dbms | 256us | 1ms | 4ms | 16ms | 64ms | 256ms | 1s | 4s | 16s | gt | max |
|---|---|---|---|---|---|---|---|---|---|---|---|
| my5651_rel.cy10a_bee | 92.889 | 7.017 | 0.094 | 0.041 | |||||||
| my5740_rel_lto.cy10a_bee | 99.599 | 0.399 | 0.003 | 0.049 | |||||||
| my8033_rel_lto.cy10a_bee | 97.456 | 2.518 | 0.026 | 0.053 |
Delete response time histogram: each cell has the percentage of responses that take <= the time in the header and max is the max response time in seconds. For max values in the top 25% of the range have a red background and in the bottom 25% of the range have a green background. The red background is not used when the min value is within 80% of the max value.
| dbms | 256us | 1ms | 4ms | 16ms | 64ms | 256ms | 1s | 4s | 16s | gt | max |
|---|---|---|---|---|---|---|---|---|---|---|---|
| my5651_rel.cy10a_bee | 93.389 | 6.569 | 0.042 | 0.022 | |||||||
| my5740_rel_lto.cy10a_bee | 99.717 | 0.281 | 0.003 | 0.048 | |||||||
| my8033_rel_lto.cy10a_bee | 99.340 | 0.642 | 0.018 | 0.050 |
Performance metrics for the DBMS listed above. Some are normalized by throughput, others are not. Legend for results is here.
ips	qps	rps	rmbps	wps	wmbps	rpq	rkbpq	wpi	wkbpi	csps	cpups	cspq	cpupq	dbgb1	dbgb2	rss	maxop	p50	p99	tag
998	5292	33	0.1	398.1	12.9	0.006	0.025	0.399	13.241	22110	14.5	4.178	219	3.8	44.3	4.5	0.017	5242	5051	20m.my5651_rel.cy10a_bee
998	4108	0	0.0	59.7	2.6	0.000	0.000	0.060	2.619	16366	14.5	3.984	282	4.4	45.0	5.5	0.004	4060	3851	20m.my5740_rel_lto.cy10a_bee
997	2983	0	0.0	382.7	10.7	0.000	0.000	0.384	11.027	13301	14.7	4.458	394	4.3	13.1	5.7	0.008	2959	2813	20m.my8033_rel_lto.cy10a_bee
l.i0
l.i0: load without secondary indexes
Performance metrics for all DBMS, not just the ones listed above. Some are normalized by throughput, others are not. Legend for results is here.
ips	qps	rps	rmbps	wps	wmbps	rpq	rkbpq	wpi	wkbpi	csps	cpups	cspq	cpupq	dbgb1	dbgb2	rss	maxop	p50	p99	tag
100502	0	879	3.4	52.8	22.9	0.009	0.035	0.001	0.233	11461	21.8	0.114	17	1.3	41.8	2.1	0.097	100890	82384	20m.my5651_rel.cy10a_bee
85106	0	0	0.0	134.2	21.6	0.000	0.000	0.002	0.259	8389	20.9	0.099	20	1.3	41.8	2.3	0.103	85636	48747	20m.my5740_rel_lto.cy10a_bee
58140	0	0	0.0	288.0	20.2	0.000	0.000	0.005	0.356	6745	20.3	0.116	28	1.3	9.9	2.5	0.088	58436	40395	20m.my8033_rel_lto.cy10a_bee
l.x
l.x: create secondary indexes
Performance metrics for all DBMS, not just the ones listed above. Some are normalized by throughput, others are not. Legend for results is here.
ips	qps	rps	rmbps	wps	wmbps	rpq	rkbpq	wpi	wkbpi	csps	cpups	cspq	cpupq	dbgb1	dbgb2	rss	maxop	p50	p99	tag
115517	0	19	0.1	1305.5	120.1	0.000	0.001	0.011	1.064	3912	11.6	0.034	8	2.7	43.2	3.5	0.016	NA	NA	20m.my5651_rel.cy10a_bee
151128	0	0	0.0	1576.3	134.7	0.000	0.000	0.010	0.912	9030	12.4	0.060	7	3.0	43.5	3.7	0.021	NA	NA	20m.my5740_rel_lto.cy10a_bee
145652	0	732	47.6	2494.5	147.1	0.005	0.335	0.017	1.034	10009	42.2	0.069	23	3.0	11.5	3.9	0.011	NA	NA	20m.my8033_rel_lto.cy10a_bee
l.i1
l.i1: continue load after secondary indexes created
Performance metrics for all DBMS, not just the ones listed above. Some are normalized by throughput, others are not. Legend for results is here.
ips	qps	rps	rmbps	wps	wmbps	rpq	rkbpq	wpi	wkbpi	csps	cpups	cspq	cpupq	dbgb1	dbgb2	rss	maxop	p50	p99	tag
19936	0	670	2.6	980.1	54.7	0.034	0.134	0.049	2.809	14090	34.4	0.707	138	3.8	44.3	4.5	0.098	21276	4997	20m.my5651_rel.cy10a_bee
21515	0	0	0.0	1102.1	58.2	0.000	0.000	0.051	2.772	12216	37.8	0.568	141	4.4	45.0	5.5	0.091	22026	6143	20m.my5740_rel_lto.cy10a_bee
16966	0	31	0.5	3605.0	118.0	0.002	0.030	0.212	7.119	18949	36.3	1.117	171	4.3	13.1	5.6	0.105	17640	4345	20m.my8033_rel_lto.cy10a_bee
q100.1
q100.1: range queries with 100 insert/s per client
Performance metrics for all DBMS, not just the ones listed above. Some are normalized by throughput, others are not. Legend for results is here.
ips	qps	rps	rmbps	wps	wmbps	rpq	rkbpq	wpi	wkbpi	csps	cpups	cspq	cpupq	dbgb1	dbgb2	rss	maxop	p50	p99	tag
100	5290	4	0.0	692.0	20.8	0.001	0.003	6.941	213.223	22694	13.1	4.290	198	3.8	44.3	4.5	0.016	5243	5066	20m.my5651_rel.cy10a_bee
100	4093	0	0.0	19.8	0.6	0.000	0.000	0.199	6.362	15903	12.5	3.886	244	4.4	45.0	5.5	0.005	4046	3836	20m.my5740_rel_lto.cy10a_bee
100	2953	0	0.0	66.2	1.6	0.000	0.000	0.663	16.320	11905	12.5	4.032	339	4.3	13.1	5.7	0.005	2938	2812	20m.my8033_rel_lto.cy10a_bee
q500.1
q500.1: range queries with 500 insert/s per client
Performance metrics for all DBMS, not just the ones listed above. Some are normalized by throughput, others are not. Legend for results is here.
ips	qps	rps	rmbps	wps	wmbps	rpq	rkbpq	wpi	wkbpi	csps	cpups	cspq	cpupq	dbgb1	dbgb2	rss	maxop	p50	p99	tag
499	5274	17	0.1	49.3	1.9	0.003	0.013	0.099	3.985	20666	13.3	3.919	202	3.8	44.3	4.5	0.010	5229	5065	20m.my5651_rel.cy10a_bee
499	4045	0	0.0	22.2	1.1	0.000	0.000	0.044	2.216	15818	13.6	3.910	269	4.4	45.0	5.5	0.005	4011	3820	20m.my5740_rel_lto.cy10a_bee
499	2962	0	0.0	184.0	5.1	0.000	0.000	0.369	10.503	12411	13.5	4.190	365	4.3	13.1	5.7	0.008	2941	2798	20m.my8033_rel_lto.cy10a_bee
q1000.1
q1000.1: range queries with 1000 insert/s per client
Performance metrics for all DBMS, not just the ones listed above. Some are normalized by throughput, others are not. Legend for results is here.
ips	qps	rps	rmbps	wps	wmbps	rpq	rkbpq	wpi	wkbpi	csps	cpups	cspq	cpupq	dbgb1	dbgb2	rss	maxop	p50	p99	tag
998	5292	33	0.1	398.1	12.9	0.006	0.025	0.399	13.241	22110	14.5	4.178	219	3.8	44.3	4.5	0.017	5242	5051	20m.my5651_rel.cy10a_bee
998	4108	0	0.0	59.7	2.6	0.000	0.000	0.060	2.619	16366	14.5	3.984	282	4.4	45.0	5.5	0.004	4060	3851	20m.my5740_rel_lto.cy10a_bee
997	2983	0	0.0	382.7	10.7	0.000	0.000	0.384	11.027	13301	14.7	4.458	394	4.3	13.1	5.7	0.008	2959	2813	20m.my8033_rel_lto.cy10a_bee
l.i0
- l.i0: load without secondary indexes
- Legend for results is here.
- Each entry lists the percentage of responses that fit in that bucket (slower than max time for previous bucket, faster than min time for next bucket).
Insert response time histogram
256us	1ms	4ms	16ms	64ms	256ms	1s	4s	16s	gt	max	tag
0.000	92.000	7.895	0.101	0.001	0.003	0.000	0.000	0.000	0.000	0.097	my5651_rel.cy10a_bee
0.000	5.303	94.348	0.204	0.143	0.003	0.000	0.000	0.000	0.000	0.103	my5740_rel_lto.cy10a_bee
0.000	0.000	99.412	0.429	0.155	0.003	0.000	0.000	0.000	0.000	0.088	my8033_rel_lto.cy10a_bee
l.x
- l.x: create secondary indexes
- Legend for results is here.
- Each entry lists the percentage of responses that fit in that bucket (slower than max time for previous bucket, faster than min time for next bucket).
TODO - determine whether there is data for create index response time
l.i1
- l.i1: continue load after secondary indexes created
- Legend for results is here.
- Each entry lists the percentage of responses that fit in that bucket (slower than max time for previous bucket, faster than min time for next bucket).
Insert response time histogram
256us	1ms	4ms	16ms	64ms	256ms	1s	4s	16s	gt	max	tag
0.000	0.000	96.471	3.374	0.153	0.003	0.000	0.000	0.000	0.000	0.098	my5651_rel.cy10a_bee
0.000	0.000	97.850	2.084	0.062	0.003	0.000	0.000	0.000	0.000	0.091	my5740_rel_lto.cy10a_bee
0.000	0.000	95.814	3.989	0.195	0.002	0.000	0.000	0.000	0.000	0.105	my8033_rel_lto.cy10a_bee
Delete response time histogram
256us	1ms	4ms	16ms	64ms	256ms	1s	4s	16s	gt	max	tag
0.000	0.000	97.512	2.372	0.114	0.003	0.000	0.000	0.000	0.000	0.076	my5651_rel.cy10a_bee
0.000	0.000	98.475	1.509	0.012	0.003	0.000	0.000	0.000	0.000	0.091	my5740_rel_lto.cy10a_bee
0.000	0.000	97.072	2.853	0.075	0.001	0.000	0.000	0.000	0.000	0.104	my8033_rel_lto.cy10a_bee
q100.1
- q100.1: range queries with 100 insert/s per client
- Legend for results is here.
- Each entry lists the percentage of responses that fit in that bucket (slower than max time for previous bucket, faster than min time for next bucket).
Query response time histogram
256us	1ms	4ms	16ms	64ms	256ms	1s	4s	16s	gt	max	tag
94.942	5.052	0.002	0.003	nonzero	0.000	0.000	0.000	0.000	0.000	0.016	my5651_rel.cy10a_bee
70.073	29.927	nonzero	nonzero	0.000	0.000	0.000	0.000	0.000	0.000	0.005	my5740_rel_lto.cy10a_bee
17.846	82.153	0.001	nonzero	0.000	0.000	0.000	0.000	0.000	0.000	0.005	my8033_rel_lto.cy10a_bee
Insert response time histogram
256us	1ms	4ms	16ms	64ms	256ms	1s	4s	16s	gt	max	tag
0.000	0.000	52.278	46.847	0.875	0.000	0.000	0.000	0.000	0.000	0.026	my5651_rel.cy10a_bee
0.000	0.000	99.625	0.375	0.000	0.000	0.000	0.000	0.000	0.000	0.012	my5740_rel_lto.cy10a_bee
0.000	0.000	99.417	0.569	0.014	0.000	0.000	0.000	0.000	0.000	0.017	my8033_rel_lto.cy10a_bee
Delete response time histogram
256us	1ms	4ms	16ms	64ms	256ms	1s	4s	16s	gt	max	tag
0.000	0.000	53.806	45.819	0.375	0.000	0.000	0.000	0.000	0.000	0.024	my5651_rel.cy10a_bee
0.000	0.000	99.639	0.361	0.000	0.000	0.000	0.000	0.000	0.000	0.013	my5740_rel_lto.cy10a_bee
0.000	0.000	99.542	0.458	0.000	0.000	0.000	0.000	0.000	0.000	0.013	my8033_rel_lto.cy10a_bee
q500.1
- q500.1: range queries with 500 insert/s per client
- Legend for results is here.
- Each entry lists the percentage of responses that fit in that bucket (slower than max time for previous bucket, faster than min time for next bucket).
Query response time histogram
256us	1ms	4ms	16ms	64ms	256ms	1s	4s	16s	gt	max	tag
94.872	5.123	0.002	0.003	0.000	0.000	0.000	0.000	0.000	0.000	0.010	my5651_rel.cy10a_bee
69.074	30.926	nonzero	nonzero	0.000	0.000	0.000	0.000	0.000	0.000	0.005	my5740_rel_lto.cy10a_bee
18.029	81.970	0.001	nonzero	0.000	0.000	0.000	0.000	0.000	0.000	0.008	my8033_rel_lto.cy10a_bee
Insert response time histogram
256us	1ms	4ms	16ms	64ms	256ms	1s	4s	16s	gt	max	tag
0.000	0.000	90.283	9.639	0.078	0.000	0.000	0.000	0.000	0.000	0.041	my5651_rel.cy10a_bee
0.000	0.000	99.589	0.408	0.003	0.000	0.000	0.000	0.000	0.000	0.057	my5740_rel_lto.cy10a_bee
0.000	0.000	99.086	0.892	0.022	0.000	0.000	0.000	0.000	0.000	0.041	my8033_rel_lto.cy10a_bee
Delete response time histogram
256us	1ms	4ms	16ms	64ms	256ms	1s	4s	16s	gt	max	tag
0.000	0.000	90.528	9.447	0.025	0.000	0.000	0.000	0.000	0.000	0.021	my5651_rel.cy10a_bee
0.000	0.000	99.717	0.281	0.003	0.000	0.000	0.000	0.000	0.000	0.054	my5740_rel_lto.cy10a_bee
0.000	0.000	99.492	0.494	0.014	0.000	0.000	0.000	0.000	0.000	0.051	my8033_rel_lto.cy10a_bee
q1000.1
- q1000.1: range queries with 1000 insert/s per client
- Legend for results is here.
- Each entry lists the percentage of responses that fit in that bucket (slower than max time for previous bucket, faster than min time for next bucket).
Query response time histogram
256us	1ms	4ms	16ms	64ms	256ms	1s	4s	16s	gt	max	tag
94.613	5.381	0.003	0.003	nonzero	0.000	0.000	0.000	0.000	0.000	0.017	my5651_rel.cy10a_bee
70.407	29.592	0.001	nonzero	0.000	0.000	0.000	0.000	0.000	0.000	0.004	my5740_rel_lto.cy10a_bee
20.116	79.881	0.003	nonzero	0.000	0.000	0.000	0.000	0.000	0.000	0.008	my8033_rel_lto.cy10a_bee
Insert response time histogram
256us	1ms	4ms	16ms	64ms	256ms	1s	4s	16s	gt	max	tag
0.000	0.000	92.889	7.017	0.094	0.000	0.000	0.000	0.000	0.000	0.041	my5651_rel.cy10a_bee
0.000	0.000	99.599	0.399	0.003	0.000	0.000	0.000	0.000	0.000	0.049	my5740_rel_lto.cy10a_bee
0.000	0.000	97.456	2.518	0.026	0.000	0.000	0.000	0.000	0.000	0.053	my8033_rel_lto.cy10a_bee
Delete response time histogram
256us	1ms	4ms	16ms	64ms	256ms	1s	4s	16s	gt	max	tag
0.000	0.000	93.389	6.569	0.042	0.000	0.000	0.000	0.000	0.000	0.022	my5651_rel.cy10a_bee
0.000	0.000	99.717	0.281	0.003	0.000	0.000	0.000	0.000	0.000	0.048	my5740_rel_lto.cy10a_bee
0.000	0.000	99.340	0.642	0.018	0.000	0.000	0.000	0.000	0.000	0.050	my8033_rel_lto.cy10a_bee