Introduction
This is a report for the insert benchmark with 4000M docs and 8 client(s). It is generated by scripts (bash, awk, sed) and Tufte might not be impressed. An overview of the insert benchmark is here and a short update is here. Below, by DBMS, I mean DBMS+version.config. An example is my8020.c10b40 where my means MySQL, 8020 is version 8.0.20 and c10b40 is the name for the configuration file.
The test server is a c2-standard-30 from GCP with 15 cores, hyperthreads disabled, 120G RAM, XFS + SW RAID 0 on 4 NVMe devices (1.5TB). The benchmark was run with 8 client and there were 1 or 3 connections per client (1 for queries or inserts without rate limits, 1+1 for rate limited inserts+deletes). There are 8 tables, client per table. It loads 500M rows per table without secondary indexes, creates secondary indexes, then inserts 200M rows with a delete per insert to avoid growing the table. It then does 3 read+write tests for 3600s each that do queries as fast as possible with 100, 500 and then 1000 inserts/second/client concurrent with the queries and 1000 deletes/second to avoid growing the table. The database is larger than memory.
The tested DBMS are:
- fbmy5635_rel_202104072149.cy9c_gcp_c2s30 - MyRocks and FB MySQL 5.6.35 from 20210407 and git hash (f896415f MySQL, 0f8c041e RocksDB), RocksDB 6.19.0, cy9c_gcp_c2s30 config
- fbmy5635_rel_202203072101.cy9c_gcp_c2s30 - MyRocks and FB MySQL 5.6.35 from 20220307 and git hash (e7d976ee MySQL, df4d3cf6 RocksDB), RocksDB 6.28.2, cy9c_gcp_c2s30 config
- fbmy5635_rel_202205192101.cy9c_gcp_c2s30 - MyRocks and FB MySQL 5.6.35 from 20220519 and git hash (d503bd77 MySQL, f2f26b15 RocksDB), RocksDB 7.2.2, cy9c_gcp_c2s30 config
- fbmy5635_rel_202208092101.cy9c_gcp_c2s30 - MyRocks and FB MySQL 5.6.35 from 20220809 and git hash (877a0e58 MySQL, 8e0f4952 RocksDB), RocksDB 7.3.1, cy9c_gcp_c2s30 config
- fbmy5635_rel_202210112144.cy9c_gcp_c2s30 - MyRocks and FB MySQL 5.6.35 from 20221011 and git hash (c691c716 MySQL, 8e0f4952 RocksDB), RocksDB 7.3.1, cy9c_gcp_c2s30 config
- fbmy5635_rel_202302162102.cy9c_gcp_c2s30 - MyRocks and FB MySQL 5.6.35 from 20230216 and git hash (21a2b0aa MySQL, e5dcebf7 RocksDB), RocksDB 7.10.0, cy9c_gcp_c2s30 config
- fbmy5635_rel_202304122154.cy9c_gcp_c2s30 - MyRocks and FB MySQL 5.6.35 from 20230412 and git hash (205c31dd MySQL, 3258b5c3 RocksDB), RocksDB 7.10.2, cy9c_gcp_c2s30 config
- fbmy5635_rel_202305292102.cy9c_gcp_c2s30 - MyRocks and FB MySQL 5.6.35 from 20230529 and git hash (b739eac1 MySQL, 03057204 RocksDB), RocksDB 8.2.1, cy9c_gcp_c2s30 config
- fbmy5635_rel_jun23_7e40af67.cy9c_gcp_c2s30 - MyRocks and FB MySQL 5.6.35 from June 2023 and git hash (7e40af67 MySQL, 03057204 RocksDB), RocksDB 8.2.1, cy9c_gcp_c2s30 config
Contents
- Summary
- l.i0: load without secondary indexes
- l.x: create secondary indexes
- l.i1: continue load after secondary indexes created
- q100.1: range queries with 100 insert/s per client
- q500.1: range queries with 500 insert/s per client
- q1000.1: range queries with 1000 insert/s per client
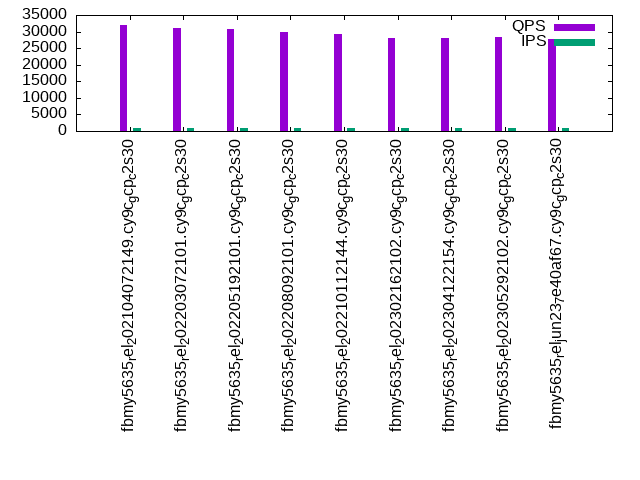
Summary
The numbers are inserts/s for l.i0 and l.i1, indexed docs (or rows) /s for l.x and queries/s for q*.2. The values are the average rate over the entire test for inserts (IPS) and queries (QPS). The range of values for IPS and QPS is split into 3 parts: bottom 25%, middle 50%, top 25%. Values in the bottom 25% have a red background, values in the top 25% have a green background and values in the middle have no color. A gray background is used for values that can be ignored because the DBMS did not sustain the target insert rate. Red backgrounds are not used when the minimum value is within 80% of the max value.
| dbms | l.i0 | l.x | l.i1 | q100.1 | q500.1 | q1000.1 |
|---|---|---|---|---|---|---|
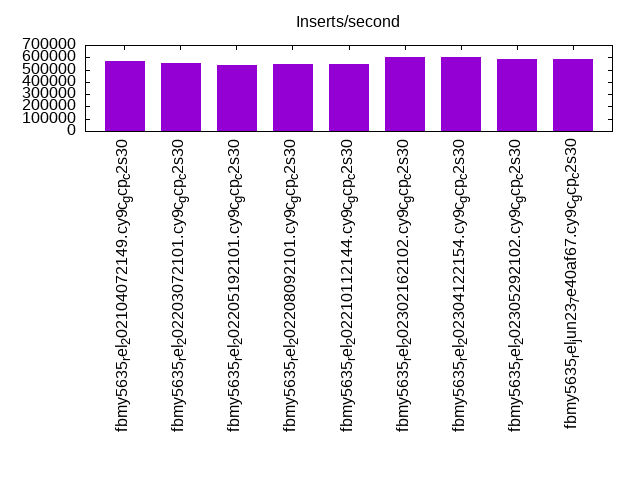
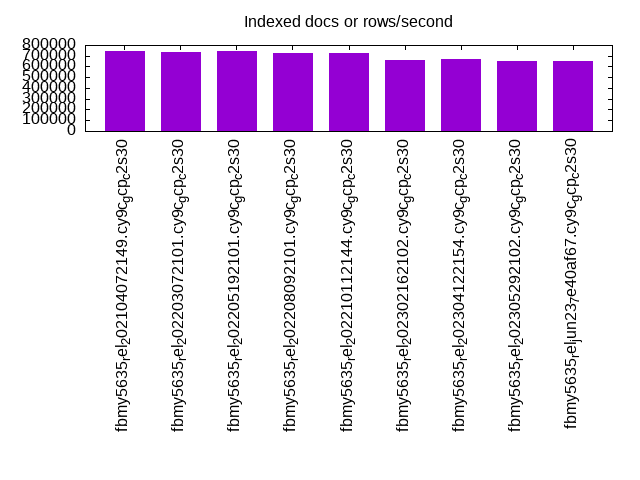
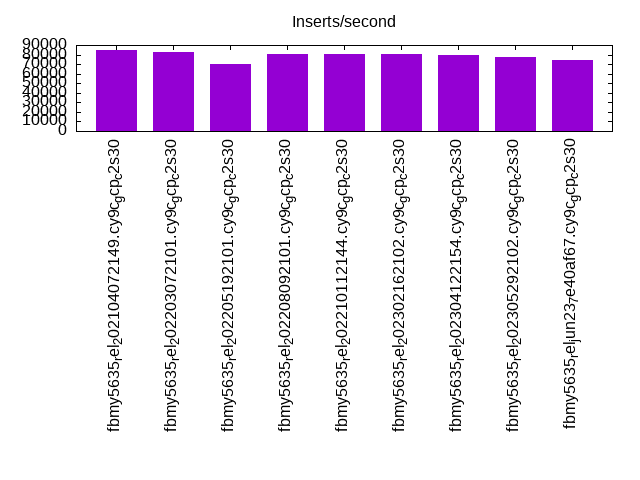
| fbmy5635_rel_202104072149.cy9c_gcp_c2s30 | 567134 | 743237 | 84971 | 31874 | 31475 | 30285 |
| fbmy5635_rel_202203072101.cy9c_gcp_c2s30 | 556328 | 739253 | 83108 | 31227 | 30649 | 29564 |
| fbmy5635_rel_202205192101.cy9c_gcp_c2s30 | 536769 | 742961 | 70553 | 30700 | 30482 | 28890 |
| fbmy5635_rel_202208092101.cy9c_gcp_c2s30 | 546896 | 722692 | 80972 | 29764 | 29242 | 28044 |
| fbmy5635_rel_202210112144.cy9c_gcp_c2s30 | 544440 | 725576 | 80633 | 29214 | 28903 | 27684 |
| fbmy5635_rel_202302162102.cy9c_gcp_c2s30 | 603682 | 662378 | 80281 | 28077 | 27964 | 26538 |
| fbmy5635_rel_202304122154.cy9c_gcp_c2s30 | 601052 | 666239 | 79713 | 28063 | 27808 | 26470 |
| fbmy5635_rel_202305292102.cy9c_gcp_c2s30 | 584112 | 653718 | 77685 | 28350 | 27900 | 26511 |
| fbmy5635_rel_jun23_7e40af67.cy9c_gcp_c2s30 | 583005 | 650000 | 74232 | 27781 | 27535 | 26127 |
This table has relative throughput, throughput for the DBMS relative to the DBMS in the first line, using the absolute throughput from the previous table. Values less than 0.95 have a yellow background. Values greater than 1.05 have a blue background.
| dbms | l.i0 | l.x | l.i1 | q100.1 | q500.1 | q1000.1 |
|---|---|---|---|---|---|---|
| fbmy5635_rel_202104072149.cy9c_gcp_c2s30 | 1.00 | 1.00 | 1.00 | 1.00 | 1.00 | 1.00 |
| fbmy5635_rel_202203072101.cy9c_gcp_c2s30 | 0.98 | 0.99 | 0.98 | 0.98 | 0.97 | 0.98 |
| fbmy5635_rel_202205192101.cy9c_gcp_c2s30 | 0.95 | 1.00 | 0.83 | 0.96 | 0.97 | 0.95 |
| fbmy5635_rel_202208092101.cy9c_gcp_c2s30 | 0.96 | 0.97 | 0.95 | 0.93 | 0.93 | 0.93 |
| fbmy5635_rel_202210112144.cy9c_gcp_c2s30 | 0.96 | 0.98 | 0.95 | 0.92 | 0.92 | 0.91 |
| fbmy5635_rel_202302162102.cy9c_gcp_c2s30 | 1.06 | 0.89 | 0.94 | 0.88 | 0.89 | 0.88 |
| fbmy5635_rel_202304122154.cy9c_gcp_c2s30 | 1.06 | 0.90 | 0.94 | 0.88 | 0.88 | 0.87 |
| fbmy5635_rel_202305292102.cy9c_gcp_c2s30 | 1.03 | 0.88 | 0.91 | 0.89 | 0.89 | 0.88 |
| fbmy5635_rel_jun23_7e40af67.cy9c_gcp_c2s30 | 1.03 | 0.87 | 0.87 | 0.87 | 0.87 | 0.86 |
This lists the average rate of inserts/s for the tests that do inserts concurrent with queries. For such tests the query rate is listed in the table above. The read+write tests are setup so that the insert rate should match the target rate every second. Cells that are not at least 95% of the target have a red background to indicate a failure to satisfy the target.
| dbms | q100.1 | q500.1 | q1000.1 |
|---|---|---|---|
| fbmy5635_rel_202104072149.cy9c_gcp_c2s30 | 797 | 3987 | 7973 |
| fbmy5635_rel_202203072101.cy9c_gcp_c2s30 | 797 | 3986 | 7973 |
| fbmy5635_rel_202205192101.cy9c_gcp_c2s30 | 797 | 3987 | 7976 |
| fbmy5635_rel_202208092101.cy9c_gcp_c2s30 | 797 | 3987 | 7973 |
| fbmy5635_rel_202210112144.cy9c_gcp_c2s30 | 797 | 3987 | 7973 |
| fbmy5635_rel_202302162102.cy9c_gcp_c2s30 | 789 | 3946 | 7934 |
| fbmy5635_rel_202304122154.cy9c_gcp_c2s30 | 788 | 3946 | 7930 |
| fbmy5635_rel_202305292102.cy9c_gcp_c2s30 | 791 | 3959 | 7947 |
| fbmy5635_rel_jun23_7e40af67.cy9c_gcp_c2s30 | 793 | 3965 | 7951 |
| target | 800 | 4000 | 8000 |
l.i0
l.i0: load without secondary indexes. Graphs for performance per 1-second interval are here.
Average throughput:
Insert response time histogram: each cell has the percentage of responses that take <= the time in the header and max is the max response time in seconds. For the max column values in the top 25% of the range have a red background and in the bottom 25% of the range have a green background. The red background is not used when the min value is within 80% of the max value.
| dbms | 256us | 1ms | 4ms | 16ms | 64ms | 256ms | 1s | 4s | 16s | gt | max |
|---|---|---|---|---|---|---|---|---|---|---|---|
| fbmy5635_rel_202104072149.cy9c_gcp_c2s30 | 17.912 | 82.029 | 0.042 | 0.002 | 0.013 | 0.001 | 0.446 | ||||
| fbmy5635_rel_202203072101.cy9c_gcp_c2s30 | 15.527 | 84.414 | 0.042 | 0.002 | 0.013 | 0.001 | 0.439 | ||||
| fbmy5635_rel_202205192101.cy9c_gcp_c2s30 | 16.442 | 83.504 | 0.038 | 0.002 | 0.013 | 0.001 | 0.463 | ||||
| fbmy5635_rel_202208092101.cy9c_gcp_c2s30 | 15.553 | 84.391 | 0.040 | 0.002 | 0.013 | 0.001 | 0.413 | ||||
| fbmy5635_rel_202210112144.cy9c_gcp_c2s30 | 15.679 | 84.265 | 0.039 | 0.003 | 0.013 | 0.001 | 0.436 | ||||
| fbmy5635_rel_202302162102.cy9c_gcp_c2s30 | 18.654 | 81.319 | 0.012 | 0.001 | 0.013 | nonzero | 0.356 | ||||
| fbmy5635_rel_202304122154.cy9c_gcp_c2s30 | 19.541 | 80.432 | 0.012 | 0.001 | 0.013 | nonzero | 0.355 | ||||
| fbmy5635_rel_202305292102.cy9c_gcp_c2s30 | 18.692 | 81.279 | 0.013 | 0.001 | 0.013 | nonzero | 0.355 | ||||
| fbmy5635_rel_jun23_7e40af67.cy9c_gcp_c2s30 | 20.027 | 79.944 | 0.014 | 0.001 | 0.013 | 0.001 | 0.369 |
Performance metrics for the DBMS listed above. Some are normalized by throughput, others are not. Legend for results is here.
ips	qps	rps	rmbps	wps	wmbps	rpq	rkbpq	wpi	wkbpi	csps	cpups	cspq	cpupq	dbgb1	dbgb2	rss	maxop	p50	p99	tag
567134	0	0	0.1	789.6	173.0	0.000	0.000	0.001	0.312	80468	74.0	0.142	20	125.7	127.1	NA	0.446	72421	48639	4000m.fbmy5635_rel_202104072149.cy9c_gcp_c2s30
556328	0	1	0.3	770.6	172.5	0.000	0.001	0.001	0.317	81384	73.6	0.146	20	125.5	127.1	NA	0.439	71023	48947	4000m.fbmy5635_rel_202203072101.cy9c_gcp_c2s30
536769	0	0	0.1	722.3	161.4	0.000	0.000	0.001	0.308	78403	73.2	0.146	20	125.7	127.3	NA	0.463	68324	47148	4000m.fbmy5635_rel_202205192101.cy9c_gcp_c2s30
546896	0	1	0.2	753.5	167.0	0.000	0.000	0.001	0.313	79477	73.2	0.145	20	125.7	127.3	NA	0.413	69724	48546	4000m.fbmy5635_rel_202208092101.cy9c_gcp_c2s30
544440	0	0	0.1	754.6	166.7	0.000	0.000	0.001	0.314	78906	73.1	0.145	20	125.7	127.3	NA	0.436	69524	47248	4000m.fbmy5635_rel_202210112144.cy9c_gcp_c2s30
603682	0	0	0.0	562.1	128.1	0.000	0.000	0.001	0.217	83565	73.6	0.138	18	125.4	127.0	NA	0.356	75445	54241	4000m.fbmy5635_rel_202302162102.cy9c_gcp_c2s30
601052	0	0	0.0	562.6	128.2	0.000	0.000	0.001	0.218	82046	73.5	0.137	18	124.2	125.8	NA	0.355	75218	54361	4000m.fbmy5635_rel_202304122154.cy9c_gcp_c2s30
584112	0	0	0.0	551.8	128.3	0.000	0.000	0.001	0.225	83088	73.4	0.142	19	124.8	126.4	NA	0.355	73004	52443	4000m.fbmy5635_rel_202305292102.cy9c_gcp_c2s30
583005	0	0	0.0	559.2	128.9	0.000	0.000	0.001	0.226	83446	73.4	0.143	19	125.3	126.9	NA	0.369	72720	51543	4000m.fbmy5635_rel_jun23_7e40af67.cy9c_gcp_c2s30
l.x
l.x: create secondary indexes.
Average throughput:
Performance metrics for the DBMS listed above. Some are normalized by throughput, others are not. Legend for results is here.
ips	qps	rps	rmbps	wps	wmbps	rpq	rkbpq	wpi	wkbpi	csps	cpups	cspq	cpupq	dbgb1	dbgb2	rss	maxop	p50	p99	tag
743237	0	565	115.9	289.2	84.7	0.001	0.160	0.000	0.117	2252	50.4	0.003	10	257.8	259.2	NA	0.002	NA	NA	4000m.fbmy5635_rel_202104072149.cy9c_gcp_c2s30
739253	0	554	111.9	285.9	82.8	0.001	0.155	0.000	0.115	2199	50.3	0.003	10	257.8	259.4	NA	0.003	NA	NA	4000m.fbmy5635_rel_202203072101.cy9c_gcp_c2s30
742961	0	550	111.7	287.2	83.8	0.001	0.154	0.000	0.116	2275	50.4	0.003	10	257.8	259.4	NA	0.003	NA	NA	4000m.fbmy5635_rel_202205192101.cy9c_gcp_c2s30
722692	0	515	104.1	282.1	79.3	0.001	0.147	0.000	0.112	2171	50.3	0.003	10	257.8	259.4	NA	0.003	NA	NA	4000m.fbmy5635_rel_202208092101.cy9c_gcp_c2s30
725576	0	531	106.4	280.8	81.5	0.001	0.150	0.000	0.115	2122	50.5	0.003	10	257.8	259.4	NA	0.004	NA	NA	4000m.fbmy5635_rel_202210112144.cy9c_gcp_c2s30
662378	0	477	96.8	252.7	74.6	0.001	0.150	0.000	0.115	1882	50.3	0.003	11	257.8	259.4	NA	0.004	NA	NA	4000m.fbmy5635_rel_202302162102.cy9c_gcp_c2s30
666239	0	476	96.9	254.4	74.6	0.001	0.149	0.000	0.115	1881	50.4	0.003	11	256.5	258.1	NA	0.005	NA	NA	4000m.fbmy5635_rel_202304122154.cy9c_gcp_c2s30
653718	0	473	96.2	250.7	74.4	0.001	0.151	0.000	0.117	1824	50.0	0.003	11	257.2	258.7	NA	0.002	NA	NA	4000m.fbmy5635_rel_202305292102.cy9c_gcp_c2s30
650000	0	483	97.2	248.4	73.9	0.001	0.153	0.000	0.116	1795	50.2	0.003	12	257.7	259.3	NA	0.004	NA	NA	4000m.fbmy5635_rel_jun23_7e40af67.cy9c_gcp_c2s30
l.i1
l.i1: continue load after secondary indexes created. Graphs for performance per 1-second interval are here.
Average throughput:
Insert response time histogram: each cell has the percentage of responses that take <= the time in the header and max is the max response time in seconds. For the max column values in the top 25% of the range have a red background and in the bottom 25% of the range have a green background. The red background is not used when the min value is within 80% of the max value.
| dbms | 256us | 1ms | 4ms | 16ms | 64ms | 256ms | 1s | 4s | 16s | gt | max |
|---|---|---|---|---|---|---|---|---|---|---|---|
| fbmy5635_rel_202104072149.cy9c_gcp_c2s30 | 0.035 | 35.195 | 64.624 | 0.135 | 0.009 | 0.002 | 0.475 | ||||
| fbmy5635_rel_202203072101.cy9c_gcp_c2s30 | 0.053 | 31.680 | 68.120 | 0.137 | 0.009 | 0.001 | 0.434 | ||||
| fbmy5635_rel_202205192101.cy9c_gcp_c2s30 | 0.018 | 29.699 | 68.527 | 1.669 | 0.065 | 0.021 | nonzero | 0.001 | nonzero | 194.078 | |
| fbmy5635_rel_202208092101.cy9c_gcp_c2s30 | 0.017 | 27.335 | 72.494 | 0.146 | 0.008 | 0.001 | 0.453 | ||||
| fbmy5635_rel_202210112144.cy9c_gcp_c2s30 | 0.014 | 26.494 | 73.337 | 0.147 | 0.007 | 0.001 | 0.432 | ||||
| fbmy5635_rel_202302162102.cy9c_gcp_c2s30 | 0.014 | 28.633 | 71.172 | 0.162 | 0.018 | 0.001 | 0.409 | ||||
| fbmy5635_rel_202304122154.cy9c_gcp_c2s30 | 0.021 | 27.840 | 71.912 | 0.198 | 0.028 | 0.001 | 0.440 | ||||
| fbmy5635_rel_202305292102.cy9c_gcp_c2s30 | 0.005 | 29.571 | 70.009 | 0.321 | 0.093 | nonzero | 0.560 | ||||
| fbmy5635_rel_jun23_7e40af67.cy9c_gcp_c2s30 | 0.006 | 29.112 | 70.236 | 0.431 | 0.206 | 0.010 | 0.537 |
Delete response time histogram: each cell has the percentage of responses that take <= the time in the header and max is the max response time in seconds. For the max column values in the top 25% of the range have a red background and in the bottom 25% of the range have a green background. The red background is not used when the min value is within 80% of the max value.
| dbms | 256us | 1ms | 4ms | 16ms | 64ms | 256ms | 1s | 4s | 16s | gt | max |
|---|---|---|---|---|---|---|---|---|---|---|---|
| fbmy5635_rel_202104072149.cy9c_gcp_c2s30 | 0.026 | 31.330 | 68.307 | 0.311 | 0.023 | 0.002 | 0.480 | ||||
| fbmy5635_rel_202203072101.cy9c_gcp_c2s30 | 0.050 | 28.880 | 70.735 | 0.312 | 0.022 | 0.001 | 0.434 | ||||
| fbmy5635_rel_202205192101.cy9c_gcp_c2s30 | 0.018 | 27.644 | 70.406 | 1.832 | 0.077 | 0.022 | nonzero | 0.001 | nonzero | 194.079 | |
| fbmy5635_rel_202208092101.cy9c_gcp_c2s30 | 0.016 | 24.781 | 74.833 | 0.348 | 0.022 | 0.001 | 0.453 | ||||
| fbmy5635_rel_202210112144.cy9c_gcp_c2s30 | 0.019 | 24.853 | 74.759 | 0.346 | 0.022 | 0.001 | 0.432 | ||||
| fbmy5635_rel_202302162102.cy9c_gcp_c2s30 | 0.012 | 25.003 | 74.623 | 0.327 | 0.035 | 0.001 | 0.409 | ||||
| fbmy5635_rel_202304122154.cy9c_gcp_c2s30 | 0.018 | 24.506 | 75.069 | 0.362 | 0.045 | 0.001 | 0.455 | ||||
| fbmy5635_rel_202305292102.cy9c_gcp_c2s30 | 0.003 | 25.140 | 74.246 | 0.496 | 0.114 | 0.001 | 0.876 | ||||
| fbmy5635_rel_jun23_7e40af67.cy9c_gcp_c2s30 | 0.004 | 24.624 | 74.531 | 0.604 | 0.227 | 0.011 | 0.849 |
Performance metrics for the DBMS listed above. Some are normalized by throughput, others are not. Legend for results is here.
ips	qps	rps	rmbps	wps	wmbps	rpq	rkbpq	wpi	wkbpi	csps	cpups	cspq	cpupq	dbgb1	dbgb2	rss	maxop	p50	p99	tag
84971	0	514	66.4	878.2	172.7	0.006	0.800	0.010	2.081	64933	65.2	0.764	115	283.4	285.2	NA	0.475	10738	7442	4000m.fbmy5635_rel_202104072149.cy9c_gcp_c2s30
83108	0	499	65.2	855.4	172.1	0.006	0.803	0.010	2.121	66790	65.0	0.804	117	281.5	281.8	NA	0.434	10488	8091	4000m.fbmy5635_rel_202203072101.cy9c_gcp_c2s30
70553	0	469	55.3	685.6	137.6	0.007	0.803	0.010	1.998	65442	58.4	0.928	124	285.1	285.2	NA	194.078	10093	0	4000m.fbmy5635_rel_202205192101.cy9c_gcp_c2s30
80972	0	512	66.9	875.4	169.3	0.006	0.846	0.011	2.141	61677	64.4	0.762	119	279.1	279.4	NA	0.453	10289	8041	4000m.fbmy5635_rel_202208092101.cy9c_gcp_c2s30
80633	0	507	66.3	870.1	168.7	0.006	0.842	0.011	2.143	60988	64.4	0.756	120	278.6	278.9	NA	0.432	10198	7991	4000m.fbmy5635_rel_202210112144.cy9c_gcp_c2s30
80281	0	492	52.6	674.6	140.6	0.006	0.671	0.008	1.793	61130	65.0	0.761	121	284.6	284.8	NA	0.409	9839	7095	4000m.fbmy5635_rel_202302162102.cy9c_gcp_c2s30
79713	0	486	52.0	666.0	139.0	0.006	0.668	0.008	1.785	61108	64.4	0.767	121	285.0	285.2	NA	0.440	9789	6495	4000m.fbmy5635_rel_202304122154.cy9c_gcp_c2s30
77685	0	504	50.7	612.7	137.7	0.006	0.669	0.008	1.815	62730	64.4	0.807	124	289.1	289.3	NA	0.560	9689	549	4000m.fbmy5635_rel_202305292102.cy9c_gcp_c2s30
74232	0	487	49.0	577.0	131.5	0.007	0.676	0.008	1.813	61093	62.4	0.823	126	286.8	286.9	NA	0.537	9544	250	4000m.fbmy5635_rel_jun23_7e40af67.cy9c_gcp_c2s30
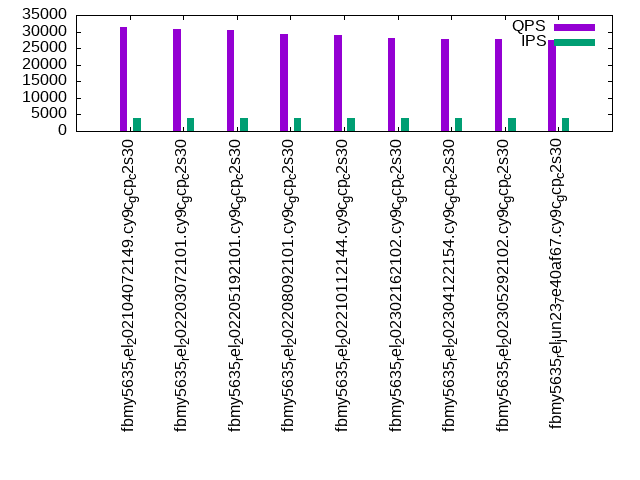
q100.1
q100.1: range queries with 100 insert/s per client. Graphs for performance per 1-second interval are here.
Average throughput:
Query response time histogram: each cell has the percentage of responses that take <= the time in the header and max is the max response time in seconds. For max values in the top 25% of the range have a red background and in the bottom 25% of the range have a green background. The red background is not used when the min value is within 80% of the max value.
| dbms | 256us | 1ms | 4ms | 16ms | 64ms | 256ms | 1s | 4s | 16s | gt | max |
|---|---|---|---|---|---|---|---|---|---|---|---|
| fbmy5635_rel_202104072149.cy9c_gcp_c2s30 | 72.850 | 26.999 | 0.149 | 0.001 | nonzero | nonzero | 0.102 | ||||
| fbmy5635_rel_202203072101.cy9c_gcp_c2s30 | 70.006 | 29.854 | 0.139 | 0.001 | nonzero | nonzero | 0.137 | ||||
| fbmy5635_rel_202205192101.cy9c_gcp_c2s30 | 68.810 | 30.964 | 0.223 | 0.003 | nonzero | nonzero | 0.080 | ||||
| fbmy5635_rel_202208092101.cy9c_gcp_c2s30 | 60.839 | 39.024 | 0.136 | 0.002 | nonzero | 0.061 | |||||
| fbmy5635_rel_202210112144.cy9c_gcp_c2s30 | 55.975 | 43.867 | 0.158 | 0.001 | nonzero | nonzero | 0.116 | ||||
| fbmy5635_rel_202302162102.cy9c_gcp_c2s30 | 54.354 | 45.312 | 0.330 | 0.004 | nonzero | nonzero | 0.134 | ||||
| fbmy5635_rel_202304122154.cy9c_gcp_c2s30 | 52.087 | 47.651 | 0.261 | 0.001 | nonzero | nonzero | 0.112 | ||||
| fbmy5635_rel_202305292102.cy9c_gcp_c2s30 | 55.984 | 43.697 | 0.317 | 0.002 | nonzero | nonzero | 0.111 | ||||
| fbmy5635_rel_jun23_7e40af67.cy9c_gcp_c2s30 | 49.784 | 49.882 | 0.333 | 0.001 | nonzero | 0.057 |
Insert response time histogram: each cell has the percentage of responses that take <= the time in the header and max is the max response time in seconds. For max values in the top 25% of the range have a red background and in the bottom 25% of the range have a green background. The red background is not used when the min value is within 80% of the max value.
| dbms | 256us | 1ms | 4ms | 16ms | 64ms | 256ms | 1s | 4s | 16s | gt | max |
|---|---|---|---|---|---|---|---|---|---|---|---|
| fbmy5635_rel_202104072149.cy9c_gcp_c2s30 | 5.818 | 94.141 | 0.042 | 0.015 | |||||||
| fbmy5635_rel_202203072101.cy9c_gcp_c2s30 | 2.576 | 97.382 | 0.042 | 0.014 | |||||||
| fbmy5635_rel_202205192101.cy9c_gcp_c2s30 | 0.865 | 99.021 | 0.104 | 0.009 | 0.002 | 0.067 | |||||
| fbmy5635_rel_202208092101.cy9c_gcp_c2s30 | 0.712 | 99.238 | 0.050 | 0.014 | |||||||
| fbmy5635_rel_202210112144.cy9c_gcp_c2s30 | 0.681 | 99.247 | 0.073 | 0.015 | |||||||
| fbmy5635_rel_202302162102.cy9c_gcp_c2s30 | 1.285 | 98.691 | 0.024 | 0.009 | |||||||
| fbmy5635_rel_202304122154.cy9c_gcp_c2s30 | 1.168 | 98.811 | 0.021 | 0.009 | |||||||
| fbmy5635_rel_202305292102.cy9c_gcp_c2s30 | 2.163 | 97.799 | 0.038 | 0.014 | |||||||
| fbmy5635_rel_jun23_7e40af67.cy9c_gcp_c2s30 | 1.595 | 98.372 | 0.031 | 0.002 | 0.076 |
Delete response time histogram: each cell has the percentage of responses that take <= the time in the header and max is the max response time in seconds. For max values in the top 25% of the range have a red background and in the bottom 25% of the range have a green background. The red background is not used when the min value is within 80% of the max value.
| dbms | 256us | 1ms | 4ms | 16ms | 64ms | 256ms | 1s | 4s | 16s | gt | max |
|---|---|---|---|---|---|---|---|---|---|---|---|
| fbmy5635_rel_202104072149.cy9c_gcp_c2s30 | 4.564 | 95.365 | 0.068 | 0.003 | 0.019 | ||||||
| fbmy5635_rel_202203072101.cy9c_gcp_c2s30 | 2.356 | 97.561 | 0.083 | 0.016 | |||||||
| fbmy5635_rel_202205192101.cy9c_gcp_c2s30 | 2.057 | 97.816 | 0.122 | 0.003 | 0.002 | 0.067 | |||||
| fbmy5635_rel_202208092101.cy9c_gcp_c2s30 | 1.429 | 98.470 | 0.095 | 0.005 | 0.023 | ||||||
| fbmy5635_rel_202210112144.cy9c_gcp_c2s30 | 0.884 | 99.019 | 0.090 | 0.007 | 0.028 | ||||||
| fbmy5635_rel_202302162102.cy9c_gcp_c2s30 | 1.425 | 98.483 | 0.092 | 0.010 | |||||||
| fbmy5635_rel_202304122154.cy9c_gcp_c2s30 | 1.693 | 98.241 | 0.066 | 0.011 | |||||||
| fbmy5635_rel_202305292102.cy9c_gcp_c2s30 | 2.050 | 97.849 | 0.097 | 0.003 | 0.027 | ||||||
| fbmy5635_rel_jun23_7e40af67.cy9c_gcp_c2s30 | 1.373 | 98.552 | 0.073 | 0.002 | 0.076 |
Performance metrics for the DBMS listed above. Some are normalized by throughput, others are not. Legend for results is here.
ips	qps	rps	rmbps	wps	wmbps	rpq	rkbpq	wpi	wkbpi	csps	cpups	cspq	cpupq	dbgb1	dbgb2	rss	maxop	p50	p99	tag
797	31874	850	9.7	26.3	4.2	0.027	0.313	0.033	5.345	127008	53.0	3.985	249	277.0	277.4	NA	0.102	4061	1758	4000m.fbmy5635_rel_202104072149.cy9c_gcp_c2s30
797	31227	860	8.5	17.2	2.5	0.028	0.279	0.022	3.222	124860	52.6	3.998	253	277.1	278.0	NA	0.137	3949	1982	4000m.fbmy5635_rel_202203072101.cy9c_gcp_c2s30
797	30700	890	12.1	32.4	4.8	0.029	0.404	0.041	6.125	122305	53.7	3.984	262	276.7	277.6	NA	0.080	3932	1678	4000m.fbmy5635_rel_202205192101.cy9c_gcp_c2s30
797	29764	804	7.5	19.9	2.7	0.027	0.260	0.025	3.431	120146	52.4	4.037	264	277.8	278.7	NA	0.061	3804	1998	4000m.fbmy5635_rel_202208092101.cy9c_gcp_c2s30
797	29214	840	8.0	21.2	3.1	0.029	0.281	0.027	3.956	118383	52.5	4.052	270	277.5	278.3	NA	0.116	3724	1999	4000m.fbmy5635_rel_202210112144.cy9c_gcp_c2s30
789	28077	969	10.0	17.7	2.8	0.035	0.366	0.022	3.696	113334	51.8	4.037	277	283.3	284.2	NA	0.134	3660	1726	4000m.fbmy5635_rel_202302162102.cy9c_gcp_c2s30
788	28063	951	10.3	20.1	3.1	0.034	0.376	0.025	3.982	113393	52.1	4.041	278	283.2	284.0	NA	0.112	3660	1726	4000m.fbmy5635_rel_202304122154.cy9c_gcp_c2s30
791	28350	1000	10.7	25.2	4.1	0.035	0.387	0.032	5.294	114361	52.5	4.034	278	282.6	283.4	NA	0.111	3692	1630	4000m.fbmy5635_rel_202305292102.cy9c_gcp_c2s30
793	27781	1010	10.3	19.5	3.0	0.036	0.379	0.025	3.821	112492	52.3	4.049	282	282.6	283.5	NA	0.057	3580	1838	4000m.fbmy5635_rel_jun23_7e40af67.cy9c_gcp_c2s30
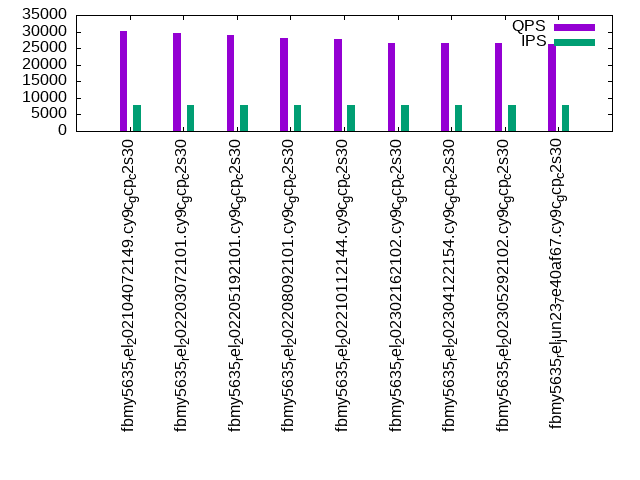
q500.1
q500.1: range queries with 500 insert/s per client. Graphs for performance per 1-second interval are here.
Average throughput:
Query response time histogram: each cell has the percentage of responses that take <= the time in the header and max is the max response time in seconds. For max values in the top 25% of the range have a red background and in the bottom 25% of the range have a green background. The red background is not used when the min value is within 80% of the max value.
| dbms | 256us | 1ms | 4ms | 16ms | 64ms | 256ms | 1s | 4s | 16s | gt | max |
|---|---|---|---|---|---|---|---|---|---|---|---|
| fbmy5635_rel_202104072149.cy9c_gcp_c2s30 | 68.166 | 31.826 | 0.007 | nonzero | nonzero | 0.038 | |||||
| fbmy5635_rel_202203072101.cy9c_gcp_c2s30 | 63.703 | 36.288 | 0.008 | nonzero | nonzero | 0.049 | |||||
| fbmy5635_rel_202205192101.cy9c_gcp_c2s30 | 63.089 | 36.903 | 0.007 | nonzero | nonzero | 0.046 | |||||
| fbmy5635_rel_202208092101.cy9c_gcp_c2s30 | 52.540 | 47.451 | 0.009 | nonzero | 0.001 | 0.049 | |||||
| fbmy5635_rel_202210112144.cy9c_gcp_c2s30 | 48.252 | 51.738 | 0.009 | nonzero | 0.001 | 0.039 | |||||
| fbmy5635_rel_202302162102.cy9c_gcp_c2s30 | 45.306 | 54.681 | 0.011 | nonzero | 0.001 | 0.042 | |||||
| fbmy5635_rel_202304122154.cy9c_gcp_c2s30 | 43.004 | 56.982 | 0.013 | nonzero | 0.001 | 0.042 | |||||
| fbmy5635_rel_202305292102.cy9c_gcp_c2s30 | 43.597 | 56.392 | 0.010 | nonzero | 0.001 | 0.042 | |||||
| fbmy5635_rel_jun23_7e40af67.cy9c_gcp_c2s30 | 39.031 | 60.957 | 0.012 | nonzero | 0.001 | 0.041 |
Insert response time histogram: each cell has the percentage of responses that take <= the time in the header and max is the max response time in seconds. For max values in the top 25% of the range have a red background and in the bottom 25% of the range have a green background. The red background is not used when the min value is within 80% of the max value.
| dbms | 256us | 1ms | 4ms | 16ms | 64ms | 256ms | 1s | 4s | 16s | gt | max |
|---|---|---|---|---|---|---|---|---|---|---|---|
| fbmy5635_rel_202104072149.cy9c_gcp_c2s30 | 20.985 | 79.000 | 0.014 | 0.001 | 0.033 | ||||||
| fbmy5635_rel_202203072101.cy9c_gcp_c2s30 | 5.323 | 94.599 | 0.076 | 0.001 | 0.035 | ||||||
| fbmy5635_rel_202205192101.cy9c_gcp_c2s30 | 3.557 | 96.422 | 0.019 | 0.001 | 0.046 | ||||||
| fbmy5635_rel_202208092101.cy9c_gcp_c2s30 | 1.871 | 97.831 | 0.298 | 0.001 | 0.029 | ||||||
| fbmy5635_rel_202210112144.cy9c_gcp_c2s30 | 0.694 | 98.515 | 0.788 | 0.003 | 0.038 | ||||||
| fbmy5635_rel_202302162102.cy9c_gcp_c2s30 | 2.760 | 95.499 | 1.734 | 0.007 | 0.039 | ||||||
| fbmy5635_rel_202304122154.cy9c_gcp_c2s30 | 2.014 | 89.687 | 8.283 | 0.017 | 0.039 | ||||||
| fbmy5635_rel_202305292102.cy9c_gcp_c2s30 | 4.739 | 95.215 | 0.045 | 0.001 | 0.037 | ||||||
| fbmy5635_rel_jun23_7e40af67.cy9c_gcp_c2s30 | 3.336 | 92.348 | 4.309 | 0.007 | 0.020 |
Delete response time histogram: each cell has the percentage of responses that take <= the time in the header and max is the max response time in seconds. For max values in the top 25% of the range have a red background and in the bottom 25% of the range have a green background. The red background is not used when the min value is within 80% of the max value.
| dbms | 256us | 1ms | 4ms | 16ms | 64ms | 256ms | 1s | 4s | 16s | gt | max |
|---|---|---|---|---|---|---|---|---|---|---|---|
| fbmy5635_rel_202104072149.cy9c_gcp_c2s30 | 21.126 | 78.800 | 0.066 | 0.007 | 0.052 | ||||||
| fbmy5635_rel_202203072101.cy9c_gcp_c2s30 | 6.731 | 93.136 | 0.128 | 0.005 | 0.060 | ||||||
| fbmy5635_rel_202205192101.cy9c_gcp_c2s30 | 6.328 | 93.569 | 0.096 | 0.007 | 0.046 | ||||||
| fbmy5635_rel_202208092101.cy9c_gcp_c2s30 | 3.075 | 96.592 | 0.331 | 0.002 | 0.038 | ||||||
| fbmy5635_rel_202210112144.cy9c_gcp_c2s30 | 1.373 | 97.823 | 0.796 | 0.008 | 0.046 | ||||||
| fbmy5635_rel_202302162102.cy9c_gcp_c2s30 | 4.413 | 93.806 | 1.772 | 0.009 | 0.040 | ||||||
| fbmy5635_rel_202304122154.cy9c_gcp_c2s30 | 4.110 | 87.918 | 7.955 | 0.017 | 0.041 | ||||||
| fbmy5635_rel_202305292102.cy9c_gcp_c2s30 | 6.925 | 92.977 | 0.093 | 0.005 | 0.041 | ||||||
| fbmy5635_rel_jun23_7e40af67.cy9c_gcp_c2s30 | 5.110 | 90.723 | 4.157 | 0.011 | 0.042 |
Performance metrics for the DBMS listed above. Some are normalized by throughput, others are not. Legend for results is here.
ips	qps	rps	rmbps	wps	wmbps	rpq	rkbpq	wpi	wkbpi	csps	cpups	cspq	cpupq	dbgb1	dbgb2	rss	maxop	p50	p99	tag
3987	31475	80	2.9	51.8	9.4	0.003	0.095	0.013	2.410	125976	55.4	4.002	264	277.0	278.4	NA	0.038	3916	3660	4000m.fbmy5635_rel_202104072149.cy9c_gcp_c2s30
3986	30649	87	3.6	54.8	9.5	0.003	0.119	0.014	2.445	123172	55.6	4.019	272	277.0	278.9	NA	0.049	3804	3548	4000m.fbmy5635_rel_202203072101.cy9c_gcp_c2s30
3987	30482	76	3.5	53.3	9.4	0.003	0.116	0.013	2.405	122448	55.7	4.017	274	276.8	278.7	NA	0.046	3788	3516	4000m.fbmy5635_rel_202205192101.cy9c_gcp_c2s30
3987	29242	86	3.3	55.1	9.9	0.003	0.115	0.014	2.555	119201	55.5	4.076	285	278.1	280.1	NA	0.049	3660	3404	4000m.fbmy5635_rel_202208092101.cy9c_gcp_c2s30
3987	28903	79	3.4	55.5	9.5	0.003	0.121	0.014	2.446	118142	55.5	4.088	288	277.3	279.3	NA	0.039	3628	3388	4000m.fbmy5635_rel_202210112144.cy9c_gcp_c2s30
3946	27964	99	4.2	46.0	7.1	0.004	0.155	0.012	1.835	112911	55.1	4.038	296	283.3	285.2	NA	0.042	3532	3228	4000m.fbmy5635_rel_202302162102.cy9c_gcp_c2s30
3946	27808	100	4.6	46.7	7.8	0.004	0.168	0.012	2.033	112371	55.4	4.041	299	283.3	285.2	NA	0.042	3532	3212	4000m.fbmy5635_rel_202304122154.cy9c_gcp_c2s30
3959	27900	93	3.9	46.7	7.8	0.003	0.144	0.012	2.018	112703	55.4	4.039	298	282.5	284.5	NA	0.042	3548	3180	4000m.fbmy5635_rel_202305292102.cy9c_gcp_c2s30
3965	27535	105	3.8	46.1	7.4	0.004	0.140	0.012	1.914	111416	55.5	4.046	302	282.6	284.6	NA	0.041	3484	3149	4000m.fbmy5635_rel_jun23_7e40af67.cy9c_gcp_c2s30
q1000.1
q1000.1: range queries with 1000 insert/s per client. Graphs for performance per 1-second interval are here.
Average throughput:
Query response time histogram: each cell has the percentage of responses that take <= the time in the header and max is the max response time in seconds. For max values in the top 25% of the range have a red background and in the bottom 25% of the range have a green background. The red background is not used when the min value is within 80% of the max value.
| dbms | 256us | 1ms | 4ms | 16ms | 64ms | 256ms | 1s | 4s | 16s | gt | max |
|---|---|---|---|---|---|---|---|---|---|---|---|
| fbmy5635_rel_202104072149.cy9c_gcp_c2s30 | 60.359 | 39.625 | 0.015 | 0.001 | nonzero | 0.032 | |||||
| fbmy5635_rel_202203072101.cy9c_gcp_c2s30 | 55.522 | 44.461 | 0.016 | nonzero | nonzero | 0.054 | |||||
| fbmy5635_rel_202205192101.cy9c_gcp_c2s30 | 49.317 | 50.667 | 0.016 | 0.001 | nonzero | nonzero | 0.078 | ||||
| fbmy5635_rel_202208092101.cy9c_gcp_c2s30 | 39.655 | 60.327 | 0.017 | nonzero | nonzero | 0.052 | |||||
| fbmy5635_rel_202210112144.cy9c_gcp_c2s30 | 34.915 | 65.066 | 0.018 | 0.001 | nonzero | 0.038 | |||||
| fbmy5635_rel_202302162102.cy9c_gcp_c2s30 | 27.060 | 72.913 | 0.026 | 0.001 | nonzero | nonzero | 0.330 | ||||
| fbmy5635_rel_202304122154.cy9c_gcp_c2s30 | 26.400 | 73.573 | 0.026 | 0.001 | nonzero | 0.031 | |||||
| fbmy5635_rel_202305292102.cy9c_gcp_c2s30 | 26.556 | 73.398 | 0.045 | 0.001 | nonzero | 0.037 | |||||
| fbmy5635_rel_jun23_7e40af67.cy9c_gcp_c2s30 | 22.438 | 77.538 | 0.023 | 0.001 | nonzero | 0.039 |
Insert response time histogram: each cell has the percentage of responses that take <= the time in the header and max is the max response time in seconds. For max values in the top 25% of the range have a red background and in the bottom 25% of the range have a green background. The red background is not used when the min value is within 80% of the max value.
| dbms | 256us | 1ms | 4ms | 16ms | 64ms | 256ms | 1s | 4s | 16s | gt | max |
|---|---|---|---|---|---|---|---|---|---|---|---|
| fbmy5635_rel_202104072149.cy9c_gcp_c2s30 | 15.990 | 83.958 | 0.052 | 0.001 | 0.026 | ||||||
| fbmy5635_rel_202203072101.cy9c_gcp_c2s30 | 2.950 | 96.436 | 0.611 | 0.002 | 0.031 | ||||||
| fbmy5635_rel_202205192101.cy9c_gcp_c2s30 | 1.096 | 98.835 | 0.067 | 0.001 | 0.026 | ||||||
| fbmy5635_rel_202208092101.cy9c_gcp_c2s30 | 1.486 | 98.454 | 0.059 | 0.001 | 0.025 | ||||||
| fbmy5635_rel_202210112144.cy9c_gcp_c2s30 | 0.880 | 99.046 | 0.072 | 0.002 | nonzero | 0.080 | |||||
| fbmy5635_rel_202302162102.cy9c_gcp_c2s30 | 1.548 | 84.840 | 13.589 | 0.023 | 0.029 | ||||||
| fbmy5635_rel_202304122154.cy9c_gcp_c2s30 | 1.497 | 84.906 | 13.582 | 0.015 | 0.029 | ||||||
| fbmy5635_rel_202305292102.cy9c_gcp_c2s30 | 0.466 | 51.015 | 48.433 | 0.087 | 0.055 | ||||||
| fbmy5635_rel_jun23_7e40af67.cy9c_gcp_c2s30 | 1.476 | 93.784 | 4.729 | 0.011 | 0.054 |
Delete response time histogram: each cell has the percentage of responses that take <= the time in the header and max is the max response time in seconds. For max values in the top 25% of the range have a red background and in the bottom 25% of the range have a green background. The red background is not used when the min value is within 80% of the max value.
| dbms | 256us | 1ms | 4ms | 16ms | 64ms | 256ms | 1s | 4s | 16s | gt | max |
|---|---|---|---|---|---|---|---|---|---|---|---|
| fbmy5635_rel_202104072149.cy9c_gcp_c2s30 | 17.427 | 82.466 | 0.101 | 0.006 | 0.038 | ||||||
| fbmy5635_rel_202203072101.cy9c_gcp_c2s30 | 3.824 | 95.466 | 0.698 | 0.012 | 0.047 | ||||||
| fbmy5635_rel_202205192101.cy9c_gcp_c2s30 | 2.739 | 97.065 | 0.185 | 0.011 | 0.051 | ||||||
| fbmy5635_rel_202208092101.cy9c_gcp_c2s30 | 2.526 | 97.356 | 0.110 | 0.007 | 0.044 | ||||||
| fbmy5635_rel_202210112144.cy9c_gcp_c2s30 | 1.854 | 97.973 | 0.163 | 0.009 | nonzero | 0.081 | |||||
| fbmy5635_rel_202302162102.cy9c_gcp_c2s30 | 2.196 | 84.091 | 13.682 | 0.031 | nonzero | 0.322 | |||||
| fbmy5635_rel_202304122154.cy9c_gcp_c2s30 | 2.899 | 83.298 | 13.778 | 0.025 | 0.050 | ||||||
| fbmy5635_rel_202305292102.cy9c_gcp_c2s30 | 1.142 | 50.768 | 47.985 | 0.104 | 0.056 | ||||||
| fbmy5635_rel_jun23_7e40af67.cy9c_gcp_c2s30 | 2.498 | 92.812 | 4.674 | 0.016 | 0.057 |
Performance metrics for the DBMS listed above. Some are normalized by throughput, others are not. Legend for results is here.
ips	qps	rps	rmbps	wps	wmbps	rpq	rkbpq	wpi	wkbpi	csps	cpups	cspq	cpupq	dbgb1	dbgb2	rss	maxop	p50	p99	tag
7973	30285	117	5.7	109.3	18.2	0.004	0.194	0.014	2.338	123556	58.9	4.080	292	277.1	278.7	NA	0.032	3821	3596	4000m.fbmy5635_rel_202104072149.cy9c_gcp_c2s30
7973	29564	119	5.6	105.8	18.2	0.004	0.193	0.013	2.337	120834	58.8	4.087	298	277.2	277.3	NA	0.054	3692	3468	4000m.fbmy5635_rel_202203072101.cy9c_gcp_c2s30
7976	28890	139	6.4	109.4	18.6	0.005	0.228	0.014	2.388	118707	59.5	4.109	309	276.9	277.0	NA	0.078	3581	3308	4000m.fbmy5635_rel_202205192101.cy9c_gcp_c2s30
7973	28044	121	6.0	107.0	18.0	0.004	0.219	0.013	2.313	117155	58.9	4.177	315	278.4	278.5	NA	0.052	3516	3262	4000m.fbmy5635_rel_202208092101.cy9c_gcp_c2s30
7973	27684	122	6.2	108.9	18.1	0.004	0.231	0.014	2.328	116077	59.0	4.193	320	277.3	277.4	NA	0.038	3470	3228	4000m.fbmy5635_rel_202210112144.cy9c_gcp_c2s30
7934	26538	128	5.2	93.7	15.1	0.005	0.199	0.012	1.955	109112	59.1	4.112	334	283.4	283.5	NA	0.330	3340	2973	4000m.fbmy5635_rel_202302162102.cy9c_gcp_c2s30
7930	26470	138	5.5	91.5	14.6	0.005	0.212	0.012	1.888	108809	59.0	4.111	334	283.5	283.5	NA	0.031	3308	2990	4000m.fbmy5635_rel_202304122154.cy9c_gcp_c2s30
7947	26511	133	5.1	89.3	15.2	0.005	0.197	0.011	1.953	108227	59.3	4.082	336	282.7	282.8	NA	0.037	3372	3038	4000m.fbmy5635_rel_202305292102.cy9c_gcp_c2s30
7951	26127	142	5.3	90.8	16.0	0.005	0.208	0.011	2.064	107677	59.5	4.121	342	282.9	283.1	NA	0.039	3276	2973	4000m.fbmy5635_rel_jun23_7e40af67.cy9c_gcp_c2s30
l.i0
l.i0: load without secondary indexes
Performance metrics for all DBMS, not just the ones listed above. Some are normalized by throughput, others are not. Legend for results is here.
ips	qps	rps	rmbps	wps	wmbps	rpq	rkbpq	wpi	wkbpi	csps	cpups	cspq	cpupq	dbgb1	dbgb2	rss	maxop	p50	p99	tag
567134	0	0	0.1	789.6	173.0	0.000	0.000	0.001	0.312	80468	74.0	0.142	20	125.7	127.1	NA	0.446	72421	48639	4000m.fbmy5635_rel_202104072149.cy9c_gcp_c2s30
556328	0	1	0.3	770.6	172.5	0.000	0.001	0.001	0.317	81384	73.6	0.146	20	125.5	127.1	NA	0.439	71023	48947	4000m.fbmy5635_rel_202203072101.cy9c_gcp_c2s30
536769	0	0	0.1	722.3	161.4	0.000	0.000	0.001	0.308	78403	73.2	0.146	20	125.7	127.3	NA	0.463	68324	47148	4000m.fbmy5635_rel_202205192101.cy9c_gcp_c2s30
546896	0	1	0.2	753.5	167.0	0.000	0.000	0.001	0.313	79477	73.2	0.145	20	125.7	127.3	NA	0.413	69724	48546	4000m.fbmy5635_rel_202208092101.cy9c_gcp_c2s30
544440	0	0	0.1	754.6	166.7	0.000	0.000	0.001	0.314	78906	73.1	0.145	20	125.7	127.3	NA	0.436	69524	47248	4000m.fbmy5635_rel_202210112144.cy9c_gcp_c2s30
603682	0	0	0.0	562.1	128.1	0.000	0.000	0.001	0.217	83565	73.6	0.138	18	125.4	127.0	NA	0.356	75445	54241	4000m.fbmy5635_rel_202302162102.cy9c_gcp_c2s30
601052	0	0	0.0	562.6	128.2	0.000	0.000	0.001	0.218	82046	73.5	0.137	18	124.2	125.8	NA	0.355	75218	54361	4000m.fbmy5635_rel_202304122154.cy9c_gcp_c2s30
584112	0	0	0.0	551.8	128.3	0.000	0.000	0.001	0.225	83088	73.4	0.142	19	124.8	126.4	NA	0.355	73004	52443	4000m.fbmy5635_rel_202305292102.cy9c_gcp_c2s30
583005	0	0	0.0	559.2	128.9	0.000	0.000	0.001	0.226	83446	73.4	0.143	19	125.3	126.9	NA	0.369	72720	51543	4000m.fbmy5635_rel_jun23_7e40af67.cy9c_gcp_c2s30
l.x
l.x: create secondary indexes
Performance metrics for all DBMS, not just the ones listed above. Some are normalized by throughput, others are not. Legend for results is here.
ips	qps	rps	rmbps	wps	wmbps	rpq	rkbpq	wpi	wkbpi	csps	cpups	cspq	cpupq	dbgb1	dbgb2	rss	maxop	p50	p99	tag
743237	0	565	115.9	289.2	84.7	0.001	0.160	0.000	0.117	2252	50.4	0.003	10	257.8	259.2	NA	0.002	NA	NA	4000m.fbmy5635_rel_202104072149.cy9c_gcp_c2s30
739253	0	554	111.9	285.9	82.8	0.001	0.155	0.000	0.115	2199	50.3	0.003	10	257.8	259.4	NA	0.003	NA	NA	4000m.fbmy5635_rel_202203072101.cy9c_gcp_c2s30
742961	0	550	111.7	287.2	83.8	0.001	0.154	0.000	0.116	2275	50.4	0.003	10	257.8	259.4	NA	0.003	NA	NA	4000m.fbmy5635_rel_202205192101.cy9c_gcp_c2s30
722692	0	515	104.1	282.1	79.3	0.001	0.147	0.000	0.112	2171	50.3	0.003	10	257.8	259.4	NA	0.003	NA	NA	4000m.fbmy5635_rel_202208092101.cy9c_gcp_c2s30
725576	0	531	106.4	280.8	81.5	0.001	0.150	0.000	0.115	2122	50.5	0.003	10	257.8	259.4	NA	0.004	NA	NA	4000m.fbmy5635_rel_202210112144.cy9c_gcp_c2s30
662378	0	477	96.8	252.7	74.6	0.001	0.150	0.000	0.115	1882	50.3	0.003	11	257.8	259.4	NA	0.004	NA	NA	4000m.fbmy5635_rel_202302162102.cy9c_gcp_c2s30
666239	0	476	96.9	254.4	74.6	0.001	0.149	0.000	0.115	1881	50.4	0.003	11	256.5	258.1	NA	0.005	NA	NA	4000m.fbmy5635_rel_202304122154.cy9c_gcp_c2s30
653718	0	473	96.2	250.7	74.4	0.001	0.151	0.000	0.117	1824	50.0	0.003	11	257.2	258.7	NA	0.002	NA	NA	4000m.fbmy5635_rel_202305292102.cy9c_gcp_c2s30
650000	0	483	97.2	248.4	73.9	0.001	0.153	0.000	0.116	1795	50.2	0.003	12	257.7	259.3	NA	0.004	NA	NA	4000m.fbmy5635_rel_jun23_7e40af67.cy9c_gcp_c2s30
l.i1
l.i1: continue load after secondary indexes created
Performance metrics for all DBMS, not just the ones listed above. Some are normalized by throughput, others are not. Legend for results is here.
ips	qps	rps	rmbps	wps	wmbps	rpq	rkbpq	wpi	wkbpi	csps	cpups	cspq	cpupq	dbgb1	dbgb2	rss	maxop	p50	p99	tag
84971	0	514	66.4	878.2	172.7	0.006	0.800	0.010	2.081	64933	65.2	0.764	115	283.4	285.2	NA	0.475	10738	7442	4000m.fbmy5635_rel_202104072149.cy9c_gcp_c2s30
83108	0	499	65.2	855.4	172.1	0.006	0.803	0.010	2.121	66790	65.0	0.804	117	281.5	281.8	NA	0.434	10488	8091	4000m.fbmy5635_rel_202203072101.cy9c_gcp_c2s30
70553	0	469	55.3	685.6	137.6	0.007	0.803	0.010	1.998	65442	58.4	0.928	124	285.1	285.2	NA	194.078	10093	0	4000m.fbmy5635_rel_202205192101.cy9c_gcp_c2s30
80972	0	512	66.9	875.4	169.3	0.006	0.846	0.011	2.141	61677	64.4	0.762	119	279.1	279.4	NA	0.453	10289	8041	4000m.fbmy5635_rel_202208092101.cy9c_gcp_c2s30
80633	0	507	66.3	870.1	168.7	0.006	0.842	0.011	2.143	60988	64.4	0.756	120	278.6	278.9	NA	0.432	10198	7991	4000m.fbmy5635_rel_202210112144.cy9c_gcp_c2s30
80281	0	492	52.6	674.6	140.6	0.006	0.671	0.008	1.793	61130	65.0	0.761	121	284.6	284.8	NA	0.409	9839	7095	4000m.fbmy5635_rel_202302162102.cy9c_gcp_c2s30
79713	0	486	52.0	666.0	139.0	0.006	0.668	0.008	1.785	61108	64.4	0.767	121	285.0	285.2	NA	0.440	9789	6495	4000m.fbmy5635_rel_202304122154.cy9c_gcp_c2s30
77685	0	504	50.7	612.7	137.7	0.006	0.669	0.008	1.815	62730	64.4	0.807	124	289.1	289.3	NA	0.560	9689	549	4000m.fbmy5635_rel_202305292102.cy9c_gcp_c2s30
74232	0	487	49.0	577.0	131.5	0.007	0.676	0.008	1.813	61093	62.4	0.823	126	286.8	286.9	NA	0.537	9544	250	4000m.fbmy5635_rel_jun23_7e40af67.cy9c_gcp_c2s30
q100.1
q100.1: range queries with 100 insert/s per client
Performance metrics for all DBMS, not just the ones listed above. Some are normalized by throughput, others are not. Legend for results is here.
ips	qps	rps	rmbps	wps	wmbps	rpq	rkbpq	wpi	wkbpi	csps	cpups	cspq	cpupq	dbgb1	dbgb2	rss	maxop	p50	p99	tag
797	31874	850	9.7	26.3	4.2	0.027	0.313	0.033	5.345	127008	53.0	3.985	249	277.0	277.4	NA	0.102	4061	1758	4000m.fbmy5635_rel_202104072149.cy9c_gcp_c2s30
797	31227	860	8.5	17.2	2.5	0.028	0.279	0.022	3.222	124860	52.6	3.998	253	277.1	278.0	NA	0.137	3949	1982	4000m.fbmy5635_rel_202203072101.cy9c_gcp_c2s30
797	30700	890	12.1	32.4	4.8	0.029	0.404	0.041	6.125	122305	53.7	3.984	262	276.7	277.6	NA	0.080	3932	1678	4000m.fbmy5635_rel_202205192101.cy9c_gcp_c2s30
797	29764	804	7.5	19.9	2.7	0.027	0.260	0.025	3.431	120146	52.4	4.037	264	277.8	278.7	NA	0.061	3804	1998	4000m.fbmy5635_rel_202208092101.cy9c_gcp_c2s30
797	29214	840	8.0	21.2	3.1	0.029	0.281	0.027	3.956	118383	52.5	4.052	270	277.5	278.3	NA	0.116	3724	1999	4000m.fbmy5635_rel_202210112144.cy9c_gcp_c2s30
789	28077	969	10.0	17.7	2.8	0.035	0.366	0.022	3.696	113334	51.8	4.037	277	283.3	284.2	NA	0.134	3660	1726	4000m.fbmy5635_rel_202302162102.cy9c_gcp_c2s30
788	28063	951	10.3	20.1	3.1	0.034	0.376	0.025	3.982	113393	52.1	4.041	278	283.2	284.0	NA	0.112	3660	1726	4000m.fbmy5635_rel_202304122154.cy9c_gcp_c2s30
791	28350	1000	10.7	25.2	4.1	0.035	0.387	0.032	5.294	114361	52.5	4.034	278	282.6	283.4	NA	0.111	3692	1630	4000m.fbmy5635_rel_202305292102.cy9c_gcp_c2s30
793	27781	1010	10.3	19.5	3.0	0.036	0.379	0.025	3.821	112492	52.3	4.049	282	282.6	283.5	NA	0.057	3580	1838	4000m.fbmy5635_rel_jun23_7e40af67.cy9c_gcp_c2s30
q500.1
q500.1: range queries with 500 insert/s per client
Performance metrics for all DBMS, not just the ones listed above. Some are normalized by throughput, others are not. Legend for results is here.
ips	qps	rps	rmbps	wps	wmbps	rpq	rkbpq	wpi	wkbpi	csps	cpups	cspq	cpupq	dbgb1	dbgb2	rss	maxop	p50	p99	tag
3987	31475	80	2.9	51.8	9.4	0.003	0.095	0.013	2.410	125976	55.4	4.002	264	277.0	278.4	NA	0.038	3916	3660	4000m.fbmy5635_rel_202104072149.cy9c_gcp_c2s30
3986	30649	87	3.6	54.8	9.5	0.003	0.119	0.014	2.445	123172	55.6	4.019	272	277.0	278.9	NA	0.049	3804	3548	4000m.fbmy5635_rel_202203072101.cy9c_gcp_c2s30
3987	30482	76	3.5	53.3	9.4	0.003	0.116	0.013	2.405	122448	55.7	4.017	274	276.8	278.7	NA	0.046	3788	3516	4000m.fbmy5635_rel_202205192101.cy9c_gcp_c2s30
3987	29242	86	3.3	55.1	9.9	0.003	0.115	0.014	2.555	119201	55.5	4.076	285	278.1	280.1	NA	0.049	3660	3404	4000m.fbmy5635_rel_202208092101.cy9c_gcp_c2s30
3987	28903	79	3.4	55.5	9.5	0.003	0.121	0.014	2.446	118142	55.5	4.088	288	277.3	279.3	NA	0.039	3628	3388	4000m.fbmy5635_rel_202210112144.cy9c_gcp_c2s30
3946	27964	99	4.2	46.0	7.1	0.004	0.155	0.012	1.835	112911	55.1	4.038	296	283.3	285.2	NA	0.042	3532	3228	4000m.fbmy5635_rel_202302162102.cy9c_gcp_c2s30
3946	27808	100	4.6	46.7	7.8	0.004	0.168	0.012	2.033	112371	55.4	4.041	299	283.3	285.2	NA	0.042	3532	3212	4000m.fbmy5635_rel_202304122154.cy9c_gcp_c2s30
3959	27900	93	3.9	46.7	7.8	0.003	0.144	0.012	2.018	112703	55.4	4.039	298	282.5	284.5	NA	0.042	3548	3180	4000m.fbmy5635_rel_202305292102.cy9c_gcp_c2s30
3965	27535	105	3.8	46.1	7.4	0.004	0.140	0.012	1.914	111416	55.5	4.046	302	282.6	284.6	NA	0.041	3484	3149	4000m.fbmy5635_rel_jun23_7e40af67.cy9c_gcp_c2s30
q1000.1
q1000.1: range queries with 1000 insert/s per client
Performance metrics for all DBMS, not just the ones listed above. Some are normalized by throughput, others are not. Legend for results is here.
ips	qps	rps	rmbps	wps	wmbps	rpq	rkbpq	wpi	wkbpi	csps	cpups	cspq	cpupq	dbgb1	dbgb2	rss	maxop	p50	p99	tag
7973	30285	117	5.7	109.3	18.2	0.004	0.194	0.014	2.338	123556	58.9	4.080	292	277.1	278.7	NA	0.032	3821	3596	4000m.fbmy5635_rel_202104072149.cy9c_gcp_c2s30
7973	29564	119	5.6	105.8	18.2	0.004	0.193	0.013	2.337	120834	58.8	4.087	298	277.2	277.3	NA	0.054	3692	3468	4000m.fbmy5635_rel_202203072101.cy9c_gcp_c2s30
7976	28890	139	6.4	109.4	18.6	0.005	0.228	0.014	2.388	118707	59.5	4.109	309	276.9	277.0	NA	0.078	3581	3308	4000m.fbmy5635_rel_202205192101.cy9c_gcp_c2s30
7973	28044	121	6.0	107.0	18.0	0.004	0.219	0.013	2.313	117155	58.9	4.177	315	278.4	278.5	NA	0.052	3516	3262	4000m.fbmy5635_rel_202208092101.cy9c_gcp_c2s30
7973	27684	122	6.2	108.9	18.1	0.004	0.231	0.014	2.328	116077	59.0	4.193	320	277.3	277.4	NA	0.038	3470	3228	4000m.fbmy5635_rel_202210112144.cy9c_gcp_c2s30
7934	26538	128	5.2	93.7	15.1	0.005	0.199	0.012	1.955	109112	59.1	4.112	334	283.4	283.5	NA	0.330	3340	2973	4000m.fbmy5635_rel_202302162102.cy9c_gcp_c2s30
7930	26470	138	5.5	91.5	14.6	0.005	0.212	0.012	1.888	108809	59.0	4.111	334	283.5	283.5	NA	0.031	3308	2990	4000m.fbmy5635_rel_202304122154.cy9c_gcp_c2s30
7947	26511	133	5.1	89.3	15.2	0.005	0.197	0.011	1.953	108227	59.3	4.082	336	282.7	282.8	NA	0.037	3372	3038	4000m.fbmy5635_rel_202305292102.cy9c_gcp_c2s30
7951	26127	142	5.3	90.8	16.0	0.005	0.208	0.011	2.064	107677	59.5	4.121	342	282.9	283.1	NA	0.039	3276	2973	4000m.fbmy5635_rel_jun23_7e40af67.cy9c_gcp_c2s30
l.i0
- l.i0: load without secondary indexes
- Legend for results is here.
- Each entry lists the percentage of responses that fit in that bucket (slower than max time for previous bucket, faster than min time for next bucket).
Insert response time histogram
256us	1ms	4ms	16ms	64ms	256ms	1s	4s	16s	gt	max	tag
0.000	17.912	82.029	0.042	0.002	0.013	0.001	0.000	0.000	0.000	0.446	fbmy5635_rel_202104072149.cy9c_gcp_c2s30
0.000	15.527	84.414	0.042	0.002	0.013	0.001	0.000	0.000	0.000	0.439	fbmy5635_rel_202203072101.cy9c_gcp_c2s30
0.000	16.442	83.504	0.038	0.002	0.013	0.001	0.000	0.000	0.000	0.463	fbmy5635_rel_202205192101.cy9c_gcp_c2s30
0.000	15.553	84.391	0.040	0.002	0.013	0.001	0.000	0.000	0.000	0.413	fbmy5635_rel_202208092101.cy9c_gcp_c2s30
0.000	15.679	84.265	0.039	0.003	0.013	0.001	0.000	0.000	0.000	0.436	fbmy5635_rel_202210112144.cy9c_gcp_c2s30
0.000	18.654	81.319	0.012	0.001	0.013	nonzero	0.000	0.000	0.000	0.356	fbmy5635_rel_202302162102.cy9c_gcp_c2s30
0.000	19.541	80.432	0.012	0.001	0.013	nonzero	0.000	0.000	0.000	0.355	fbmy5635_rel_202304122154.cy9c_gcp_c2s30
0.000	18.692	81.279	0.013	0.001	0.013	nonzero	0.000	0.000	0.000	0.355	fbmy5635_rel_202305292102.cy9c_gcp_c2s30
0.000	20.027	79.944	0.014	0.001	0.013	0.001	0.000	0.000	0.000	0.369	fbmy5635_rel_jun23_7e40af67.cy9c_gcp_c2s30
l.x
- l.x: create secondary indexes
- Legend for results is here.
- Each entry lists the percentage of responses that fit in that bucket (slower than max time for previous bucket, faster than min time for next bucket).
TODO - determine whether there is data for create index response time
l.i1
- l.i1: continue load after secondary indexes created
- Legend for results is here.
- Each entry lists the percentage of responses that fit in that bucket (slower than max time for previous bucket, faster than min time for next bucket).
Insert response time histogram
256us	1ms	4ms	16ms	64ms	256ms	1s	4s	16s	gt	max	tag
0.000	0.035	35.195	64.624	0.135	0.009	0.002	0.000	0.000	0.000	0.475	fbmy5635_rel_202104072149.cy9c_gcp_c2s30
0.000	0.053	31.680	68.120	0.137	0.009	0.001	0.000	0.000	0.000	0.434	fbmy5635_rel_202203072101.cy9c_gcp_c2s30
0.000	0.018	29.699	68.527	1.669	0.065	0.021	nonzero	0.001	nonzero	194.078	fbmy5635_rel_202205192101.cy9c_gcp_c2s30
0.000	0.017	27.335	72.494	0.146	0.008	0.001	0.000	0.000	0.000	0.453	fbmy5635_rel_202208092101.cy9c_gcp_c2s30
0.000	0.014	26.494	73.337	0.147	0.007	0.001	0.000	0.000	0.000	0.432	fbmy5635_rel_202210112144.cy9c_gcp_c2s30
0.000	0.014	28.633	71.172	0.162	0.018	0.001	0.000	0.000	0.000	0.409	fbmy5635_rel_202302162102.cy9c_gcp_c2s30
0.000	0.021	27.840	71.912	0.198	0.028	0.001	0.000	0.000	0.000	0.440	fbmy5635_rel_202304122154.cy9c_gcp_c2s30
0.000	0.005	29.571	70.009	0.321	0.093	nonzero	0.000	0.000	0.000	0.560	fbmy5635_rel_202305292102.cy9c_gcp_c2s30
0.000	0.006	29.112	70.236	0.431	0.206	0.010	0.000	0.000	0.000	0.537	fbmy5635_rel_jun23_7e40af67.cy9c_gcp_c2s30
Delete response time histogram
256us	1ms	4ms	16ms	64ms	256ms	1s	4s	16s	gt	max	tag
0.000	0.026	31.330	68.307	0.311	0.023	0.002	0.000	0.000	0.000	0.480	fbmy5635_rel_202104072149.cy9c_gcp_c2s30
0.000	0.050	28.880	70.735	0.312	0.022	0.001	0.000	0.000	0.000	0.434	fbmy5635_rel_202203072101.cy9c_gcp_c2s30
0.000	0.018	27.644	70.406	1.832	0.077	0.022	nonzero	0.001	nonzero	194.079	fbmy5635_rel_202205192101.cy9c_gcp_c2s30
0.000	0.016	24.781	74.833	0.348	0.022	0.001	0.000	0.000	0.000	0.453	fbmy5635_rel_202208092101.cy9c_gcp_c2s30
0.000	0.019	24.853	74.759	0.346	0.022	0.001	0.000	0.000	0.000	0.432	fbmy5635_rel_202210112144.cy9c_gcp_c2s30
0.000	0.012	25.003	74.623	0.327	0.035	0.001	0.000	0.000	0.000	0.409	fbmy5635_rel_202302162102.cy9c_gcp_c2s30
0.000	0.018	24.506	75.069	0.362	0.045	0.001	0.000	0.000	0.000	0.455	fbmy5635_rel_202304122154.cy9c_gcp_c2s30
0.000	0.003	25.140	74.246	0.496	0.114	0.001	0.000	0.000	0.000	0.876	fbmy5635_rel_202305292102.cy9c_gcp_c2s30
0.000	0.004	24.624	74.531	0.604	0.227	0.011	0.000	0.000	0.000	0.849	fbmy5635_rel_jun23_7e40af67.cy9c_gcp_c2s30
q100.1
- q100.1: range queries with 100 insert/s per client
- Legend for results is here.
- Each entry lists the percentage of responses that fit in that bucket (slower than max time for previous bucket, faster than min time for next bucket).
Query response time histogram
256us	1ms	4ms	16ms	64ms	256ms	1s	4s	16s	gt	max	tag
72.850	26.999	0.149	0.001	nonzero	nonzero	0.000	0.000	0.000	0.000	0.102	fbmy5635_rel_202104072149.cy9c_gcp_c2s30
70.006	29.854	0.139	0.001	nonzero	nonzero	0.000	0.000	0.000	0.000	0.137	fbmy5635_rel_202203072101.cy9c_gcp_c2s30
68.810	30.964	0.223	0.003	nonzero	nonzero	0.000	0.000	0.000	0.000	0.080	fbmy5635_rel_202205192101.cy9c_gcp_c2s30
60.839	39.024	0.136	0.002	nonzero	0.000	0.000	0.000	0.000	0.000	0.061	fbmy5635_rel_202208092101.cy9c_gcp_c2s30
55.975	43.867	0.158	0.001	nonzero	nonzero	0.000	0.000	0.000	0.000	0.116	fbmy5635_rel_202210112144.cy9c_gcp_c2s30
54.354	45.312	0.330	0.004	nonzero	nonzero	0.000	0.000	0.000	0.000	0.134	fbmy5635_rel_202302162102.cy9c_gcp_c2s30
52.087	47.651	0.261	0.001	nonzero	nonzero	0.000	0.000	0.000	0.000	0.112	fbmy5635_rel_202304122154.cy9c_gcp_c2s30
55.984	43.697	0.317	0.002	nonzero	nonzero	0.000	0.000	0.000	0.000	0.111	fbmy5635_rel_202305292102.cy9c_gcp_c2s30
49.784	49.882	0.333	0.001	nonzero	0.000	0.000	0.000	0.000	0.000	0.057	fbmy5635_rel_jun23_7e40af67.cy9c_gcp_c2s30
Insert response time histogram
256us	1ms	4ms	16ms	64ms	256ms	1s	4s	16s	gt	max	tag
0.000	5.818	94.141	0.042	0.000	0.000	0.000	0.000	0.000	0.000	0.015	fbmy5635_rel_202104072149.cy9c_gcp_c2s30
0.000	2.576	97.382	0.042	0.000	0.000	0.000	0.000	0.000	0.000	0.014	fbmy5635_rel_202203072101.cy9c_gcp_c2s30
0.000	0.865	99.021	0.104	0.009	0.002	0.000	0.000	0.000	0.000	0.067	fbmy5635_rel_202205192101.cy9c_gcp_c2s30
0.000	0.712	99.238	0.050	0.000	0.000	0.000	0.000	0.000	0.000	0.014	fbmy5635_rel_202208092101.cy9c_gcp_c2s30
0.000	0.681	99.247	0.073	0.000	0.000	0.000	0.000	0.000	0.000	0.015	fbmy5635_rel_202210112144.cy9c_gcp_c2s30
0.000	1.285	98.691	0.024	0.000	0.000	0.000	0.000	0.000	0.000	0.009	fbmy5635_rel_202302162102.cy9c_gcp_c2s30
0.000	1.168	98.811	0.021	0.000	0.000	0.000	0.000	0.000	0.000	0.009	fbmy5635_rel_202304122154.cy9c_gcp_c2s30
0.000	2.163	97.799	0.038	0.000	0.000	0.000	0.000	0.000	0.000	0.014	fbmy5635_rel_202305292102.cy9c_gcp_c2s30
0.000	1.595	98.372	0.031	0.000	0.002	0.000	0.000	0.000	0.000	0.076	fbmy5635_rel_jun23_7e40af67.cy9c_gcp_c2s30
Delete response time histogram
256us	1ms	4ms	16ms	64ms	256ms	1s	4s	16s	gt	max	tag
0.000	4.564	95.365	0.068	0.003	0.000	0.000	0.000	0.000	0.000	0.019	fbmy5635_rel_202104072149.cy9c_gcp_c2s30
0.000	2.356	97.561	0.083	0.000	0.000	0.000	0.000	0.000	0.000	0.016	fbmy5635_rel_202203072101.cy9c_gcp_c2s30
0.000	2.057	97.816	0.122	0.003	0.002	0.000	0.000	0.000	0.000	0.067	fbmy5635_rel_202205192101.cy9c_gcp_c2s30
0.000	1.429	98.470	0.095	0.005	0.000	0.000	0.000	0.000	0.000	0.023	fbmy5635_rel_202208092101.cy9c_gcp_c2s30
0.000	0.884	99.019	0.090	0.007	0.000	0.000	0.000	0.000	0.000	0.028	fbmy5635_rel_202210112144.cy9c_gcp_c2s30
0.000	1.425	98.483	0.092	0.000	0.000	0.000	0.000	0.000	0.000	0.010	fbmy5635_rel_202302162102.cy9c_gcp_c2s30
0.000	1.693	98.241	0.066	0.000	0.000	0.000	0.000	0.000	0.000	0.011	fbmy5635_rel_202304122154.cy9c_gcp_c2s30
0.000	2.050	97.849	0.097	0.003	0.000	0.000	0.000	0.000	0.000	0.027	fbmy5635_rel_202305292102.cy9c_gcp_c2s30
0.000	1.373	98.552	0.073	0.000	0.002	0.000	0.000	0.000	0.000	0.076	fbmy5635_rel_jun23_7e40af67.cy9c_gcp_c2s30
q500.1
- q500.1: range queries with 500 insert/s per client
- Legend for results is here.
- Each entry lists the percentage of responses that fit in that bucket (slower than max time for previous bucket, faster than min time for next bucket).
Query response time histogram
256us	1ms	4ms	16ms	64ms	256ms	1s	4s	16s	gt	max	tag
68.166	31.826	0.007	nonzero	nonzero	0.000	0.000	0.000	0.000	0.000	0.038	fbmy5635_rel_202104072149.cy9c_gcp_c2s30
63.703	36.288	0.008	nonzero	nonzero	0.000	0.000	0.000	0.000	0.000	0.049	fbmy5635_rel_202203072101.cy9c_gcp_c2s30
63.089	36.903	0.007	nonzero	nonzero	0.000	0.000	0.000	0.000	0.000	0.046	fbmy5635_rel_202205192101.cy9c_gcp_c2s30
52.540	47.451	0.009	nonzero	0.001	0.000	0.000	0.000	0.000	0.000	0.049	fbmy5635_rel_202208092101.cy9c_gcp_c2s30
48.252	51.738	0.009	nonzero	0.001	0.000	0.000	0.000	0.000	0.000	0.039	fbmy5635_rel_202210112144.cy9c_gcp_c2s30
45.306	54.681	0.011	nonzero	0.001	0.000	0.000	0.000	0.000	0.000	0.042	fbmy5635_rel_202302162102.cy9c_gcp_c2s30
43.004	56.982	0.013	nonzero	0.001	0.000	0.000	0.000	0.000	0.000	0.042	fbmy5635_rel_202304122154.cy9c_gcp_c2s30
43.597	56.392	0.010	nonzero	0.001	0.000	0.000	0.000	0.000	0.000	0.042	fbmy5635_rel_202305292102.cy9c_gcp_c2s30
39.031	60.957	0.012	nonzero	0.001	0.000	0.000	0.000	0.000	0.000	0.041	fbmy5635_rel_jun23_7e40af67.cy9c_gcp_c2s30
Insert response time histogram
256us	1ms	4ms	16ms	64ms	256ms	1s	4s	16s	gt	max	tag
0.000	20.985	79.000	0.014	0.001	0.000	0.000	0.000	0.000	0.000	0.033	fbmy5635_rel_202104072149.cy9c_gcp_c2s30
0.000	5.323	94.599	0.076	0.001	0.000	0.000	0.000	0.000	0.000	0.035	fbmy5635_rel_202203072101.cy9c_gcp_c2s30
0.000	3.557	96.422	0.019	0.001	0.000	0.000	0.000	0.000	0.000	0.046	fbmy5635_rel_202205192101.cy9c_gcp_c2s30
0.000	1.871	97.831	0.298	0.001	0.000	0.000	0.000	0.000	0.000	0.029	fbmy5635_rel_202208092101.cy9c_gcp_c2s30
0.000	0.694	98.515	0.788	0.003	0.000	0.000	0.000	0.000	0.000	0.038	fbmy5635_rel_202210112144.cy9c_gcp_c2s30
0.000	2.760	95.499	1.734	0.007	0.000	0.000	0.000	0.000	0.000	0.039	fbmy5635_rel_202302162102.cy9c_gcp_c2s30
0.000	2.014	89.687	8.283	0.017	0.000	0.000	0.000	0.000	0.000	0.039	fbmy5635_rel_202304122154.cy9c_gcp_c2s30
0.000	4.739	95.215	0.045	0.001	0.000	0.000	0.000	0.000	0.000	0.037	fbmy5635_rel_202305292102.cy9c_gcp_c2s30
0.000	3.336	92.348	4.309	0.007	0.000	0.000	0.000	0.000	0.000	0.020	fbmy5635_rel_jun23_7e40af67.cy9c_gcp_c2s30
Delete response time histogram
256us	1ms	4ms	16ms	64ms	256ms	1s	4s	16s	gt	max	tag
0.000	21.126	78.800	0.066	0.007	0.000	0.000	0.000	0.000	0.000	0.052	fbmy5635_rel_202104072149.cy9c_gcp_c2s30
0.000	6.731	93.136	0.128	0.005	0.000	0.000	0.000	0.000	0.000	0.060	fbmy5635_rel_202203072101.cy9c_gcp_c2s30
0.000	6.328	93.569	0.096	0.007	0.000	0.000	0.000	0.000	0.000	0.046	fbmy5635_rel_202205192101.cy9c_gcp_c2s30
0.000	3.075	96.592	0.331	0.002	0.000	0.000	0.000	0.000	0.000	0.038	fbmy5635_rel_202208092101.cy9c_gcp_c2s30
0.000	1.373	97.823	0.796	0.008	0.000	0.000	0.000	0.000	0.000	0.046	fbmy5635_rel_202210112144.cy9c_gcp_c2s30
0.000	4.413	93.806	1.772	0.009	0.000	0.000	0.000	0.000	0.000	0.040	fbmy5635_rel_202302162102.cy9c_gcp_c2s30
0.000	4.110	87.918	7.955	0.017	0.000	0.000	0.000	0.000	0.000	0.041	fbmy5635_rel_202304122154.cy9c_gcp_c2s30
0.000	6.925	92.977	0.093	0.005	0.000	0.000	0.000	0.000	0.000	0.041	fbmy5635_rel_202305292102.cy9c_gcp_c2s30
0.000	5.110	90.723	4.157	0.011	0.000	0.000	0.000	0.000	0.000	0.042	fbmy5635_rel_jun23_7e40af67.cy9c_gcp_c2s30
q1000.1
- q1000.1: range queries with 1000 insert/s per client
- Legend for results is here.
- Each entry lists the percentage of responses that fit in that bucket (slower than max time for previous bucket, faster than min time for next bucket).
Query response time histogram
256us	1ms	4ms	16ms	64ms	256ms	1s	4s	16s	gt	max	tag
60.359	39.625	0.015	0.001	nonzero	0.000	0.000	0.000	0.000	0.000	0.032	fbmy5635_rel_202104072149.cy9c_gcp_c2s30
55.522	44.461	0.016	nonzero	nonzero	0.000	0.000	0.000	0.000	0.000	0.054	fbmy5635_rel_202203072101.cy9c_gcp_c2s30
49.317	50.667	0.016	0.001	nonzero	nonzero	0.000	0.000	0.000	0.000	0.078	fbmy5635_rel_202205192101.cy9c_gcp_c2s30
39.655	60.327	0.017	nonzero	nonzero	0.000	0.000	0.000	0.000	0.000	0.052	fbmy5635_rel_202208092101.cy9c_gcp_c2s30
34.915	65.066	0.018	0.001	nonzero	0.000	0.000	0.000	0.000	0.000	0.038	fbmy5635_rel_202210112144.cy9c_gcp_c2s30
27.060	72.913	0.026	0.001	nonzero	0.000	nonzero	0.000	0.000	0.000	0.330	fbmy5635_rel_202302162102.cy9c_gcp_c2s30
26.400	73.573	0.026	0.001	nonzero	0.000	0.000	0.000	0.000	0.000	0.031	fbmy5635_rel_202304122154.cy9c_gcp_c2s30
26.556	73.398	0.045	0.001	nonzero	0.000	0.000	0.000	0.000	0.000	0.037	fbmy5635_rel_202305292102.cy9c_gcp_c2s30
22.438	77.538	0.023	0.001	nonzero	0.000	0.000	0.000	0.000	0.000	0.039	fbmy5635_rel_jun23_7e40af67.cy9c_gcp_c2s30
Insert response time histogram
256us	1ms	4ms	16ms	64ms	256ms	1s	4s	16s	gt	max	tag
0.000	15.990	83.958	0.052	0.001	0.000	0.000	0.000	0.000	0.000	0.026	fbmy5635_rel_202104072149.cy9c_gcp_c2s30
0.000	2.950	96.436	0.611	0.002	0.000	0.000	0.000	0.000	0.000	0.031	fbmy5635_rel_202203072101.cy9c_gcp_c2s30
0.000	1.096	98.835	0.067	0.001	0.000	0.000	0.000	0.000	0.000	0.026	fbmy5635_rel_202205192101.cy9c_gcp_c2s30
0.000	1.486	98.454	0.059	0.001	0.000	0.000	0.000	0.000	0.000	0.025	fbmy5635_rel_202208092101.cy9c_gcp_c2s30
0.000	0.880	99.046	0.072	0.002	nonzero	0.000	0.000	0.000	0.000	0.080	fbmy5635_rel_202210112144.cy9c_gcp_c2s30
0.000	1.548	84.840	13.589	0.023	0.000	0.000	0.000	0.000	0.000	0.029	fbmy5635_rel_202302162102.cy9c_gcp_c2s30
0.000	1.497	84.906	13.582	0.015	0.000	0.000	0.000	0.000	0.000	0.029	fbmy5635_rel_202304122154.cy9c_gcp_c2s30
0.000	0.466	51.015	48.433	0.087	0.000	0.000	0.000	0.000	0.000	0.055	fbmy5635_rel_202305292102.cy9c_gcp_c2s30
0.000	1.476	93.784	4.729	0.011	0.000	0.000	0.000	0.000	0.000	0.054	fbmy5635_rel_jun23_7e40af67.cy9c_gcp_c2s30
Delete response time histogram
256us	1ms	4ms	16ms	64ms	256ms	1s	4s	16s	gt	max	tag
0.000	17.427	82.466	0.101	0.006	0.000	0.000	0.000	0.000	0.000	0.038	fbmy5635_rel_202104072149.cy9c_gcp_c2s30
0.000	3.824	95.466	0.698	0.012	0.000	0.000	0.000	0.000	0.000	0.047	fbmy5635_rel_202203072101.cy9c_gcp_c2s30
0.000	2.739	97.065	0.185	0.011	0.000	0.000	0.000	0.000	0.000	0.051	fbmy5635_rel_202205192101.cy9c_gcp_c2s30
0.000	2.526	97.356	0.110	0.007	0.000	0.000	0.000	0.000	0.000	0.044	fbmy5635_rel_202208092101.cy9c_gcp_c2s30
0.000	1.854	97.973	0.163	0.009	nonzero	0.000	0.000	0.000	0.000	0.081	fbmy5635_rel_202210112144.cy9c_gcp_c2s30
0.000	2.196	84.091	13.682	0.031	0.000	nonzero	0.000	0.000	0.000	0.322	fbmy5635_rel_202302162102.cy9c_gcp_c2s30
0.000	2.899	83.298	13.778	0.025	0.000	0.000	0.000	0.000	0.000	0.050	fbmy5635_rel_202304122154.cy9c_gcp_c2s30
0.000	1.142	50.768	47.985	0.104	0.000	0.000	0.000	0.000	0.000	0.056	fbmy5635_rel_202305292102.cy9c_gcp_c2s30
0.000	2.498	92.812	4.674	0.016	0.000	0.000	0.000	0.000	0.000	0.057	fbmy5635_rel_jun23_7e40af67.cy9c_gcp_c2s30