Introduction
This is a report for the insert benchmark with 12000M docs and 24 client(s). It is generated by scripts (bash, awk, sed) and Tufte might not be impressed. An overview of the insert benchmark is here and a short update is here. Below, by DBMS, I mean DBMS+version.config. An example is my8020.c10b40 where my means MySQL, 8020 is version 8.0.20 and c10b40 is the name for the configuration file.
The test server has 80 cores with hyperthreads enabled, 256G RAM and fast storage. The benchmark was run with 24 clients and there were 1 or 3 connections per client (1 for queries or inserts without rate limits, 1+1 for rate limited inserts+deletes). There are 24 tables, with a client per table. It loads 12B rows without secondary indexes, creates secondary indexes, then inserts 120M rows with a delete per insert to avoid growing the table. It then does 3 read+write tests for 3600s each that do queries as fast as possible with 100, 500 and then 1000 inserts/second/client concurrent with the queries and 1000 deletes/second to avoid growing the table. The database is larger than memory.
The tested DBMS are:
- my5740_rel_native_lto.cy10_u - InnoDB and MySQL 5.7.40, rel_native_lto build, cy10_u config, compiled with CMAKE_BUILD_TYPE=Release, base config
- my5740_rel_native_lto.cy10_ua1 - InnoDB and MySQL 5.7.40, rel_native_lto build, cy10_ua1 config, compiled with CMAKE_BUILD_TYPE=Release, adds innodb_use_native_aio=off
- my5740_rel_native_lto.cy10_ua2 - InnoDB and MySQL 5.7.40, rel_native_lto build, cy10_ua2 config, compiled with CMAKE_BUILD_TYPE=Release, adds innodb_io_capacity=20k, innodb_io_capacity_max=40k
- my5740_rel_native_lto.cy10_ua3 - InnoDB and MySQL 5.7.40, rel_native_lto build, cy10_ua3 config, compiled with CMAKE_BUILD_TYPE=Release, adds innodb_io_capacity=20k, innodb_io_capacity_max=40k, innodb_flush_sync=OFF
- my5740_rel_native_lto.cy10_ua4 - InnoDB and MySQL 5.7.40, rel_native_lto build, cy10_ua4 config, compiled with CMAKE_BUILD_TYPE=Release, adds innodb_flush_method=fsync
Contents
- Summary
- l.i0: load without secondary indexes
- l.x: create secondary indexes
- l.i1: continue load after secondary indexes created
- q100.1: range queries with 100 insert/s per client
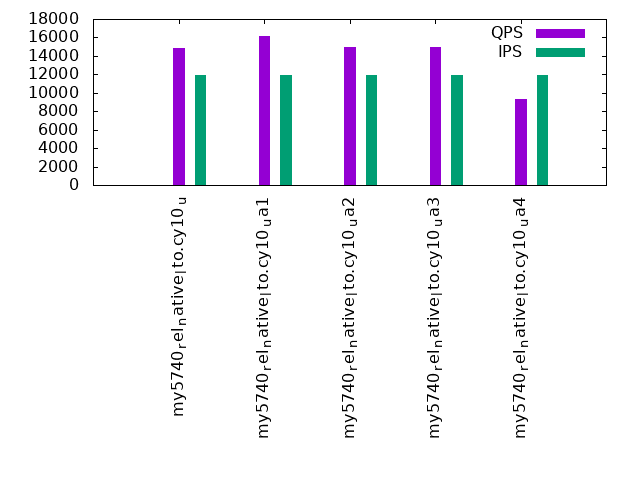
- q500.1: range queries with 500 insert/s per client
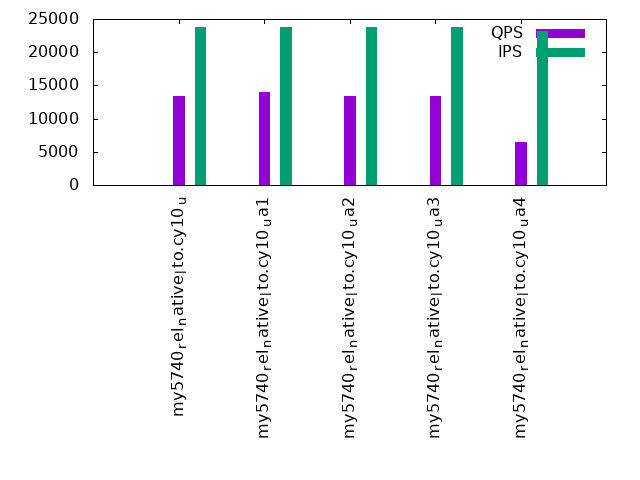
- q1000.1: range queries with 1000 insert/s per client
Summary
The numbers are inserts/s for l.i0 and l.i1, indexed docs (or rows) /s for l.x and queries/s for q*.2. The values are the average rate over the entire test for inserts (IPS) and queries (QPS). The range of values for IPS and QPS is split into 3 parts: bottom 25%, middle 50%, top 25%. Values in the bottom 25% have a red background, values in the top 25% have a green background and values in the middle have no color. A gray background is used for values that can be ignored because the DBMS did not sustain the target insert rate. Red backgrounds are not used when the minimum value is within 80% of the max value.
| dbms | l.i0 | l.x | l.i1 | q100.1 | q500.1 | q1000.1 |
|---|---|---|---|---|---|---|
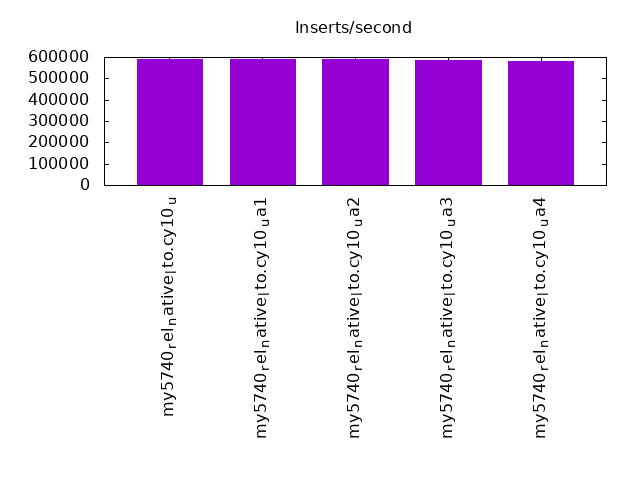
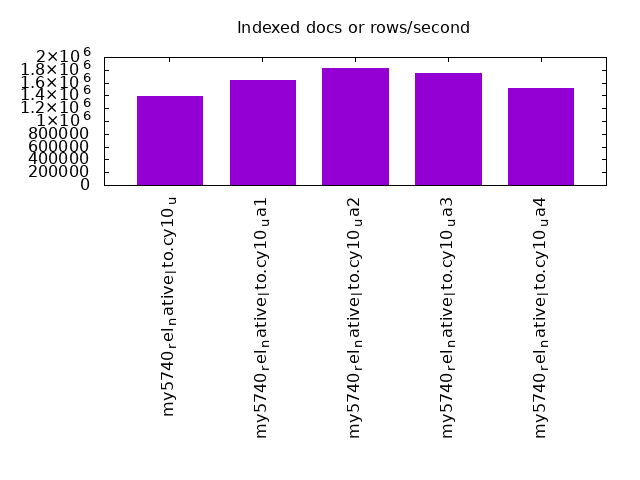
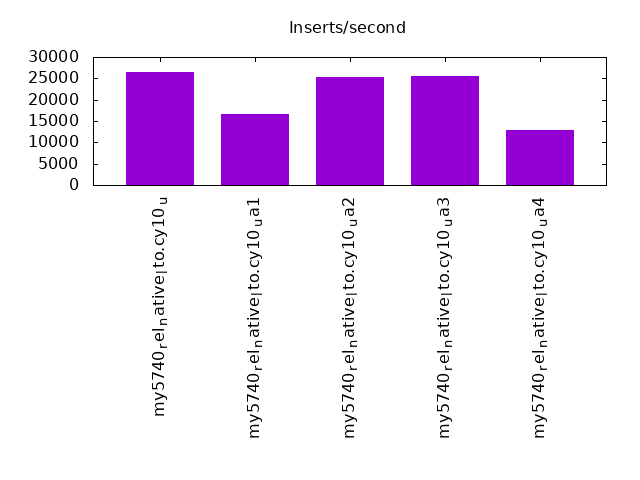
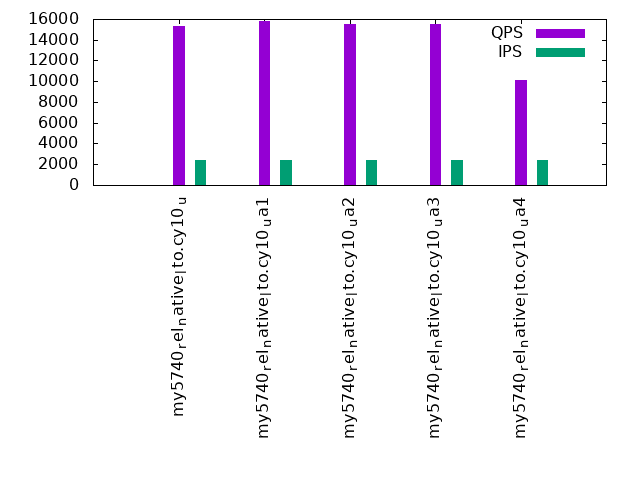
| my5740_rel_native_lto.cy10_u | 588351 | 1391316 | 26426 | 15354 | 14904 | 13400 |
| my5740_rel_native_lto.cy10_ua1 | 591920 | 1643399 | 16579 | 15783 | 16169 | 13955 |
| my5740_rel_native_lto.cy10_ua2 | 589507 | 1835720 | 25215 | 15513 | 15012 | 13467 |
| my5740_rel_native_lto.cy10_ua3 | 587688 | 1748521 | 25526 | 15525 | 14963 | 13349 |
| my5740_rel_native_lto.cy10_ua4 | 580664 | 1511728 | 12923 | 10122 | 9296 | 6451 |
This table has relative throughput, throughput for the DBMS relative to the DBMS in the first line, using the absolute throughput from the previous table. Values less than 0.95 have a yellow background. Values greater than 1.05 have a blue background.
| dbms | l.i0 | l.x | l.i1 | q100.1 | q500.1 | q1000.1 |
|---|---|---|---|---|---|---|
| my5740_rel_native_lto.cy10_u | 1.00 | 1.00 | 1.00 | 1.00 | 1.00 | 1.00 |
| my5740_rel_native_lto.cy10_ua1 | 1.01 | 1.18 | 0.63 | 1.03 | 1.08 | 1.04 |
| my5740_rel_native_lto.cy10_ua2 | 1.00 | 1.32 | 0.95 | 1.01 | 1.01 | 1.00 |
| my5740_rel_native_lto.cy10_ua3 | 1.00 | 1.26 | 0.97 | 1.01 | 1.00 | 1.00 |
| my5740_rel_native_lto.cy10_ua4 | 0.99 | 1.09 | 0.49 | 0.66 | 0.62 | 0.48 |
This lists the average rate of inserts/s for the tests that do inserts concurrent with queries. For such tests the query rate is listed in the table above. The read+write tests are setup so that the insert rate should match the target rate every second. Cells that are not at least 95% of the target have a red background to indicate a failure to satisfy the target.
| dbms | q100.1 | q500.1 | q1000.1 |
|---|---|---|---|
| my5740_rel_native_lto.cy10_u | 2381 | 11907 | 23821 |
| my5740_rel_native_lto.cy10_ua1 | 2379 | 11901 | 23802 |
| my5740_rel_native_lto.cy10_ua2 | 2381 | 11907 | 23821 |
| my5740_rel_native_lto.cy10_ua3 | 2381 | 11904 | 23821 |
| my5740_rel_native_lto.cy10_ua4 | 2377 | 11898 | 23220 |
| target | 2400 | 12000 | 24000 |
l.i0
l.i0: load without secondary indexes. Graphs for performance per 1-second interval are here.
Average throughput:
Insert response time histogram: each cell has the percentage of responses that take <= the time in the header and max is the max response time in seconds. For the max column values in the top 25% of the range have a red background and in the bottom 25% of the range have a green background. The red background is not used when the min value is within 80% of the max value.
| dbms | 256us | 1ms | 4ms | 16ms | 64ms | 256ms | 1s | 4s | 16s | gt | max |
|---|---|---|---|---|---|---|---|---|---|---|---|
| my5740_rel_native_lto.cy10_u | 0.007 | 52.911 | 47.035 | 0.013 | 0.033 | nonzero | 0.305 | ||||
| my5740_rel_native_lto.cy10_ua1 | 0.005 | 55.669 | 44.280 | 0.012 | 0.034 | nonzero | 0.318 | ||||
| my5740_rel_native_lto.cy10_ua2 | 0.008 | 53.897 | 46.048 | 0.013 | 0.034 | nonzero | 0.298 | ||||
| my5740_rel_native_lto.cy10_ua3 | 0.008 | 52.656 | 47.290 | 0.012 | 0.035 | nonzero | 0.681 | ||||
| my5740_rel_native_lto.cy10_ua4 | 0.008 | 47.994 | 51.950 | 0.022 | 0.025 | nonzero | 0.397 |
Performance metrics for the DBMS listed above. Some are normalized by throughput, others are not. Legend for results is here.
ips	qps	rps	rmbps	wps	wmbps	rpq	rkbpq	wpi	wkbpi	csps	cpups	cspq	cpupq	dbgb1	dbgb2	rss	maxop	p50	p99	tag
588351	0	1	0.0	3911.9	166.1	0.000	0.000	0.007	0.289	106956	42.0	0.182	57	789.3	917.8	216.3	0.305	24675	22178	12000m.my5740_rel_native_lto.cy10_u
591920	0	1	0.0	3935.1	167.2	0.000	0.000	0.007	0.289	119977	42.1	0.203	57	789.3	917.8	216.3	0.318	24773	22178	12000m.my5740_rel_native_lto.cy10_ua1
589507	0	1	0.0	3925.9	166.6	0.000	0.000	0.007	0.289	108342	42.0	0.184	57	789.3	917.8	216.3	0.298	24675	22178	12000m.my5740_rel_native_lto.cy10_ua2
587688	0	1	0.0	3913.6	166.1	0.000	0.000	0.007	0.289	107909	42.0	0.184	57	789.3	917.8	215.9	0.681	24577	22078	12000m.my5740_rel_native_lto.cy10_ua3
580664	0	2	0.0	2001.9	143.0	0.000	0.000	0.003	0.252	113223	42.0	0.195	58	789.3	917.8	216.3	0.397	24276	21881	12000m.my5740_rel_native_lto.cy10_ua4
l.x
l.x: create secondary indexes.
Average throughput:
Performance metrics for the DBMS listed above. Some are normalized by throughput, others are not. Legend for results is here.
ips	qps	rps	rmbps	wps	wmbps	rpq	rkbpq	wpi	wkbpi	csps	cpups	cspq	cpupq	dbgb1	dbgb2	rss	maxop	p50	p99	tag
1391316	0	14542	1171.6	21654.4	1509.4	0.010	0.862	0.016	1.111	182547	29.1	0.131	17	1764.9	1893.5	216.5	0.002	NA	NA	12000m.my5740_rel_native_lto.cy10_u
1643399	0	17188	1442.5	24769.3	1783.1	0.010	0.899	0.015	1.111	325975	30.0	0.198	15	1764.9	1893.5	216.5	0.002	NA	NA	12000m.my5740_rel_native_lto.cy10_ua1
1835720	0	19178	1559.1	27457.2	1989.6	0.010	0.870	0.015	1.110	234380	30.5	0.128	13	1764.9	1893.5	216.5	0.002	NA	NA	12000m.my5740_rel_native_lto.cy10_ua2
1748521	0	18278	1529.8	26581.2	1895.4	0.010	0.896	0.015	1.110	200185	30.6	0.114	14	1764.9	1893.5	216.1	0.003	NA	NA	12000m.my5740_rel_native_lto.cy10_ua3
1511728	0	11113	1311.1	17309.1	1559.9	0.007	0.888	0.011	1.057	250346	29.5	0.166	16	1764.9	1893.5	216.5	0.003	NA	NA	12000m.my5740_rel_native_lto.cy10_ua4
l.i1
l.i1: continue load after secondary indexes created. Graphs for performance per 1-second interval are here.
Average throughput:
Insert response time histogram: each cell has the percentage of responses that take <= the time in the header and max is the max response time in seconds. For the max column values in the top 25% of the range have a red background and in the bottom 25% of the range have a green background. The red background is not used when the min value is within 80% of the max value.
| dbms | 256us | 1ms | 4ms | 16ms | 64ms | 256ms | 1s | 4s | 16s | gt | max |
|---|---|---|---|---|---|---|---|---|---|---|---|
| my5740_rel_native_lto.cy10_u | 1.527 | 80.281 | 18.186 | 0.006 | 0.337 | ||||||
| my5740_rel_native_lto.cy10_ua1 | 1.013 | 66.417 | 28.905 | 3.665 | 0.514 | ||||||
| my5740_rel_native_lto.cy10_ua2 | 1.631 | 79.152 | 19.188 | 0.029 | 0.435 | ||||||
| my5740_rel_native_lto.cy10_ua3 | 2.012 | 79.007 | 18.971 | 0.009 | 0.576 | ||||||
| my5740_rel_native_lto.cy10_ua4 | 0.850 | 60.262 | 29.238 | 9.649 | 0.725 |
Delete response time histogram: each cell has the percentage of responses that take <= the time in the header and max is the max response time in seconds. For the max column values in the top 25% of the range have a red background and in the bottom 25% of the range have a green background. The red background is not used when the min value is within 80% of the max value.
| dbms | 256us | 1ms | 4ms | 16ms | 64ms | 256ms | 1s | 4s | 16s | gt | max |
|---|---|---|---|---|---|---|---|---|---|---|---|
| my5740_rel_native_lto.cy10_u | 0.085 | 42.226 | 57.508 | 0.182 | 0.236 | ||||||
| my5740_rel_native_lto.cy10_ua1 | 0.856 | 43.198 | 55.663 | 0.284 | 0.253 | ||||||
| my5740_rel_native_lto.cy10_ua2 | 0.140 | 43.157 | 56.444 | 0.258 | 0.001 | 0.335 | |||||
| my5740_rel_native_lto.cy10_ua3 | 0.113 | 43.886 | 55.775 | 0.226 | 0.245 | ||||||
| my5740_rel_native_lto.cy10_ua4 | 0.532 | 44.918 | 54.162 | 0.388 | 0.175 |
Performance metrics for the DBMS listed above. Some are normalized by throughput, others are not. Legend for results is here.
ips	qps	rps	rmbps	wps	wmbps	rpq	rkbpq	wpi	wkbpi	csps	cpups	cspq	cpupq	dbgb1	dbgb2	rss	maxop	p50	p99	tag
26426	0	46285	723.2	91971.5	2056.2	1.752	28.024	3.480	79.680	433620	44.2	16.409	1338	2416.1	2610.5	216.6	0.337	999	250	12000m.my5740_rel_native_lto.cy10_u
16579	0	30261	472.8	60529.5	1360.1	1.825	29.204	3.651	84.006	1242173	39.2	74.924	1892	2416.6	2609.1	216.5	0.514	450	150	12000m.my5740_rel_native_lto.cy10_ua1
25215	0	44461	694.7	94277.7	2081.0	1.763	28.212	3.739	84.511	442277	42.7	17.540	1355	2416.8	2607.4	216.5	0.435	949	300	12000m.my5740_rel_native_lto.cy10_ua2
25526	0	45072	704.2	95285.4	2105.5	1.766	28.251	3.733	84.461	446888	43.2	17.507	1354	2416.8	2607.3	216.3	0.576	949	250	12000m.my5740_rel_native_lto.cy10_ua3
12923	0	25703	650.6	54568.4	1035.0	1.989	51.556	4.223	82.015	860986	29.2	66.626	1808	2417.8	2610.3	216.6	0.725	300	100	12000m.my5740_rel_native_lto.cy10_ua4
q100.1
q100.1: range queries with 100 insert/s per client. Graphs for performance per 1-second interval are here.
Average throughput:
Query response time histogram: each cell has the percentage of responses that take <= the time in the header and max is the max response time in seconds. For max values in the top 25% of the range have a red background and in the bottom 25% of the range have a green background. The red background is not used when the min value is within 80% of the max value.
| dbms | 256us | 1ms | 4ms | 16ms | 64ms | 256ms | 1s | 4s | 16s | gt | max |
|---|---|---|---|---|---|---|---|---|---|---|---|
| my5740_rel_native_lto.cy10_u | 29.855 | 12.833 | 54.024 | 3.048 | 0.235 | 0.006 | nonzero | 0.303 | |||
| my5740_rel_native_lto.cy10_ua1 | 29.453 | 13.956 | 53.174 | 3.100 | 0.312 | 0.005 | nonzero | 0.330 | |||
| my5740_rel_native_lto.cy10_ua2 | 29.785 | 12.918 | 54.083 | 3.038 | 0.170 | 0.007 | nonzero | 0.383 | |||
| my5740_rel_native_lto.cy10_ua3 | 29.771 | 12.912 | 54.145 | 3.002 | 0.164 | 0.006 | nonzero | 0.326 | |||
| my5740_rel_native_lto.cy10_ua4 | 23.867 | 19.330 | 38.269 | 18.019 | 0.511 | 0.003 | nonzero | 0.610 |
Insert response time histogram: each cell has the percentage of responses that take <= the time in the header and max is the max response time in seconds. For max values in the top 25% of the range have a red background and in the bottom 25% of the range have a green background. The red background is not used when the min value is within 80% of the max value.
| dbms | 256us | 1ms | 4ms | 16ms | 64ms | 256ms | 1s | 4s | 16s | gt | max |
|---|---|---|---|---|---|---|---|---|---|---|---|
| my5740_rel_native_lto.cy10_u | 69.992 | 29.075 | 0.908 | 0.024 | 0.348 | ||||||
| my5740_rel_native_lto.cy10_ua1 | 59.582 | 39.588 | 0.818 | 0.012 | 0.338 | ||||||
| my5740_rel_native_lto.cy10_ua2 | 71.009 | 27.650 | 1.270 | 0.071 | 0.412 | ||||||
| my5740_rel_native_lto.cy10_ua3 | 71.646 | 27.115 | 1.156 | 0.083 | 0.438 | ||||||
| my5740_rel_native_lto.cy10_ua4 | 40.120 | 59.340 | 0.537 | 0.003 | 0.350 |
Delete response time histogram: each cell has the percentage of responses that take <= the time in the header and max is the max response time in seconds. For max values in the top 25% of the range have a red background and in the bottom 25% of the range have a green background. The red background is not used when the min value is within 80% of the max value.
| dbms | 256us | 1ms | 4ms | 16ms | 64ms | 256ms | 1s | 4s | 16s | gt | max |
|---|---|---|---|---|---|---|---|---|---|---|---|
| my5740_rel_native_lto.cy10_u | 0.012 | 81.207 | 18.145 | 0.624 | 0.013 | 0.340 | |||||
| my5740_rel_native_lto.cy10_ua1 | 0.009 | 79.690 | 19.754 | 0.539 | 0.008 | 0.333 | |||||
| my5740_rel_native_lto.cy10_ua2 | 0.016 | 82.525 | 16.512 | 0.906 | 0.041 | 0.414 | |||||
| my5740_rel_native_lto.cy10_ua3 | 0.013 | 82.877 | 16.249 | 0.818 | 0.042 | 0.388 | |||||
| my5740_rel_native_lto.cy10_ua4 | 0.013 | 77.011 | 22.731 | 0.242 | 0.002 | 0.344 |
Performance metrics for the DBMS listed above. Some are normalized by throughput, others are not. Legend for results is here.
ips	qps	rps	rmbps	wps	wmbps	rpq	rkbpq	wpi	wkbpi	csps	cpups	cspq	cpupq	dbgb1	dbgb2	rss	maxop	p50	p99	tag
2381	15354	104784	1637.3	48426.6	1272.9	6.824	109.191	20.340	547.484	424882	25.8	27.672	1344	2416.1	2610.5	216.6	0.303	719	256	12000m.my5740_rel_native_lto.cy10_u
2379	15783	101633	1588.0	42852.0	1112.3	6.439	103.028	18.014	478.790	880801	26.9	55.806	1363	2416.6	2609.1	216.5	0.330	751	256	12000m.my5740_rel_native_lto.cy10_ua1
2381	15513	106049	1657.0	50250.9	1290.9	6.836	109.378	21.107	555.225	431329	25.7	27.804	1325	2416.8	2607.4	216.5	0.383	703	272	12000m.my5740_rel_native_lto.cy10_ua2
2381	15525	106283	1660.7	49682.4	1295.4	6.846	109.533	20.868	557.170	426747	25.5	27.487	1314	2416.8	2607.3	216.3	0.326	703	288	12000m.my5740_rel_native_lto.cy10_ua3
2377	10122	68313	2494.0	46226.5	784.3	6.749	252.322	19.449	337.893	755861	28.1	74.679	2221	2417.8	2610.3	216.6	0.610	464	144	12000m.my5740_rel_native_lto.cy10_ua4
q500.1
q500.1: range queries with 500 insert/s per client. Graphs for performance per 1-second interval are here.
Average throughput:
Query response time histogram: each cell has the percentage of responses that take <= the time in the header and max is the max response time in seconds. For max values in the top 25% of the range have a red background and in the bottom 25% of the range have a green background. The red background is not used when the min value is within 80% of the max value.
| dbms | 256us | 1ms | 4ms | 16ms | 64ms | 256ms | 1s | 4s | 16s | gt | max |
|---|---|---|---|---|---|---|---|---|---|---|---|
| my5740_rel_native_lto.cy10_u | 24.525 | 16.983 | 54.983 | 3.486 | 0.022 | nonzero | 0.101 | ||||
| my5740_rel_native_lto.cy10_ua1 | 25.033 | 17.212 | 55.674 | 2.059 | 0.021 | 0.064 | |||||
| my5740_rel_native_lto.cy10_ua2 | 24.588 | 16.975 | 55.158 | 3.260 | 0.019 | nonzero | 0.142 | ||||
| my5740_rel_native_lto.cy10_ua3 | 24.651 | 16.904 | 55.139 | 3.291 | 0.015 | nonzero | 0.088 | ||||
| my5740_rel_native_lto.cy10_ua4 | 19.055 | 22.721 | 32.260 | 25.844 | 0.118 | 0.001 | 0.178 |
Insert response time histogram: each cell has the percentage of responses that take <= the time in the header and max is the max response time in seconds. For max values in the top 25% of the range have a red background and in the bottom 25% of the range have a green background. The red background is not used when the min value is within 80% of the max value.
| dbms | 256us | 1ms | 4ms | 16ms | 64ms | 256ms | 1s | 4s | 16s | gt | max |
|---|---|---|---|---|---|---|---|---|---|---|---|
| my5740_rel_native_lto.cy10_u | 20.077 | 79.870 | 0.053 | 0.115 | |||||||
| my5740_rel_native_lto.cy10_ua1 | 44.231 | 55.715 | 0.054 | 0.159 | |||||||
| my5740_rel_native_lto.cy10_ua2 | 31.222 | 68.649 | 0.128 | 0.002 | 0.331 | ||||||
| my5740_rel_native_lto.cy10_ua3 | 39.006 | 60.959 | 0.036 | 0.193 | |||||||
| my5740_rel_native_lto.cy10_ua4 | nonzero | 32.669 | 67.085 | 0.246 | 0.221 |
Delete response time histogram: each cell has the percentage of responses that take <= the time in the header and max is the max response time in seconds. For max values in the top 25% of the range have a red background and in the bottom 25% of the range have a green background. The red background is not used when the min value is within 80% of the max value.
| dbms | 256us | 1ms | 4ms | 16ms | 64ms | 256ms | 1s | 4s | 16s | gt | max |
|---|---|---|---|---|---|---|---|---|---|---|---|
| my5740_rel_native_lto.cy10_u | 0.013 | 52.273 | 47.707 | 0.006 | 0.102 | ||||||
| my5740_rel_native_lto.cy10_ua1 | 0.023 | 95.296 | 4.675 | 0.006 | 0.102 | ||||||
| my5740_rel_native_lto.cy10_ua2 | 0.015 | 78.679 | 21.282 | 0.025 | 0.250 | ||||||
| my5740_rel_native_lto.cy10_ua3 | 0.008 | 92.679 | 7.304 | 0.009 | 0.167 | ||||||
| my5740_rel_native_lto.cy10_ua4 | 0.017 | 80.648 | 19.294 | 0.041 | 0.201 |
Performance metrics for the DBMS listed above. Some are normalized by throughput, others are not. Legend for results is here.
ips	qps	rps	rmbps	wps	wmbps	rpq	rkbpq	wpi	wkbpi	csps	cpups	cspq	cpupq	dbgb1	dbgb2	rss	maxop	p50	p99	tag
11907	14904	106198	1659.3	63384.9	1475.4	7.125	114.007	5.323	126.878	459298	33.7	30.817	1809	2416.1	2610.5	216.6	0.101	623	559	12000m.my5740_rel_native_lto.cy10_u
11901	16169	106126	1658.2	52929.7	1295.2	6.564	105.020	4.448	111.449	871896	31.5	53.925	1559	2416.6	2609.7	216.6	0.064	671	607	12000m.my5740_rel_native_lto.cy10_ua1
11907	15012	107254	1675.8	64515.9	1503.2	7.144	114.310	5.418	129.270	458304	32.3	30.528	1721	2416.8	2607.4	216.5	0.142	623	559	12000m.my5740_rel_native_lto.cy10_ua2
11904	14963	107014	1672.1	65775.0	1501.7	7.152	114.431	5.525	129.178	463919	31.3	31.005	1673	2416.8	2607.3	216.3	0.088	623	559	12000m.my5740_rel_native_lto.cy10_ua3
11898	9296	63925	2333.0	48191.5	810.8	6.877	257.000	4.051	69.787	855824	33.1	92.066	2849	2417.8	2612.0	216.6	0.178	384	320	12000m.my5740_rel_native_lto.cy10_ua4
q1000.1
q1000.1: range queries with 1000 insert/s per client. Graphs for performance per 1-second interval are here.
Average throughput:
Query response time histogram: each cell has the percentage of responses that take <= the time in the header and max is the max response time in seconds. For max values in the top 25% of the range have a red background and in the bottom 25% of the range have a green background. The red background is not used when the min value is within 80% of the max value.
| dbms | 256us | 1ms | 4ms | 16ms | 64ms | 256ms | 1s | 4s | 16s | gt | max |
|---|---|---|---|---|---|---|---|---|---|---|---|
| my5740_rel_native_lto.cy10_u | 18.682 | 21.826 | 52.970 | 6.477 | 0.045 | nonzero | 0.099 | ||||
| my5740_rel_native_lto.cy10_ua1 | 19.367 | 21.658 | 53.226 | 5.668 | 0.074 | 0.006 | 0.253 | ||||
| my5740_rel_native_lto.cy10_ua2 | 19.091 | 21.522 | 52.951 | 6.390 | 0.045 | nonzero | 0.106 | ||||
| my5740_rel_native_lto.cy10_ua3 | 18.796 | 21.768 | 52.788 | 6.598 | 0.051 | nonzero | nonzero | 0.257 | |||
| my5740_rel_native_lto.cy10_ua4 | 11.163 | 28.435 | 27.278 | 30.661 | 2.427 | 0.037 | nonzero | 0.313 |
Insert response time histogram: each cell has the percentage of responses that take <= the time in the header and max is the max response time in seconds. For max values in the top 25% of the range have a red background and in the bottom 25% of the range have a green background. The red background is not used when the min value is within 80% of the max value.
| dbms | 256us | 1ms | 4ms | 16ms | 64ms | 256ms | 1s | 4s | 16s | gt | max |
|---|---|---|---|---|---|---|---|---|---|---|---|
| my5740_rel_native_lto.cy10_u | 28.864 | 71.007 | 0.129 | nonzero | 0.286 | ||||||
| my5740_rel_native_lto.cy10_ua1 | 43.760 | 55.859 | 0.381 | nonzero | 0.443 | ||||||
| my5740_rel_native_lto.cy10_ua2 | 39.688 | 60.156 | 0.156 | nonzero | 0.259 | ||||||
| my5740_rel_native_lto.cy10_ua3 | nonzero | 36.006 | 63.769 | 0.224 | nonzero | 0.400 | |||||
| my5740_rel_native_lto.cy10_ua4 | nonzero | 2.205 | 85.255 | 12.500 | 0.040 | 0.792 |
Delete response time histogram: each cell has the percentage of responses that take <= the time in the header and max is the max response time in seconds. For max values in the top 25% of the range have a red background and in the bottom 25% of the range have a green background. The red background is not used when the min value is within 80% of the max value.
| dbms | 256us | 1ms | 4ms | 16ms | 64ms | 256ms | 1s | 4s | 16s | gt | max |
|---|---|---|---|---|---|---|---|---|---|---|---|
| my5740_rel_native_lto.cy10_u | 0.002 | 47.704 | 52.228 | 0.065 | 0.236 | ||||||
| my5740_rel_native_lto.cy10_ua1 | 0.004 | 66.931 | 32.838 | 0.227 | nonzero | 0.370 | |||||
| my5740_rel_native_lto.cy10_ua2 | 0.002 | 64.012 | 35.906 | 0.080 | 0.249 | ||||||
| my5740_rel_native_lto.cy10_ua3 | 0.002 | 58.070 | 41.814 | 0.113 | nonzero | 0.457 | |||||
| my5740_rel_native_lto.cy10_ua4 | 0.001 | 3.364 | 87.788 | 8.812 | 0.035 | 0.660 |
Performance metrics for the DBMS listed above. Some are normalized by throughput, others are not. Legend for results is here.
ips	qps	rps	rmbps	wps	wmbps	rpq	rkbpq	wpi	wkbpi	csps	cpups	cspq	cpupq	dbgb1	dbgb2	rss	maxop	p50	p99	tag
23821	13400	93165	1455.7	63945.2	1493.6	6.953	111.244	2.684	64.206	448853	45.1	33.497	2693	2420.2	2619.4	216.6	0.099	559	496	12000m.my5740_rel_native_lto.cy10_u
23802	13955	89641	1400.6	54320.2	1309.9	6.423	102.775	2.282	56.356	846461	42.4	60.655	2431	2428.0	2626.5	216.6	0.253	591	511	12000m.my5740_rel_native_lto.cy10_ua1
23821	13467	93678	1463.7	66718.6	1536.8	6.956	111.299	2.801	66.063	448707	43.0	33.319	2554	2421.2	2616.8	216.6	0.106	559	511	12000m.my5740_rel_native_lto.cy10_ua2
23821	13349	92927	1452.0	66150.5	1529.0	6.961	111.379	2.777	65.727	447501	43.6	33.522	2613	2421.1	2616.7	216.3	0.257	559	496	12000m.my5740_rel_native_lto.cy10_ua3
23220	6451	42739	1630.8	39010.3	713.3	6.625	258.863	1.680	31.458	652660	53.7	101.169	6659	2435.9	2649.2	216.7	0.313	272	192	12000m.my5740_rel_native_lto.cy10_ua4
l.i0
l.i0: load without secondary indexes
Performance metrics for all DBMS, not just the ones listed above. Some are normalized by throughput, others are not. Legend for results is here.
ips	qps	rps	rmbps	wps	wmbps	rpq	rkbpq	wpi	wkbpi	csps	cpups	cspq	cpupq	dbgb1	dbgb2	rss	maxop	p50	p99	tag
588351	0	1	0.0	3911.9	166.1	0.000	0.000	0.007	0.289	106956	42.0	0.182	57	789.3	917.8	216.3	0.305	24675	22178	12000m.my5740_rel_native_lto.cy10_u
591920	0	1	0.0	3935.1	167.2	0.000	0.000	0.007	0.289	119977	42.1	0.203	57	789.3	917.8	216.3	0.318	24773	22178	12000m.my5740_rel_native_lto.cy10_ua1
589507	0	1	0.0	3925.9	166.6	0.000	0.000	0.007	0.289	108342	42.0	0.184	57	789.3	917.8	216.3	0.298	24675	22178	12000m.my5740_rel_native_lto.cy10_ua2
587688	0	1	0.0	3913.6	166.1	0.000	0.000	0.007	0.289	107909	42.0	0.184	57	789.3	917.8	215.9	0.681	24577	22078	12000m.my5740_rel_native_lto.cy10_ua3
580664	0	2	0.0	2001.9	143.0	0.000	0.000	0.003	0.252	113223	42.0	0.195	58	789.3	917.8	216.3	0.397	24276	21881	12000m.my5740_rel_native_lto.cy10_ua4
l.x
l.x: create secondary indexes
Performance metrics for all DBMS, not just the ones listed above. Some are normalized by throughput, others are not. Legend for results is here.
ips	qps	rps	rmbps	wps	wmbps	rpq	rkbpq	wpi	wkbpi	csps	cpups	cspq	cpupq	dbgb1	dbgb2	rss	maxop	p50	p99	tag
1391316	0	14542	1171.6	21654.4	1509.4	0.010	0.862	0.016	1.111	182547	29.1	0.131	17	1764.9	1893.5	216.5	0.002	NA	NA	12000m.my5740_rel_native_lto.cy10_u
1643399	0	17188	1442.5	24769.3	1783.1	0.010	0.899	0.015	1.111	325975	30.0	0.198	15	1764.9	1893.5	216.5	0.002	NA	NA	12000m.my5740_rel_native_lto.cy10_ua1
1835720	0	19178	1559.1	27457.2	1989.6	0.010	0.870	0.015	1.110	234380	30.5	0.128	13	1764.9	1893.5	216.5	0.002	NA	NA	12000m.my5740_rel_native_lto.cy10_ua2
1748521	0	18278	1529.8	26581.2	1895.4	0.010	0.896	0.015	1.110	200185	30.6	0.114	14	1764.9	1893.5	216.1	0.003	NA	NA	12000m.my5740_rel_native_lto.cy10_ua3
1511728	0	11113	1311.1	17309.1	1559.9	0.007	0.888	0.011	1.057	250346	29.5	0.166	16	1764.9	1893.5	216.5	0.003	NA	NA	12000m.my5740_rel_native_lto.cy10_ua4
l.i1
l.i1: continue load after secondary indexes created
Performance metrics for all DBMS, not just the ones listed above. Some are normalized by throughput, others are not. Legend for results is here.
ips	qps	rps	rmbps	wps	wmbps	rpq	rkbpq	wpi	wkbpi	csps	cpups	cspq	cpupq	dbgb1	dbgb2	rss	maxop	p50	p99	tag
26426	0	46285	723.2	91971.5	2056.2	1.752	28.024	3.480	79.680	433620	44.2	16.409	1338	2416.1	2610.5	216.6	0.337	999	250	12000m.my5740_rel_native_lto.cy10_u
16579	0	30261	472.8	60529.5	1360.1	1.825	29.204	3.651	84.006	1242173	39.2	74.924	1892	2416.6	2609.1	216.5	0.514	450	150	12000m.my5740_rel_native_lto.cy10_ua1
25215	0	44461	694.7	94277.7	2081.0	1.763	28.212	3.739	84.511	442277	42.7	17.540	1355	2416.8	2607.4	216.5	0.435	949	300	12000m.my5740_rel_native_lto.cy10_ua2
25526	0	45072	704.2	95285.4	2105.5	1.766	28.251	3.733	84.461	446888	43.2	17.507	1354	2416.8	2607.3	216.3	0.576	949	250	12000m.my5740_rel_native_lto.cy10_ua3
12923	0	25703	650.6	54568.4	1035.0	1.989	51.556	4.223	82.015	860986	29.2	66.626	1808	2417.8	2610.3	216.6	0.725	300	100	12000m.my5740_rel_native_lto.cy10_ua4
q100.1
q100.1: range queries with 100 insert/s per client
Performance metrics for all DBMS, not just the ones listed above. Some are normalized by throughput, others are not. Legend for results is here.
ips	qps	rps	rmbps	wps	wmbps	rpq	rkbpq	wpi	wkbpi	csps	cpups	cspq	cpupq	dbgb1	dbgb2	rss	maxop	p50	p99	tag
2381	15354	104784	1637.3	48426.6	1272.9	6.824	109.191	20.340	547.484	424882	25.8	27.672	1344	2416.1	2610.5	216.6	0.303	719	256	12000m.my5740_rel_native_lto.cy10_u
2379	15783	101633	1588.0	42852.0	1112.3	6.439	103.028	18.014	478.790	880801	26.9	55.806	1363	2416.6	2609.1	216.5	0.330	751	256	12000m.my5740_rel_native_lto.cy10_ua1
2381	15513	106049	1657.0	50250.9	1290.9	6.836	109.378	21.107	555.225	431329	25.7	27.804	1325	2416.8	2607.4	216.5	0.383	703	272	12000m.my5740_rel_native_lto.cy10_ua2
2381	15525	106283	1660.7	49682.4	1295.4	6.846	109.533	20.868	557.170	426747	25.5	27.487	1314	2416.8	2607.3	216.3	0.326	703	288	12000m.my5740_rel_native_lto.cy10_ua3
2377	10122	68313	2494.0	46226.5	784.3	6.749	252.322	19.449	337.893	755861	28.1	74.679	2221	2417.8	2610.3	216.6	0.610	464	144	12000m.my5740_rel_native_lto.cy10_ua4
q500.1
q500.1: range queries with 500 insert/s per client
Performance metrics for all DBMS, not just the ones listed above. Some are normalized by throughput, others are not. Legend for results is here.
ips	qps	rps	rmbps	wps	wmbps	rpq	rkbpq	wpi	wkbpi	csps	cpups	cspq	cpupq	dbgb1	dbgb2	rss	maxop	p50	p99	tag
11907	14904	106198	1659.3	63384.9	1475.4	7.125	114.007	5.323	126.878	459298	33.7	30.817	1809	2416.1	2610.5	216.6	0.101	623	559	12000m.my5740_rel_native_lto.cy10_u
11901	16169	106126	1658.2	52929.7	1295.2	6.564	105.020	4.448	111.449	871896	31.5	53.925	1559	2416.6	2609.7	216.6	0.064	671	607	12000m.my5740_rel_native_lto.cy10_ua1
11907	15012	107254	1675.8	64515.9	1503.2	7.144	114.310	5.418	129.270	458304	32.3	30.528	1721	2416.8	2607.4	216.5	0.142	623	559	12000m.my5740_rel_native_lto.cy10_ua2
11904	14963	107014	1672.1	65775.0	1501.7	7.152	114.431	5.525	129.178	463919	31.3	31.005	1673	2416.8	2607.3	216.3	0.088	623	559	12000m.my5740_rel_native_lto.cy10_ua3
11898	9296	63925	2333.0	48191.5	810.8	6.877	257.000	4.051	69.787	855824	33.1	92.066	2849	2417.8	2612.0	216.6	0.178	384	320	12000m.my5740_rel_native_lto.cy10_ua4
q1000.1
q1000.1: range queries with 1000 insert/s per client
Performance metrics for all DBMS, not just the ones listed above. Some are normalized by throughput, others are not. Legend for results is here.
ips	qps	rps	rmbps	wps	wmbps	rpq	rkbpq	wpi	wkbpi	csps	cpups	cspq	cpupq	dbgb1	dbgb2	rss	maxop	p50	p99	tag
23821	13400	93165	1455.7	63945.2	1493.6	6.953	111.244	2.684	64.206	448853	45.1	33.497	2693	2420.2	2619.4	216.6	0.099	559	496	12000m.my5740_rel_native_lto.cy10_u
23802	13955	89641	1400.6	54320.2	1309.9	6.423	102.775	2.282	56.356	846461	42.4	60.655	2431	2428.0	2626.5	216.6	0.253	591	511	12000m.my5740_rel_native_lto.cy10_ua1
23821	13467	93678	1463.7	66718.6	1536.8	6.956	111.299	2.801	66.063	448707	43.0	33.319	2554	2421.2	2616.8	216.6	0.106	559	511	12000m.my5740_rel_native_lto.cy10_ua2
23821	13349	92927	1452.0	66150.5	1529.0	6.961	111.379	2.777	65.727	447501	43.6	33.522	2613	2421.1	2616.7	216.3	0.257	559	496	12000m.my5740_rel_native_lto.cy10_ua3
23220	6451	42739	1630.8	39010.3	713.3	6.625	258.863	1.680	31.458	652660	53.7	101.169	6659	2435.9	2649.2	216.7	0.313	272	192	12000m.my5740_rel_native_lto.cy10_ua4
l.i0
- l.i0: load without secondary indexes
- Legend for results is here.
- Each entry lists the percentage of responses that fit in that bucket (slower than max time for previous bucket, faster than min time for next bucket).
Insert response time histogram
256us	1ms	4ms	16ms	64ms	256ms	1s	4s	16s	gt	max	tag
0.000	0.007	52.911	47.035	0.013	0.033	nonzero	0.000	0.000	0.000	0.305	my5740_rel_native_lto.cy10_u
0.000	0.005	55.669	44.280	0.012	0.034	nonzero	0.000	0.000	0.000	0.318	my5740_rel_native_lto.cy10_ua1
0.000	0.008	53.897	46.048	0.013	0.034	nonzero	0.000	0.000	0.000	0.298	my5740_rel_native_lto.cy10_ua2
0.000	0.008	52.656	47.290	0.012	0.035	nonzero	0.000	0.000	0.000	0.681	my5740_rel_native_lto.cy10_ua3
0.000	0.008	47.994	51.950	0.022	0.025	nonzero	0.000	0.000	0.000	0.397	my5740_rel_native_lto.cy10_ua4
l.x
- l.x: create secondary indexes
- Legend for results is here.
- Each entry lists the percentage of responses that fit in that bucket (slower than max time for previous bucket, faster than min time for next bucket).
TODO - determine whether there is data for create index response time
l.i1
- l.i1: continue load after secondary indexes created
- Legend for results is here.
- Each entry lists the percentage of responses that fit in that bucket (slower than max time for previous bucket, faster than min time for next bucket).
Insert response time histogram
256us	1ms	4ms	16ms	64ms	256ms	1s	4s	16s	gt	max	tag
0.000	0.000	0.000	1.527	80.281	18.186	0.006	0.000	0.000	0.000	0.337	my5740_rel_native_lto.cy10_u
0.000	0.000	0.000	1.013	66.417	28.905	3.665	0.000	0.000	0.000	0.514	my5740_rel_native_lto.cy10_ua1
0.000	0.000	0.000	1.631	79.152	19.188	0.029	0.000	0.000	0.000	0.435	my5740_rel_native_lto.cy10_ua2
0.000	0.000	0.000	2.012	79.007	18.971	0.009	0.000	0.000	0.000	0.576	my5740_rel_native_lto.cy10_ua3
0.000	0.000	0.000	0.850	60.262	29.238	9.649	0.000	0.000	0.000	0.725	my5740_rel_native_lto.cy10_ua4
Delete response time histogram
256us	1ms	4ms	16ms	64ms	256ms	1s	4s	16s	gt	max	tag
0.000	0.000	0.085	42.226	57.508	0.182	0.000	0.000	0.000	0.000	0.236	my5740_rel_native_lto.cy10_u
0.000	0.000	0.856	43.198	55.663	0.284	0.000	0.000	0.000	0.000	0.253	my5740_rel_native_lto.cy10_ua1
0.000	0.000	0.140	43.157	56.444	0.258	0.001	0.000	0.000	0.000	0.335	my5740_rel_native_lto.cy10_ua2
0.000	0.000	0.113	43.886	55.775	0.226	0.000	0.000	0.000	0.000	0.245	my5740_rel_native_lto.cy10_ua3
0.000	0.000	0.532	44.918	54.162	0.388	0.000	0.000	0.000	0.000	0.175	my5740_rel_native_lto.cy10_ua4
q100.1
- q100.1: range queries with 100 insert/s per client
- Legend for results is here.
- Each entry lists the percentage of responses that fit in that bucket (slower than max time for previous bucket, faster than min time for next bucket).
Query response time histogram
256us	1ms	4ms	16ms	64ms	256ms	1s	4s	16s	gt	max	tag
29.855	12.833	54.024	3.048	0.235	0.006	nonzero	0.000	0.000	0.000	0.303	my5740_rel_native_lto.cy10_u
29.453	13.956	53.174	3.100	0.312	0.005	nonzero	0.000	0.000	0.000	0.330	my5740_rel_native_lto.cy10_ua1
29.785	12.918	54.083	3.038	0.170	0.007	nonzero	0.000	0.000	0.000	0.383	my5740_rel_native_lto.cy10_ua2
29.771	12.912	54.145	3.002	0.164	0.006	nonzero	0.000	0.000	0.000	0.326	my5740_rel_native_lto.cy10_ua3
23.867	19.330	38.269	18.019	0.511	0.003	nonzero	0.000	0.000	0.000	0.610	my5740_rel_native_lto.cy10_ua4
Insert response time histogram
256us	1ms	4ms	16ms	64ms	256ms	1s	4s	16s	gt	max	tag
0.000	0.000	0.000	69.992	29.075	0.908	0.024	0.000	0.000	0.000	0.348	my5740_rel_native_lto.cy10_u
0.000	0.000	0.000	59.582	39.588	0.818	0.012	0.000	0.000	0.000	0.338	my5740_rel_native_lto.cy10_ua1
0.000	0.000	0.000	71.009	27.650	1.270	0.071	0.000	0.000	0.000	0.412	my5740_rel_native_lto.cy10_ua2
0.000	0.000	0.000	71.646	27.115	1.156	0.083	0.000	0.000	0.000	0.438	my5740_rel_native_lto.cy10_ua3
0.000	0.000	0.000	40.120	59.340	0.537	0.003	0.000	0.000	0.000	0.350	my5740_rel_native_lto.cy10_ua4
Delete response time histogram
256us	1ms	4ms	16ms	64ms	256ms	1s	4s	16s	gt	max	tag
0.000	0.000	0.012	81.207	18.145	0.624	0.013	0.000	0.000	0.000	0.340	my5740_rel_native_lto.cy10_u
0.000	0.000	0.009	79.690	19.754	0.539	0.008	0.000	0.000	0.000	0.333	my5740_rel_native_lto.cy10_ua1
0.000	0.000	0.016	82.525	16.512	0.906	0.041	0.000	0.000	0.000	0.414	my5740_rel_native_lto.cy10_ua2
0.000	0.000	0.013	82.877	16.249	0.818	0.042	0.000	0.000	0.000	0.388	my5740_rel_native_lto.cy10_ua3
0.000	0.000	0.013	77.011	22.731	0.242	0.002	0.000	0.000	0.000	0.344	my5740_rel_native_lto.cy10_ua4
q500.1
- q500.1: range queries with 500 insert/s per client
- Legend for results is here.
- Each entry lists the percentage of responses that fit in that bucket (slower than max time for previous bucket, faster than min time for next bucket).
Query response time histogram
256us	1ms	4ms	16ms	64ms	256ms	1s	4s	16s	gt	max	tag
24.525	16.983	54.983	3.486	0.022	nonzero	0.000	0.000	0.000	0.000	0.101	my5740_rel_native_lto.cy10_u
25.033	17.212	55.674	2.059	0.021	0.000	0.000	0.000	0.000	0.000	0.064	my5740_rel_native_lto.cy10_ua1
24.588	16.975	55.158	3.260	0.019	nonzero	0.000	0.000	0.000	0.000	0.142	my5740_rel_native_lto.cy10_ua2
24.651	16.904	55.139	3.291	0.015	nonzero	0.000	0.000	0.000	0.000	0.088	my5740_rel_native_lto.cy10_ua3
19.055	22.721	32.260	25.844	0.118	0.001	0.000	0.000	0.000	0.000	0.178	my5740_rel_native_lto.cy10_ua4
Insert response time histogram
256us	1ms	4ms	16ms	64ms	256ms	1s	4s	16s	gt	max	tag
0.000	0.000	0.000	20.077	79.870	0.053	0.000	0.000	0.000	0.000	0.115	my5740_rel_native_lto.cy10_u
0.000	0.000	0.000	44.231	55.715	0.054	0.000	0.000	0.000	0.000	0.159	my5740_rel_native_lto.cy10_ua1
0.000	0.000	0.000	31.222	68.649	0.128	0.002	0.000	0.000	0.000	0.331	my5740_rel_native_lto.cy10_ua2
0.000	0.000	0.000	39.006	60.959	0.036	0.000	0.000	0.000	0.000	0.193	my5740_rel_native_lto.cy10_ua3
0.000	0.000	nonzero	32.669	67.085	0.246	0.000	0.000	0.000	0.000	0.221	my5740_rel_native_lto.cy10_ua4
Delete response time histogram
256us	1ms	4ms	16ms	64ms	256ms	1s	4s	16s	gt	max	tag
0.000	0.000	0.013	52.273	47.707	0.006	0.000	0.000	0.000	0.000	0.102	my5740_rel_native_lto.cy10_u
0.000	0.000	0.023	95.296	4.675	0.006	0.000	0.000	0.000	0.000	0.102	my5740_rel_native_lto.cy10_ua1
0.000	0.000	0.015	78.679	21.282	0.025	0.000	0.000	0.000	0.000	0.250	my5740_rel_native_lto.cy10_ua2
0.000	0.000	0.008	92.679	7.304	0.009	0.000	0.000	0.000	0.000	0.167	my5740_rel_native_lto.cy10_ua3
0.000	0.000	0.017	80.648	19.294	0.041	0.000	0.000	0.000	0.000	0.201	my5740_rel_native_lto.cy10_ua4
q1000.1
- q1000.1: range queries with 1000 insert/s per client
- Legend for results is here.
- Each entry lists the percentage of responses that fit in that bucket (slower than max time for previous bucket, faster than min time for next bucket).
Query response time histogram
256us	1ms	4ms	16ms	64ms	256ms	1s	4s	16s	gt	max	tag
18.682	21.826	52.970	6.477	0.045	nonzero	0.000	0.000	0.000	0.000	0.099	my5740_rel_native_lto.cy10_u
19.367	21.658	53.226	5.668	0.074	0.006	0.000	0.000	0.000	0.000	0.253	my5740_rel_native_lto.cy10_ua1
19.091	21.522	52.951	6.390	0.045	nonzero	0.000	0.000	0.000	0.000	0.106	my5740_rel_native_lto.cy10_ua2
18.796	21.768	52.788	6.598	0.051	nonzero	nonzero	0.000	0.000	0.000	0.257	my5740_rel_native_lto.cy10_ua3
11.163	28.435	27.278	30.661	2.427	0.037	nonzero	0.000	0.000	0.000	0.313	my5740_rel_native_lto.cy10_ua4
Insert response time histogram
256us	1ms	4ms	16ms	64ms	256ms	1s	4s	16s	gt	max	tag
0.000	0.000	0.000	28.864	71.007	0.129	nonzero	0.000	0.000	0.000	0.286	my5740_rel_native_lto.cy10_u
0.000	0.000	0.000	43.760	55.859	0.381	nonzero	0.000	0.000	0.000	0.443	my5740_rel_native_lto.cy10_ua1
0.000	0.000	0.000	39.688	60.156	0.156	nonzero	0.000	0.000	0.000	0.259	my5740_rel_native_lto.cy10_ua2
0.000	0.000	nonzero	36.006	63.769	0.224	nonzero	0.000	0.000	0.000	0.400	my5740_rel_native_lto.cy10_ua3
0.000	0.000	nonzero	2.205	85.255	12.500	0.040	0.000	0.000	0.000	0.792	my5740_rel_native_lto.cy10_ua4
Delete response time histogram
256us	1ms	4ms	16ms	64ms	256ms	1s	4s	16s	gt	max	tag
0.000	0.000	0.002	47.704	52.228	0.065	0.000	0.000	0.000	0.000	0.236	my5740_rel_native_lto.cy10_u
0.000	0.000	0.004	66.931	32.838	0.227	nonzero	0.000	0.000	0.000	0.370	my5740_rel_native_lto.cy10_ua1
0.000	0.000	0.002	64.012	35.906	0.080	0.000	0.000	0.000	0.000	0.249	my5740_rel_native_lto.cy10_ua2
0.000	0.000	0.002	58.070	41.814	0.113	nonzero	0.000	0.000	0.000	0.457	my5740_rel_native_lto.cy10_ua3
0.000	0.000	0.001	3.364	87.788	8.812	0.035	0.000	0.000	0.000	0.660	my5740_rel_native_lto.cy10_ua4