Introduction
This is a report for the insert benchmark with 480M docs and 24 client(s). It is generated by scripts (bash, awk, sed) and Tufte might not be impressed. An overview of the insert benchmark is here and a short update is here. Below, by DBMS, I mean DBMS+version.config. An example is my8020.c10b40 where my means MySQL, 8020 is version 8.0.20 and c10b40 is the name for the configuration file.
The test server has 80 cores with hyperthreads enabled, 256G RAM and fast storage. The benchmark was run with 24 client and there were 1 or 3 connections per client (1 for queries or inserts without rate limits, 1+1 for rate limited inserts+deletes). There are 24 tables, with a client per table. It loads 480M rows without secondary indexes, creates secondary indexes, then inserts 960M rows with a delete per insert to avoid growing the table. It then does 3 read+write tests for 3600s each that do queries as fast as possible with 100, 500 and then 1000 inserts/second/client concurrent with the queries and 1000 deletes/second to avoid growing the table. The database is cached by InnoDB.
The tested DBMS are:
- my5651_rel_native_lto.cy10_u - InnoDB and MySQL 5.6.51, rel_native_lto build, cy10_u config, compiled with CMAKE_BUILD_TYPE=Release
- my5651_rel_native_lto.cy10_ua1 - InnoDB and MySQL 5.6.51, rel_native_lto build, cy10_ua1 config, compiled with CMAKE_BUILD_TYPE=Release, adds innodb_use_native_aio=off
- my5651_rel_native_lto.cy10_ua2 - InnoDB and MySQL 5.6.51, rel_native_lto build, cy10_ua2 config, compiled with CMAKE_BUILD_TYPE=Release, adds innodb_io_capacity=20k, innodb_io_capacity_max=40k
Contents
- Summary
- l.i0: load without secondary indexes
- l.x: create secondary indexes
- l.i1: continue load after secondary indexes created
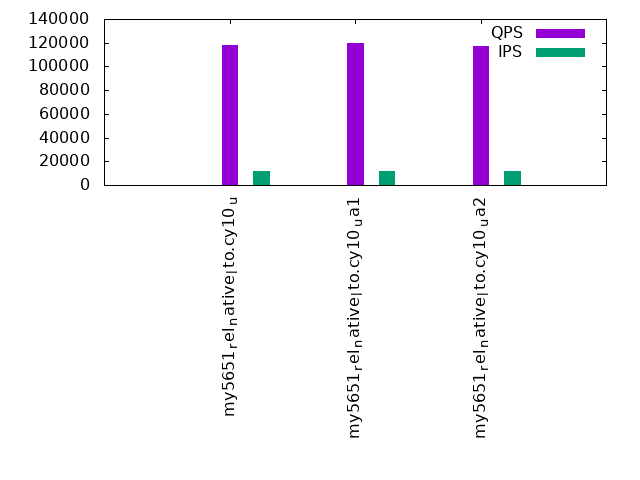
- q100.1: range queries with 100 insert/s per client
- q500.1: range queries with 500 insert/s per client
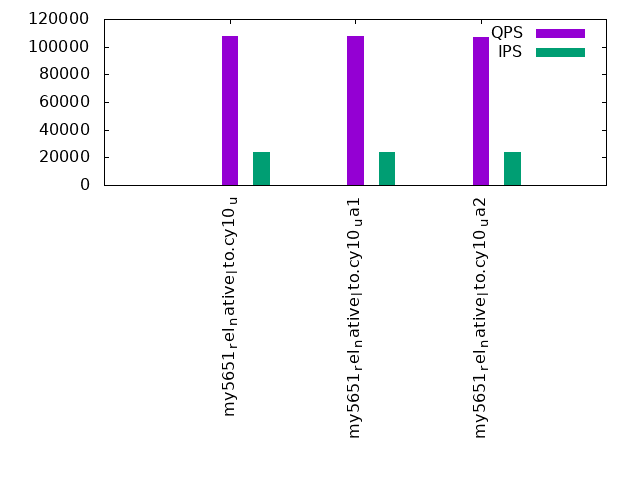
- q1000.1: range queries with 1000 insert/s per client
Summary
The numbers are inserts/s for l.i0 and l.i1, indexed docs (or rows) /s for l.x and queries/s for q*.2. The values are the average rate over the entire test for inserts (IPS) and queries (QPS). The range of values for IPS and QPS is split into 3 parts: bottom 25%, middle 50%, top 25%. Values in the bottom 25% have a red background, values in the top 25% have a green background and values in the middle have no color. A gray background is used for values that can be ignored because the DBMS did not sustain the target insert rate. Red backgrounds are not used when the minimum value is within 80% of the max value.
| dbms | l.i0 | l.x | l.i1 | q100.1 | q500.1 | q1000.1 |
|---|---|---|---|---|---|---|
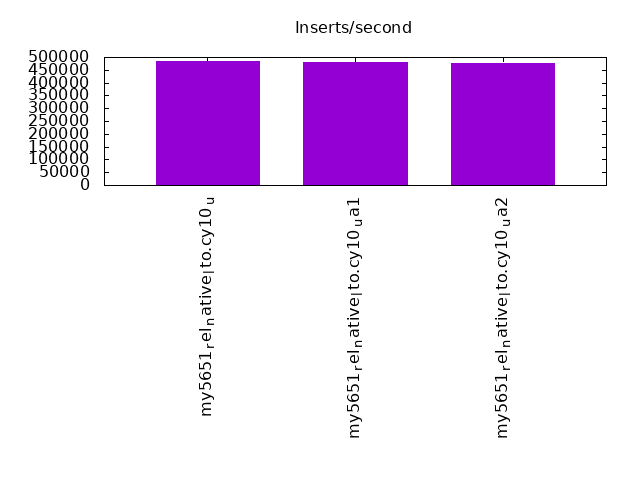
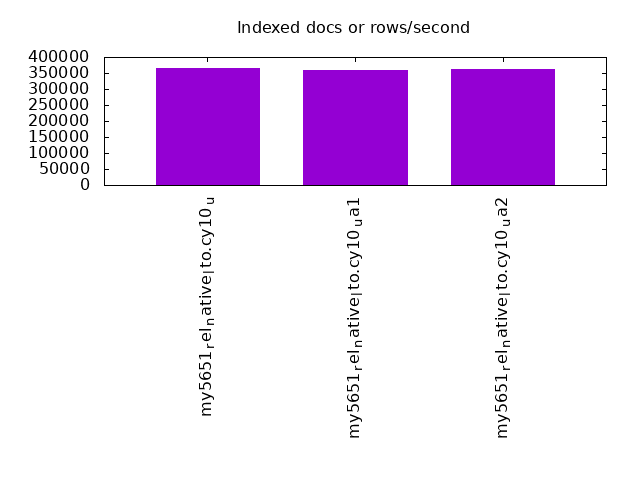
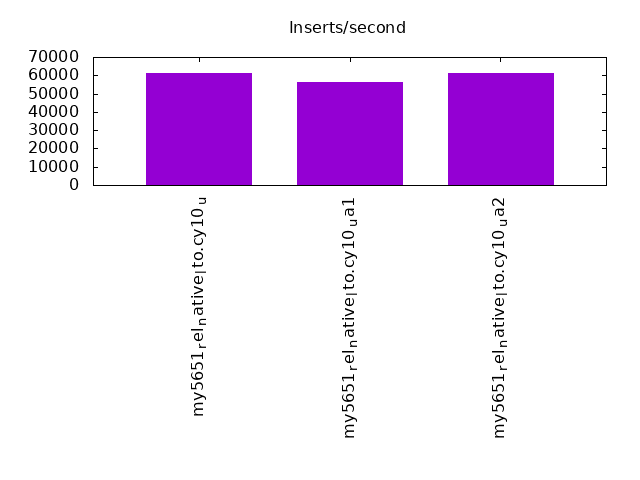
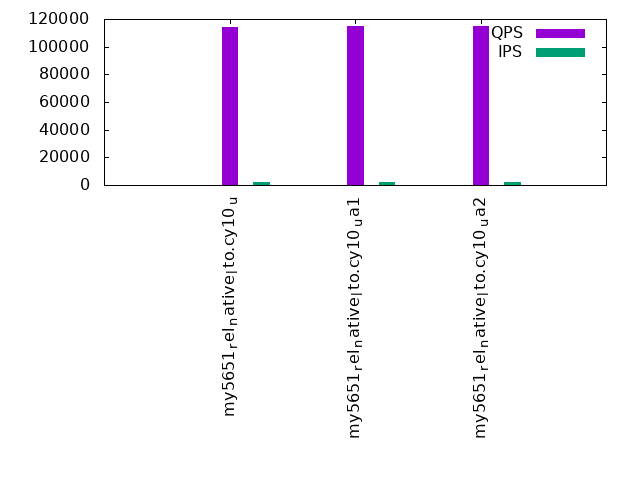
| my5651_rel_native_lto.cy10_u | 483871 | 365095 | 61511 | 114414 | 118373 | 107661 |
| my5651_rel_native_lto.cy10_ua1 | 481444 | 358819 | 56411 | 114623 | 120045 | 107721 |
| my5651_rel_native_lto.cy10_ua2 | 476663 | 362887 | 61491 | 114959 | 116869 | 107269 |
This table has relative throughput, throughput for the DBMS relative to the DBMS in the first line, using the absolute throughput from the previous table. Values less than 0.95 have a yellow background. Values greater than 1.05 have a blue background.
| dbms | l.i0 | l.x | l.i1 | q100.1 | q500.1 | q1000.1 |
|---|---|---|---|---|---|---|
| my5651_rel_native_lto.cy10_u | 1.00 | 1.00 | 1.00 | 1.00 | 1.00 | 1.00 |
| my5651_rel_native_lto.cy10_ua1 | 0.99 | 0.98 | 0.92 | 1.00 | 1.01 | 1.00 |
| my5651_rel_native_lto.cy10_ua2 | 0.99 | 0.99 | 1.00 | 1.00 | 0.99 | 1.00 |
This lists the average rate of inserts/s for the tests that do inserts concurrent with queries. For such tests the query rate is listed in the table above. The read+write tests are setup so that the insert rate should match the target rate every second. Cells that are not at least 95% of the target have a red background to indicate a failure to satisfy the target.
| dbms | q100.1 | q500.1 | q1000.1 |
|---|---|---|---|
| my5651_rel_native_lto.cy10_u | 2380 | 11904 | 23834 |
| my5651_rel_native_lto.cy10_ua1 | 2380 | 11907 | 23828 |
| my5651_rel_native_lto.cy10_ua2 | 2379 | 11907 | 23828 |
| target | 2400 | 12000 | 24000 |
l.i0
l.i0: load without secondary indexes. Graphs for performance per 1-second interval are here.
Average throughput:
Insert response time histogram: each cell has the percentage of responses that take <= the time in the header and max is the max response time in seconds. For the max column values in the top 25% of the range have a red background and in the bottom 25% of the range have a green background. The red background is not used when the min value is within 80% of the max value.
| dbms | 256us | 1ms | 4ms | 16ms | 64ms | 256ms | 1s | 4s | 16s | gt | max |
|---|---|---|---|---|---|---|---|---|---|---|---|
| my5651_rel_native_lto.cy10_u | 0.347 | 11.482 | 87.914 | 0.215 | 0.043 | 0.100 | |||||
| my5651_rel_native_lto.cy10_ua1 | 0.346 | 11.402 | 87.996 | 0.214 | 0.043 | 0.097 | |||||
| my5651_rel_native_lto.cy10_ua2 | 0.340 | 9.997 | 89.393 | 0.228 | 0.043 | 0.090 |
Performance metrics for the DBMS listed above. Some are normalized by throughput, others are not. Legend for results is here.
ips	qps	rps	rmbps	wps	wmbps	rpq	rkbpq	wpi	wkbpi	csps	cpups	cspq	cpupq	dbgb1	dbgb2	rss	maxop	p50	p99	tag
483871	0	0	0.0	2283.9	112.3	0.000	0.000	0.005	0.238	77635	38.7	0.160	64	31.8	160.3	46.5	0.100	20177	17882	480m.my5651_rel_native_lto.cy10_u
481444	0	0	0.0	1253.5	106.7	0.000	0.000	0.003	0.227	73199	38.3	0.152	64	31.8	160.3	46.5	0.097	20180	17881	480m.my5651_rel_native_lto.cy10_ua1
476663	0	0	0.0	2290.4	110.8	0.000	0.000	0.005	0.238	76305	38.3	0.160	64	31.8	160.3	46.5	0.090	19880	17483	480m.my5651_rel_native_lto.cy10_ua2
l.x
l.x: create secondary indexes.
Average throughput:
Performance metrics for the DBMS listed above. Some are normalized by throughput, others are not. Legend for results is here.
ips	qps	rps	rmbps	wps	wmbps	rpq	rkbpq	wpi	wkbpi	csps	cpups	cspq	cpupq	dbgb1	dbgb2	rss	maxop	p50	p99	tag
365095	0	0	0.0	20148.6	687.1	0.000	0.000	0.055	1.927	75986	31.1	0.208	68	65.2	193.7	80.7	0.002	NA	NA	480m.my5651_rel_native_lto.cy10_u
358819	0	0	0.0	16232.2	638.5	0.000	0.000	0.045	1.822	67467	31.5	0.188	70	65.2	193.7	80.7	0.002	NA	NA	480m.my5651_rel_native_lto.cy10_ua1
362887	0	0	0.0	19984.1	681.8	0.000	0.000	0.055	1.924	76169	31.2	0.210	69	65.2	193.7	80.7	0.002	NA	NA	480m.my5651_rel_native_lto.cy10_ua2
l.i1
l.i1: continue load after secondary indexes created. Graphs for performance per 1-second interval are here.
Average throughput:
Insert response time histogram: each cell has the percentage of responses that take <= the time in the header and max is the max response time in seconds. For the max column values in the top 25% of the range have a red background and in the bottom 25% of the range have a green background. The red background is not used when the min value is within 80% of the max value.
| dbms | 256us | 1ms | 4ms | 16ms | 64ms | 256ms | 1s | 4s | 16s | gt | max |
|---|---|---|---|---|---|---|---|---|---|---|---|
| my5651_rel_native_lto.cy10_u | 0.008 | 16.328 | 83.638 | 0.025 | 0.163 | ||||||
| my5651_rel_native_lto.cy10_ua1 | 0.007 | 7.614 | 92.354 | 0.025 | 0.153 | ||||||
| my5651_rel_native_lto.cy10_ua2 | 0.014 | 17.451 | 82.508 | 0.027 | nonzero | 3.842 |
Delete response time histogram: each cell has the percentage of responses that take <= the time in the header and max is the max response time in seconds. For the max column values in the top 25% of the range have a red background and in the bottom 25% of the range have a green background. The red background is not used when the min value is within 80% of the max value.
| dbms | 256us | 1ms | 4ms | 16ms | 64ms | 256ms | 1s | 4s | 16s | gt | max |
|---|---|---|---|---|---|---|---|---|---|---|---|
| my5651_rel_native_lto.cy10_u | 0.013 | 21.062 | 78.918 | 0.007 | 0.151 | ||||||
| my5651_rel_native_lto.cy10_ua1 | 0.013 | 11.745 | 88.237 | 0.005 | 0.136 | ||||||
| my5651_rel_native_lto.cy10_ua2 | 0.017 | 22.217 | 77.757 | 0.008 | nonzero | 3.843 |
Performance metrics for the DBMS listed above. Some are normalized by throughput, others are not. Legend for results is here.
ips	qps	rps	rmbps	wps	wmbps	rpq	rkbpq	wpi	wkbpi	csps	cpups	cspq	cpupq	dbgb1	dbgb2	rss	maxop	p50	p99	tag
61511	0	1469	6.3	6840.1	212.3	0.024	0.105	0.111	3.535	134852	66.6	2.192	866	217.4	393.8	215.8	0.163	2547	2048	480m.my5651_rel_native_lto.cy10_u
56411	0	1414	6.1	5871.9	197.9	0.025	0.111	0.104	3.593	135569	66.3	2.403	940	217.6	394.1	215.8	0.153	2348	1898	480m.my5651_rel_native_lto.cy10_ua1
61491	0	1387	6.0	6845.9	212.6	0.023	0.100	0.111	3.540	135141	66.7	2.198	868	217.5	393.9	215.8	3.842	2547	2048	480m.my5651_rel_native_lto.cy10_ua2
q100.1
q100.1: range queries with 100 insert/s per client. Graphs for performance per 1-second interval are here.
Average throughput:
Query response time histogram: each cell has the percentage of responses that take <= the time in the header and max is the max response time in seconds. For max values in the top 25% of the range have a red background and in the bottom 25% of the range have a green background. The red background is not used when the min value is within 80% of the max value.
| dbms | 256us | 1ms | 4ms | 16ms | 64ms | 256ms | 1s | 4s | 16s | gt | max |
|---|---|---|---|---|---|---|---|---|---|---|---|
| my5651_rel_native_lto.cy10_u | 93.070 | 6.651 | 0.164 | 0.115 | nonzero | 0.023 | |||||
| my5651_rel_native_lto.cy10_ua1 | 93.079 | 6.643 | 0.168 | 0.110 | nonzero | 0.047 | |||||
| my5651_rel_native_lto.cy10_ua2 | 93.336 | 6.399 | 0.154 | 0.110 | nonzero | 0.022 |
Insert response time histogram: each cell has the percentage of responses that take <= the time in the header and max is the max response time in seconds. For max values in the top 25% of the range have a red background and in the bottom 25% of the range have a green background. The red background is not used when the min value is within 80% of the max value.
| dbms | 256us | 1ms | 4ms | 16ms | 64ms | 256ms | 1s | 4s | 16s | gt | max |
|---|---|---|---|---|---|---|---|---|---|---|---|
| my5651_rel_native_lto.cy10_u | 32.093 | 67.597 | 0.310 | 0.044 | |||||||
| my5651_rel_native_lto.cy10_ua1 | 41.186 | 58.674 | 0.140 | 0.025 | |||||||
| my5651_rel_native_lto.cy10_ua2 | 36.615 | 63.261 | 0.124 | 0.048 |
Delete response time histogram: each cell has the percentage of responses that take <= the time in the header and max is the max response time in seconds. For max values in the top 25% of the range have a red background and in the bottom 25% of the range have a green background. The red background is not used when the min value is within 80% of the max value.
| dbms | 256us | 1ms | 4ms | 16ms | 64ms | 256ms | 1s | 4s | 16s | gt | max |
|---|---|---|---|---|---|---|---|---|---|---|---|
| my5651_rel_native_lto.cy10_u | 64.556 | 35.388 | 0.056 | 0.044 | |||||||
| my5651_rel_native_lto.cy10_ua1 | 74.065 | 25.927 | 0.008 | 0.022 | |||||||
| my5651_rel_native_lto.cy10_ua2 | 70.832 | 29.159 | 0.009 | 0.026 |
Performance metrics for the DBMS listed above. Some are normalized by throughput, others are not. Legend for results is here.
ips	qps	rps	rmbps	wps	wmbps	rpq	rkbpq	wpi	wkbpi	csps	cpups	cspq	cpupq	dbgb1	dbgb2	rss	maxop	p50	p99	tag
2380	114414	1140	16.8	6756.2	195.3	0.010	0.150	2.839	84.042	488018	39.8	4.265	278	217.4	393.8	215.9	0.023	4795	4412	480m.my5651_rel_native_lto.cy10_u
2380	114623	749	16.6	6401.7	195.6	0.007	0.149	2.690	84.191	485023	39.7	4.231	277	217.6	394.1	215.8	0.047	4812	4428	480m.my5651_rel_native_lto.cy10_ua1
2379	114959	1134	16.7	6813.2	196.8	0.010	0.149	2.864	84.735	487704	39.5	4.242	275	217.5	393.9	215.9	0.022	4811	4428	480m.my5651_rel_native_lto.cy10_ua2
q500.1
q500.1: range queries with 500 insert/s per client. Graphs for performance per 1-second interval are here.
Average throughput:
Query response time histogram: each cell has the percentage of responses that take <= the time in the header and max is the max response time in seconds. For max values in the top 25% of the range have a red background and in the bottom 25% of the range have a green background. The red background is not used when the min value is within 80% of the max value.
| dbms | 256us | 1ms | 4ms | 16ms | 64ms | 256ms | 1s | 4s | 16s | gt | max |
|---|---|---|---|---|---|---|---|---|---|---|---|
| my5651_rel_native_lto.cy10_u | 95.144 | 4.752 | 0.034 | 0.070 | nonzero | 0.061 | |||||
| my5651_rel_native_lto.cy10_ua1 | 95.738 | 4.163 | 0.037 | 0.061 | nonzero | 0.027 | |||||
| my5651_rel_native_lto.cy10_ua2 | 94.236 | 5.644 | 0.043 | 0.077 | nonzero | 0.037 |
Insert response time histogram: each cell has the percentage of responses that take <= the time in the header and max is the max response time in seconds. For max values in the top 25% of the range have a red background and in the bottom 25% of the range have a green background. The red background is not used when the min value is within 80% of the max value.
| dbms | 256us | 1ms | 4ms | 16ms | 64ms | 256ms | 1s | 4s | 16s | gt | max |
|---|---|---|---|---|---|---|---|---|---|---|---|
| my5651_rel_native_lto.cy10_u | 10.727 | 89.101 | 0.172 | 0.001 | 0.077 | ||||||
| my5651_rel_native_lto.cy10_ua1 | 28.882 | 71.094 | 0.024 | 0.033 | |||||||
| my5651_rel_native_lto.cy10_ua2 | 5.896 | 91.006 | 3.097 | 0.001 | 0.072 |
Delete response time histogram: each cell has the percentage of responses that take <= the time in the header and max is the max response time in seconds. For max values in the top 25% of the range have a red background and in the bottom 25% of the range have a green background. The red background is not used when the min value is within 80% of the max value.
| dbms | 256us | 1ms | 4ms | 16ms | 64ms | 256ms | 1s | 4s | 16s | gt | max |
|---|---|---|---|---|---|---|---|---|---|---|---|
| my5651_rel_native_lto.cy10_u | 16.760 | 83.173 | 0.066 | 0.001 | 0.074 | ||||||
| my5651_rel_native_lto.cy10_ua1 | 42.807 | 57.176 | 0.017 | 0.027 | |||||||
| my5651_rel_native_lto.cy10_ua2 | 10.033 | 88.935 | 1.032 | 0.001 | 0.072 |
Performance metrics for the DBMS listed above. Some are normalized by throughput, others are not. Legend for results is here.
ips	qps	rps	rmbps	wps	wmbps	rpq	rkbpq	wpi	wkbpi	csps	cpups	cspq	cpupq	dbgb1	dbgb2	rss	maxop	p50	p99	tag
11904	118373	823	8.4	5354.0	155.7	0.007	0.073	0.450	13.394	500843	42.5	4.231	287	217.4	393.8	215.9	0.061	4891	4460	480m.my5651_rel_native_lto.cy10_u
11907	120045	803	8.2	4778.0	154.6	0.007	0.070	0.401	13.293	504313	41.7	4.201	278	217.6	394.1	215.8	0.027	4971	4556	480m.my5651_rel_native_lto.cy10_ua1
11907	116869	829	8.6	5373.9	156.2	0.007	0.075	0.451	13.434	494579	43.5	4.232	298	217.5	393.9	215.9	0.037	4859	4444	480m.my5651_rel_native_lto.cy10_ua2
q1000.1
q1000.1: range queries with 1000 insert/s per client. Graphs for performance per 1-second interval are here.
Average throughput:
Query response time histogram: each cell has the percentage of responses that take <= the time in the header and max is the max response time in seconds. For max values in the top 25% of the range have a red background and in the bottom 25% of the range have a green background. The red background is not used when the min value is within 80% of the max value.
| dbms | 256us | 1ms | 4ms | 16ms | 64ms | 256ms | 1s | 4s | 16s | gt | max |
|---|---|---|---|---|---|---|---|---|---|---|---|
| my5651_rel_native_lto.cy10_u | 84.144 | 15.475 | 0.317 | 0.064 | nonzero | 0.028 | |||||
| my5651_rel_native_lto.cy10_ua1 | 84.000 | 15.626 | 0.311 | 0.063 | nonzero | 0.041 | |||||
| my5651_rel_native_lto.cy10_ua2 | 83.985 | 15.630 | 0.321 | 0.064 | nonzero | 0.026 |
Insert response time histogram: each cell has the percentage of responses that take <= the time in the header and max is the max response time in seconds. For max values in the top 25% of the range have a red background and in the bottom 25% of the range have a green background. The red background is not used when the min value is within 80% of the max value.
| dbms | 256us | 1ms | 4ms | 16ms | 64ms | 256ms | 1s | 4s | 16s | gt | max |
|---|---|---|---|---|---|---|---|---|---|---|---|
| my5651_rel_native_lto.cy10_u | 0.358 | 17.403 | 82.238 | 0.001 | 0.076 | ||||||
| my5651_rel_native_lto.cy10_ua1 | 0.754 | 16.034 | 83.210 | 0.001 | 0.075 | ||||||
| my5651_rel_native_lto.cy10_ua2 | 0.366 | 15.049 | 84.585 | nonzero | 0.065 |
Delete response time histogram: each cell has the percentage of responses that take <= the time in the header and max is the max response time in seconds. For max values in the top 25% of the range have a red background and in the bottom 25% of the range have a green background. The red background is not used when the min value is within 80% of the max value.
| dbms | 256us | 1ms | 4ms | 16ms | 64ms | 256ms | 1s | 4s | 16s | gt | max |
|---|---|---|---|---|---|---|---|---|---|---|---|
| my5651_rel_native_lto.cy10_u | 0.169 | 20.179 | 79.652 | nonzero | 0.074 | ||||||
| my5651_rel_native_lto.cy10_ua1 | 0.660 | 18.363 | 80.976 | 0.001 | 0.077 | ||||||
| my5651_rel_native_lto.cy10_ua2 | 0.154 | 17.240 | 82.605 | nonzero | 0.069 |
Performance metrics for the DBMS listed above. Some are normalized by throughput, others are not. Legend for results is here.
ips	qps	rps	rmbps	wps	wmbps	rpq	rkbpq	wpi	wkbpi	csps	cpups	cspq	cpupq	dbgb1	dbgb2	rss	maxop	p50	p99	tag
23834	107661	791	6.1	3495.6	103.3	0.007	0.058	0.147	4.440	456168	54.5	4.237	405	217.4	393.8	215.9	0.028	4491	4140	480m.my5651_rel_native_lto.cy10_u
23828	107721	812	6.3	3408.1	102.9	0.008	0.060	0.143	4.422	453525	54.7	4.210	406	217.6	394.1	215.8	0.041	4492	4188	480m.my5651_rel_native_lto.cy10_ua1
23828	107269	796	6.0	3545.2	104.9	0.007	0.057	0.149	4.508	453691	55.0	4.229	410	217.5	393.9	215.9	0.026	4475	4156	480m.my5651_rel_native_lto.cy10_ua2
l.i0
l.i0: load without secondary indexes
Performance metrics for all DBMS, not just the ones listed above. Some are normalized by throughput, others are not. Legend for results is here.
ips	qps	rps	rmbps	wps	wmbps	rpq	rkbpq	wpi	wkbpi	csps	cpups	cspq	cpupq	dbgb1	dbgb2	rss	maxop	p50	p99	tag
483871	0	0	0.0	2283.9	112.3	0.000	0.000	0.005	0.238	77635	38.7	0.160	64	31.8	160.3	46.5	0.100	20177	17882	480m.my5651_rel_native_lto.cy10_u
481444	0	0	0.0	1253.5	106.7	0.000	0.000	0.003	0.227	73199	38.3	0.152	64	31.8	160.3	46.5	0.097	20180	17881	480m.my5651_rel_native_lto.cy10_ua1
476663	0	0	0.0	2290.4	110.8	0.000	0.000	0.005	0.238	76305	38.3	0.160	64	31.8	160.3	46.5	0.090	19880	17483	480m.my5651_rel_native_lto.cy10_ua2
l.x
l.x: create secondary indexes
Performance metrics for all DBMS, not just the ones listed above. Some are normalized by throughput, others are not. Legend for results is here.
ips	qps	rps	rmbps	wps	wmbps	rpq	rkbpq	wpi	wkbpi	csps	cpups	cspq	cpupq	dbgb1	dbgb2	rss	maxop	p50	p99	tag
365095	0	0	0.0	20148.6	687.1	0.000	0.000	0.055	1.927	75986	31.1	0.208	68	65.2	193.7	80.7	0.002	NA	NA	480m.my5651_rel_native_lto.cy10_u
358819	0	0	0.0	16232.2	638.5	0.000	0.000	0.045	1.822	67467	31.5	0.188	70	65.2	193.7	80.7	0.002	NA	NA	480m.my5651_rel_native_lto.cy10_ua1
362887	0	0	0.0	19984.1	681.8	0.000	0.000	0.055	1.924	76169	31.2	0.210	69	65.2	193.7	80.7	0.002	NA	NA	480m.my5651_rel_native_lto.cy10_ua2
l.i1
l.i1: continue load after secondary indexes created
Performance metrics for all DBMS, not just the ones listed above. Some are normalized by throughput, others are not. Legend for results is here.
ips	qps	rps	rmbps	wps	wmbps	rpq	rkbpq	wpi	wkbpi	csps	cpups	cspq	cpupq	dbgb1	dbgb2	rss	maxop	p50	p99	tag
61511	0	1469	6.3	6840.1	212.3	0.024	0.105	0.111	3.535	134852	66.6	2.192	866	217.4	393.8	215.8	0.163	2547	2048	480m.my5651_rel_native_lto.cy10_u
56411	0	1414	6.1	5871.9	197.9	0.025	0.111	0.104	3.593	135569	66.3	2.403	940	217.6	394.1	215.8	0.153	2348	1898	480m.my5651_rel_native_lto.cy10_ua1
61491	0	1387	6.0	6845.9	212.6	0.023	0.100	0.111	3.540	135141	66.7	2.198	868	217.5	393.9	215.8	3.842	2547	2048	480m.my5651_rel_native_lto.cy10_ua2
q100.1
q100.1: range queries with 100 insert/s per client
Performance metrics for all DBMS, not just the ones listed above. Some are normalized by throughput, others are not. Legend for results is here.
ips	qps	rps	rmbps	wps	wmbps	rpq	rkbpq	wpi	wkbpi	csps	cpups	cspq	cpupq	dbgb1	dbgb2	rss	maxop	p50	p99	tag
2380	114414	1140	16.8	6756.2	195.3	0.010	0.150	2.839	84.042	488018	39.8	4.265	278	217.4	393.8	215.9	0.023	4795	4412	480m.my5651_rel_native_lto.cy10_u
2380	114623	749	16.6	6401.7	195.6	0.007	0.149	2.690	84.191	485023	39.7	4.231	277	217.6	394.1	215.8	0.047	4812	4428	480m.my5651_rel_native_lto.cy10_ua1
2379	114959	1134	16.7	6813.2	196.8	0.010	0.149	2.864	84.735	487704	39.5	4.242	275	217.5	393.9	215.9	0.022	4811	4428	480m.my5651_rel_native_lto.cy10_ua2
q500.1
q500.1: range queries with 500 insert/s per client
Performance metrics for all DBMS, not just the ones listed above. Some are normalized by throughput, others are not. Legend for results is here.
ips	qps	rps	rmbps	wps	wmbps	rpq	rkbpq	wpi	wkbpi	csps	cpups	cspq	cpupq	dbgb1	dbgb2	rss	maxop	p50	p99	tag
11904	118373	823	8.4	5354.0	155.7	0.007	0.073	0.450	13.394	500843	42.5	4.231	287	217.4	393.8	215.9	0.061	4891	4460	480m.my5651_rel_native_lto.cy10_u
11907	120045	803	8.2	4778.0	154.6	0.007	0.070	0.401	13.293	504313	41.7	4.201	278	217.6	394.1	215.8	0.027	4971	4556	480m.my5651_rel_native_lto.cy10_ua1
11907	116869	829	8.6	5373.9	156.2	0.007	0.075	0.451	13.434	494579	43.5	4.232	298	217.5	393.9	215.9	0.037	4859	4444	480m.my5651_rel_native_lto.cy10_ua2
q1000.1
q1000.1: range queries with 1000 insert/s per client
Performance metrics for all DBMS, not just the ones listed above. Some are normalized by throughput, others are not. Legend for results is here.
ips	qps	rps	rmbps	wps	wmbps	rpq	rkbpq	wpi	wkbpi	csps	cpups	cspq	cpupq	dbgb1	dbgb2	rss	maxop	p50	p99	tag
23834	107661	791	6.1	3495.6	103.3	0.007	0.058	0.147	4.440	456168	54.5	4.237	405	217.4	393.8	215.9	0.028	4491	4140	480m.my5651_rel_native_lto.cy10_u
23828	107721	812	6.3	3408.1	102.9	0.008	0.060	0.143	4.422	453525	54.7	4.210	406	217.6	394.1	215.8	0.041	4492	4188	480m.my5651_rel_native_lto.cy10_ua1
23828	107269	796	6.0	3545.2	104.9	0.007	0.057	0.149	4.508	453691	55.0	4.229	410	217.5	393.9	215.9	0.026	4475	4156	480m.my5651_rel_native_lto.cy10_ua2
l.i0
- l.i0: load without secondary indexes
- Legend for results is here.
- Each entry lists the percentage of responses that fit in that bucket (slower than max time for previous bucket, faster than min time for next bucket).
Insert response time histogram
256us	1ms	4ms	16ms	64ms	256ms	1s	4s	16s	gt	max	tag
0.000	0.347	11.482	87.914	0.215	0.043	0.000	0.000	0.000	0.000	0.100	my5651_rel_native_lto.cy10_u
0.000	0.346	11.402	87.996	0.214	0.043	0.000	0.000	0.000	0.000	0.097	my5651_rel_native_lto.cy10_ua1
0.000	0.340	9.997	89.393	0.228	0.043	0.000	0.000	0.000	0.000	0.090	my5651_rel_native_lto.cy10_ua2
l.x
- l.x: create secondary indexes
- Legend for results is here.
- Each entry lists the percentage of responses that fit in that bucket (slower than max time for previous bucket, faster than min time for next bucket).
TODO - determine whether there is data for create index response time
l.i1
- l.i1: continue load after secondary indexes created
- Legend for results is here.
- Each entry lists the percentage of responses that fit in that bucket (slower than max time for previous bucket, faster than min time for next bucket).
Insert response time histogram
256us	1ms	4ms	16ms	64ms	256ms	1s	4s	16s	gt	max	tag
0.000	0.000	0.008	16.328	83.638	0.025	0.000	0.000	0.000	0.000	0.163	my5651_rel_native_lto.cy10_u
0.000	0.000	0.007	7.614	92.354	0.025	0.000	0.000	0.000	0.000	0.153	my5651_rel_native_lto.cy10_ua1
0.000	0.000	0.014	17.451	82.508	0.027	0.000	nonzero	0.000	0.000	3.842	my5651_rel_native_lto.cy10_ua2
Delete response time histogram
256us	1ms	4ms	16ms	64ms	256ms	1s	4s	16s	gt	max	tag
0.000	0.000	0.013	21.062	78.918	0.007	0.000	0.000	0.000	0.000	0.151	my5651_rel_native_lto.cy10_u
0.000	0.000	0.013	11.745	88.237	0.005	0.000	0.000	0.000	0.000	0.136	my5651_rel_native_lto.cy10_ua1
0.000	0.000	0.017	22.217	77.757	0.008	0.000	nonzero	0.000	0.000	3.843	my5651_rel_native_lto.cy10_ua2
q100.1
- q100.1: range queries with 100 insert/s per client
- Legend for results is here.
- Each entry lists the percentage of responses that fit in that bucket (slower than max time for previous bucket, faster than min time for next bucket).
Query response time histogram
256us	1ms	4ms	16ms	64ms	256ms	1s	4s	16s	gt	max	tag
93.070	6.651	0.164	0.115	nonzero	0.000	0.000	0.000	0.000	0.000	0.023	my5651_rel_native_lto.cy10_u
93.079	6.643	0.168	0.110	nonzero	0.000	0.000	0.000	0.000	0.000	0.047	my5651_rel_native_lto.cy10_ua1
93.336	6.399	0.154	0.110	nonzero	0.000	0.000	0.000	0.000	0.000	0.022	my5651_rel_native_lto.cy10_ua2
Insert response time histogram
256us	1ms	4ms	16ms	64ms	256ms	1s	4s	16s	gt	max	tag
0.000	0.000	32.093	67.597	0.310	0.000	0.000	0.000	0.000	0.000	0.044	my5651_rel_native_lto.cy10_u
0.000	0.000	41.186	58.674	0.140	0.000	0.000	0.000	0.000	0.000	0.025	my5651_rel_native_lto.cy10_ua1
0.000	0.000	36.615	63.261	0.124	0.000	0.000	0.000	0.000	0.000	0.048	my5651_rel_native_lto.cy10_ua2
Delete response time histogram
256us	1ms	4ms	16ms	64ms	256ms	1s	4s	16s	gt	max	tag
0.000	0.000	64.556	35.388	0.056	0.000	0.000	0.000	0.000	0.000	0.044	my5651_rel_native_lto.cy10_u
0.000	0.000	74.065	25.927	0.008	0.000	0.000	0.000	0.000	0.000	0.022	my5651_rel_native_lto.cy10_ua1
0.000	0.000	70.832	29.159	0.009	0.000	0.000	0.000	0.000	0.000	0.026	my5651_rel_native_lto.cy10_ua2
q500.1
- q500.1: range queries with 500 insert/s per client
- Legend for results is here.
- Each entry lists the percentage of responses that fit in that bucket (slower than max time for previous bucket, faster than min time for next bucket).
Query response time histogram
256us	1ms	4ms	16ms	64ms	256ms	1s	4s	16s	gt	max	tag
95.144	4.752	0.034	0.070	nonzero	0.000	0.000	0.000	0.000	0.000	0.061	my5651_rel_native_lto.cy10_u
95.738	4.163	0.037	0.061	nonzero	0.000	0.000	0.000	0.000	0.000	0.027	my5651_rel_native_lto.cy10_ua1
94.236	5.644	0.043	0.077	nonzero	0.000	0.000	0.000	0.000	0.000	0.037	my5651_rel_native_lto.cy10_ua2
Insert response time histogram
256us	1ms	4ms	16ms	64ms	256ms	1s	4s	16s	gt	max	tag
0.000	0.000	10.727	89.101	0.172	0.001	0.000	0.000	0.000	0.000	0.077	my5651_rel_native_lto.cy10_u
0.000	0.000	28.882	71.094	0.024	0.000	0.000	0.000	0.000	0.000	0.033	my5651_rel_native_lto.cy10_ua1
0.000	0.000	5.896	91.006	3.097	0.001	0.000	0.000	0.000	0.000	0.072	my5651_rel_native_lto.cy10_ua2
Delete response time histogram
256us	1ms	4ms	16ms	64ms	256ms	1s	4s	16s	gt	max	tag
0.000	0.000	16.760	83.173	0.066	0.001	0.000	0.000	0.000	0.000	0.074	my5651_rel_native_lto.cy10_u
0.000	0.000	42.807	57.176	0.017	0.000	0.000	0.000	0.000	0.000	0.027	my5651_rel_native_lto.cy10_ua1
0.000	0.000	10.033	88.935	1.032	0.001	0.000	0.000	0.000	0.000	0.072	my5651_rel_native_lto.cy10_ua2
q1000.1
- q1000.1: range queries with 1000 insert/s per client
- Legend for results is here.
- Each entry lists the percentage of responses that fit in that bucket (slower than max time for previous bucket, faster than min time for next bucket).
Query response time histogram
256us	1ms	4ms	16ms	64ms	256ms	1s	4s	16s	gt	max	tag
84.144	15.475	0.317	0.064	nonzero	0.000	0.000	0.000	0.000	0.000	0.028	my5651_rel_native_lto.cy10_u
84.000	15.626	0.311	0.063	nonzero	0.000	0.000	0.000	0.000	0.000	0.041	my5651_rel_native_lto.cy10_ua1
83.985	15.630	0.321	0.064	nonzero	0.000	0.000	0.000	0.000	0.000	0.026	my5651_rel_native_lto.cy10_ua2
Insert response time histogram
256us	1ms	4ms	16ms	64ms	256ms	1s	4s	16s	gt	max	tag
0.000	0.000	0.358	17.403	82.238	0.001	0.000	0.000	0.000	0.000	0.076	my5651_rel_native_lto.cy10_u
0.000	0.000	0.754	16.034	83.210	0.001	0.000	0.000	0.000	0.000	0.075	my5651_rel_native_lto.cy10_ua1
0.000	0.000	0.366	15.049	84.585	nonzero	0.000	0.000	0.000	0.000	0.065	my5651_rel_native_lto.cy10_ua2
Delete response time histogram
256us	1ms	4ms	16ms	64ms	256ms	1s	4s	16s	gt	max	tag
0.000	0.000	0.169	20.179	79.652	nonzero	0.000	0.000	0.000	0.000	0.074	my5651_rel_native_lto.cy10_u
0.000	0.000	0.660	18.363	80.976	0.001	0.000	0.000	0.000	0.000	0.077	my5651_rel_native_lto.cy10_ua1
0.000	0.000	0.154	17.240	82.605	nonzero	0.000	0.000	0.000	0.000	0.069	my5651_rel_native_lto.cy10_ua2