Introduction
This is a report for the insert benchmark with 12000M docs and 24 client(s). It is generated by scripts (bash, awk, sed) and Tufte might not be impressed. An overview of the insert benchmark is here and a short update is here. Below, by DBMS, I mean DBMS+version.config. An example is my8020.c10b40 where my means MySQL, 8020 is version 8.0.20 and c10b40 is the name for the configuration file.
The test server has 80 cores with hyperthreads enabled, 256G RAM and fast storage. The benchmark was run with 24 client and there were 1 or 3 connections per client (1 for queries or inserts without rate limits, 1+1 for rate limited inserts+deletes). There are 24 tables, with a client per table. It loads 12B rows without secondary indexes, creates secondary indexes, then inserts 120M rows with a delete per insert to avoid growing the table. It then does 3 read+write tests for 3600s each that do queries as fast as possible with 100, 500 and then 1000 inserts/second/client concurrent with the queries and 1000 deletes/second to avoid growing the table. The database is larger than memory.
The tested DBMS are:
- my5651_rel_native_lto.cy10_u - InnoDB and MySQL 5.6.51, rel_native_lto build, cy10_u config, compiled with CMAKE_BUILD_TYPE=Release
- my5740_rel_native_lto.cy10_u - InnoDB and MySQL 5.7.40, rel_native_lto build, cy10_u config, compiled with CMAKE_BUILD_TYPE=Release
- my8033_rel_native_lto.cy10_u - InnoDB and MySQL 8.0.33, rel_native_lto build, cy10_u config, compiled with CMAKE_BUILD_TYPE=Release
Contents
- Summary
- l.i0: load without secondary indexes
- l.x: create secondary indexes
- l.i1: continue load after secondary indexes created
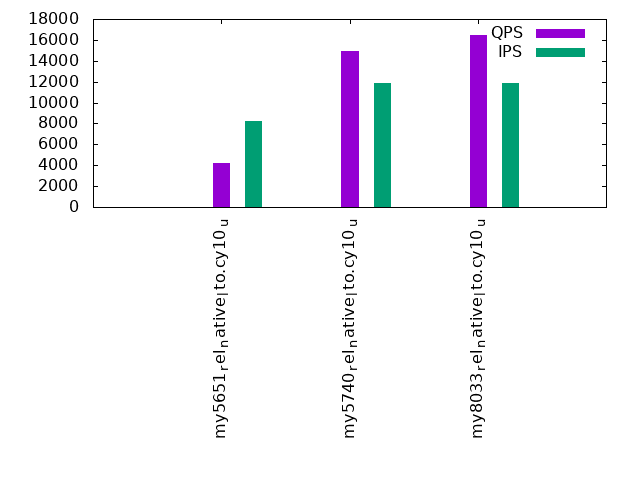
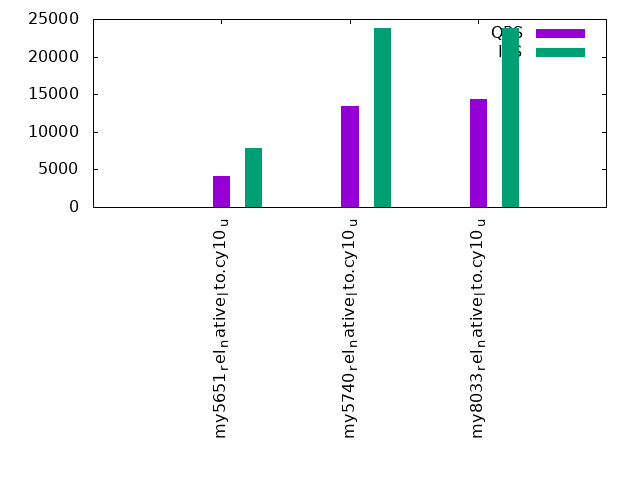
- q100.1: range queries with 100 insert/s per client
- q500.1: range queries with 500 insert/s per client
- q1000.1: range queries with 1000 insert/s per client
Summary
The numbers are inserts/s for l.i0 and l.i1, indexed docs (or rows) /s for l.x and queries/s for q*.2. The values are the average rate over the entire test for inserts (IPS) and queries (QPS). The range of values for IPS and QPS is split into 3 parts: bottom 25%, middle 50%, top 25%. Values in the bottom 25% have a red background, values in the top 25% have a green background and values in the middle have no color. A gray background is used for values that can be ignored because the DBMS did not sustain the target insert rate. Red backgrounds are not used when the minimum value is within 80% of the max value.
| dbms | l.i0 | l.x | l.i1 | q100.1 | q500.1 | q1000.1 |
|---|---|---|---|---|---|---|
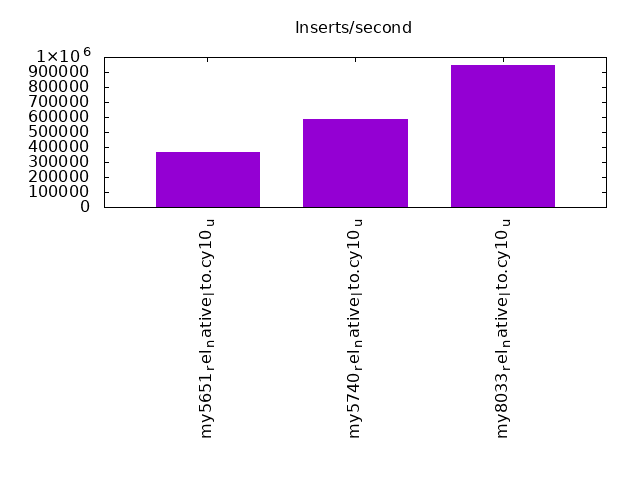
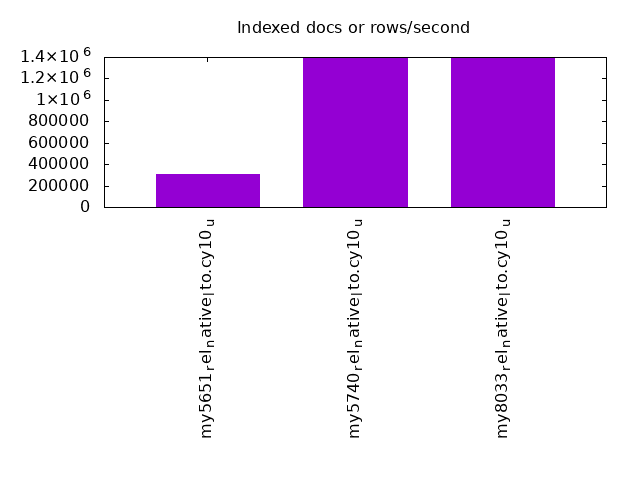
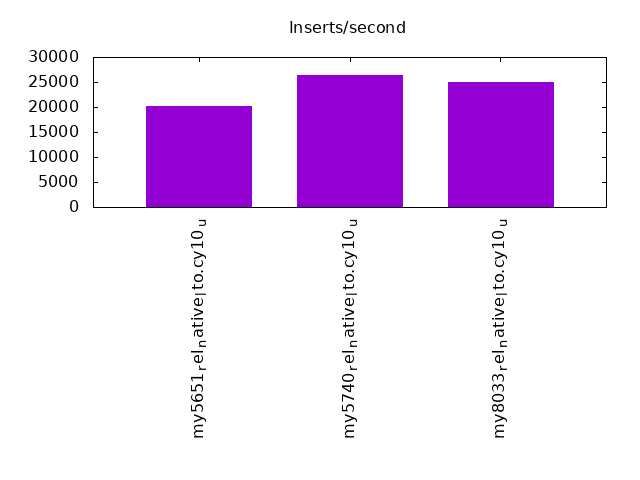
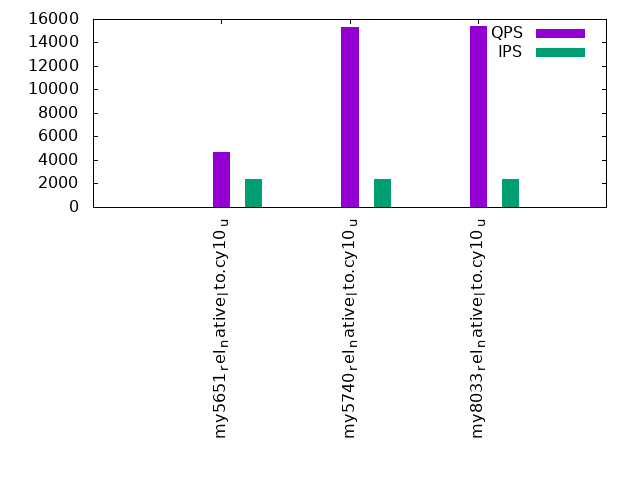
| my5651_rel_native_lto.cy10_u | 368562 | 311999 | 20154 | 4660 | 4236 | 4143 |
| my5740_rel_native_lto.cy10_u | 588351 | 1391316 | 26426 | 15354 | 14904 | 13400 |
| my8033_rel_native_lto.cy10_u | 947343 | 1397798 | 24927 | 15422 | 16425 | 14394 |
This table has relative throughput, throughput for the DBMS relative to the DBMS in the first line, using the absolute throughput from the previous table. Values less than 0.95 have a yellow background. Values greater than 1.05 have a blue background.
| dbms | l.i0 | l.x | l.i1 | q100.1 | q500.1 | q1000.1 |
|---|---|---|---|---|---|---|
| my5651_rel_native_lto.cy10_u | 1.00 | 1.00 | 1.00 | 1.00 | 1.00 | 1.00 |
| my5740_rel_native_lto.cy10_u | 1.60 | 4.46 | 1.31 | 3.29 | 3.52 | 3.23 |
| my8033_rel_native_lto.cy10_u | 2.57 | 4.48 | 1.24 | 3.31 | 3.88 | 3.47 |
This lists the average rate of inserts/s for the tests that do inserts concurrent with queries. For such tests the query rate is listed in the table above. The read+write tests are setup so that the insert rate should match the target rate every second. Cells that are not at least 95% of the target have a red background to indicate a failure to satisfy the target.
| dbms | q100.1 | q500.1 | q1000.1 |
|---|---|---|---|
| my5651_rel_native_lto.cy10_u | 2380 | 8241 | 7842 |
| my5740_rel_native_lto.cy10_u | 2381 | 11907 | 23821 |
| my8033_rel_native_lto.cy10_u | 2381 | 11911 | 23828 |
| target | 2400 | 12000 | 24000 |
l.i0
l.i0: load without secondary indexes. Graphs for performance per 1-second interval are here.
Average throughput:
Insert response time histogram: each cell has the percentage of responses that take <= the time in the header and max is the max response time in seconds. For the max column values in the top 25% of the range have a red background and in the bottom 25% of the range have a green background. The red background is not used when the min value is within 80% of the max value.
| dbms | 256us | 1ms | 4ms | 16ms | 64ms | 256ms | 1s | 4s | 16s | gt | max |
|---|---|---|---|---|---|---|---|---|---|---|---|
| my5651_rel_native_lto.cy10_u | 0.013 | 0.959 | 98.792 | 0.207 | 0.030 | nonzero | 0.278 | ||||
| my5740_rel_native_lto.cy10_u | 0.007 | 52.911 | 47.035 | 0.013 | 0.033 | nonzero | 0.305 | ||||
| my8033_rel_native_lto.cy10_u | 99.876 | 0.077 | 0.015 | 0.031 | 0.130 |
Performance metrics for the DBMS listed above. Some are normalized by throughput, others are not. Legend for results is here.
ips	qps	rps	rmbps	wps	wmbps	rpq	rkbpq	wpi	wkbpi	csps	cpups	cspq	cpupq	dbgb1	dbgb2	rss	maxop	p50	p99	tag
368562	0	2461	9.6	2459.7	104.5	0.007	0.027	0.007	0.290	91009	36.7	0.247	80	789.3	917.8	215.3	0.278	15085	13387	12000m.my5651_rel_native_lto.cy10_u
588351	0	1	0.0	3911.9	166.1	0.000	0.000	0.007	0.289	106956	42.0	0.182	57	789.3	917.8	216.3	0.305	24675	22178	12000m.my5740_rel_native_lto.cy10_u
947343	0	2	0.0	6399.4	275.2	0.000	0.000	0.007	0.297	236360	54.0	0.249	46	786.4	914.9	216.2	0.130	39460	33966	12000m.my8033_rel_native_lto.cy10_u
l.x
l.x: create secondary indexes.
Average throughput:
Performance metrics for the DBMS listed above. Some are normalized by throughput, others are not. Legend for results is here.
ips	qps	rps	rmbps	wps	wmbps	rpq	rkbpq	wpi	wkbpi	csps	cpups	cspq	cpupq	dbgb1	dbgb2	rss	maxop	p50	p99	tag
311999	0	4488	263.5	18406.4	682.2	0.014	0.865	0.059	2.239	96216	31.1	0.308	80	1626.5	1755.0	215.5	0.002	NA	NA	12000m.my5651_rel_native_lto.cy10_u
1391316	0	14542	1171.6	21654.4	1509.4	0.010	0.862	0.016	1.111	182547	29.1	0.131	17	1764.9	1893.5	216.5	0.002	NA	NA	12000m.my5740_rel_native_lto.cy10_u
1397798	0	25061	1345.5	29395.6	1258.1	0.018	0.986	0.021	0.922	167911	71.4	0.120	41	1758.4	1887.0	216.5	0.018	NA	NA	12000m.my8033_rel_native_lto.cy10_u
l.i1
l.i1: continue load after secondary indexes created. Graphs for performance per 1-second interval are here.
Average throughput:
Insert response time histogram: each cell has the percentage of responses that take <= the time in the header and max is the max response time in seconds. For the max column values in the top 25% of the range have a red background and in the bottom 25% of the range have a green background. The red background is not used when the min value is within 80% of the max value.
| dbms | 256us | 1ms | 4ms | 16ms | 64ms | 256ms | 1s | 4s | 16s | gt | max |
|---|---|---|---|---|---|---|---|---|---|---|---|
| my5651_rel_native_lto.cy10_u | 0.628 | 75.542 | 22.624 | 1.206 | 0.001 | 2.027 | |||||
| my5740_rel_native_lto.cy10_u | 1.527 | 80.281 | 18.186 | 0.006 | 0.337 | ||||||
| my8033_rel_native_lto.cy10_u | 1.934 | 82.092 | 15.545 | 0.429 | 0.864 |
Delete response time histogram: each cell has the percentage of responses that take <= the time in the header and max is the max response time in seconds. For the max column values in the top 25% of the range have a red background and in the bottom 25% of the range have a green background. The red background is not used when the min value is within 80% of the max value.
| dbms | 256us | 1ms | 4ms | 16ms | 64ms | 256ms | 1s | 4s | 16s | gt | max |
|---|---|---|---|---|---|---|---|---|---|---|---|
| my5651_rel_native_lto.cy10_u | 0.004 | 13.024 | 86.742 | 0.229 | 0.001 | nonzero | 1.489 | ||||
| my5740_rel_native_lto.cy10_u | 0.085 | 42.226 | 57.508 | 0.182 | 0.236 | ||||||
| my8033_rel_native_lto.cy10_u | 0.907 | 46.317 | 52.396 | 0.379 | 0.001 | 0.508 |
Performance metrics for the DBMS listed above. Some are normalized by throughput, others are not. Legend for results is here.
ips	qps	rps	rmbps	wps	wmbps	rpq	rkbpq	wpi	wkbpi	csps	cpups	cspq	cpupq	dbgb1	dbgb2	rss	maxop	p50	p99	tag
20154	0	33465	515.2	74876.8	1529.0	1.660	26.175	3.715	77.685	361156	36.0	17.919	1429	2419.6	2615.4	215.5	2.027	849	150	12000m.my5651_rel_native_lto.cy10_u
26426	0	46285	723.2	91971.5	2056.2	1.752	28.024	3.480	79.680	433620	44.2	16.409	1338	2416.1	2610.5	216.6	0.337	999	250	12000m.my5740_rel_native_lto.cy10_u
24927	0	43900	686.0	72322.3	2023.8	1.761	28.179	2.901	83.135	1038501	40.6	41.661	1303	2406.8	2599.1	216.5	0.864	1249	150	12000m.my8033_rel_native_lto.cy10_u
q100.1
q100.1: range queries with 100 insert/s per client. Graphs for performance per 1-second interval are here.
Average throughput:
Query response time histogram: each cell has the percentage of responses that take <= the time in the header and max is the max response time in seconds. For max values in the top 25% of the range have a red background and in the bottom 25% of the range have a green background. The red background is not used when the min value is within 80% of the max value.
| dbms | 256us | 1ms | 4ms | 16ms | 64ms | 256ms | 1s | 4s | 16s | gt | max |
|---|---|---|---|---|---|---|---|---|---|---|---|
| my5651_rel_native_lto.cy10_u | 28.981 | 9.157 | 29.691 | 25.124 | 6.440 | 0.604 | 0.003 | 0.476 | |||
| my5740_rel_native_lto.cy10_u | 29.855 | 12.833 | 54.024 | 3.048 | 0.235 | 0.006 | nonzero | 0.303 | |||
| my8033_rel_native_lto.cy10_u | 15.044 | 29.765 | 48.100 | 6.609 | 0.466 | 0.014 | nonzero | 0.324 |
Insert response time histogram: each cell has the percentage of responses that take <= the time in the header and max is the max response time in seconds. For max values in the top 25% of the range have a red background and in the bottom 25% of the range have a green background. The red background is not used when the min value is within 80% of the max value.
| dbms | 256us | 1ms | 4ms | 16ms | 64ms | 256ms | 1s | 4s | 16s | gt | max |
|---|---|---|---|---|---|---|---|---|---|---|---|
| my5651_rel_native_lto.cy10_u | 4.842 | 38.807 | 37.060 | 19.291 | 0.763 | ||||||
| my5740_rel_native_lto.cy10_u | 69.992 | 29.075 | 0.908 | 0.024 | 0.348 | ||||||
| my8033_rel_native_lto.cy10_u | 57.404 | 40.981 | 1.556 | 0.059 | 0.412 |
Delete response time histogram: each cell has the percentage of responses that take <= the time in the header and max is the max response time in seconds. For max values in the top 25% of the range have a red background and in the bottom 25% of the range have a green background. The red background is not used when the min value is within 80% of the max value.
| dbms | 256us | 1ms | 4ms | 16ms | 64ms | 256ms | 1s | 4s | 16s | gt | max |
|---|---|---|---|---|---|---|---|---|---|---|---|
| my5651_rel_native_lto.cy10_u | 0.001 | 7.219 | 37.856 | 36.747 | 18.177 | 0.635 | |||||
| my5740_rel_native_lto.cy10_u | 0.012 | 81.207 | 18.145 | 0.624 | 0.013 | 0.340 | |||||
| my8033_rel_native_lto.cy10_u | 0.012 | 76.124 | 22.726 | 1.097 | 0.041 | 0.411 |
Performance metrics for the DBMS listed above. Some are normalized by throughput, others are not. Legend for results is here.
ips	qps	rps	rmbps	wps	wmbps	rpq	rkbpq	wpi	wkbpi	csps	cpups	cspq	cpupq	dbgb1	dbgb2	rss	maxop	p50	p99	tag
2380	4660	29995	467.7	24786.3	480.4	6.437	102.785	10.414	206.692	257481	31.7	55.255	5442	2419.6	2615.4	215.6	0.476	208	144	12000m.my5651_rel_native_lto.cy10_u
2381	15354	104784	1637.3	48426.6	1272.9	6.824	109.191	20.340	547.484	424882	25.8	27.672	1344	2416.1	2610.5	216.6	0.303	719	256	12000m.my5740_rel_native_lto.cy10_u
2381	15422	104593	1634.3	46446.9	1270.6	6.782	108.511	19.509	546.484	510110	25.9	33.076	1344	2406.8	2598.3	216.5	0.324	751	192	12000m.my8033_rel_native_lto.cy10_u
q500.1
q500.1: range queries with 500 insert/s per client. Graphs for performance per 1-second interval are here.
Average throughput:
Query response time histogram: each cell has the percentage of responses that take <= the time in the header and max is the max response time in seconds. For max values in the top 25% of the range have a red background and in the bottom 25% of the range have a green background. The red background is not used when the min value is within 80% of the max value.
| dbms | 256us | 1ms | 4ms | 16ms | 64ms | 256ms | 1s | 4s | 16s | gt | max |
|---|---|---|---|---|---|---|---|---|---|---|---|
| my5651_rel_native_lto.cy10_u | 18.191 | 18.267 | 27.889 | 25.447 | 10.080 | 0.126 | nonzero | 0.289 | |||
| my5740_rel_native_lto.cy10_u | 24.525 | 16.983 | 54.983 | 3.486 | 0.022 | nonzero | 0.101 | ||||
| my8033_rel_native_lto.cy10_u | 11.356 | 32.138 | 49.892 | 6.592 | 0.022 | 0.062 |
Insert response time histogram: each cell has the percentage of responses that take <= the time in the header and max is the max response time in seconds. For max values in the top 25% of the range have a red background and in the bottom 25% of the range have a green background. The red background is not used when the min value is within 80% of the max value.
| dbms | 256us | 1ms | 4ms | 16ms | 64ms | 256ms | 1s | 4s | 16s | gt | max |
|---|---|---|---|---|---|---|---|---|---|---|---|
| my5651_rel_native_lto.cy10_u | 0.002 | 0.184 | 32.079 | 50.520 | 17.214 | 0.753 | |||||
| my5740_rel_native_lto.cy10_u | 20.077 | 79.870 | 0.053 | 0.115 | |||||||
| my8033_rel_native_lto.cy10_u | 7.274 | 92.008 | 0.718 | 0.173 |
Delete response time histogram: each cell has the percentage of responses that take <= the time in the header and max is the max response time in seconds. For max values in the top 25% of the range have a red background and in the bottom 25% of the range have a green background. The red background is not used when the min value is within 80% of the max value.
| dbms | 256us | 1ms | 4ms | 16ms | 64ms | 256ms | 1s | 4s | 16s | gt | max |
|---|---|---|---|---|---|---|---|---|---|---|---|
| my5651_rel_native_lto.cy10_u | 0.006 | 0.214 | 33.492 | 50.733 | 15.555 | 0.652 | |||||
| my5740_rel_native_lto.cy10_u | 0.013 | 52.273 | 47.707 | 0.006 | 0.102 | ||||||
| my8033_rel_native_lto.cy10_u | 0.002 | 25.736 | 74.086 | 0.176 | 0.171 |
Performance metrics for the DBMS listed above. Some are normalized by throughput, others are not. Legend for results is here.
ips	qps	rps	rmbps	wps	wmbps	rpq	rkbpq	wpi	wkbpi	csps	cpups	cspq	cpupq	dbgb1	dbgb2	rss	maxop	p50	p99	tag
8241	4236	25780	399.8	15114.7	361.9	6.086	96.628	1.834	44.966	298639	49.4	70.495	9329	2428.2	2626.6	215.6	0.289	176	128	12000m.my5651_rel_native_lto.cy10_u
11907	14904	106198	1659.3	63384.9	1475.4	7.125	114.007	5.323	126.878	459298	33.7	30.817	1809	2416.1	2610.5	216.6	0.101	623	559	12000m.my5740_rel_native_lto.cy10_u
11911	16425	115187	1799.8	58291.7	1598.1	7.013	112.205	4.894	137.398	650174	34.6	39.584	1685	2406.8	2601.6	216.5	0.062	687	623	12000m.my8033_rel_native_lto.cy10_u
q1000.1
q1000.1: range queries with 1000 insert/s per client. Graphs for performance per 1-second interval are here.
Average throughput:
Query response time histogram: each cell has the percentage of responses that take <= the time in the header and max is the max response time in seconds. For max values in the top 25% of the range have a red background and in the bottom 25% of the range have a green background. The red background is not used when the min value is within 80% of the max value.
| dbms | 256us | 1ms | 4ms | 16ms | 64ms | 256ms | 1s | 4s | 16s | gt | max |
|---|---|---|---|---|---|---|---|---|---|---|---|
| my5651_rel_native_lto.cy10_u | 18.204 | 18.972 | 27.816 | 24.665 | 10.115 | 0.223 | 0.005 | 0.912 | |||
| my5740_rel_native_lto.cy10_u | 18.682 | 21.826 | 52.970 | 6.477 | 0.045 | nonzero | 0.099 | ||||
| my8033_rel_native_lto.cy10_u | 6.573 | 35.323 | 49.224 | 8.793 | 0.087 | nonzero | 0.131 |
Insert response time histogram: each cell has the percentage of responses that take <= the time in the header and max is the max response time in seconds. For max values in the top 25% of the range have a red background and in the bottom 25% of the range have a green background. The red background is not used when the min value is within 80% of the max value.
| dbms | 256us | 1ms | 4ms | 16ms | 64ms | 256ms | 1s | 4s | 16s | gt | max |
|---|---|---|---|---|---|---|---|---|---|---|---|
| my5651_rel_native_lto.cy10_u | 0.002 | 0.115 | 33.398 | 46.209 | 20.274 | 0.002 | 1.726 | ||||
| my5740_rel_native_lto.cy10_u | 28.864 | 71.007 | 0.129 | nonzero | 0.286 | ||||||
| my8033_rel_native_lto.cy10_u | 20.505 | 78.685 | 0.810 | 0.230 |
Delete response time histogram: each cell has the percentage of responses that take <= the time in the header and max is the max response time in seconds. For max values in the top 25% of the range have a red background and in the bottom 25% of the range have a green background. The red background is not used when the min value is within 80% of the max value.
| dbms | 256us | 1ms | 4ms | 16ms | 64ms | 256ms | 1s | 4s | 16s | gt | max |
|---|---|---|---|---|---|---|---|---|---|---|---|
| my5651_rel_native_lto.cy10_u | 0.002 | 0.124 | 33.836 | 45.965 | 20.072 | 0.001 | 1.343 | ||||
| my5740_rel_native_lto.cy10_u | 0.002 | 47.704 | 52.228 | 0.065 | 0.236 | ||||||
| my8033_rel_native_lto.cy10_u | nonzero | 32.280 | 67.290 | 0.430 | 0.222 |
Performance metrics for the DBMS listed above. Some are normalized by throughput, others are not. Legend for results is here.
ips	qps	rps	rmbps	wps	wmbps	rpq	rkbpq	wpi	wkbpi	csps	cpups	cspq	cpupq	dbgb1	dbgb2	rss	maxop	p50	p99	tag
7842	4143	25372	393.5	15645.3	368.8	6.124	97.267	1.995	48.151	316147	51.9	76.311	10022	2438.7	2644.4	215.6	0.912	176	112	12000m.my5651_rel_native_lto.cy10_u
23821	13400	93165	1455.7	63945.2	1493.6	6.953	111.244	2.684	64.206	448853	45.1	33.497	2693	2420.2	2619.4	216.6	0.099	559	496	12000m.my5740_rel_native_lto.cy10_u
23828	14394	97787	1527.9	56828.7	1564.2	6.794	108.697	2.385	67.222	765823	48.1	53.204	2673	2412.2	2613.7	216.5	0.131	591	511	12000m.my8033_rel_native_lto.cy10_u
l.i0
l.i0: load without secondary indexes
Performance metrics for all DBMS, not just the ones listed above. Some are normalized by throughput, others are not. Legend for results is here.
ips	qps	rps	rmbps	wps	wmbps	rpq	rkbpq	wpi	wkbpi	csps	cpups	cspq	cpupq	dbgb1	dbgb2	rss	maxop	p50	p99	tag
368562	0	2461	9.6	2459.7	104.5	0.007	0.027	0.007	0.290	91009	36.7	0.247	80	789.3	917.8	215.3	0.278	15085	13387	12000m.my5651_rel_native_lto.cy10_u
588351	0	1	0.0	3911.9	166.1	0.000	0.000	0.007	0.289	106956	42.0	0.182	57	789.3	917.8	216.3	0.305	24675	22178	12000m.my5740_rel_native_lto.cy10_u
947343	0	2	0.0	6399.4	275.2	0.000	0.000	0.007	0.297	236360	54.0	0.249	46	786.4	914.9	216.2	0.130	39460	33966	12000m.my8033_rel_native_lto.cy10_u
l.x
l.x: create secondary indexes
Performance metrics for all DBMS, not just the ones listed above. Some are normalized by throughput, others are not. Legend for results is here.
ips	qps	rps	rmbps	wps	wmbps	rpq	rkbpq	wpi	wkbpi	csps	cpups	cspq	cpupq	dbgb1	dbgb2	rss	maxop	p50	p99	tag
311999	0	4488	263.5	18406.4	682.2	0.014	0.865	0.059	2.239	96216	31.1	0.308	80	1626.5	1755.0	215.5	0.002	NA	NA	12000m.my5651_rel_native_lto.cy10_u
1391316	0	14542	1171.6	21654.4	1509.4	0.010	0.862	0.016	1.111	182547	29.1	0.131	17	1764.9	1893.5	216.5	0.002	NA	NA	12000m.my5740_rel_native_lto.cy10_u
1397798	0	25061	1345.5	29395.6	1258.1	0.018	0.986	0.021	0.922	167911	71.4	0.120	41	1758.4	1887.0	216.5	0.018	NA	NA	12000m.my8033_rel_native_lto.cy10_u
l.i1
l.i1: continue load after secondary indexes created
Performance metrics for all DBMS, not just the ones listed above. Some are normalized by throughput, others are not. Legend for results is here.
ips	qps	rps	rmbps	wps	wmbps	rpq	rkbpq	wpi	wkbpi	csps	cpups	cspq	cpupq	dbgb1	dbgb2	rss	maxop	p50	p99	tag
20154	0	33465	515.2	74876.8	1529.0	1.660	26.175	3.715	77.685	361156	36.0	17.919	1429	2419.6	2615.4	215.5	2.027	849	150	12000m.my5651_rel_native_lto.cy10_u
26426	0	46285	723.2	91971.5	2056.2	1.752	28.024	3.480	79.680	433620	44.2	16.409	1338	2416.1	2610.5	216.6	0.337	999	250	12000m.my5740_rel_native_lto.cy10_u
24927	0	43900	686.0	72322.3	2023.8	1.761	28.179	2.901	83.135	1038501	40.6	41.661	1303	2406.8	2599.1	216.5	0.864	1249	150	12000m.my8033_rel_native_lto.cy10_u
q100.1
q100.1: range queries with 100 insert/s per client
Performance metrics for all DBMS, not just the ones listed above. Some are normalized by throughput, others are not. Legend for results is here.
ips	qps	rps	rmbps	wps	wmbps	rpq	rkbpq	wpi	wkbpi	csps	cpups	cspq	cpupq	dbgb1	dbgb2	rss	maxop	p50	p99	tag
2380	4660	29995	467.7	24786.3	480.4	6.437	102.785	10.414	206.692	257481	31.7	55.255	5442	2419.6	2615.4	215.6	0.476	208	144	12000m.my5651_rel_native_lto.cy10_u
2381	15354	104784	1637.3	48426.6	1272.9	6.824	109.191	20.340	547.484	424882	25.8	27.672	1344	2416.1	2610.5	216.6	0.303	719	256	12000m.my5740_rel_native_lto.cy10_u
2381	15422	104593	1634.3	46446.9	1270.6	6.782	108.511	19.509	546.484	510110	25.9	33.076	1344	2406.8	2598.3	216.5	0.324	751	192	12000m.my8033_rel_native_lto.cy10_u
q500.1
q500.1: range queries with 500 insert/s per client
Performance metrics for all DBMS, not just the ones listed above. Some are normalized by throughput, others are not. Legend for results is here.
ips	qps	rps	rmbps	wps	wmbps	rpq	rkbpq	wpi	wkbpi	csps	cpups	cspq	cpupq	dbgb1	dbgb2	rss	maxop	p50	p99	tag
8241	4236	25780	399.8	15114.7	361.9	6.086	96.628	1.834	44.966	298639	49.4	70.495	9329	2428.2	2626.6	215.6	0.289	176	128	12000m.my5651_rel_native_lto.cy10_u
11907	14904	106198	1659.3	63384.9	1475.4	7.125	114.007	5.323	126.878	459298	33.7	30.817	1809	2416.1	2610.5	216.6	0.101	623	559	12000m.my5740_rel_native_lto.cy10_u
11911	16425	115187	1799.8	58291.7	1598.1	7.013	112.205	4.894	137.398	650174	34.6	39.584	1685	2406.8	2601.6	216.5	0.062	687	623	12000m.my8033_rel_native_lto.cy10_u
q1000.1
q1000.1: range queries with 1000 insert/s per client
Performance metrics for all DBMS, not just the ones listed above. Some are normalized by throughput, others are not. Legend for results is here.
ips	qps	rps	rmbps	wps	wmbps	rpq	rkbpq	wpi	wkbpi	csps	cpups	cspq	cpupq	dbgb1	dbgb2	rss	maxop	p50	p99	tag
7842	4143	25372	393.5	15645.3	368.8	6.124	97.267	1.995	48.151	316147	51.9	76.311	10022	2438.7	2644.4	215.6	0.912	176	112	12000m.my5651_rel_native_lto.cy10_u
23821	13400	93165	1455.7	63945.2	1493.6	6.953	111.244	2.684	64.206	448853	45.1	33.497	2693	2420.2	2619.4	216.6	0.099	559	496	12000m.my5740_rel_native_lto.cy10_u
23828	14394	97787	1527.9	56828.7	1564.2	6.794	108.697	2.385	67.222	765823	48.1	53.204	2673	2412.2	2613.7	216.5	0.131	591	511	12000m.my8033_rel_native_lto.cy10_u
l.i0
- l.i0: load without secondary indexes
- Legend for results is here.
- Each entry lists the percentage of responses that fit in that bucket (slower than max time for previous bucket, faster than min time for next bucket).
Insert response time histogram
256us	1ms	4ms	16ms	64ms	256ms	1s	4s	16s	gt	max	tag
0.000	0.013	0.959	98.792	0.207	0.030	nonzero	0.000	0.000	0.000	0.278	my5651_rel_native_lto.cy10_u
0.000	0.007	52.911	47.035	0.013	0.033	nonzero	0.000	0.000	0.000	0.305	my5740_rel_native_lto.cy10_u
0.000	0.000	99.876	0.077	0.015	0.031	0.000	0.000	0.000	0.000	0.130	my8033_rel_native_lto.cy10_u
l.x
- l.x: create secondary indexes
- Legend for results is here.
- Each entry lists the percentage of responses that fit in that bucket (slower than max time for previous bucket, faster than min time for next bucket).
TODO - determine whether there is data for create index response time
l.i1
- l.i1: continue load after secondary indexes created
- Legend for results is here.
- Each entry lists the percentage of responses that fit in that bucket (slower than max time for previous bucket, faster than min time for next bucket).
Insert response time histogram
256us	1ms	4ms	16ms	64ms	256ms	1s	4s	16s	gt	max	tag
0.000	0.000	0.000	0.628	75.542	22.624	1.206	0.001	0.000	0.000	2.027	my5651_rel_native_lto.cy10_u
0.000	0.000	0.000	1.527	80.281	18.186	0.006	0.000	0.000	0.000	0.337	my5740_rel_native_lto.cy10_u
0.000	0.000	0.000	1.934	82.092	15.545	0.429	0.000	0.000	0.000	0.864	my8033_rel_native_lto.cy10_u
Delete response time histogram
256us	1ms	4ms	16ms	64ms	256ms	1s	4s	16s	gt	max	tag
0.000	0.000	0.004	13.024	86.742	0.229	0.001	nonzero	0.000	0.000	1.489	my5651_rel_native_lto.cy10_u
0.000	0.000	0.085	42.226	57.508	0.182	0.000	0.000	0.000	0.000	0.236	my5740_rel_native_lto.cy10_u
0.000	0.000	0.907	46.317	52.396	0.379	0.001	0.000	0.000	0.000	0.508	my8033_rel_native_lto.cy10_u
q100.1
- q100.1: range queries with 100 insert/s per client
- Legend for results is here.
- Each entry lists the percentage of responses that fit in that bucket (slower than max time for previous bucket, faster than min time for next bucket).
Query response time histogram
256us	1ms	4ms	16ms	64ms	256ms	1s	4s	16s	gt	max	tag
28.981	9.157	29.691	25.124	6.440	0.604	0.003	0.000	0.000	0.000	0.476	my5651_rel_native_lto.cy10_u
29.855	12.833	54.024	3.048	0.235	0.006	nonzero	0.000	0.000	0.000	0.303	my5740_rel_native_lto.cy10_u
15.044	29.765	48.100	6.609	0.466	0.014	nonzero	0.000	0.000	0.000	0.324	my8033_rel_native_lto.cy10_u
Insert response time histogram
256us	1ms	4ms	16ms	64ms	256ms	1s	4s	16s	gt	max	tag
0.000	0.000	0.000	4.842	38.807	37.060	19.291	0.000	0.000	0.000	0.763	my5651_rel_native_lto.cy10_u
0.000	0.000	0.000	69.992	29.075	0.908	0.024	0.000	0.000	0.000	0.348	my5740_rel_native_lto.cy10_u
0.000	0.000	0.000	57.404	40.981	1.556	0.059	0.000	0.000	0.000	0.412	my8033_rel_native_lto.cy10_u
Delete response time histogram
256us	1ms	4ms	16ms	64ms	256ms	1s	4s	16s	gt	max	tag
0.000	0.000	0.001	7.219	37.856	36.747	18.177	0.000	0.000	0.000	0.635	my5651_rel_native_lto.cy10_u
0.000	0.000	0.012	81.207	18.145	0.624	0.013	0.000	0.000	0.000	0.340	my5740_rel_native_lto.cy10_u
0.000	0.000	0.012	76.124	22.726	1.097	0.041	0.000	0.000	0.000	0.411	my8033_rel_native_lto.cy10_u
q500.1
- q500.1: range queries with 500 insert/s per client
- Legend for results is here.
- Each entry lists the percentage of responses that fit in that bucket (slower than max time for previous bucket, faster than min time for next bucket).
Query response time histogram
256us	1ms	4ms	16ms	64ms	256ms	1s	4s	16s	gt	max	tag
18.191	18.267	27.889	25.447	10.080	0.126	nonzero	0.000	0.000	0.000	0.289	my5651_rel_native_lto.cy10_u
24.525	16.983	54.983	3.486	0.022	nonzero	0.000	0.000	0.000	0.000	0.101	my5740_rel_native_lto.cy10_u
11.356	32.138	49.892	6.592	0.022	0.000	0.000	0.000	0.000	0.000	0.062	my8033_rel_native_lto.cy10_u
Insert response time histogram
256us	1ms	4ms	16ms	64ms	256ms	1s	4s	16s	gt	max	tag
0.000	0.000	0.002	0.184	32.079	50.520	17.214	0.000	0.000	0.000	0.753	my5651_rel_native_lto.cy10_u
0.000	0.000	0.000	20.077	79.870	0.053	0.000	0.000	0.000	0.000	0.115	my5740_rel_native_lto.cy10_u
0.000	0.000	0.000	7.274	92.008	0.718	0.000	0.000	0.000	0.000	0.173	my8033_rel_native_lto.cy10_u
Delete response time histogram
256us	1ms	4ms	16ms	64ms	256ms	1s	4s	16s	gt	max	tag
0.000	0.000	0.006	0.214	33.492	50.733	15.555	0.000	0.000	0.000	0.652	my5651_rel_native_lto.cy10_u
0.000	0.000	0.013	52.273	47.707	0.006	0.000	0.000	0.000	0.000	0.102	my5740_rel_native_lto.cy10_u
0.000	0.000	0.002	25.736	74.086	0.176	0.000	0.000	0.000	0.000	0.171	my8033_rel_native_lto.cy10_u
q1000.1
- q1000.1: range queries with 1000 insert/s per client
- Legend for results is here.
- Each entry lists the percentage of responses that fit in that bucket (slower than max time for previous bucket, faster than min time for next bucket).
Query response time histogram
256us	1ms	4ms	16ms	64ms	256ms	1s	4s	16s	gt	max	tag
18.204	18.972	27.816	24.665	10.115	0.223	0.005	0.000	0.000	0.000	0.912	my5651_rel_native_lto.cy10_u
18.682	21.826	52.970	6.477	0.045	nonzero	0.000	0.000	0.000	0.000	0.099	my5740_rel_native_lto.cy10_u
6.573	35.323	49.224	8.793	0.087	nonzero	0.000	0.000	0.000	0.000	0.131	my8033_rel_native_lto.cy10_u
Insert response time histogram
256us	1ms	4ms	16ms	64ms	256ms	1s	4s	16s	gt	max	tag
0.000	0.000	0.002	0.115	33.398	46.209	20.274	0.002	0.000	0.000	1.726	my5651_rel_native_lto.cy10_u
0.000	0.000	0.000	28.864	71.007	0.129	nonzero	0.000	0.000	0.000	0.286	my5740_rel_native_lto.cy10_u
0.000	0.000	0.000	20.505	78.685	0.810	0.000	0.000	0.000	0.000	0.230	my8033_rel_native_lto.cy10_u
Delete response time histogram
256us	1ms	4ms	16ms	64ms	256ms	1s	4s	16s	gt	max	tag
0.000	0.000	0.002	0.124	33.836	45.965	20.072	0.001	0.000	0.000	1.343	my5651_rel_native_lto.cy10_u
0.000	0.000	0.002	47.704	52.228	0.065	0.000	0.000	0.000	0.000	0.236	my5740_rel_native_lto.cy10_u
0.000	0.000	nonzero	32.280	67.290	0.430	0.000	0.000	0.000	0.000	0.222	my8033_rel_native_lto.cy10_u