Introduction
This is a report for the insert benchmark with 480M docs and 24 client(s). It is generated by scripts (bash, awk, sed) and Tufte might not be impressed. An overview of the insert benchmark is here and a short update is here. Below, by DBMS, I mean DBMS+version.config. An example is my8020.c10b40 where my means MySQL, 8020 is version 8.0.20 and c10b40 is the name for the configuration file.
The test server has 80 cores with hyperthreads enabled, 256G RAM and fast storage. The benchmark was run with 24 client and there were 1 or 3 connections per client (1 for queries or inserts without rate limits, 1+1 for rate limited inserts+deletes). There are 24 tables, with a client per table. It loads 480M rows without secondary indexes, creates secondary indexes, then inserts 960M rows with a delete per insert to avoid growing the table. It then does 3 read+write tests for 3600s each that do queries as fast as possible with 100, 500 and then 1000 inserts/second/client concurrent with the queries and 1000 deletes/second to avoid growing the table. The database is cached by InnoDB.
The tested DBMS are:
- my5651_rel_native_lto.cy10_u - InnoDB and MySQL 5.6.51, rel_native_lto build, cy10_u config, compiled with CMAKE_BUILD_TYPE=Release
- my5740_rel_native_lto.cy10_u - InnoDB and MySQL 5.7.40, rel_native_lto build, cy10_u config, compiled with CMAKE_BUILD_TYPE=Release, base config
- my8033_rel_native_lto.cy10_u - InnoDB and MySQL 8.0.33, rel_native_lto build, cy10_u config, compiled with CMAKE_BUILD_TYPE=Release, base config
Contents
- Summary
- l.i0: load without secondary indexes
- l.x: create secondary indexes
- l.i1: continue load after secondary indexes created
- q100.1: range queries with 100 insert/s per client
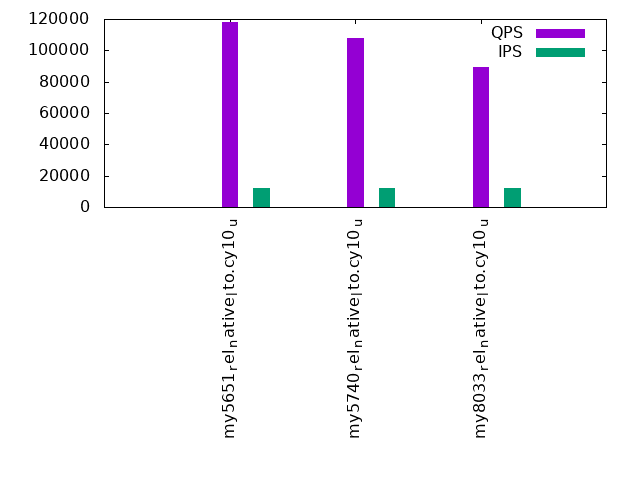
- q500.1: range queries with 500 insert/s per client
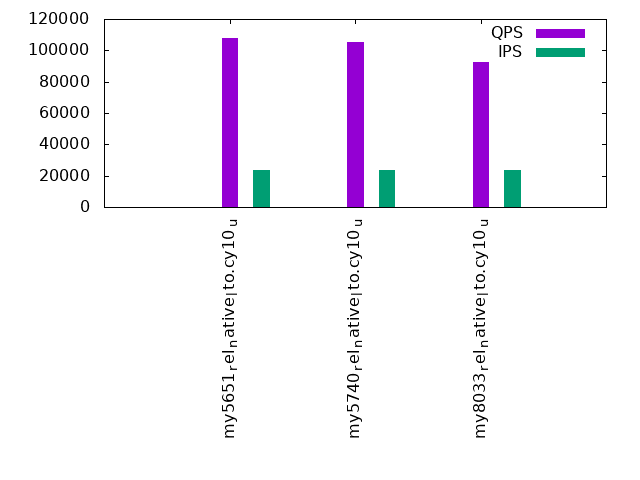
- q1000.1: range queries with 1000 insert/s per client
Summary
The numbers are inserts/s for l.i0 and l.i1, indexed docs (or rows) /s for l.x and queries/s for q*.2. The values are the average rate over the entire test for inserts (IPS) and queries (QPS). The range of values for IPS and QPS is split into 3 parts: bottom 25%, middle 50%, top 25%. Values in the bottom 25% have a red background, values in the top 25% have a green background and values in the middle have no color. A gray background is used for values that can be ignored because the DBMS did not sustain the target insert rate. Red backgrounds are not used when the minimum value is within 80% of the max value.
| dbms | l.i0 | l.x | l.i1 | q100.1 | q500.1 | q1000.1 |
|---|---|---|---|---|---|---|
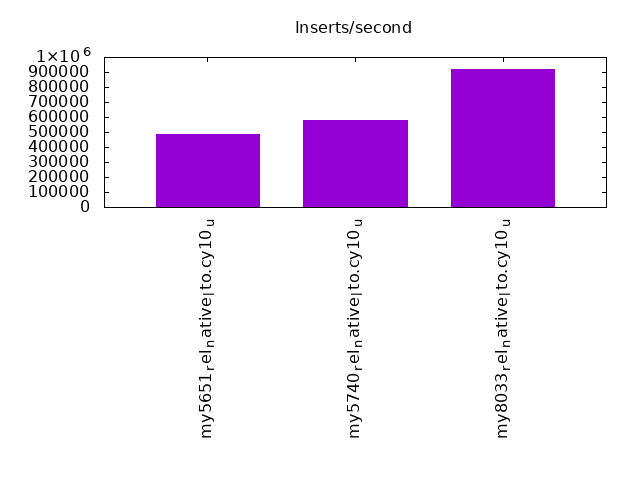
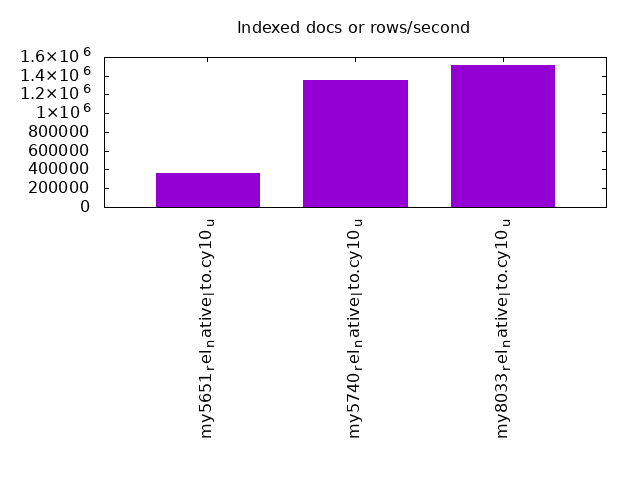
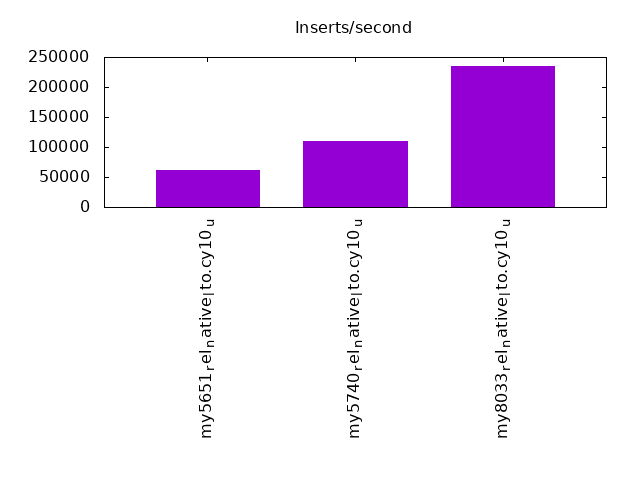
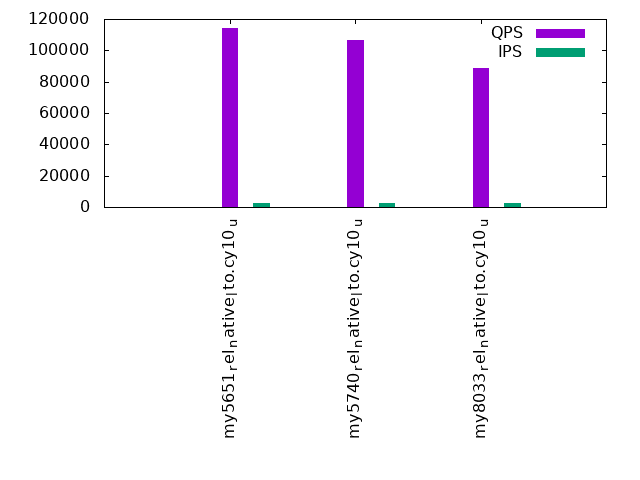
| my5651_rel_native_lto.cy10_u | 483871 | 365095 | 61511 | 114414 | 118373 | 107661 |
| my5740_rel_native_lto.cy10_u | 579710 | 1352394 | 109626 | 106796 | 107989 | 105594 |
| my8033_rel_native_lto.cy10_u | 917782 | 1519304 | 234375 | 88428 | 89513 | 92676 |
This table has relative throughput, throughput for the DBMS relative to the DBMS in the first line, using the absolute throughput from the previous table. Values less than 0.95 have a yellow background. Values greater than 1.05 have a blue background.
| dbms | l.i0 | l.x | l.i1 | q100.1 | q500.1 | q1000.1 |
|---|---|---|---|---|---|---|
| my5651_rel_native_lto.cy10_u | 1.00 | 1.00 | 1.00 | 1.00 | 1.00 | 1.00 |
| my5740_rel_native_lto.cy10_u | 1.20 | 3.70 | 1.78 | 0.93 | 0.91 | 0.98 |
| my8033_rel_native_lto.cy10_u | 1.90 | 4.16 | 3.81 | 0.77 | 0.76 | 0.86 |
This lists the average rate of inserts/s for the tests that do inserts concurrent with queries. For such tests the query rate is listed in the table above. The read+write tests are setup so that the insert rate should match the target rate every second. Cells that are not at least 95% of the target have a red background to indicate a failure to satisfy the target.
| dbms | q100.1 | q500.1 | q1000.1 |
|---|---|---|---|
| my5651_rel_native_lto.cy10_u | 2380 | 11904 | 23834 |
| my5740_rel_native_lto.cy10_u | 2379 | 11904 | 23828 |
| my8033_rel_native_lto.cy10_u | 2378 | 11898 | 23821 |
| target | 2400 | 12000 | 24000 |
l.i0
l.i0: load without secondary indexes. Graphs for performance per 1-second interval are here.
Average throughput:
Insert response time histogram: each cell has the percentage of responses that take <= the time in the header and max is the max response time in seconds. For the max column values in the top 25% of the range have a red background and in the bottom 25% of the range have a green background. The red background is not used when the min value is within 80% of the max value.
| dbms | 256us | 1ms | 4ms | 16ms | 64ms | 256ms | 1s | 4s | 16s | gt | max |
|---|---|---|---|---|---|---|---|---|---|---|---|
| my5651_rel_native_lto.cy10_u | 0.347 | 11.482 | 87.914 | 0.215 | 0.043 | 0.100 | |||||
| my5740_rel_native_lto.cy10_u | 0.216 | 57.866 | 41.872 | 0.003 | 0.043 | 0.166 | |||||
| my8033_rel_native_lto.cy10_u | 99.924 | 0.027 | 0.006 | 0.043 | 0.118 |
Performance metrics for the DBMS listed above. Some are normalized by throughput, others are not. Legend for results is here.
ips	qps	rps	rmbps	wps	wmbps	rpq	rkbpq	wpi	wkbpi	csps	cpups	cspq	cpupq	dbgb1	dbgb2	rss	maxop	p50	p99	tag
483871	0	0	0.0	2283.9	112.3	0.000	0.000	0.005	0.238	77635	38.7	0.160	64	31.8	160.3	46.5	0.100	20177	17882	480m.my5651_rel_native_lto.cy10_u
579710	0	0	0.0	2893.0	137.5	0.000	0.000	0.005	0.243	91633	40.5	0.158	56	31.8	160.3	47.5	0.166	24775	21881	480m.my5740_rel_native_lto.cy10_u
917782	0	0	0.0	4378.5	217.0	0.000	0.000	0.005	0.242	208787	51.0	0.227	44	31.7	160.3	47.4	0.118	39760	34066	480m.my8033_rel_native_lto.cy10_u
l.x
l.x: create secondary indexes.
Average throughput:
Performance metrics for the DBMS listed above. Some are normalized by throughput, others are not. Legend for results is here.
ips	qps	rps	rmbps	wps	wmbps	rpq	rkbpq	wpi	wkbpi	csps	cpups	cspq	cpupq	dbgb1	dbgb2	rss	maxop	p50	p99	tag
365095	0	0	0.0	20148.6	687.1	0.000	0.000	0.055	1.927	75986	31.1	0.208	68	65.2	193.7	80.7	0.002	NA	NA	480m.my5651_rel_native_lto.cy10_u
1352394	0	0	0.0	21715.0	1151.5	0.000	0.000	0.016	0.872	110742	30.9	0.082	18	70.8	199.3	81.6	0.002	NA	NA	480m.my5740_rel_native_lto.cy10_u
1519304	0	8178	396.0	31920.6	1167.4	0.005	0.267	0.021	0.787	177999	72.5	0.117	38	70.6	199.2	68.1	0.008	NA	NA	480m.my8033_rel_native_lto.cy10_u
l.i1
l.i1: continue load after secondary indexes created. Graphs for performance per 1-second interval are here.
Average throughput:
Insert response time histogram: each cell has the percentage of responses that take <= the time in the header and max is the max response time in seconds. For the max column values in the top 25% of the range have a red background and in the bottom 25% of the range have a green background. The red background is not used when the min value is within 80% of the max value.
| dbms | 256us | 1ms | 4ms | 16ms | 64ms | 256ms | 1s | 4s | 16s | gt | max |
|---|---|---|---|---|---|---|---|---|---|---|---|
| my5651_rel_native_lto.cy10_u | 0.008 | 16.328 | 83.638 | 0.025 | 0.163 | ||||||
| my5740_rel_native_lto.cy10_u | 0.012 | 99.772 | 0.193 | 0.023 | nonzero | 0.663 | |||||
| my8033_rel_native_lto.cy10_u | 20.825 | 78.862 | 0.273 | 0.039 | 0.185 |
Delete response time histogram: each cell has the percentage of responses that take <= the time in the header and max is the max response time in seconds. For the max column values in the top 25% of the range have a red background and in the bottom 25% of the range have a green background. The red background is not used when the min value is within 80% of the max value.
| dbms | 256us | 1ms | 4ms | 16ms | 64ms | 256ms | 1s | 4s | 16s | gt | max |
|---|---|---|---|---|---|---|---|---|---|---|---|
| my5651_rel_native_lto.cy10_u | 0.013 | 21.062 | 78.918 | 0.007 | 0.151 | ||||||
| my5740_rel_native_lto.cy10_u | 0.034 | 99.843 | 0.100 | 0.022 | nonzero | 0.660 | |||||
| my8033_rel_native_lto.cy10_u | 86.855 | 12.950 | 0.171 | 0.025 | 0.139 |
Performance metrics for the DBMS listed above. Some are normalized by throughput, others are not. Legend for results is here.
ips	qps	rps	rmbps	wps	wmbps	rpq	rkbpq	wpi	wkbpi	csps	cpups	cspq	cpupq	dbgb1	dbgb2	rss	maxop	p50	p99	tag
61511	0	1469	6.3	6840.1	212.3	0.024	0.105	0.111	3.535	134852	66.6	2.192	866	217.4	393.8	215.8	0.163	2547	2048	480m.my5651_rel_native_lto.cy10_u
109626	0	119	1.9	10923.2	342.8	0.001	0.017	0.100	3.202	114400	70.1	1.044	512	220.9	400.1	216.8	0.663	4595	4196	480m.my5740_rel_native_lto.cy10_u
234375	0	1156	18.1	19937.8	652.2	0.005	0.079	0.085	2.850	1022224	63.2	4.361	216	226.9	418.7	216.2	0.185	10489	1898	480m.my8033_rel_native_lto.cy10_u
q100.1
q100.1: range queries with 100 insert/s per client. Graphs for performance per 1-second interval are here.
Average throughput:
Query response time histogram: each cell has the percentage of responses that take <= the time in the header and max is the max response time in seconds. For max values in the top 25% of the range have a red background and in the bottom 25% of the range have a green background. The red background is not used when the min value is within 80% of the max value.
| dbms | 256us | 1ms | 4ms | 16ms | 64ms | 256ms | 1s | 4s | 16s | gt | max |
|---|---|---|---|---|---|---|---|---|---|---|---|
| my5651_rel_native_lto.cy10_u | 93.070 | 6.651 | 0.164 | 0.115 | nonzero | 0.023 | |||||
| my5740_rel_native_lto.cy10_u | 84.942 | 15.055 | 0.003 | nonzero | nonzero | 0.023 | |||||
| my8033_rel_native_lto.cy10_u | 54.094 | 45.902 | 0.004 | nonzero | nonzero | 0.020 |
Insert response time histogram: each cell has the percentage of responses that take <= the time in the header and max is the max response time in seconds. For max values in the top 25% of the range have a red background and in the bottom 25% of the range have a green background. The red background is not used when the min value is within 80% of the max value.
| dbms | 256us | 1ms | 4ms | 16ms | 64ms | 256ms | 1s | 4s | 16s | gt | max |
|---|---|---|---|---|---|---|---|---|---|---|---|
| my5651_rel_native_lto.cy10_u | 32.093 | 67.597 | 0.310 | 0.044 | |||||||
| my5740_rel_native_lto.cy10_u | 31.056 | 68.943 | 0.001 | 0.022 | |||||||
| my8033_rel_native_lto.cy10_u | 53.372 | 46.627 | 0.001 | 0.018 |
Delete response time histogram: each cell has the percentage of responses that take <= the time in the header and max is the max response time in seconds. For max values in the top 25% of the range have a red background and in the bottom 25% of the range have a green background. The red background is not used when the min value is within 80% of the max value.
| dbms | 256us | 1ms | 4ms | 16ms | 64ms | 256ms | 1s | 4s | 16s | gt | max |
|---|---|---|---|---|---|---|---|---|---|---|---|
| my5651_rel_native_lto.cy10_u | 64.556 | 35.388 | 0.056 | 0.044 | |||||||
| my5740_rel_native_lto.cy10_u | 78.004 | 21.996 | 0.015 | ||||||||
| my8033_rel_native_lto.cy10_u | 99.812 | 0.187 | 0.001 | 0.023 |
Performance metrics for the DBMS listed above. Some are normalized by throughput, others are not. Legend for results is here.
ips	qps	rps	rmbps	wps	wmbps	rpq	rkbpq	wpi	wkbpi	csps	cpups	cspq	cpupq	dbgb1	dbgb2	rss	maxop	p50	p99	tag
2380	114414	1140	16.8	6756.2	195.3	0.010	0.150	2.839	84.042	488018	39.8	4.265	278	217.4	393.8	215.9	0.023	4795	4412	480m.my5651_rel_native_lto.cy10_u
2379	106796	967	15.1	7160.1	205.5	0.009	0.145	3.010	88.476	453290	41.7	4.244	312	220.9	400.1	216.9	0.023	4476	4188	480m.my5740_rel_native_lto.cy10_u
2378	88428	1203	18.8	7819.6	225.1	0.014	0.218	3.288	96.933	471405	40.7	5.331	368	226.9	385.6	216.2	0.020	3709	3293	480m.my8033_rel_native_lto.cy10_u
q500.1
q500.1: range queries with 500 insert/s per client. Graphs for performance per 1-second interval are here.
Average throughput:
Query response time histogram: each cell has the percentage of responses that take <= the time in the header and max is the max response time in seconds. For max values in the top 25% of the range have a red background and in the bottom 25% of the range have a green background. The red background is not used when the min value is within 80% of the max value.
| dbms | 256us | 1ms | 4ms | 16ms | 64ms | 256ms | 1s | 4s | 16s | gt | max |
|---|---|---|---|---|---|---|---|---|---|---|---|
| my5651_rel_native_lto.cy10_u | 95.144 | 4.752 | 0.034 | 0.070 | nonzero | 0.061 | |||||
| my5740_rel_native_lto.cy10_u | 86.685 | 13.306 | 0.008 | nonzero | nonzero | nonzero | 0.095 | ||||
| my8033_rel_native_lto.cy10_u | 55.143 | 44.851 | 0.006 | nonzero | nonzero | 0.032 |
Insert response time histogram: each cell has the percentage of responses that take <= the time in the header and max is the max response time in seconds. For max values in the top 25% of the range have a red background and in the bottom 25% of the range have a green background. The red background is not used when the min value is within 80% of the max value.
| dbms | 256us | 1ms | 4ms | 16ms | 64ms | 256ms | 1s | 4s | 16s | gt | max |
|---|---|---|---|---|---|---|---|---|---|---|---|
| my5651_rel_native_lto.cy10_u | 10.727 | 89.101 | 0.172 | 0.001 | 0.077 | ||||||
| my5740_rel_native_lto.cy10_u | 6.337 | 93.658 | 0.005 | nonzero | 0.093 | ||||||
| my8033_rel_native_lto.cy10_u | 83.694 | 16.306 | nonzero | 0.021 |
Delete response time histogram: each cell has the percentage of responses that take <= the time in the header and max is the max response time in seconds. For max values in the top 25% of the range have a red background and in the bottom 25% of the range have a green background. The red background is not used when the min value is within 80% of the max value.
| dbms | 256us | 1ms | 4ms | 16ms | 64ms | 256ms | 1s | 4s | 16s | gt | max |
|---|---|---|---|---|---|---|---|---|---|---|---|
| my5651_rel_native_lto.cy10_u | 16.760 | 83.173 | 0.066 | 0.001 | 0.074 | ||||||
| my5740_rel_native_lto.cy10_u | 14.686 | 85.310 | 0.004 | 0.045 | |||||||
| my8033_rel_native_lto.cy10_u | 99.900 | 0.099 | nonzero | 0.020 |
Performance metrics for the DBMS listed above. Some are normalized by throughput, others are not. Legend for results is here.
ips	qps	rps	rmbps	wps	wmbps	rpq	rkbpq	wpi	wkbpi	csps	cpups	cspq	cpupq	dbgb1	dbgb2	rss	maxop	p50	p99	tag
11904	118373	823	8.4	5354.0	155.7	0.007	0.073	0.450	13.394	500843	42.5	4.231	287	217.4	393.8	215.9	0.061	4891	4460	480m.my5651_rel_native_lto.cy10_u
11904	107989	489	7.6	5682.5	164.5	0.005	0.072	0.477	14.148	456755	43.7	4.230	324	220.9	400.1	216.9	0.095	4523	4220	480m.my5740_rel_native_lto.cy10_u
11898	89513	752	11.7	6316.2	184.5	0.008	0.134	0.531	15.882	505405	42.1	5.646	376	226.9	388.9	216.2	0.032	3756	3309	480m.my8033_rel_native_lto.cy10_u
q1000.1
q1000.1: range queries with 1000 insert/s per client. Graphs for performance per 1-second interval are here.
Average throughput:
Query response time histogram: each cell has the percentage of responses that take <= the time in the header and max is the max response time in seconds. For max values in the top 25% of the range have a red background and in the bottom 25% of the range have a green background. The red background is not used when the min value is within 80% of the max value.
| dbms | 256us | 1ms | 4ms | 16ms | 64ms | 256ms | 1s | 4s | 16s | gt | max |
|---|---|---|---|---|---|---|---|---|---|---|---|
| my5651_rel_native_lto.cy10_u | 84.144 | 15.475 | 0.317 | 0.064 | nonzero | 0.028 | |||||
| my5740_rel_native_lto.cy10_u | 82.592 | 17.313 | 0.073 | 0.021 | nonzero | 0.036 | |||||
| my8033_rel_native_lto.cy10_u | 62.433 | 37.547 | 0.019 | nonzero | nonzero | 0.023 |
Insert response time histogram: each cell has the percentage of responses that take <= the time in the header and max is the max response time in seconds. For max values in the top 25% of the range have a red background and in the bottom 25% of the range have a green background. The red background is not used when the min value is within 80% of the max value.
| dbms | 256us | 1ms | 4ms | 16ms | 64ms | 256ms | 1s | 4s | 16s | gt | max |
|---|---|---|---|---|---|---|---|---|---|---|---|
| my5651_rel_native_lto.cy10_u | 0.358 | 17.403 | 82.238 | 0.001 | 0.076 | ||||||
| my5740_rel_native_lto.cy10_u | 2.776 | 93.934 | 3.290 | 0.058 | |||||||
| my8033_rel_native_lto.cy10_u | 59.408 | 40.586 | 0.006 | 0.030 |
Delete response time histogram: each cell has the percentage of responses that take <= the time in the header and max is the max response time in seconds. For max values in the top 25% of the range have a red background and in the bottom 25% of the range have a green background. The red background is not used when the min value is within 80% of the max value.
| dbms | 256us | 1ms | 4ms | 16ms | 64ms | 256ms | 1s | 4s | 16s | gt | max |
|---|---|---|---|---|---|---|---|---|---|---|---|
| my5651_rel_native_lto.cy10_u | 0.169 | 20.179 | 79.652 | nonzero | 0.074 | ||||||
| my5740_rel_native_lto.cy10_u | 2.837 | 94.731 | 2.432 | 0.048 | |||||||
| my8033_rel_native_lto.cy10_u | 97.056 | 2.941 | 0.004 | 0.035 |
Performance metrics for the DBMS listed above. Some are normalized by throughput, others are not. Legend for results is here.
ips	qps	rps	rmbps	wps	wmbps	rpq	rkbpq	wpi	wkbpi	csps	cpups	cspq	cpupq	dbgb1	dbgb2	rss	maxop	p50	p99	tag
23834	107661	791	6.1	3495.6	103.3	0.007	0.058	0.147	4.440	456168	54.5	4.237	405	217.4	393.8	215.9	0.028	4491	4140	480m.my5651_rel_native_lto.cy10_u
23828	105594	255	4.0	4920.9	143.9	0.002	0.039	0.207	6.185	434485	49.1	4.115	372	220.9	400.1	216.9	0.036	4412	4060	480m.my5740_rel_native_lto.cy10_u
23821	92676	163	2.5	5128.4	151.8	0.002	0.028	0.215	6.524	514374	40.7	5.550	351	226.9	355.9	216.2	0.023	3884	3500	480m.my8033_rel_native_lto.cy10_u
l.i0
l.i0: load without secondary indexes
Performance metrics for all DBMS, not just the ones listed above. Some are normalized by throughput, others are not. Legend for results is here.
ips	qps	rps	rmbps	wps	wmbps	rpq	rkbpq	wpi	wkbpi	csps	cpups	cspq	cpupq	dbgb1	dbgb2	rss	maxop	p50	p99	tag
483871	0	0	0.0	2283.9	112.3	0.000	0.000	0.005	0.238	77635	38.7	0.160	64	31.8	160.3	46.5	0.100	20177	17882	480m.my5651_rel_native_lto.cy10_u
579710	0	0	0.0	2893.0	137.5	0.000	0.000	0.005	0.243	91633	40.5	0.158	56	31.8	160.3	47.5	0.166	24775	21881	480m.my5740_rel_native_lto.cy10_u
917782	0	0	0.0	4378.5	217.0	0.000	0.000	0.005	0.242	208787	51.0	0.227	44	31.7	160.3	47.4	0.118	39760	34066	480m.my8033_rel_native_lto.cy10_u
l.x
l.x: create secondary indexes
Performance metrics for all DBMS, not just the ones listed above. Some are normalized by throughput, others are not. Legend for results is here.
ips	qps	rps	rmbps	wps	wmbps	rpq	rkbpq	wpi	wkbpi	csps	cpups	cspq	cpupq	dbgb1	dbgb2	rss	maxop	p50	p99	tag
365095	0	0	0.0	20148.6	687.1	0.000	0.000	0.055	1.927	75986	31.1	0.208	68	65.2	193.7	80.7	0.002	NA	NA	480m.my5651_rel_native_lto.cy10_u
1352394	0	0	0.0	21715.0	1151.5	0.000	0.000	0.016	0.872	110742	30.9	0.082	18	70.8	199.3	81.6	0.002	NA	NA	480m.my5740_rel_native_lto.cy10_u
1519304	0	8178	396.0	31920.6	1167.4	0.005	0.267	0.021	0.787	177999	72.5	0.117	38	70.6	199.2	68.1	0.008	NA	NA	480m.my8033_rel_native_lto.cy10_u
l.i1
l.i1: continue load after secondary indexes created
Performance metrics for all DBMS, not just the ones listed above. Some are normalized by throughput, others are not. Legend for results is here.
ips	qps	rps	rmbps	wps	wmbps	rpq	rkbpq	wpi	wkbpi	csps	cpups	cspq	cpupq	dbgb1	dbgb2	rss	maxop	p50	p99	tag
61511	0	1469	6.3	6840.1	212.3	0.024	0.105	0.111	3.535	134852	66.6	2.192	866	217.4	393.8	215.8	0.163	2547	2048	480m.my5651_rel_native_lto.cy10_u
109626	0	119	1.9	10923.2	342.8	0.001	0.017	0.100	3.202	114400	70.1	1.044	512	220.9	400.1	216.8	0.663	4595	4196	480m.my5740_rel_native_lto.cy10_u
234375	0	1156	18.1	19937.8	652.2	0.005	0.079	0.085	2.850	1022224	63.2	4.361	216	226.9	418.7	216.2	0.185	10489	1898	480m.my8033_rel_native_lto.cy10_u
q100.1
q100.1: range queries with 100 insert/s per client
Performance metrics for all DBMS, not just the ones listed above. Some are normalized by throughput, others are not. Legend for results is here.
ips	qps	rps	rmbps	wps	wmbps	rpq	rkbpq	wpi	wkbpi	csps	cpups	cspq	cpupq	dbgb1	dbgb2	rss	maxop	p50	p99	tag
2380	114414	1140	16.8	6756.2	195.3	0.010	0.150	2.839	84.042	488018	39.8	4.265	278	217.4	393.8	215.9	0.023	4795	4412	480m.my5651_rel_native_lto.cy10_u
2379	106796	967	15.1	7160.1	205.5	0.009	0.145	3.010	88.476	453290	41.7	4.244	312	220.9	400.1	216.9	0.023	4476	4188	480m.my5740_rel_native_lto.cy10_u
2378	88428	1203	18.8	7819.6	225.1	0.014	0.218	3.288	96.933	471405	40.7	5.331	368	226.9	385.6	216.2	0.020	3709	3293	480m.my8033_rel_native_lto.cy10_u
q500.1
q500.1: range queries with 500 insert/s per client
Performance metrics for all DBMS, not just the ones listed above. Some are normalized by throughput, others are not. Legend for results is here.
ips	qps	rps	rmbps	wps	wmbps	rpq	rkbpq	wpi	wkbpi	csps	cpups	cspq	cpupq	dbgb1	dbgb2	rss	maxop	p50	p99	tag
11904	118373	823	8.4	5354.0	155.7	0.007	0.073	0.450	13.394	500843	42.5	4.231	287	217.4	393.8	215.9	0.061	4891	4460	480m.my5651_rel_native_lto.cy10_u
11904	107989	489	7.6	5682.5	164.5	0.005	0.072	0.477	14.148	456755	43.7	4.230	324	220.9	400.1	216.9	0.095	4523	4220	480m.my5740_rel_native_lto.cy10_u
11898	89513	752	11.7	6316.2	184.5	0.008	0.134	0.531	15.882	505405	42.1	5.646	376	226.9	388.9	216.2	0.032	3756	3309	480m.my8033_rel_native_lto.cy10_u
q1000.1
q1000.1: range queries with 1000 insert/s per client
Performance metrics for all DBMS, not just the ones listed above. Some are normalized by throughput, others are not. Legend for results is here.
ips	qps	rps	rmbps	wps	wmbps	rpq	rkbpq	wpi	wkbpi	csps	cpups	cspq	cpupq	dbgb1	dbgb2	rss	maxop	p50	p99	tag
23834	107661	791	6.1	3495.6	103.3	0.007	0.058	0.147	4.440	456168	54.5	4.237	405	217.4	393.8	215.9	0.028	4491	4140	480m.my5651_rel_native_lto.cy10_u
23828	105594	255	4.0	4920.9	143.9	0.002	0.039	0.207	6.185	434485	49.1	4.115	372	220.9	400.1	216.9	0.036	4412	4060	480m.my5740_rel_native_lto.cy10_u
23821	92676	163	2.5	5128.4	151.8	0.002	0.028	0.215	6.524	514374	40.7	5.550	351	226.9	355.9	216.2	0.023	3884	3500	480m.my8033_rel_native_lto.cy10_u
l.i0
- l.i0: load without secondary indexes
- Legend for results is here.
- Each entry lists the percentage of responses that fit in that bucket (slower than max time for previous bucket, faster than min time for next bucket).
Insert response time histogram
256us	1ms	4ms	16ms	64ms	256ms	1s	4s	16s	gt	max	tag
0.000	0.347	11.482	87.914	0.215	0.043	0.000	0.000	0.000	0.000	0.100	my5651_rel_native_lto.cy10_u
0.000	0.216	57.866	41.872	0.003	0.043	0.000	0.000	0.000	0.000	0.166	my5740_rel_native_lto.cy10_u
0.000	0.000	99.924	0.027	0.006	0.043	0.000	0.000	0.000	0.000	0.118	my8033_rel_native_lto.cy10_u
l.x
- l.x: create secondary indexes
- Legend for results is here.
- Each entry lists the percentage of responses that fit in that bucket (slower than max time for previous bucket, faster than min time for next bucket).
TODO - determine whether there is data for create index response time
l.i1
- l.i1: continue load after secondary indexes created
- Legend for results is here.
- Each entry lists the percentage of responses that fit in that bucket (slower than max time for previous bucket, faster than min time for next bucket).
Insert response time histogram
256us	1ms	4ms	16ms	64ms	256ms	1s	4s	16s	gt	max	tag
0.000	0.000	0.008	16.328	83.638	0.025	0.000	0.000	0.000	0.000	0.163	my5651_rel_native_lto.cy10_u
0.000	0.000	0.012	99.772	0.193	0.023	nonzero	0.000	0.000	0.000	0.663	my5740_rel_native_lto.cy10_u
0.000	0.000	20.825	78.862	0.273	0.039	0.000	0.000	0.000	0.000	0.185	my8033_rel_native_lto.cy10_u
Delete response time histogram
256us	1ms	4ms	16ms	64ms	256ms	1s	4s	16s	gt	max	tag
0.000	0.000	0.013	21.062	78.918	0.007	0.000	0.000	0.000	0.000	0.151	my5651_rel_native_lto.cy10_u
0.000	0.000	0.034	99.843	0.100	0.022	nonzero	0.000	0.000	0.000	0.660	my5740_rel_native_lto.cy10_u
0.000	0.000	86.855	12.950	0.171	0.025	0.000	0.000	0.000	0.000	0.139	my8033_rel_native_lto.cy10_u
q100.1
- q100.1: range queries with 100 insert/s per client
- Legend for results is here.
- Each entry lists the percentage of responses that fit in that bucket (slower than max time for previous bucket, faster than min time for next bucket).
Query response time histogram
256us	1ms	4ms	16ms	64ms	256ms	1s	4s	16s	gt	max	tag
93.070	6.651	0.164	0.115	nonzero	0.000	0.000	0.000	0.000	0.000	0.023	my5651_rel_native_lto.cy10_u
84.942	15.055	0.003	nonzero	nonzero	0.000	0.000	0.000	0.000	0.000	0.023	my5740_rel_native_lto.cy10_u
54.094	45.902	0.004	nonzero	nonzero	0.000	0.000	0.000	0.000	0.000	0.020	my8033_rel_native_lto.cy10_u
Insert response time histogram
256us	1ms	4ms	16ms	64ms	256ms	1s	4s	16s	gt	max	tag
0.000	0.000	32.093	67.597	0.310	0.000	0.000	0.000	0.000	0.000	0.044	my5651_rel_native_lto.cy10_u
0.000	0.000	31.056	68.943	0.001	0.000	0.000	0.000	0.000	0.000	0.022	my5740_rel_native_lto.cy10_u
0.000	0.000	53.372	46.627	0.001	0.000	0.000	0.000	0.000	0.000	0.018	my8033_rel_native_lto.cy10_u
Delete response time histogram
256us	1ms	4ms	16ms	64ms	256ms	1s	4s	16s	gt	max	tag
0.000	0.000	64.556	35.388	0.056	0.000	0.000	0.000	0.000	0.000	0.044	my5651_rel_native_lto.cy10_u
0.000	0.000	78.004	21.996	0.000	0.000	0.000	0.000	0.000	0.000	0.015	my5740_rel_native_lto.cy10_u
0.000	0.000	99.812	0.187	0.001	0.000	0.000	0.000	0.000	0.000	0.023	my8033_rel_native_lto.cy10_u
q500.1
- q500.1: range queries with 500 insert/s per client
- Legend for results is here.
- Each entry lists the percentage of responses that fit in that bucket (slower than max time for previous bucket, faster than min time for next bucket).
Query response time histogram
256us	1ms	4ms	16ms	64ms	256ms	1s	4s	16s	gt	max	tag
95.144	4.752	0.034	0.070	nonzero	0.000	0.000	0.000	0.000	0.000	0.061	my5651_rel_native_lto.cy10_u
86.685	13.306	0.008	nonzero	nonzero	nonzero	0.000	0.000	0.000	0.000	0.095	my5740_rel_native_lto.cy10_u
55.143	44.851	0.006	nonzero	nonzero	0.000	0.000	0.000	0.000	0.000	0.032	my8033_rel_native_lto.cy10_u
Insert response time histogram
256us	1ms	4ms	16ms	64ms	256ms	1s	4s	16s	gt	max	tag
0.000	0.000	10.727	89.101	0.172	0.001	0.000	0.000	0.000	0.000	0.077	my5651_rel_native_lto.cy10_u
0.000	0.000	6.337	93.658	0.005	nonzero	0.000	0.000	0.000	0.000	0.093	my5740_rel_native_lto.cy10_u
0.000	0.000	83.694	16.306	nonzero	0.000	0.000	0.000	0.000	0.000	0.021	my8033_rel_native_lto.cy10_u
Delete response time histogram
256us	1ms	4ms	16ms	64ms	256ms	1s	4s	16s	gt	max	tag
0.000	0.000	16.760	83.173	0.066	0.001	0.000	0.000	0.000	0.000	0.074	my5651_rel_native_lto.cy10_u
0.000	0.000	14.686	85.310	0.004	0.000	0.000	0.000	0.000	0.000	0.045	my5740_rel_native_lto.cy10_u
0.000	0.000	99.900	0.099	nonzero	0.000	0.000	0.000	0.000	0.000	0.020	my8033_rel_native_lto.cy10_u
q1000.1
- q1000.1: range queries with 1000 insert/s per client
- Legend for results is here.
- Each entry lists the percentage of responses that fit in that bucket (slower than max time for previous bucket, faster than min time for next bucket).
Query response time histogram
256us	1ms	4ms	16ms	64ms	256ms	1s	4s	16s	gt	max	tag
84.144	15.475	0.317	0.064	nonzero	0.000	0.000	0.000	0.000	0.000	0.028	my5651_rel_native_lto.cy10_u
82.592	17.313	0.073	0.021	nonzero	0.000	0.000	0.000	0.000	0.000	0.036	my5740_rel_native_lto.cy10_u
62.433	37.547	0.019	nonzero	nonzero	0.000	0.000	0.000	0.000	0.000	0.023	my8033_rel_native_lto.cy10_u
Insert response time histogram
256us	1ms	4ms	16ms	64ms	256ms	1s	4s	16s	gt	max	tag
0.000	0.000	0.358	17.403	82.238	0.001	0.000	0.000	0.000	0.000	0.076	my5651_rel_native_lto.cy10_u
0.000	0.000	2.776	93.934	3.290	0.000	0.000	0.000	0.000	0.000	0.058	my5740_rel_native_lto.cy10_u
0.000	0.000	59.408	40.586	0.006	0.000	0.000	0.000	0.000	0.000	0.030	my8033_rel_native_lto.cy10_u
Delete response time histogram
256us	1ms	4ms	16ms	64ms	256ms	1s	4s	16s	gt	max	tag
0.000	0.000	0.169	20.179	79.652	nonzero	0.000	0.000	0.000	0.000	0.074	my5651_rel_native_lto.cy10_u
0.000	0.000	2.837	94.731	2.432	0.000	0.000	0.000	0.000	0.000	0.048	my5740_rel_native_lto.cy10_u
0.000	0.000	97.056	2.941	0.004	0.000	0.000	0.000	0.000	0.000	0.035	my8033_rel_native_lto.cy10_u