Introduction
This is a report for the insert benchmark with 480M docs and 24 client(s). It is generated by scripts (bash, awk, sed) and Tufte might not be impressed. An overview of the insert benchmark is here and a short update is here. Below, by DBMS, I mean DBMS+version.config. An example is my8020.c10b40 where my means MySQL, 8020 is version 8.0.20 and c10b40 is the name for the configuration file.
The test server has 80 cores with hyperthreads enabled, 256G RAM and fast SSD. The benchmark was run with 24 client and there were 1 or 3 connections per client (1 for queries or inserts without rate limits, 1+1 for rate limited inserts+deletes). There are 24 tables, with a client per table. It loads 20M rows per-table without secondary indexes, creates secondary indexes, then inserts 50M rows per-table with a delete per insert to avoid growing the table. The read-write tests were run for 7200 seconds each. The read+write tests were skipped. The database is cached by RocksDB.
The tested DBMS are:
- fbmy5635_202203072101.cy9c5_u - MyRocks with FB MySQL 5.6.35 from 7 March 2022 at git hash 84ce624a with RocksDB 6.28.2, cy9c5_u config
- fbmy5635_202304122154.cy9c5_u - MyRocks with FB MySQL 5.6.35 from 12 April 2023 at git hash f2161d019 with RocksDB 7.10.2, cy9c5_u config
- fbmy5635_202305292102.cy9c5_u - MyRocks with FB MySQL 5.6.35 from 29 May 2023 at git hash 509203f4 with RocksDB 8.2.1, cy9c5_u config
- fbmy5635_jun23_7e40af67.cy9c5_u - MyRocks with FB MySQL 5.6.35 from 23 June 2023 at git hash 7e40af67 with RocksDB 8.2.1, cy9c5_u config
Contents
- Summary
- l.i0: load without secondary indexes
- l.x: create secondary indexes
- l.i1: continue load after secondary indexes created
- q100.1: range queries with 100 insert/s per client
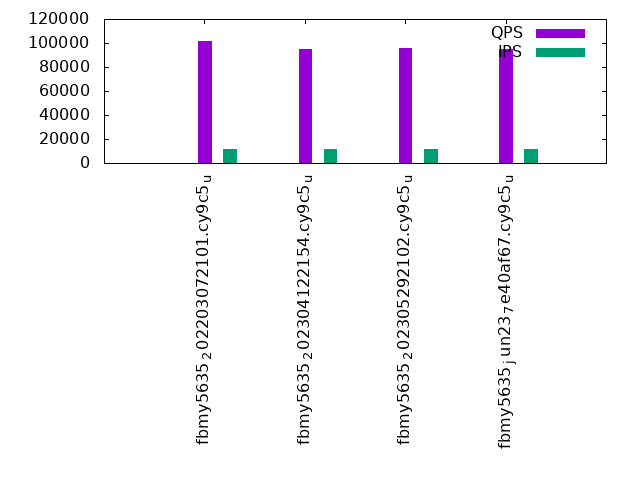
- q500.1: range queries with 500 insert/s per client
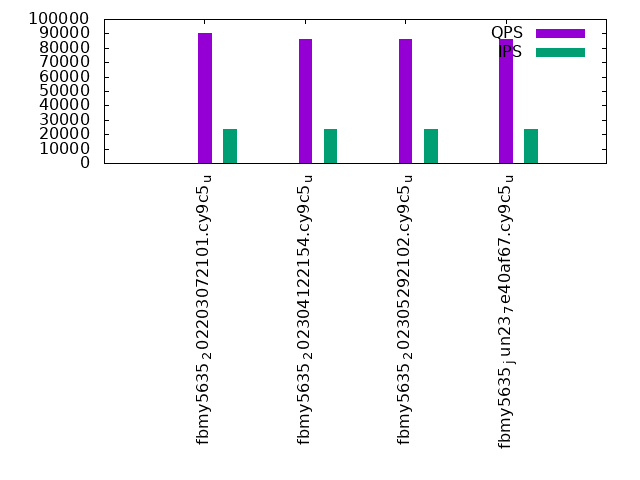
- q1000.1: range queries with 1000 insert/s per client
Summary
The numbers are inserts/s for l.i0 and l.i1, indexed docs (or rows) /s for l.x and queries/s for q*.2. The values are the average rate over the entire test for inserts (IPS) and queries (QPS). The range of values for IPS and QPS is split into 3 parts: bottom 25%, middle 50%, top 25%. Values in the bottom 25% have a red background, values in the top 25% have a green background and values in the middle have no color. A gray background is used for values that can be ignored because the DBMS did not sustain the target insert rate. Red backgrounds are not used when the minimum value is within 80% of the max value.
| dbms | l.i0 | l.x | l.i1 | q100.1 | q500.1 | q1000.1 |
|---|---|---|---|---|---|---|
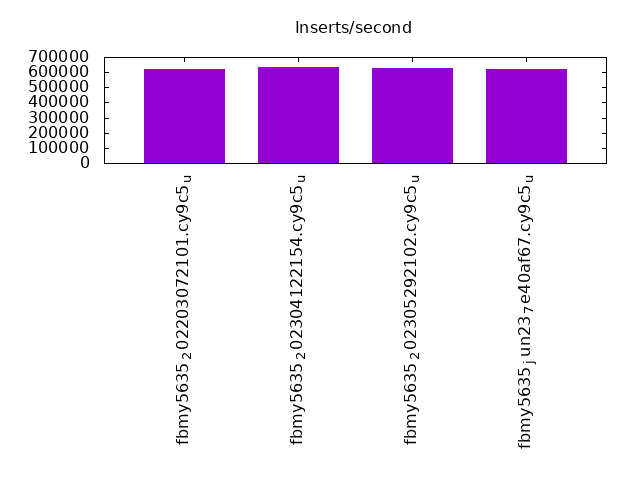
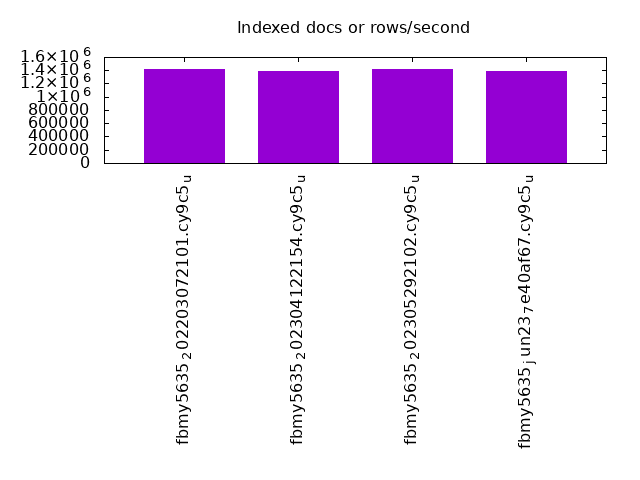
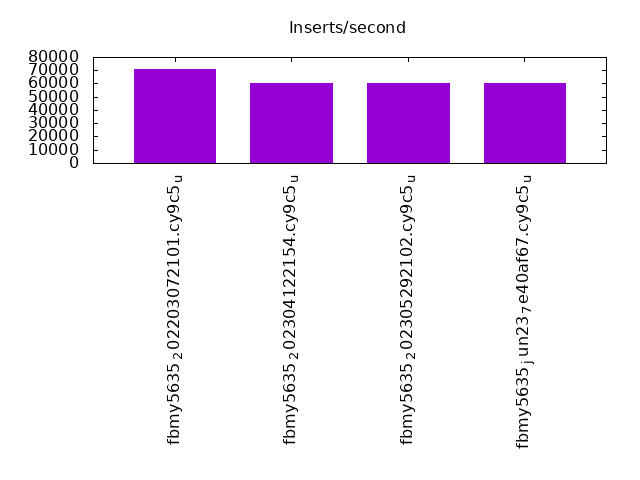
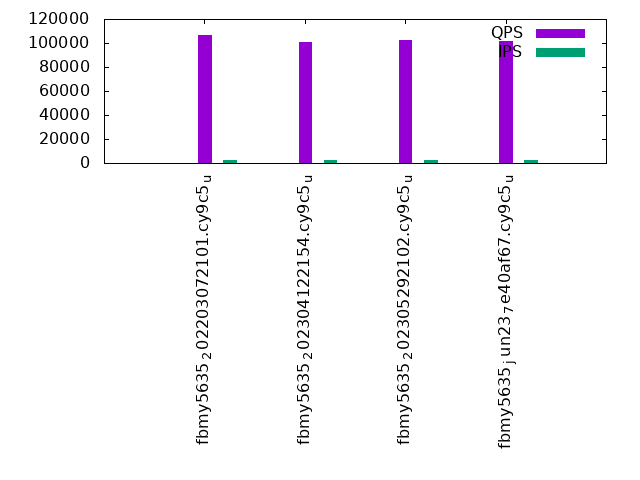
| fbmy5635_202203072101.cy9c5_u | 618557 | 1424629 | 70985 | 106908 | 101746 | 90064 |
| fbmy5635_202304122154.cy9c5_u | 630749 | 1395640 | 60162 | 101073 | 95302 | 85857 |
| fbmy5635_202305292102.cy9c5_u | 625000 | 1416224 | 60277 | 102143 | 95512 | 86372 |
| fbmy5635_jun23_7e40af67.cy9c5_u | 622568 | 1391594 | 60193 | 101537 | 94932 | 86164 |
This table has relative throughput, throughput for the DBMS relative to the DBMS in the first line, using the absolute throughput from the previous table. Values less than 0.95 have a yellow background. Values greater than 1.05 have a blue background.
| dbms | l.i0 | l.x | l.i1 | q100.1 | q500.1 | q1000.1 |
|---|---|---|---|---|---|---|
| fbmy5635_202203072101.cy9c5_u | 1.00 | 1.00 | 1.00 | 1.00 | 1.00 | 1.00 |
| fbmy5635_202304122154.cy9c5_u | 1.02 | 0.98 | 0.85 | 0.95 | 0.94 | 0.95 |
| fbmy5635_202305292102.cy9c5_u | 1.01 | 0.99 | 0.85 | 0.96 | 0.94 | 0.96 |
| fbmy5635_jun23_7e40af67.cy9c5_u | 1.01 | 0.98 | 0.85 | 0.95 | 0.93 | 0.96 |
This lists the average rate of inserts/s for the tests that do inserts concurrent with queries. For such tests the query rate is listed in the table above. The read+write tests are setup so that the insert rate should match the target rate every second. Cells that are not at least 95% of the target have a red background to indicate a failure to satisfy the target.
| dbms | q100.1 | q500.1 | q1000.1 |
|---|---|---|---|
| fbmy5635_202203072101.cy9c5_u | 2389 | 11948 | 23907 |
| fbmy5635_202304122154.cy9c5_u | 2389 | 11947 | 23904 |
| fbmy5635_202305292102.cy9c5_u | 2390 | 11948 | 23907 |
| fbmy5635_jun23_7e40af67.cy9c5_u | 2390 | 11947 | 23907 |
| target | 2400 | 12000 | 24000 |
l.i0
l.i0: load without secondary indexes. Graphs for performance per 1-second interval are here.
Average throughput:
Insert response time histogram: each cell has the percentage of responses that take <= the time in the header and max is the max response time in seconds. For the max column values in the top 25% of the range have a red background and in the bottom 25% of the range have a green background. The red background is not used when the min value is within 80% of the max value.
| dbms | 256us | 1ms | 4ms | 16ms | 64ms | 256ms | 1s | 4s | 16s | gt | max |
|---|---|---|---|---|---|---|---|---|---|---|---|
| fbmy5635_202203072101.cy9c5_u | 0.337 | 73.511 | 26.111 | 0.041 | 0.095 | ||||||
| fbmy5635_202304122154.cy9c5_u | 0.184 | 77.986 | 21.788 | 0.042 | 0.105 | ||||||
| fbmy5635_202305292102.cy9c5_u | 0.163 | 77.255 | 22.539 | 0.001 | 0.042 | 0.116 | |||||
| fbmy5635_jun23_7e40af67.cy9c5_u | 0.134 | 76.420 | 23.402 | 0.002 | 0.042 | 0.094 |
Performance metrics for the DBMS listed above. Some are normalized by throughput, others are not. Legend for results is here.
ips	qps	rps	rmbps	wps	wmbps	rpq	rkbpq	wpi	wkbpi	csps	cpups	cspq	cpupq	dbgb1	dbgb2	rss	maxop	p50	p99	tag
618557	0	0	0.0	2565.8	307.7	0.000	0.000	0.004	0.509	551758	41.1	0.892	53	15.6	16.7	5.0	0.095	26374	18083	480m.fbmy5635_202203072101.cy9c5_u
630749	0	0	0.0	2154.8	257.9	0.000	0.000	0.003	0.419	262848	35.9	0.417	46	15.1	16.2	4.1	0.105	26973	17682	480m.fbmy5635_202304122154.cy9c5_u
625000	0	0	0.0	2126.0	255.1	0.000	0.000	0.003	0.418	306553	36.6	0.490	47	15.1	16.2	4.1	0.116	27073	20881	480m.fbmy5635_202305292102.cy9c5_u
622568	0	0	0.0	2151.9	258.4	0.000	0.000	0.003	0.425	304619	37.0	0.489	48	15.2	16.3	4.1	0.094	26873	19281	480m.fbmy5635_jun23_7e40af67.cy9c5_u
l.x
l.x: create secondary indexes.
Average throughput:
Performance metrics for the DBMS listed above. Some are normalized by throughput, others are not. Legend for results is here.
ips	qps	rps	rmbps	wps	wmbps	rpq	rkbpq	wpi	wkbpi	csps	cpups	cspq	cpupq	dbgb1	dbgb2	rss	maxop	p50	p99	tag
1424629	0	30	0.2	1894.5	207.8	0.000	0.000	0.001	0.149	33748	28.5	0.024	16	32.4	33.5	45.5	0.002	NA	NA	480m.fbmy5635_202203072101.cy9c5_u
1395640	0	29	0.2	1755.1	191.3	0.000	0.000	0.001	0.140	32284	28.1	0.023	16	32.3	33.5	39.6	0.003	NA	NA	480m.fbmy5635_202304122154.cy9c5_u
1416224	0	29	0.2	1785.7	194.7	0.000	0.000	0.001	0.141	33374	28.3	0.024	16	32.3	33.5	40.5	0.002	NA	NA	480m.fbmy5635_202305292102.cy9c5_u
1391594	0	29	0.2	1768.0	192.8	0.000	0.000	0.001	0.142	34174	28.5	0.025	16	32.3	33.4	39.2	0.002	NA	NA	480m.fbmy5635_jun23_7e40af67.cy9c5_u
l.i1
l.i1: continue load after secondary indexes created. Graphs for performance per 1-second interval are here.
Average throughput:
Insert response time histogram: each cell has the percentage of responses that take <= the time in the header and max is the max response time in seconds. For the max column values in the top 25% of the range have a red background and in the bottom 25% of the range have a green background. The red background is not used when the min value is within 80% of the max value.
| dbms | 256us | 1ms | 4ms | 16ms | 64ms | 256ms | 1s | 4s | 16s | gt | max |
|---|---|---|---|---|---|---|---|---|---|---|---|
| fbmy5635_202203072101.cy9c5_u | nonzero | 0.051 | 32.222 | 67.724 | 0.003 | 0.174 | |||||
| fbmy5635_202304122154.cy9c5_u | 0.031 | 11.951 | 88.014 | 0.004 | 0.204 | ||||||
| fbmy5635_202305292102.cy9c5_u | 0.027 | 12.414 | 87.555 | 0.004 | 0.164 | ||||||
| fbmy5635_jun23_7e40af67.cy9c5_u | 0.030 | 12.359 | 87.608 | 0.003 | 0.149 |
Delete response time histogram: each cell has the percentage of responses that take <= the time in the header and max is the max response time in seconds. For the max column values in the top 25% of the range have a red background and in the bottom 25% of the range have a green background. The red background is not used when the min value is within 80% of the max value.
| dbms | 256us | 1ms | 4ms | 16ms | 64ms | 256ms | 1s | 4s | 16s | gt | max |
|---|---|---|---|---|---|---|---|---|---|---|---|
| fbmy5635_202203072101.cy9c5_u | 0.001 | 0.052 | 37.347 | 62.597 | 0.004 | 0.238 | |||||
| fbmy5635_202304122154.cy9c5_u | nonzero | 0.032 | 13.340 | 86.624 | 0.004 | 0.219 | |||||
| fbmy5635_202305292102.cy9c5_u | nonzero | 0.028 | 13.986 | 85.982 | 0.004 | nonzero | 0.272 | ||||
| fbmy5635_jun23_7e40af67.cy9c5_u | nonzero | 0.031 | 13.923 | 86.042 | 0.004 | 0.209 |
Performance metrics for the DBMS listed above. Some are normalized by throughput, others are not. Legend for results is here.
ips	qps	rps	rmbps	wps	wmbps	rpq	rkbpq	wpi	wkbpi	csps	cpups	cspq	cpupq	dbgb1	dbgb2	rss	maxop	p50	p99	tag
70985	0	122	1.4	1941.1	231.9	0.002	0.020	0.027	3.346	144884	16.4	2.041	185	37.6	37.7	177.1	0.174	2947	2647	480m.fbmy5635_202203072101.cy9c5_u
60162	0	45	0.8	1472.2	175.3	0.001	0.014	0.024	2.984	119015	15.3	1.978	203	37.9	38.0	177.3	0.204	2498	2248	480m.fbmy5635_202304122154.cy9c5_u
60277	0	46	0.9	1471.3	174.4	0.001	0.014	0.024	2.963	118875	15.7	1.972	208	41.0	41.1	177.1	0.164	2547	2248	480m.fbmy5635_202305292102.cy9c5_u
60193	0	45	0.8	1472.5	171.0	0.001	0.014	0.024	2.909	120067	15.7	1.995	209	37.9	38.0	177.2	0.149	2498	2248	480m.fbmy5635_jun23_7e40af67.cy9c5_u
q100.1
q100.1: range queries with 100 insert/s per client. Graphs for performance per 1-second interval are here.
Average throughput:
Query response time histogram: each cell has the percentage of responses that take <= the time in the header and max is the max response time in seconds. For max values in the top 25% of the range have a red background and in the bottom 25% of the range have a green background. The red background is not used when the min value is within 80% of the max value.
| dbms | 256us | 1ms | 4ms | 16ms | 64ms | 256ms | 1s | 4s | 16s | gt | max |
|---|---|---|---|---|---|---|---|---|---|---|---|
| fbmy5635_202203072101.cy9c5_u | 84.234 | 15.765 | 0.001 | nonzero | nonzero | 0.032 | |||||
| fbmy5635_202304122154.cy9c5_u | 75.297 | 24.702 | 0.001 | nonzero | nonzero | 0.025 | |||||
| fbmy5635_202305292102.cy9c5_u | 77.035 | 22.964 | 0.001 | nonzero | nonzero | nonzero | 0.066 | ||||
| fbmy5635_jun23_7e40af67.cy9c5_u | 76.289 | 23.710 | 0.001 | nonzero | nonzero | 0.023 |
Insert response time histogram: each cell has the percentage of responses that take <= the time in the header and max is the max response time in seconds. For max values in the top 25% of the range have a red background and in the bottom 25% of the range have a green background. The red background is not used when the min value is within 80% of the max value.
| dbms | 256us | 1ms | 4ms | 16ms | 64ms | 256ms | 1s | 4s | 16s | gt | max |
|---|---|---|---|---|---|---|---|---|---|---|---|
| fbmy5635_202203072101.cy9c5_u | 99.998 | 0.002 | 0.009 | ||||||||
| fbmy5635_202304122154.cy9c5_u | 99.961 | 0.039 | 0.010 | ||||||||
| fbmy5635_202305292102.cy9c5_u | 99.577 | 0.423 | nonzero | 0.026 | |||||||
| fbmy5635_jun23_7e40af67.cy9c5_u | 97.599 | 2.401 | 0.014 |
Delete response time histogram: each cell has the percentage of responses that take <= the time in the header and max is the max response time in seconds. For max values in the top 25% of the range have a red background and in the bottom 25% of the range have a green background. The red background is not used when the min value is within 80% of the max value.
| dbms | 256us | 1ms | 4ms | 16ms | 64ms | 256ms | 1s | 4s | 16s | gt | max |
|---|---|---|---|---|---|---|---|---|---|---|---|
| fbmy5635_202203072101.cy9c5_u | 0.118 | 99.874 | 0.006 | 0.003 | nonzero | 0.069 | |||||
| fbmy5635_202304122154.cy9c5_u | 0.001 | 99.980 | 0.017 | 0.002 | 0.054 | ||||||
| fbmy5635_202305292102.cy9c5_u | 99.776 | 0.220 | 0.003 | 0.001 | 0.082 | ||||||
| fbmy5635_jun23_7e40af67.cy9c5_u | 98.253 | 1.746 | 0.001 | 0.019 |
Performance metrics for the DBMS listed above. Some are normalized by throughput, others are not. Legend for results is here.
ips	qps	rps	rmbps	wps	wmbps	rpq	rkbpq	wpi	wkbpi	csps	cpups	cspq	cpupq	dbgb1	dbgb2	rss	maxop	p50	p99	tag
2389	106908	5	0.0	90.4	10.2	0.000	0.000	0.038	4.379	488396	31.8	4.568	238	35.8	37.6	179.5	0.032	4428	3886	480m.fbmy5635_202203072101.cy9c5_u
2389	101073	7	0.2	76.1	8.4	0.000	0.002	0.032	3.607	452698	31.9	4.479	252	37.1	38.9	179.5	0.025	4236	3724	480m.fbmy5635_202304122154.cy9c5_u
2390	102143	8	0.2	76.0	8.4	0.000	0.002	0.032	3.598	457435	31.9	4.478	250	37.1	38.9	179.6	0.066	4252	3756	480m.fbmy5635_202305292102.cy9c5_u
2390	101537	9	0.2	75.3	8.3	0.000	0.002	0.031	3.561	455417	32.0	4.485	252	37.1	38.9	179.4	0.023	4220	3740	480m.fbmy5635_jun23_7e40af67.cy9c5_u
q500.1
q500.1: range queries with 500 insert/s per client. Graphs for performance per 1-second interval are here.
Average throughput:
Query response time histogram: each cell has the percentage of responses that take <= the time in the header and max is the max response time in seconds. For max values in the top 25% of the range have a red background and in the bottom 25% of the range have a green background. The red background is not used when the min value is within 80% of the max value.
| dbms | 256us | 1ms | 4ms | 16ms | 64ms | 256ms | 1s | 4s | 16s | gt | max |
|---|---|---|---|---|---|---|---|---|---|---|---|
| fbmy5635_202203072101.cy9c5_u | 77.153 | 22.845 | 0.001 | nonzero | nonzero | nonzero | 0.089 | ||||
| fbmy5635_202304122154.cy9c5_u | 65.169 | 34.829 | 0.002 | nonzero | nonzero | nonzero | 0.084 | ||||
| fbmy5635_202305292102.cy9c5_u | 65.515 | 34.482 | 0.002 | nonzero | nonzero | nonzero | 0.083 | ||||
| fbmy5635_jun23_7e40af67.cy9c5_u | 64.584 | 35.413 | 0.002 | nonzero | nonzero | nonzero | 0.128 |
Insert response time histogram: each cell has the percentage of responses that take <= the time in the header and max is the max response time in seconds. For max values in the top 25% of the range have a red background and in the bottom 25% of the range have a green background. The red background is not used when the min value is within 80% of the max value.
| dbms | 256us | 1ms | 4ms | 16ms | 64ms | 256ms | 1s | 4s | 16s | gt | max |
|---|---|---|---|---|---|---|---|---|---|---|---|
| fbmy5635_202203072101.cy9c5_u | nonzero | 99.647 | 0.350 | 0.002 | 0.001 | 0.085 | |||||
| fbmy5635_202304122154.cy9c5_u | 25.640 | 63.948 | 10.410 | 0.002 | 0.093 | ||||||
| fbmy5635_202305292102.cy9c5_u | 29.927 | 65.411 | 4.661 | nonzero | 0.095 | ||||||
| fbmy5635_jun23_7e40af67.cy9c5_u | 19.908 | 73.823 | 6.268 | 0.002 | 0.103 |
Delete response time histogram: each cell has the percentage of responses that take <= the time in the header and max is the max response time in seconds. For max values in the top 25% of the range have a red background and in the bottom 25% of the range have a green background. The red background is not used when the min value is within 80% of the max value.
| dbms | 256us | 1ms | 4ms | 16ms | 64ms | 256ms | 1s | 4s | 16s | gt | max |
|---|---|---|---|---|---|---|---|---|---|---|---|
| fbmy5635_202203072101.cy9c5_u | 0.081 | 99.679 | 0.229 | 0.008 | 0.002 | 0.088 | |||||
| fbmy5635_202304122154.cy9c5_u | nonzero | 27.637 | 62.984 | 9.375 | 0.004 | 0.097 | |||||
| fbmy5635_202305292102.cy9c5_u | 31.497 | 64.330 | 4.171 | 0.002 | 0.097 | ||||||
| fbmy5635_jun23_7e40af67.cy9c5_u | 21.939 | 72.500 | 5.558 | 0.002 | 0.108 |
Performance metrics for the DBMS listed above. Some are normalized by throughput, others are not. Legend for results is here.
ips	qps	rps	rmbps	wps	wmbps	rpq	rkbpq	wpi	wkbpi	csps	cpups	cspq	cpupq	dbgb1	dbgb2	rss	maxop	p50	p99	tag
11948	101746	28	0.2	381.4	44.4	0.000	0.002	0.032	3.807	480879	33.5	4.726	263	36.2	36.4	184.9	0.089	4236	3676	480m.fbmy5635_202203072101.cy9c5_u
11947	95302	16	0.2	331.7	38.4	0.000	0.002	0.028	3.292	444941	34.0	4.669	285	37.5	37.8	184.8	0.084	3995	3421	480m.fbmy5635_202304122154.cy9c5_u
11948	95512	21	0.2	327.3	37.5	0.000	0.002	0.027	3.215	447091	34.1	4.681	286	37.5	37.8	184.8	0.083	3980	3421	480m.fbmy5635_202305292102.cy9c5_u
11947	94932	15	0.2	326.0	37.5	0.000	0.002	0.027	3.210	444301	34.1	4.680	287	37.5	37.8	184.8	0.128	3964	3405	480m.fbmy5635_jun23_7e40af67.cy9c5_u
q1000.1
q1000.1: range queries with 1000 insert/s per client. Graphs for performance per 1-second interval are here.
Average throughput:
Query response time histogram: each cell has the percentage of responses that take <= the time in the header and max is the max response time in seconds. For max values in the top 25% of the range have a red background and in the bottom 25% of the range have a green background. The red background is not used when the min value is within 80% of the max value.
| dbms | 256us | 1ms | 4ms | 16ms | 64ms | 256ms | 1s | 4s | 16s | gt | max |
|---|---|---|---|---|---|---|---|---|---|---|---|
| fbmy5635_202203072101.cy9c5_u | 54.251 | 45.744 | 0.005 | nonzero | nonzero | nonzero | 0.088 | ||||
| fbmy5635_202304122154.cy9c5_u | 44.771 | 55.217 | 0.012 | nonzero | nonzero | nonzero | 0.093 | ||||
| fbmy5635_202305292102.cy9c5_u | 45.933 | 54.055 | 0.012 | nonzero | nonzero | nonzero | 0.097 | ||||
| fbmy5635_jun23_7e40af67.cy9c5_u | 45.460 | 54.527 | 0.013 | nonzero | nonzero | nonzero | 0.076 |
Insert response time histogram: each cell has the percentage of responses that take <= the time in the header and max is the max response time in seconds. For max values in the top 25% of the range have a red background and in the bottom 25% of the range have a green background. The red background is not used when the min value is within 80% of the max value.
| dbms | 256us | 1ms | 4ms | 16ms | 64ms | 256ms | 1s | 4s | 16s | gt | max |
|---|---|---|---|---|---|---|---|---|---|---|---|
| fbmy5635_202203072101.cy9c5_u | 15.395 | 83.700 | 0.905 | 0.001 | 0.094 | ||||||
| fbmy5635_202304122154.cy9c5_u | 1.575 | 8.796 | 89.625 | 0.004 | 0.106 | ||||||
| fbmy5635_202305292102.cy9c5_u | 2.164 | 11.358 | 86.476 | 0.002 | 0.105 | ||||||
| fbmy5635_jun23_7e40af67.cy9c5_u | 1.713 | 10.915 | 87.370 | 0.002 | 0.103 |
Delete response time histogram: each cell has the percentage of responses that take <= the time in the header and max is the max response time in seconds. For max values in the top 25% of the range have a red background and in the bottom 25% of the range have a green background. The red background is not used when the min value is within 80% of the max value.
| dbms | 256us | 1ms | 4ms | 16ms | 64ms | 256ms | 1s | 4s | 16s | gt | max |
|---|---|---|---|---|---|---|---|---|---|---|---|
| fbmy5635_202203072101.cy9c5_u | 0.002 | 16.787 | 82.377 | 0.832 | 0.002 | 0.101 | |||||
| fbmy5635_202304122154.cy9c5_u | nonzero | 1.592 | 9.723 | 88.679 | 0.005 | 0.106 | |||||
| fbmy5635_202305292102.cy9c5_u | 2.129 | 12.336 | 85.532 | 0.003 | 0.115 | ||||||
| fbmy5635_jun23_7e40af67.cy9c5_u | 1.685 | 11.872 | 86.440 | 0.003 | 0.121 |
Performance metrics for the DBMS listed above. Some are normalized by throughput, others are not. Legend for results is here.
ips	qps	rps	rmbps	wps	wmbps	rpq	rkbpq	wpi	wkbpi	csps	cpups	cspq	cpupq	dbgb1	dbgb2	rss	maxop	p50	p99	tag
23907	90064	83	0.7	696.1	81.6	0.001	0.007	0.029	3.496	467751	36.1	5.194	321	37.6	38.8	186.6	0.088	3724	3181	480m.fbmy5635_202203072101.cy9c5_u
23904	85857	49	0.5	616.0	71.9	0.001	0.006	0.026	3.079	433169	37.3	5.045	348	38.3	39.5	186.4	0.093	3565	2957	480m.fbmy5635_202304122154.cy9c5_u
23907	86372	131	0.9	614.5	70.8	0.002	0.011	0.026	3.034	435482	37.4	5.042	346	38.6	39.9	186.5	0.097	3581	2957	480m.fbmy5635_202305292102.cy9c5_u
23907	86164	58	0.6	615.3	71.9	0.001	0.008	0.026	3.078	434606	37.4	5.044	347	38.6	39.9	186.6	0.076	3580	2957	480m.fbmy5635_jun23_7e40af67.cy9c5_u
l.i0
l.i0: load without secondary indexes
Performance metrics for all DBMS, not just the ones listed above. Some are normalized by throughput, others are not. Legend for results is here.
ips	qps	rps	rmbps	wps	wmbps	rpq	rkbpq	wpi	wkbpi	csps	cpups	cspq	cpupq	dbgb1	dbgb2	rss	maxop	p50	p99	tag
618557	0	0	0.0	2565.8	307.7	0.000	0.000	0.004	0.509	551758	41.1	0.892	53	15.6	16.7	5.0	0.095	26374	18083	480m.fbmy5635_202203072101.cy9c5_u
630749	0	0	0.0	2154.8	257.9	0.000	0.000	0.003	0.419	262848	35.9	0.417	46	15.1	16.2	4.1	0.105	26973	17682	480m.fbmy5635_202304122154.cy9c5_u
625000	0	0	0.0	2126.0	255.1	0.000	0.000	0.003	0.418	306553	36.6	0.490	47	15.1	16.2	4.1	0.116	27073	20881	480m.fbmy5635_202305292102.cy9c5_u
622568	0	0	0.0	2151.9	258.4	0.000	0.000	0.003	0.425	304619	37.0	0.489	48	15.2	16.3	4.1	0.094	26873	19281	480m.fbmy5635_jun23_7e40af67.cy9c5_u
l.x
l.x: create secondary indexes
Performance metrics for all DBMS, not just the ones listed above. Some are normalized by throughput, others are not. Legend for results is here.
ips	qps	rps	rmbps	wps	wmbps	rpq	rkbpq	wpi	wkbpi	csps	cpups	cspq	cpupq	dbgb1	dbgb2	rss	maxop	p50	p99	tag
1424629	0	30	0.2	1894.5	207.8	0.000	0.000	0.001	0.149	33748	28.5	0.024	16	32.4	33.5	45.5	0.002	NA	NA	480m.fbmy5635_202203072101.cy9c5_u
1395640	0	29	0.2	1755.1	191.3	0.000	0.000	0.001	0.140	32284	28.1	0.023	16	32.3	33.5	39.6	0.003	NA	NA	480m.fbmy5635_202304122154.cy9c5_u
1416224	0	29	0.2	1785.7	194.7	0.000	0.000	0.001	0.141	33374	28.3	0.024	16	32.3	33.5	40.5	0.002	NA	NA	480m.fbmy5635_202305292102.cy9c5_u
1391594	0	29	0.2	1768.0	192.8	0.000	0.000	0.001	0.142	34174	28.5	0.025	16	32.3	33.4	39.2	0.002	NA	NA	480m.fbmy5635_jun23_7e40af67.cy9c5_u
l.i1
l.i1: continue load after secondary indexes created
Performance metrics for all DBMS, not just the ones listed above. Some are normalized by throughput, others are not. Legend for results is here.
ips	qps	rps	rmbps	wps	wmbps	rpq	rkbpq	wpi	wkbpi	csps	cpups	cspq	cpupq	dbgb1	dbgb2	rss	maxop	p50	p99	tag
70985	0	122	1.4	1941.1	231.9	0.002	0.020	0.027	3.346	144884	16.4	2.041	185	37.6	37.7	177.1	0.174	2947	2647	480m.fbmy5635_202203072101.cy9c5_u
60162	0	45	0.8	1472.2	175.3	0.001	0.014	0.024	2.984	119015	15.3	1.978	203	37.9	38.0	177.3	0.204	2498	2248	480m.fbmy5635_202304122154.cy9c5_u
60277	0	46	0.9	1471.3	174.4	0.001	0.014	0.024	2.963	118875	15.7	1.972	208	41.0	41.1	177.1	0.164	2547	2248	480m.fbmy5635_202305292102.cy9c5_u
60193	0	45	0.8	1472.5	171.0	0.001	0.014	0.024	2.909	120067	15.7	1.995	209	37.9	38.0	177.2	0.149	2498	2248	480m.fbmy5635_jun23_7e40af67.cy9c5_u
q100.1
q100.1: range queries with 100 insert/s per client
Performance metrics for all DBMS, not just the ones listed above. Some are normalized by throughput, others are not. Legend for results is here.
ips	qps	rps	rmbps	wps	wmbps	rpq	rkbpq	wpi	wkbpi	csps	cpups	cspq	cpupq	dbgb1	dbgb2	rss	maxop	p50	p99	tag
2389	106908	5	0.0	90.4	10.2	0.000	0.000	0.038	4.379	488396	31.8	4.568	238	35.8	37.6	179.5	0.032	4428	3886	480m.fbmy5635_202203072101.cy9c5_u
2389	101073	7	0.2	76.1	8.4	0.000	0.002	0.032	3.607	452698	31.9	4.479	252	37.1	38.9	179.5	0.025	4236	3724	480m.fbmy5635_202304122154.cy9c5_u
2390	102143	8	0.2	76.0	8.4	0.000	0.002	0.032	3.598	457435	31.9	4.478	250	37.1	38.9	179.6	0.066	4252	3756	480m.fbmy5635_202305292102.cy9c5_u
2390	101537	9	0.2	75.3	8.3	0.000	0.002	0.031	3.561	455417	32.0	4.485	252	37.1	38.9	179.4	0.023	4220	3740	480m.fbmy5635_jun23_7e40af67.cy9c5_u
q500.1
q500.1: range queries with 500 insert/s per client
Performance metrics for all DBMS, not just the ones listed above. Some are normalized by throughput, others are not. Legend for results is here.
ips	qps	rps	rmbps	wps	wmbps	rpq	rkbpq	wpi	wkbpi	csps	cpups	cspq	cpupq	dbgb1	dbgb2	rss	maxop	p50	p99	tag
11948	101746	28	0.2	381.4	44.4	0.000	0.002	0.032	3.807	480879	33.5	4.726	263	36.2	36.4	184.9	0.089	4236	3676	480m.fbmy5635_202203072101.cy9c5_u
11947	95302	16	0.2	331.7	38.4	0.000	0.002	0.028	3.292	444941	34.0	4.669	285	37.5	37.8	184.8	0.084	3995	3421	480m.fbmy5635_202304122154.cy9c5_u
11948	95512	21	0.2	327.3	37.5	0.000	0.002	0.027	3.215	447091	34.1	4.681	286	37.5	37.8	184.8	0.083	3980	3421	480m.fbmy5635_202305292102.cy9c5_u
11947	94932	15	0.2	326.0	37.5	0.000	0.002	0.027	3.210	444301	34.1	4.680	287	37.5	37.8	184.8	0.128	3964	3405	480m.fbmy5635_jun23_7e40af67.cy9c5_u
q1000.1
q1000.1: range queries with 1000 insert/s per client
Performance metrics for all DBMS, not just the ones listed above. Some are normalized by throughput, others are not. Legend for results is here.
ips	qps	rps	rmbps	wps	wmbps	rpq	rkbpq	wpi	wkbpi	csps	cpups	cspq	cpupq	dbgb1	dbgb2	rss	maxop	p50	p99	tag
23907	90064	83	0.7	696.1	81.6	0.001	0.007	0.029	3.496	467751	36.1	5.194	321	37.6	38.8	186.6	0.088	3724	3181	480m.fbmy5635_202203072101.cy9c5_u
23904	85857	49	0.5	616.0	71.9	0.001	0.006	0.026	3.079	433169	37.3	5.045	348	38.3	39.5	186.4	0.093	3565	2957	480m.fbmy5635_202304122154.cy9c5_u
23907	86372	131	0.9	614.5	70.8	0.002	0.011	0.026	3.034	435482	37.4	5.042	346	38.6	39.9	186.5	0.097	3581	2957	480m.fbmy5635_202305292102.cy9c5_u
23907	86164	58	0.6	615.3	71.9	0.001	0.008	0.026	3.078	434606	37.4	5.044	347	38.6	39.9	186.6	0.076	3580	2957	480m.fbmy5635_jun23_7e40af67.cy9c5_u
l.i0
- l.i0: load without secondary indexes
- Legend for results is here.
- Each entry lists the percentage of responses that fit in that bucket (slower than max time for previous bucket, faster than min time for next bucket).
Insert response time histogram
256us	1ms	4ms	16ms	64ms	256ms	1s	4s	16s	gt	max	tag
0.000	0.337	73.511	26.111	0.000	0.041	0.000	0.000	0.000	0.000	0.095	fbmy5635_202203072101.cy9c5_u
0.000	0.184	77.986	21.788	0.000	0.042	0.000	0.000	0.000	0.000	0.105	fbmy5635_202304122154.cy9c5_u
0.000	0.163	77.255	22.539	0.001	0.042	0.000	0.000	0.000	0.000	0.116	fbmy5635_202305292102.cy9c5_u
0.000	0.134	76.420	23.402	0.002	0.042	0.000	0.000	0.000	0.000	0.094	fbmy5635_jun23_7e40af67.cy9c5_u
l.x
- l.x: create secondary indexes
- Legend for results is here.
- Each entry lists the percentage of responses that fit in that bucket (slower than max time for previous bucket, faster than min time for next bucket).
TODO - determine whether there is data for create index response time
l.i1
- l.i1: continue load after secondary indexes created
- Legend for results is here.
- Each entry lists the percentage of responses that fit in that bucket (slower than max time for previous bucket, faster than min time for next bucket).
Insert response time histogram
256us	1ms	4ms	16ms	64ms	256ms	1s	4s	16s	gt	max	tag
0.000	nonzero	0.051	32.222	67.724	0.003	0.000	0.000	0.000	0.000	0.174	fbmy5635_202203072101.cy9c5_u
0.000	0.000	0.031	11.951	88.014	0.004	0.000	0.000	0.000	0.000	0.204	fbmy5635_202304122154.cy9c5_u
0.000	0.000	0.027	12.414	87.555	0.004	0.000	0.000	0.000	0.000	0.164	fbmy5635_202305292102.cy9c5_u
0.000	0.000	0.030	12.359	87.608	0.003	0.000	0.000	0.000	0.000	0.149	fbmy5635_jun23_7e40af67.cy9c5_u
Delete response time histogram
256us	1ms	4ms	16ms	64ms	256ms	1s	4s	16s	gt	max	tag
0.000	0.001	0.052	37.347	62.597	0.004	0.000	0.000	0.000	0.000	0.238	fbmy5635_202203072101.cy9c5_u
0.000	nonzero	0.032	13.340	86.624	0.004	0.000	0.000	0.000	0.000	0.219	fbmy5635_202304122154.cy9c5_u
0.000	nonzero	0.028	13.986	85.982	0.004	nonzero	0.000	0.000	0.000	0.272	fbmy5635_202305292102.cy9c5_u
0.000	nonzero	0.031	13.923	86.042	0.004	0.000	0.000	0.000	0.000	0.209	fbmy5635_jun23_7e40af67.cy9c5_u
q100.1
- q100.1: range queries with 100 insert/s per client
- Legend for results is here.
- Each entry lists the percentage of responses that fit in that bucket (slower than max time for previous bucket, faster than min time for next bucket).
Query response time histogram
256us	1ms	4ms	16ms	64ms	256ms	1s	4s	16s	gt	max	tag
84.234	15.765	0.001	nonzero	nonzero	0.000	0.000	0.000	0.000	0.000	0.032	fbmy5635_202203072101.cy9c5_u
75.297	24.702	0.001	nonzero	nonzero	0.000	0.000	0.000	0.000	0.000	0.025	fbmy5635_202304122154.cy9c5_u
77.035	22.964	0.001	nonzero	nonzero	nonzero	0.000	0.000	0.000	0.000	0.066	fbmy5635_202305292102.cy9c5_u
76.289	23.710	0.001	nonzero	nonzero	0.000	0.000	0.000	0.000	0.000	0.023	fbmy5635_jun23_7e40af67.cy9c5_u
Insert response time histogram
256us	1ms	4ms	16ms	64ms	256ms	1s	4s	16s	gt	max	tag
0.000	0.000	99.998	0.002	0.000	0.000	0.000	0.000	0.000	0.000	0.009	fbmy5635_202203072101.cy9c5_u
0.000	0.000	99.961	0.039	0.000	0.000	0.000	0.000	0.000	0.000	0.010	fbmy5635_202304122154.cy9c5_u
0.000	0.000	99.577	0.423	nonzero	0.000	0.000	0.000	0.000	0.000	0.026	fbmy5635_202305292102.cy9c5_u
0.000	0.000	97.599	2.401	0.000	0.000	0.000	0.000	0.000	0.000	0.014	fbmy5635_jun23_7e40af67.cy9c5_u
Delete response time histogram
256us	1ms	4ms	16ms	64ms	256ms	1s	4s	16s	gt	max	tag
0.000	0.118	99.874	0.006	0.003	nonzero	0.000	0.000	0.000	0.000	0.069	fbmy5635_202203072101.cy9c5_u
0.000	0.001	99.980	0.017	0.002	0.000	0.000	0.000	0.000	0.000	0.054	fbmy5635_202304122154.cy9c5_u
0.000	0.000	99.776	0.220	0.003	0.001	0.000	0.000	0.000	0.000	0.082	fbmy5635_202305292102.cy9c5_u
0.000	0.000	98.253	1.746	0.001	0.000	0.000	0.000	0.000	0.000	0.019	fbmy5635_jun23_7e40af67.cy9c5_u
q500.1
- q500.1: range queries with 500 insert/s per client
- Legend for results is here.
- Each entry lists the percentage of responses that fit in that bucket (slower than max time for previous bucket, faster than min time for next bucket).
Query response time histogram
256us	1ms	4ms	16ms	64ms	256ms	1s	4s	16s	gt	max	tag
77.153	22.845	0.001	nonzero	nonzero	nonzero	0.000	0.000	0.000	0.000	0.089	fbmy5635_202203072101.cy9c5_u
65.169	34.829	0.002	nonzero	nonzero	nonzero	0.000	0.000	0.000	0.000	0.084	fbmy5635_202304122154.cy9c5_u
65.515	34.482	0.002	nonzero	nonzero	nonzero	0.000	0.000	0.000	0.000	0.083	fbmy5635_202305292102.cy9c5_u
64.584	35.413	0.002	nonzero	nonzero	nonzero	0.000	0.000	0.000	0.000	0.128	fbmy5635_jun23_7e40af67.cy9c5_u
Insert response time histogram
256us	1ms	4ms	16ms	64ms	256ms	1s	4s	16s	gt	max	tag
0.000	nonzero	99.647	0.350	0.002	0.001	0.000	0.000	0.000	0.000	0.085	fbmy5635_202203072101.cy9c5_u
0.000	0.000	25.640	63.948	10.410	0.002	0.000	0.000	0.000	0.000	0.093	fbmy5635_202304122154.cy9c5_u
0.000	0.000	29.927	65.411	4.661	nonzero	0.000	0.000	0.000	0.000	0.095	fbmy5635_202305292102.cy9c5_u
0.000	0.000	19.908	73.823	6.268	0.002	0.000	0.000	0.000	0.000	0.103	fbmy5635_jun23_7e40af67.cy9c5_u
Delete response time histogram
256us	1ms	4ms	16ms	64ms	256ms	1s	4s	16s	gt	max	tag
0.000	0.081	99.679	0.229	0.008	0.002	0.000	0.000	0.000	0.000	0.088	fbmy5635_202203072101.cy9c5_u
0.000	nonzero	27.637	62.984	9.375	0.004	0.000	0.000	0.000	0.000	0.097	fbmy5635_202304122154.cy9c5_u
0.000	0.000	31.497	64.330	4.171	0.002	0.000	0.000	0.000	0.000	0.097	fbmy5635_202305292102.cy9c5_u
0.000	0.000	21.939	72.500	5.558	0.002	0.000	0.000	0.000	0.000	0.108	fbmy5635_jun23_7e40af67.cy9c5_u
q1000.1
- q1000.1: range queries with 1000 insert/s per client
- Legend for results is here.
- Each entry lists the percentage of responses that fit in that bucket (slower than max time for previous bucket, faster than min time for next bucket).
Query response time histogram
256us	1ms	4ms	16ms	64ms	256ms	1s	4s	16s	gt	max	tag
54.251	45.744	0.005	nonzero	nonzero	nonzero	0.000	0.000	0.000	0.000	0.088	fbmy5635_202203072101.cy9c5_u
44.771	55.217	0.012	nonzero	nonzero	nonzero	0.000	0.000	0.000	0.000	0.093	fbmy5635_202304122154.cy9c5_u
45.933	54.055	0.012	nonzero	nonzero	nonzero	0.000	0.000	0.000	0.000	0.097	fbmy5635_202305292102.cy9c5_u
45.460	54.527	0.013	nonzero	nonzero	nonzero	0.000	0.000	0.000	0.000	0.076	fbmy5635_jun23_7e40af67.cy9c5_u
Insert response time histogram
256us	1ms	4ms	16ms	64ms	256ms	1s	4s	16s	gt	max	tag
0.000	0.000	15.395	83.700	0.905	0.001	0.000	0.000	0.000	0.000	0.094	fbmy5635_202203072101.cy9c5_u
0.000	0.000	1.575	8.796	89.625	0.004	0.000	0.000	0.000	0.000	0.106	fbmy5635_202304122154.cy9c5_u
0.000	0.000	2.164	11.358	86.476	0.002	0.000	0.000	0.000	0.000	0.105	fbmy5635_202305292102.cy9c5_u
0.000	0.000	1.713	10.915	87.370	0.002	0.000	0.000	0.000	0.000	0.103	fbmy5635_jun23_7e40af67.cy9c5_u
Delete response time histogram
256us	1ms	4ms	16ms	64ms	256ms	1s	4s	16s	gt	max	tag
0.000	0.002	16.787	82.377	0.832	0.002	0.000	0.000	0.000	0.000	0.101	fbmy5635_202203072101.cy9c5_u
0.000	nonzero	1.592	9.723	88.679	0.005	0.000	0.000	0.000	0.000	0.106	fbmy5635_202304122154.cy9c5_u
0.000	0.000	2.129	12.336	85.532	0.003	0.000	0.000	0.000	0.000	0.115	fbmy5635_202305292102.cy9c5_u
0.000	0.000	1.685	11.872	86.440	0.003	0.000	0.000	0.000	0.000	0.121	fbmy5635_jun23_7e40af67.cy9c5_u