Introduction
This is a report for the insert benchmark with 160M docs and 8 client(s). It is generated by scripts (bash, awk, sed) and Tufte might not be impressed. An overview of the insert benchmark is here and a short update is here. Below, by DBMS, I mean DBMS+version.config. An example is my8020.c10b40 where my means MySQL, 8020 is version 8.0.20 and c10b40 is the name for the configuration file.
The test server is a c2-standard-30 from GCP with 15 cores, hyperthreads disabled, 120G RAM, XFS + SW RAID 0 on 4 NVMe devices (1.5TB). The benchmark was run with 8 client and there were 1 or 3 connections per client (1 for queries or inserts without rate limits, 1+1 for rate limited inserts+deletes). There are 8 tables, client per table. It loads 160M rows without secondary indexes, creates secondary indexes, then inserts 800M rows with a delete per insert to avoid growing the table. It then does 3 read+write tests for 1800s each that do queries as fast as possible with 100, 500 and then 1000 inserts/second/client concurrent with the queries and 1000 deletes/second to avoid growing the table. The database is cached by the OS but not by InnoDB.
The tested DBMS are:
- my5651_rel.cy10a_4g_gcp_c2s30 - InnoDB and MySQL 5.6.51, rel build, cy10a_gcp_c2s30 config, compiled with CMAKE_BUILD_TYPE=Release -O2, base config
- my5740_rel_lto.cy10a_4g_gcp_c2s30 - InnoDB and MySQL 5.7.40, rel_lto build, cy10a_gcp_c2s30 config, compiled with CMAKE_BUILD_TYPE=Release -O2, base config
- my8033_rel_lto.cy10a_4g_gcp_c2s30 - InnoDB and MySQL 8.0.33, rel_lto build, cy10a_gcp_c2s30 config, compiled with CMAKE_BUILD_TYPE=Release -O2, base config
Contents
- Summary
- l.i0: load without secondary indexes
- l.x: create secondary indexes
- l.i1: continue load after secondary indexes created
- q100.1: range queries with 100 insert/s per client
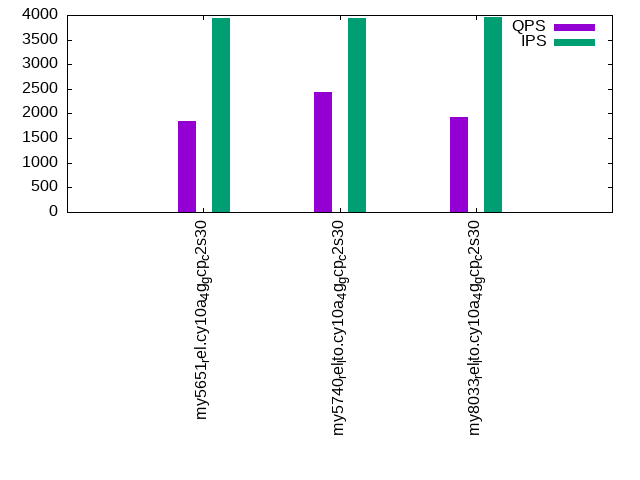
- q500.1: range queries with 500 insert/s per client
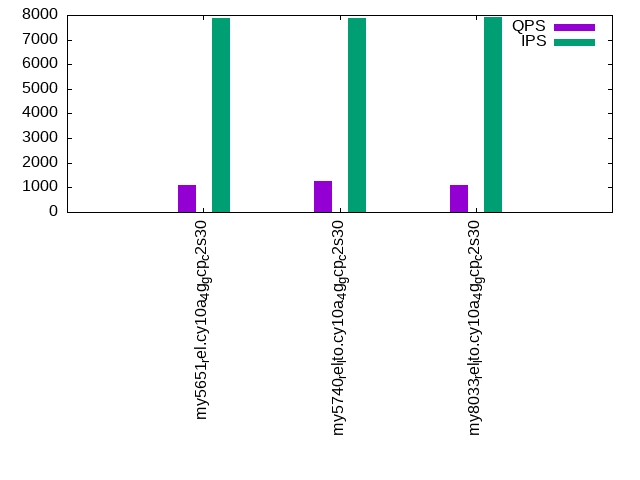
- q1000.1: range queries with 1000 insert/s per client
Summary
The numbers are inserts/s for l.i0 and l.i1, indexed docs (or rows) /s for l.x and queries/s for q*.2. The values are the average rate over the entire test for inserts (IPS) and queries (QPS). The range of values for IPS and QPS is split into 3 parts: bottom 25%, middle 50%, top 25%. Values in the bottom 25% have a red background, values in the top 25% have a green background and values in the middle have no color. A gray background is used for values that can be ignored because the DBMS did not sustain the target insert rate. Red backgrounds are not used when the minimum value is within 80% of the max value.
| dbms | l.i0 | l.x | l.i1 | q100.1 | q500.1 | q1000.1 |
|---|---|---|---|---|---|---|
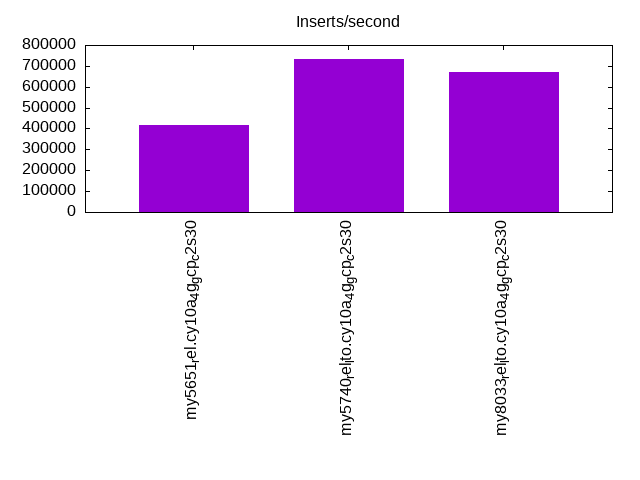
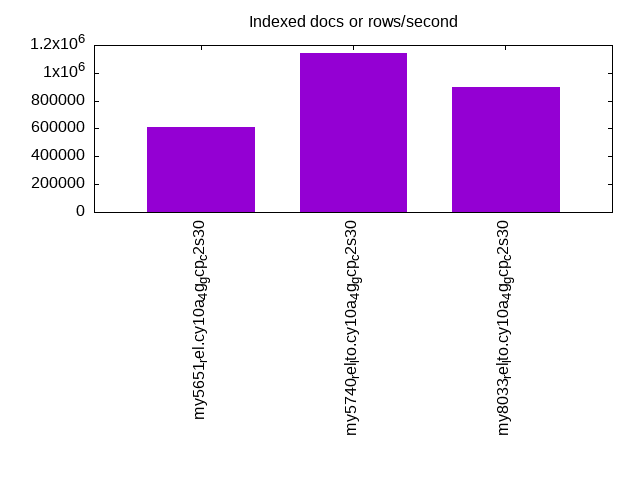
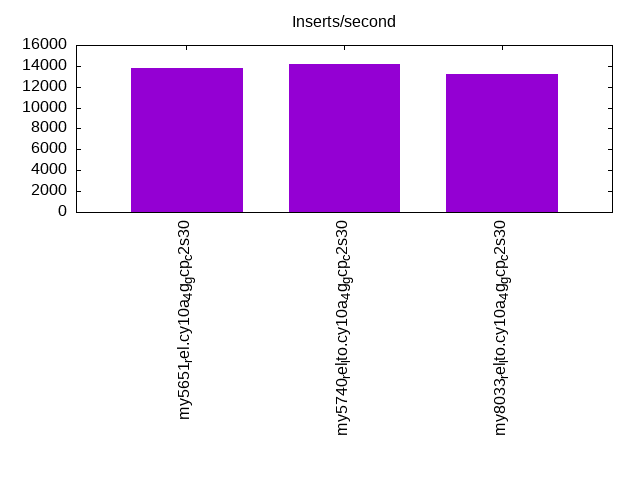
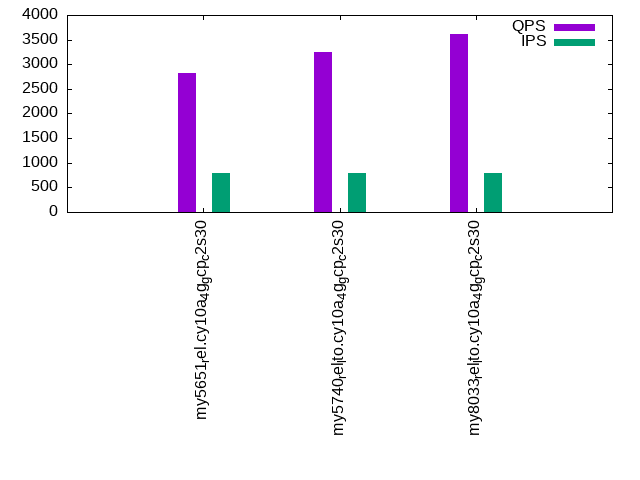
| my5651_rel.cy10a_4g_gcp_c2s30 | 418848 | 611069 | 13772 | 2832 | 1843 | 1110 |
| my5740_rel_lto.cy10a_4g_gcp_c2s30 | 733945 | 1143571 | 14164 | 3257 | 2440 | 1275 |
| my8033_rel_lto.cy10a_4g_gcp_c2s30 | 669456 | 899438 | 13210 | 3611 | 1923 | 1114 |
This table has relative throughput, throughput for the DBMS relative to the DBMS in the first line, using the absolute throughput from the previous table. Values less than 0.95 have a yellow background. Values greater than 1.05 have a blue background.
| dbms | l.i0 | l.x | l.i1 | q100.1 | q500.1 | q1000.1 |
|---|---|---|---|---|---|---|
| my5651_rel.cy10a_4g_gcp_c2s30 | 1.00 | 1.00 | 1.00 | 1.00 | 1.00 | 1.00 |
| my5740_rel_lto.cy10a_4g_gcp_c2s30 | 1.75 | 1.87 | 1.03 | 1.15 | 1.32 | 1.15 |
| my8033_rel_lto.cy10a_4g_gcp_c2s30 | 1.60 | 1.47 | 0.96 | 1.28 | 1.04 | 1.00 |
This lists the average rate of inserts/s for the tests that do inserts concurrent with queries. For such tests the query rate is listed in the table above. The read+write tests are setup so that the insert rate should match the target rate every second. Cells that are not at least 95% of the target have a red background to indicate a failure to satisfy the target.
| dbms | q100.1 | q500.1 | q1000.1 |
|---|---|---|---|
| my5651_rel.cy10a_4g_gcp_c2s30 | 786 | 3945 | 7873 |
| my5740_rel_lto.cy10a_4g_gcp_c2s30 | 786 | 3947 | 7882 |
| my8033_rel_lto.cy10a_4g_gcp_c2s30 | 792 | 3958 | 7912 |
| target | 800 | 4000 | 8000 |
l.i0
l.i0: load without secondary indexes. Graphs for performance per 1-second interval are here.
Average throughput:
Insert response time histogram: each cell has the percentage of responses that take <= the time in the header and max is the max response time in seconds. For the max column values in the top 25% of the range have a red background and in the bottom 25% of the range have a green background. The red background is not used when the min value is within 80% of the max value.
| dbms | 256us | 1ms | 4ms | 16ms | 64ms | 256ms | 1s | 4s | 16s | gt | max |
|---|---|---|---|---|---|---|---|---|---|---|---|
| my5651_rel.cy10a_4g_gcp_c2s30 | 2.848 | 96.727 | 0.245 | 0.166 | 0.014 | 0.198 | |||||
| my5740_rel_lto.cy10a_4g_gcp_c2s30 | 87.532 | 12.210 | 0.219 | 0.025 | 0.014 | 0.001 | 0.267 | ||||
| my8033_rel_lto.cy10a_4g_gcp_c2s30 | 16.435 | 83.325 | 0.199 | 0.026 | 0.014 | 0.221 |
Performance metrics for the DBMS listed above. Some are normalized by throughput, others are not. Legend for results is here.
ips	qps	rps	rmbps	wps	wmbps	rpq	rkbpq	wpi	wkbpi	csps	cpups	cspq	cpupq	dbgb1	dbgb2	rss	maxop	p50	p99	tag
418848	0	3281	12.8	350.9	101.5	0.008	0.031	0.001	0.248	88485	42.4	0.211	15	10.6	139.1	4.3	0.198	53842	43168	160m.my5651_rel.cy10a_4g_gcp_c2s30
733945	0	0	0.0	711.4	178.2	0.000	0.000	0.001	0.249	76140	66.4	0.104	14	10.6	139.1	4.5	0.267	100790	76617	160m.my5740_rel_lto.cy10a_4g_gcp_c2s30
669456	0	0	0.0	1170.7	168.8	0.000	0.000	0.002	0.258	182889	73.2	0.273	16	10.6	139.1	4.7	0.221	90401	70624	160m.my8033_rel_lto.cy10a_4g_gcp_c2s30
l.x
l.x: create secondary indexes.
Average throughput:
Performance metrics for the DBMS listed above. Some are normalized by throughput, others are not. Legend for results is here.
ips	qps	rps	rmbps	wps	wmbps	rpq	rkbpq	wpi	wkbpi	csps	cpups	cspq	cpupq	dbgb1	dbgb2	rss	maxop	p50	p99	tag
611069	0	275	1.1	3193.3	574.8	0.000	0.002	0.005	0.963	27388	39.8	0.045	10	21.7	150.2	4.3	0.002	NA	NA	160m.my5651_rel.cy10a_4g_gcp_c2s30
1143571	0	0	0.0	3637.2	909.1	0.000	0.000	0.003	0.814	40469	32.6	0.035	4	23.6	152.1	4.7	0.031	NA	NA	160m.my5740_rel_lto.cy10a_4g_gcp_c2s30
899438	0	4570	290.8	16317.1	897.1	0.005	0.331	0.018	1.021	102403	68.6	0.114	11	23.5	152.1	4.7	0.008	NA	NA	160m.my8033_rel_lto.cy10a_4g_gcp_c2s30
l.i1
l.i1: continue load after secondary indexes created. Graphs for performance per 1-second interval are here.
Average throughput:
Insert response time histogram: each cell has the percentage of responses that take <= the time in the header and max is the max response time in seconds. For the max column values in the top 25% of the range have a red background and in the bottom 25% of the range have a green background. The red background is not used when the min value is within 80% of the max value.
| dbms | 256us | 1ms | 4ms | 16ms | 64ms | 256ms | 1s | 4s | 16s | gt | max |
|---|---|---|---|---|---|---|---|---|---|---|---|
| my5651_rel.cy10a_4g_gcp_c2s30 | 0.715 | 26.446 | 67.845 | 4.735 | 0.258 | 0.851 | |||||
| my5740_rel_lto.cy10a_4g_gcp_c2s30 | 2.714 | 39.310 | 50.005 | 7.671 | 0.296 | 0.004 | 0.001 | 5.155 | |||
| my8033_rel_lto.cy10a_4g_gcp_c2s30 | 0.392 | 26.000 | 67.618 | 5.665 | 0.324 | 0.604 |
Delete response time histogram: each cell has the percentage of responses that take <= the time in the header and max is the max response time in seconds. For the max column values in the top 25% of the range have a red background and in the bottom 25% of the range have a green background. The red background is not used when the min value is within 80% of the max value.
| dbms | 256us | 1ms | 4ms | 16ms | 64ms | 256ms | 1s | 4s | 16s | gt | max |
|---|---|---|---|---|---|---|---|---|---|---|---|
| my5651_rel.cy10a_4g_gcp_c2s30 | 0.001 | 1.111 | 29.398 | 65.795 | 3.670 | 0.026 | 0.497 | ||||
| my5740_rel_lto.cy10a_4g_gcp_c2s30 | 0.001 | 4.039 | 42.156 | 47.777 | 5.976 | 0.051 | 0.001 | 2.380 | |||
| my8033_rel_lto.cy10a_4g_gcp_c2s30 | 1.351 | 29.736 | 65.027 | 3.806 | 0.080 | 0.602 |
Performance metrics for the DBMS listed above. Some are normalized by throughput, others are not. Legend for results is here.
ips	qps	rps	rmbps	wps	wmbps	rpq	rkbpq	wpi	wkbpi	csps	cpups	cspq	cpupq	dbgb1	dbgb2	rss	maxop	p50	p99	tag
13772	0	462	2.3	14350.1	436.5	0.034	0.173	1.042	32.453	145274	32.9	10.549	358	40.9	175.5	4.3	0.851	1798	200	160m.my5651_rel.cy10a_4g_gcp_c2s30
14164	0	2	0.6	14620.9	449.0	0.000	0.040	1.032	32.462	134009	35.3	9.461	374	41.0	175.8	4.7	5.155	1799	150	160m.my5740_rel_lto.cy10a_4g_gcp_c2s30
13210	0	2	0.6	16018.5	407.2	0.000	0.047	1.213	31.569	247329	45.5	18.723	517	40.9	176.1	4.8	0.604	1648	200	160m.my8033_rel_lto.cy10a_4g_gcp_c2s30
q100.1
q100.1: range queries with 100 insert/s per client. Graphs for performance per 1-second interval are here.
Average throughput:
Query response time histogram: each cell has the percentage of responses that take <= the time in the header and max is the max response time in seconds. For max values in the top 25% of the range have a red background and in the bottom 25% of the range have a green background. The red background is not used when the min value is within 80% of the max value.
| dbms | 256us | 1ms | 4ms | 16ms | 64ms | 256ms | 1s | 4s | 16s | gt | max |
|---|---|---|---|---|---|---|---|---|---|---|---|
| my5651_rel.cy10a_4g_gcp_c2s30 | 26.726 | 23.994 | 27.672 | 19.126 | 2.481 | 0.001 | nonzero | 0.317 | |||
| my5740_rel_lto.cy10a_4g_gcp_c2s30 | 39.352 | 27.653 | 12.333 | 18.035 | 2.622 | 0.005 | nonzero | 0.277 | |||
| my8033_rel_lto.cy10a_4g_gcp_c2s30 | 31.176 | 28.790 | 20.397 | 19.135 | 0.495 | 0.007 | nonzero | 0.336 |
Insert response time histogram: each cell has the percentage of responses that take <= the time in the header and max is the max response time in seconds. For max values in the top 25% of the range have a red background and in the bottom 25% of the range have a green background. The red background is not used when the min value is within 80% of the max value.
| dbms | 256us | 1ms | 4ms | 16ms | 64ms | 256ms | 1s | 4s | 16s | gt | max |
|---|---|---|---|---|---|---|---|---|---|---|---|
| my5651_rel.cy10a_4g_gcp_c2s30 | 39.111 | 56.149 | 4.701 | 0.038 | 0.208 | ||||||
| my5740_rel_lto.cy10a_4g_gcp_c2s30 | 29.906 | 52.667 | 17.378 | 0.049 | 0.139 | ||||||
| my8033_rel_lto.cy10a_4g_gcp_c2s30 | 25.420 | 59.705 | 14.354 | 0.479 | 0.042 | 0.512 |
Delete response time histogram: each cell has the percentage of responses that take <= the time in the header and max is the max response time in seconds. For max values in the top 25% of the range have a red background and in the bottom 25% of the range have a green background. The red background is not used when the min value is within 80% of the max value.
| dbms | 256us | 1ms | 4ms | 16ms | 64ms | 256ms | 1s | 4s | 16s | gt | max |
|---|---|---|---|---|---|---|---|---|---|---|---|
| my5651_rel.cy10a_4g_gcp_c2s30 | 39.083 | 56.413 | 4.479 | 0.024 | 0.139 | ||||||
| my5740_rel_lto.cy10a_4g_gcp_c2s30 | 31.344 | 52.212 | 16.399 | 0.045 | 0.186 | ||||||
| my8033_rel_lto.cy10a_4g_gcp_c2s30 | 27.920 | 58.257 | 13.323 | 0.469 | 0.031 | 0.503 |
Performance metrics for the DBMS listed above. Some are normalized by throughput, others are not. Legend for results is here.
ips	qps	rps	rmbps	wps	wmbps	rpq	rkbpq	wpi	wkbpi	csps	cpups	cspq	cpupq	dbgb1	dbgb2	rss	maxop	p50	p99	tag
786	2832	34	0.3	14064.3	313.1	0.012	0.116	17.893	407.896	137276	22.3	48.473	1181	40.9	175.5	4.3	0.317	368	176	160m.my5651_rel.cy10a_4g_gcp_c2s30
786	3257	9	0.3	17696.8	421.7	0.003	0.101	22.504	549.108	116510	15.4	35.771	709	41.0	175.8	4.6	0.277	432	96	160m.my5740_rel_lto.cy10a_4g_gcp_c2s30
792	3611	10	0.6	17863.1	355.7	0.003	0.171	22.554	459.842	289302	20.3	80.121	843	40.9	176.1	4.8	0.336	463	144	160m.my8033_rel_lto.cy10a_4g_gcp_c2s30
q500.1
q500.1: range queries with 500 insert/s per client. Graphs for performance per 1-second interval are here.
Average throughput:
Query response time histogram: each cell has the percentage of responses that take <= the time in the header and max is the max response time in seconds. For max values in the top 25% of the range have a red background and in the bottom 25% of the range have a green background. The red background is not used when the min value is within 80% of the max value.
| dbms | 256us | 1ms | 4ms | 16ms | 64ms | 256ms | 1s | 4s | 16s | gt | max |
|---|---|---|---|---|---|---|---|---|---|---|---|
| my5651_rel.cy10a_4g_gcp_c2s30 | 24.294 | 22.500 | 20.278 | 26.500 | 6.416 | 0.012 | 0.230 | ||||
| my5740_rel_lto.cy10a_4g_gcp_c2s30 | 27.612 | 30.580 | 14.390 | 23.324 | 4.076 | 0.017 | 0.143 | ||||
| my8033_rel_lto.cy10a_4g_gcp_c2s30 | 20.320 | 21.998 | 21.545 | 32.460 | 3.650 | 0.027 | nonzero | 0.269 |
Insert response time histogram: each cell has the percentage of responses that take <= the time in the header and max is the max response time in seconds. For max values in the top 25% of the range have a red background and in the bottom 25% of the range have a green background. The red background is not used when the min value is within 80% of the max value.
| dbms | 256us | 1ms | 4ms | 16ms | 64ms | 256ms | 1s | 4s | 16s | gt | max |
|---|---|---|---|---|---|---|---|---|---|---|---|
| my5651_rel.cy10a_4g_gcp_c2s30 | 41.391 | 51.173 | 7.435 | 0.001 | 0.069 | ||||||
| my5740_rel_lto.cy10a_4g_gcp_c2s30 | 26.009 | 54.800 | 19.129 | 0.062 | 0.140 | ||||||
| my8033_rel_lto.cy10a_4g_gcp_c2s30 | 18.766 | 60.810 | 19.310 | 1.113 | 0.002 | 0.313 |
Delete response time histogram: each cell has the percentage of responses that take <= the time in the header and max is the max response time in seconds. For max values in the top 25% of the range have a red background and in the bottom 25% of the range have a green background. The red background is not used when the min value is within 80% of the max value.
| dbms | 256us | 1ms | 4ms | 16ms | 64ms | 256ms | 1s | 4s | 16s | gt | max |
|---|---|---|---|---|---|---|---|---|---|---|---|
| my5651_rel.cy10a_4g_gcp_c2s30 | 41.169 | 51.357 | 7.474 | 0.062 | |||||||
| my5740_rel_lto.cy10a_4g_gcp_c2s30 | 27.228 | 54.202 | 18.522 | 0.047 | 0.139 | ||||||
| my8033_rel_lto.cy10a_4g_gcp_c2s30 | 21.268 | 59.024 | 18.654 | 1.053 | 0.249 |
Performance metrics for the DBMS listed above. Some are normalized by throughput, others are not. Legend for results is here.
ips	qps	rps	rmbps	wps	wmbps	rpq	rkbpq	wpi	wkbpi	csps	cpups	cspq	cpupq	dbgb1	dbgb2	rss	maxop	p50	p99	tag
3945	1843	152	1.0	15443.0	354.0	0.082	0.575	3.914	91.876	130537	16.4	70.832	1335	40.9	175.5	4.3	0.230	224	176	160m.my5651_rel.cy10a_4g_gcp_c2s30
3947	2440	55	1.2	17272.1	427.1	0.022	0.487	4.376	110.807	116510	17.5	47.760	1076	41.0	175.8	4.6	0.143	304	256	160m.my5740_rel_lto.cy10a_4g_gcp_c2s30
3958	1923	36	0.8	16941.2	352.0	0.019	0.414	4.280	91.068	291054	21.2	151.346	1654	40.9	176.4	4.8	0.269	240	192	160m.my8033_rel_lto.cy10a_4g_gcp_c2s30
q1000.1
q1000.1: range queries with 1000 insert/s per client. Graphs for performance per 1-second interval are here.
Average throughput:
Query response time histogram: each cell has the percentage of responses that take <= the time in the header and max is the max response time in seconds. For max values in the top 25% of the range have a red background and in the bottom 25% of the range have a green background. The red background is not used when the min value is within 80% of the max value.
| dbms | 256us | 1ms | 4ms | 16ms | 64ms | 256ms | 1s | 4s | 16s | gt | max |
|---|---|---|---|---|---|---|---|---|---|---|---|
| my5651_rel.cy10a_4g_gcp_c2s30 | 14.748 | 19.630 | 18.151 | 32.812 | 14.562 | 0.097 | nonzero | 0.298 | |||
| my5740_rel_lto.cy10a_4g_gcp_c2s30 | 14.646 | 27.691 | 17.890 | 28.298 | 11.128 | 0.344 | 0.002 | 0.488 | |||
| my8033_rel_lto.cy10a_4g_gcp_c2s30 | 8.938 | 15.295 | 25.136 | 39.753 | 10.428 | 0.445 | 0.005 | 0.522 |
Insert response time histogram: each cell has the percentage of responses that take <= the time in the header and max is the max response time in seconds. For max values in the top 25% of the range have a red background and in the bottom 25% of the range have a green background. The red background is not used when the min value is within 80% of the max value.
| dbms | 256us | 1ms | 4ms | 16ms | 64ms | 256ms | 1s | 4s | 16s | gt | max |
|---|---|---|---|---|---|---|---|---|---|---|---|
| my5651_rel.cy10a_4g_gcp_c2s30 | 15.686 | 46.825 | 36.940 | 0.540 | 0.009 | 0.523 | |||||
| my5740_rel_lto.cy10a_4g_gcp_c2s30 | 9.113 | 37.388 | 49.982 | 3.453 | 0.064 | 0.551 | |||||
| my8033_rel_lto.cy10a_4g_gcp_c2s30 | 5.766 | 48.223 | 40.678 | 5.205 | 0.128 | 0.743 |
Delete response time histogram: each cell has the percentage of responses that take <= the time in the header and max is the max response time in seconds. For max values in the top 25% of the range have a red background and in the bottom 25% of the range have a green background. The red background is not used when the min value is within 80% of the max value.
| dbms | 256us | 1ms | 4ms | 16ms | 64ms | 256ms | 1s | 4s | 16s | gt | max |
|---|---|---|---|---|---|---|---|---|---|---|---|
| my5651_rel.cy10a_4g_gcp_c2s30 | 15.889 | 47.038 | 36.635 | 0.431 | 0.007 | 0.480 | |||||
| my5740_rel_lto.cy10a_4g_gcp_c2s30 | 9.784 | 38.263 | 49.109 | 2.807 | 0.037 | 0.763 | |||||
| my8033_rel_lto.cy10a_4g_gcp_c2s30 | 7.074 | 48.561 | 39.712 | 4.575 | 0.077 | 0.570 |
Performance metrics for the DBMS listed above. Some are normalized by throughput, others are not. Legend for results is here.
ips	qps	rps	rmbps	wps	wmbps	rpq	rkbpq	wpi	wkbpi	csps	cpups	cspq	cpupq	dbgb1	dbgb2	rss	maxop	p50	p99	tag
7873	1110	316	2.0	15942.5	402.2	0.285	1.843	2.025	52.305	129423	21.7	116.587	2932	41.4	176.6	4.3	0.298	144	64	160m.my5651_rel.cy10a_4g_gcp_c2s30
7882	1275	77	1.5	16619.1	437.2	0.060	1.227	2.109	56.806	129851	24.2	101.812	2846	41.3	176.4	4.6	0.488	160	96	160m.my5740_rel_lto.cy10a_4g_gcp_c2s30
7912	1114	71	1.4	20160.9	430.7	0.064	1.259	2.548	55.741	291820	32.4	262.075	4365	41.5	178.0	4.8	0.522	128	64	160m.my8033_rel_lto.cy10a_4g_gcp_c2s30
l.i0
l.i0: load without secondary indexes
Performance metrics for all DBMS, not just the ones listed above. Some are normalized by throughput, others are not. Legend for results is here.
ips	qps	rps	rmbps	wps	wmbps	rpq	rkbpq	wpi	wkbpi	csps	cpups	cspq	cpupq	dbgb1	dbgb2	rss	maxop	p50	p99	tag
418848	0	3281	12.8	350.9	101.5	0.008	0.031	0.001	0.248	88485	42.4	0.211	15	10.6	139.1	4.3	0.198	53842	43168	160m.my5651_rel.cy10a_4g_gcp_c2s30
733945	0	0	0.0	711.4	178.2	0.000	0.000	0.001	0.249	76140	66.4	0.104	14	10.6	139.1	4.5	0.267	100790	76617	160m.my5740_rel_lto.cy10a_4g_gcp_c2s30
669456	0	0	0.0	1170.7	168.8	0.000	0.000	0.002	0.258	182889	73.2	0.273	16	10.6	139.1	4.7	0.221	90401	70624	160m.my8033_rel_lto.cy10a_4g_gcp_c2s30
l.x
l.x: create secondary indexes
Performance metrics for all DBMS, not just the ones listed above. Some are normalized by throughput, others are not. Legend for results is here.
ips	qps	rps	rmbps	wps	wmbps	rpq	rkbpq	wpi	wkbpi	csps	cpups	cspq	cpupq	dbgb1	dbgb2	rss	maxop	p50	p99	tag
611069	0	275	1.1	3193.3	574.8	0.000	0.002	0.005	0.963	27388	39.8	0.045	10	21.7	150.2	4.3	0.002	NA	NA	160m.my5651_rel.cy10a_4g_gcp_c2s30
1143571	0	0	0.0	3637.2	909.1	0.000	0.000	0.003	0.814	40469	32.6	0.035	4	23.6	152.1	4.7	0.031	NA	NA	160m.my5740_rel_lto.cy10a_4g_gcp_c2s30
899438	0	4570	290.8	16317.1	897.1	0.005	0.331	0.018	1.021	102403	68.6	0.114	11	23.5	152.1	4.7	0.008	NA	NA	160m.my8033_rel_lto.cy10a_4g_gcp_c2s30
l.i1
l.i1: continue load after secondary indexes created
Performance metrics for all DBMS, not just the ones listed above. Some are normalized by throughput, others are not. Legend for results is here.
ips	qps	rps	rmbps	wps	wmbps	rpq	rkbpq	wpi	wkbpi	csps	cpups	cspq	cpupq	dbgb1	dbgb2	rss	maxop	p50	p99	tag
13772	0	462	2.3	14350.1	436.5	0.034	0.173	1.042	32.453	145274	32.9	10.549	358	40.9	175.5	4.3	0.851	1798	200	160m.my5651_rel.cy10a_4g_gcp_c2s30
14164	0	2	0.6	14620.9	449.0	0.000	0.040	1.032	32.462	134009	35.3	9.461	374	41.0	175.8	4.7	5.155	1799	150	160m.my5740_rel_lto.cy10a_4g_gcp_c2s30
13210	0	2	0.6	16018.5	407.2	0.000	0.047	1.213	31.569	247329	45.5	18.723	517	40.9	176.1	4.8	0.604	1648	200	160m.my8033_rel_lto.cy10a_4g_gcp_c2s30
q100.1
q100.1: range queries with 100 insert/s per client
Performance metrics for all DBMS, not just the ones listed above. Some are normalized by throughput, others are not. Legend for results is here.
ips	qps	rps	rmbps	wps	wmbps	rpq	rkbpq	wpi	wkbpi	csps	cpups	cspq	cpupq	dbgb1	dbgb2	rss	maxop	p50	p99	tag
786	2832	34	0.3	14064.3	313.1	0.012	0.116	17.893	407.896	137276	22.3	48.473	1181	40.9	175.5	4.3	0.317	368	176	160m.my5651_rel.cy10a_4g_gcp_c2s30
786	3257	9	0.3	17696.8	421.7	0.003	0.101	22.504	549.108	116510	15.4	35.771	709	41.0	175.8	4.6	0.277	432	96	160m.my5740_rel_lto.cy10a_4g_gcp_c2s30
792	3611	10	0.6	17863.1	355.7	0.003	0.171	22.554	459.842	289302	20.3	80.121	843	40.9	176.1	4.8	0.336	463	144	160m.my8033_rel_lto.cy10a_4g_gcp_c2s30
q500.1
q500.1: range queries with 500 insert/s per client
Performance metrics for all DBMS, not just the ones listed above. Some are normalized by throughput, others are not. Legend for results is here.
ips	qps	rps	rmbps	wps	wmbps	rpq	rkbpq	wpi	wkbpi	csps	cpups	cspq	cpupq	dbgb1	dbgb2	rss	maxop	p50	p99	tag
3945	1843	152	1.0	15443.0	354.0	0.082	0.575	3.914	91.876	130537	16.4	70.832	1335	40.9	175.5	4.3	0.230	224	176	160m.my5651_rel.cy10a_4g_gcp_c2s30
3947	2440	55	1.2	17272.1	427.1	0.022	0.487	4.376	110.807	116510	17.5	47.760	1076	41.0	175.8	4.6	0.143	304	256	160m.my5740_rel_lto.cy10a_4g_gcp_c2s30
3958	1923	36	0.8	16941.2	352.0	0.019	0.414	4.280	91.068	291054	21.2	151.346	1654	40.9	176.4	4.8	0.269	240	192	160m.my8033_rel_lto.cy10a_4g_gcp_c2s30
q1000.1
q1000.1: range queries with 1000 insert/s per client
Performance metrics for all DBMS, not just the ones listed above. Some are normalized by throughput, others are not. Legend for results is here.
ips	qps	rps	rmbps	wps	wmbps	rpq	rkbpq	wpi	wkbpi	csps	cpups	cspq	cpupq	dbgb1	dbgb2	rss	maxop	p50	p99	tag
7873	1110	316	2.0	15942.5	402.2	0.285	1.843	2.025	52.305	129423	21.7	116.587	2932	41.4	176.6	4.3	0.298	144	64	160m.my5651_rel.cy10a_4g_gcp_c2s30
7882	1275	77	1.5	16619.1	437.2	0.060	1.227	2.109	56.806	129851	24.2	101.812	2846	41.3	176.4	4.6	0.488	160	96	160m.my5740_rel_lto.cy10a_4g_gcp_c2s30
7912	1114	71	1.4	20160.9	430.7	0.064	1.259	2.548	55.741	291820	32.4	262.075	4365	41.5	178.0	4.8	0.522	128	64	160m.my8033_rel_lto.cy10a_4g_gcp_c2s30
l.i0
- l.i0: load without secondary indexes
- Legend for results is here.
- Each entry lists the percentage of responses that fit in that bucket (slower than max time for previous bucket, faster than min time for next bucket).
Insert response time histogram
256us	1ms	4ms	16ms	64ms	256ms	1s	4s	16s	gt	max	tag
0.000	2.848	96.727	0.245	0.166	0.014	0.000	0.000	0.000	0.000	0.198	my5651_rel.cy10a_4g_gcp_c2s30
0.000	87.532	12.210	0.219	0.025	0.014	0.001	0.000	0.000	0.000	0.267	my5740_rel_lto.cy10a_4g_gcp_c2s30
0.000	16.435	83.325	0.199	0.026	0.014	0.000	0.000	0.000	0.000	0.221	my8033_rel_lto.cy10a_4g_gcp_c2s30
l.x
- l.x: create secondary indexes
- Legend for results is here.
- Each entry lists the percentage of responses that fit in that bucket (slower than max time for previous bucket, faster than min time for next bucket).
TODO - determine whether there is data for create index response time
l.i1
- l.i1: continue load after secondary indexes created
- Legend for results is here.
- Each entry lists the percentage of responses that fit in that bucket (slower than max time for previous bucket, faster than min time for next bucket).
Insert response time histogram
256us	1ms	4ms	16ms	64ms	256ms	1s	4s	16s	gt	max	tag
0.000	0.000	0.715	26.446	67.845	4.735	0.258	0.000	0.000	0.000	0.851	my5651_rel.cy10a_4g_gcp_c2s30
0.000	0.000	2.714	39.310	50.005	7.671	0.296	0.004	0.001	0.000	5.155	my5740_rel_lto.cy10a_4g_gcp_c2s30
0.000	0.000	0.392	26.000	67.618	5.665	0.324	0.000	0.000	0.000	0.604	my8033_rel_lto.cy10a_4g_gcp_c2s30
Delete response time histogram
256us	1ms	4ms	16ms	64ms	256ms	1s	4s	16s	gt	max	tag
0.000	0.001	1.111	29.398	65.795	3.670	0.026	0.000	0.000	0.000	0.497	my5651_rel.cy10a_4g_gcp_c2s30
0.000	0.001	4.039	42.156	47.777	5.976	0.051	0.001	0.000	0.000	2.380	my5740_rel_lto.cy10a_4g_gcp_c2s30
0.000	0.000	1.351	29.736	65.027	3.806	0.080	0.000	0.000	0.000	0.602	my8033_rel_lto.cy10a_4g_gcp_c2s30
q100.1
- q100.1: range queries with 100 insert/s per client
- Legend for results is here.
- Each entry lists the percentage of responses that fit in that bucket (slower than max time for previous bucket, faster than min time for next bucket).
Query response time histogram
256us	1ms	4ms	16ms	64ms	256ms	1s	4s	16s	gt	max	tag
26.726	23.994	27.672	19.126	2.481	0.001	nonzero	0.000	0.000	0.000	0.317	my5651_rel.cy10a_4g_gcp_c2s30
39.352	27.653	12.333	18.035	2.622	0.005	nonzero	0.000	0.000	0.000	0.277	my5740_rel_lto.cy10a_4g_gcp_c2s30
31.176	28.790	20.397	19.135	0.495	0.007	nonzero	0.000	0.000	0.000	0.336	my8033_rel_lto.cy10a_4g_gcp_c2s30
Insert response time histogram
256us	1ms	4ms	16ms	64ms	256ms	1s	4s	16s	gt	max	tag
0.000	0.000	39.111	56.149	4.701	0.038	0.000	0.000	0.000	0.000	0.208	my5651_rel.cy10a_4g_gcp_c2s30
0.000	0.000	29.906	52.667	17.378	0.049	0.000	0.000	0.000	0.000	0.139	my5740_rel_lto.cy10a_4g_gcp_c2s30
0.000	0.000	25.420	59.705	14.354	0.479	0.042	0.000	0.000	0.000	0.512	my8033_rel_lto.cy10a_4g_gcp_c2s30
Delete response time histogram
256us	1ms	4ms	16ms	64ms	256ms	1s	4s	16s	gt	max	tag
0.000	0.000	39.083	56.413	4.479	0.024	0.000	0.000	0.000	0.000	0.139	my5651_rel.cy10a_4g_gcp_c2s30
0.000	0.000	31.344	52.212	16.399	0.045	0.000	0.000	0.000	0.000	0.186	my5740_rel_lto.cy10a_4g_gcp_c2s30
0.000	0.000	27.920	58.257	13.323	0.469	0.031	0.000	0.000	0.000	0.503	my8033_rel_lto.cy10a_4g_gcp_c2s30
q500.1
- q500.1: range queries with 500 insert/s per client
- Legend for results is here.
- Each entry lists the percentage of responses that fit in that bucket (slower than max time for previous bucket, faster than min time for next bucket).
Query response time histogram
256us	1ms	4ms	16ms	64ms	256ms	1s	4s	16s	gt	max	tag
24.294	22.500	20.278	26.500	6.416	0.012	0.000	0.000	0.000	0.000	0.230	my5651_rel.cy10a_4g_gcp_c2s30
27.612	30.580	14.390	23.324	4.076	0.017	0.000	0.000	0.000	0.000	0.143	my5740_rel_lto.cy10a_4g_gcp_c2s30
20.320	21.998	21.545	32.460	3.650	0.027	nonzero	0.000	0.000	0.000	0.269	my8033_rel_lto.cy10a_4g_gcp_c2s30
Insert response time histogram
256us	1ms	4ms	16ms	64ms	256ms	1s	4s	16s	gt	max	tag
0.000	0.000	41.391	51.173	7.435	0.001	0.000	0.000	0.000	0.000	0.069	my5651_rel.cy10a_4g_gcp_c2s30
0.000	0.000	26.009	54.800	19.129	0.062	0.000	0.000	0.000	0.000	0.140	my5740_rel_lto.cy10a_4g_gcp_c2s30
0.000	0.000	18.766	60.810	19.310	1.113	0.002	0.000	0.000	0.000	0.313	my8033_rel_lto.cy10a_4g_gcp_c2s30
Delete response time histogram
256us	1ms	4ms	16ms	64ms	256ms	1s	4s	16s	gt	max	tag
0.000	0.000	41.169	51.357	7.474	0.000	0.000	0.000	0.000	0.000	0.062	my5651_rel.cy10a_4g_gcp_c2s30
0.000	0.000	27.228	54.202	18.522	0.047	0.000	0.000	0.000	0.000	0.139	my5740_rel_lto.cy10a_4g_gcp_c2s30
0.000	0.000	21.268	59.024	18.654	1.053	0.000	0.000	0.000	0.000	0.249	my8033_rel_lto.cy10a_4g_gcp_c2s30
q1000.1
- q1000.1: range queries with 1000 insert/s per client
- Legend for results is here.
- Each entry lists the percentage of responses that fit in that bucket (slower than max time for previous bucket, faster than min time for next bucket).
Query response time histogram
256us	1ms	4ms	16ms	64ms	256ms	1s	4s	16s	gt	max	tag
14.748	19.630	18.151	32.812	14.562	0.097	nonzero	0.000	0.000	0.000	0.298	my5651_rel.cy10a_4g_gcp_c2s30
14.646	27.691	17.890	28.298	11.128	0.344	0.002	0.000	0.000	0.000	0.488	my5740_rel_lto.cy10a_4g_gcp_c2s30
8.938	15.295	25.136	39.753	10.428	0.445	0.005	0.000	0.000	0.000	0.522	my8033_rel_lto.cy10a_4g_gcp_c2s30
Insert response time histogram
256us	1ms	4ms	16ms	64ms	256ms	1s	4s	16s	gt	max	tag
0.000	0.000	15.686	46.825	36.940	0.540	0.009	0.000	0.000	0.000	0.523	my5651_rel.cy10a_4g_gcp_c2s30
0.000	0.000	9.113	37.388	49.982	3.453	0.064	0.000	0.000	0.000	0.551	my5740_rel_lto.cy10a_4g_gcp_c2s30
0.000	0.000	5.766	48.223	40.678	5.205	0.128	0.000	0.000	0.000	0.743	my8033_rel_lto.cy10a_4g_gcp_c2s30
Delete response time histogram
256us	1ms	4ms	16ms	64ms	256ms	1s	4s	16s	gt	max	tag
0.000	0.000	15.889	47.038	36.635	0.431	0.007	0.000	0.000	0.000	0.480	my5651_rel.cy10a_4g_gcp_c2s30
0.000	0.000	9.784	38.263	49.109	2.807	0.037	0.000	0.000	0.000	0.763	my5740_rel_lto.cy10a_4g_gcp_c2s30
0.000	0.000	7.074	48.561	39.712	4.575	0.077	0.000	0.000	0.000	0.570	my8033_rel_lto.cy10a_4g_gcp_c2s30