Introduction
This is a report for the insert benchmark with 4000M docs and 8 client(s). It is generated by scripts (bash, awk, sed) and Tufte might not be impressed. An overview of the insert benchmark is here and a short update is here. Below, by DBMS, I mean DBMS+version.config. An example is my8020.c10b40 where my means MySQL, 8020 is version 8.0.20 and c10b40 is the name for the configuration file.
The test server is a c2-standard-30 from GCP with 15 cores, hyperthreads disabled, 120G RAM, XFS + SW RAID 0 on 4 NVMe devices (1.5TB). The benchmark was run with 8 client and there were 1 or 3 connections per client (1 for queries or inserts without rate limits, 1+1 for rate limited inserts+deletes). There are 8 tables, client per table. It loads 4000M rows without secondary indexes, creates secondary indexes, then inserts 80M rows with a delete per insert to avoid growing the table. It then does 3 read+write tests for 1800s each that do queries as fast as possible with 100, 500 and then 1000 inserts/second/client concurrent with the queries and 1000 deletes/second to avoid growing the table. The database is larger than memory.
The tested DBMS are:
- my5740_rel_lto.cy10a_gcp_c2s30 - InnoDB and MySQL 5.7.40, rel_lto build, cy10a_gcp_c2s30 config, compiled with CMAKE_BUILD_TYPE=Release -O2, base config
- my5740_rel_lto.cy10a1_gcp_c2s30 - InnoDB and MySQL 5.7.40, rel_lto build, cy10a_gcp_c2s30 config, compiled with CMAKE_BUILD_TYPE=Release -O2, adds innodb_use_native_aio=off
- my5740_rel_lto.cy10a2_gcp_c2s30 - InnoDB and MySQL 5.7.40, rel_lto build, cy10a_gcp_c2s30 config, compiled with CMAKE_BUILD_TYPE=Release -O2, adds innodb_io_capacity=20k, innodb_io_capacity_max=40k
- my5740_rel_lto.cy10a3_gcp_c2s30 - InnoDB and MySQL 5.7.40, rel_lto build, cy10a_gcp_c2s30 config, compiled with CMAKE_BUILD_TYPE=Release -O2, adds innodb_io_capacity=20k, innodb_io_capacity_max=40k, innodb_flush_sync=OFF
- my5740_rel_lto.cy10a4_gcp_c2s30 - InnoDB and MySQL 5.7.40, rel_lto build, cy10a_gcp_c2s30 config, compiled with CMAKE_BUILD_TYPE=Release -O2, adds innodb_flush_method=fsync
Contents
- Summary
- l.i0: load without secondary indexes
- l.x: create secondary indexes
- l.i1: continue load after secondary indexes created
- q100.1: range queries with 100 insert/s per client
- q500.1: range queries with 500 insert/s per client
- q1000.1: range queries with 1000 insert/s per client
Summary
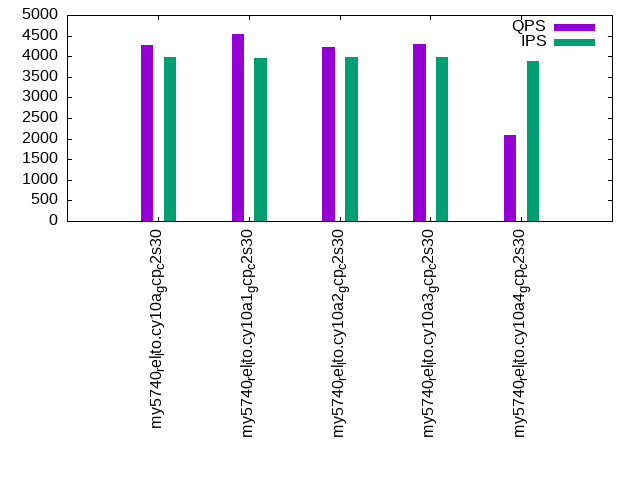
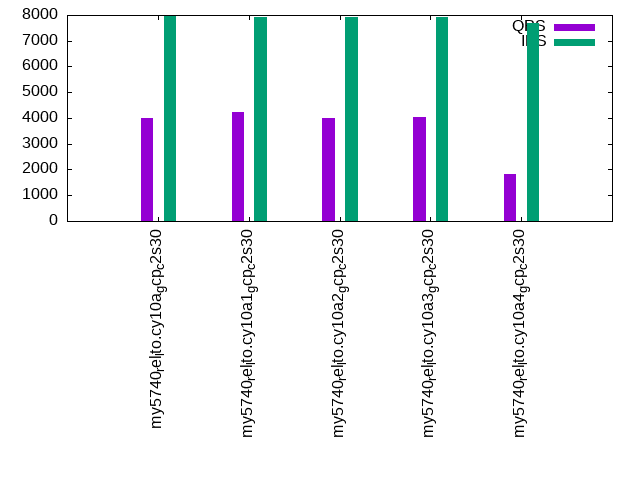
The numbers are inserts/s for l.i0 and l.i1, indexed docs (or rows) /s for l.x and queries/s for q*.2. The values are the average rate over the entire test for inserts (IPS) and queries (QPS). The range of values for IPS and QPS is split into 3 parts: bottom 25%, middle 50%, top 25%. Values in the bottom 25% have a red background, values in the top 25% have a green background and values in the middle have no color. A gray background is used for values that can be ignored because the DBMS did not sustain the target insert rate. Red backgrounds are not used when the minimum value is within 80% of the max value.
| dbms | l.i0 | l.x | l.i1 | q100.1 | q500.1 | q1000.1 |
|---|---|---|---|---|---|---|
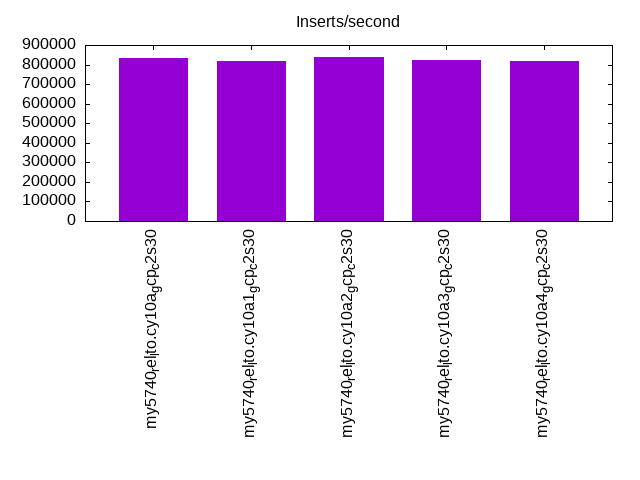
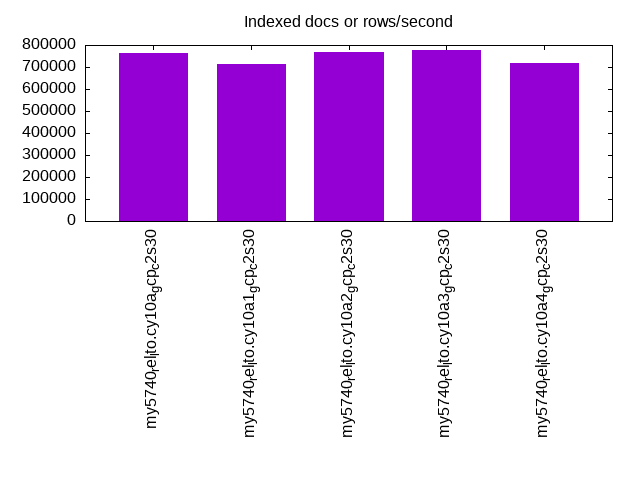
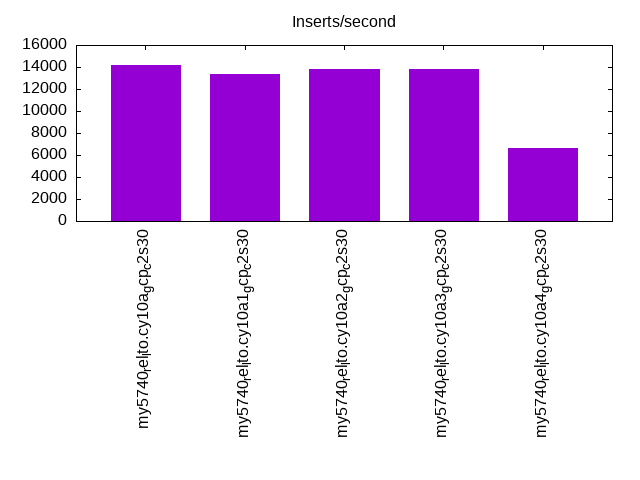
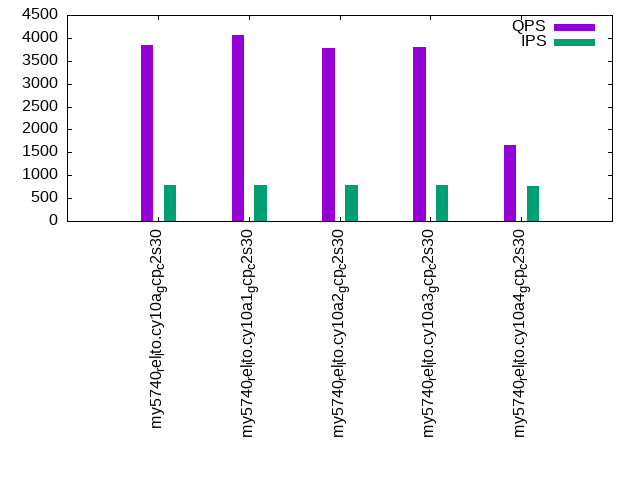
| my5740_rel_lto.cy10a_gcp_c2s30 | 833854 | 764253 | 14167 | 3835 | 4268 | 4019 |
| my5740_rel_lto.cy10a1_gcp_c2s30 | 820681 | 713284 | 13364 | 4074 | 4544 | 4228 |
| my5740_rel_lto.cy10a2_gcp_c2s30 | 839454 | 769398 | 13798 | 3787 | 4216 | 4006 |
| my5740_rel_lto.cy10a3_gcp_c2s30 | 822199 | 776417 | 13836 | 3811 | 4294 | 4035 |
| my5740_rel_lto.cy10a4_gcp_c2s30 | 816326 | 719701 | 6612 | 1663 | 2097 | 1834 |
This table has relative throughput, throughput for the DBMS relative to the DBMS in the first line, using the absolute throughput from the previous table. Values less than 0.95 have a yellow background. Values greater than 1.05 have a blue background.
| dbms | l.i0 | l.x | l.i1 | q100.1 | q500.1 | q1000.1 |
|---|---|---|---|---|---|---|
| my5740_rel_lto.cy10a_gcp_c2s30 | 1.00 | 1.00 | 1.00 | 1.00 | 1.00 | 1.00 |
| my5740_rel_lto.cy10a1_gcp_c2s30 | 0.98 | 0.93 | 0.94 | 1.06 | 1.06 | 1.05 |
| my5740_rel_lto.cy10a2_gcp_c2s30 | 1.01 | 1.01 | 0.97 | 0.99 | 0.99 | 1.00 |
| my5740_rel_lto.cy10a3_gcp_c2s30 | 0.99 | 1.02 | 0.98 | 0.99 | 1.01 | 1.00 |
| my5740_rel_lto.cy10a4_gcp_c2s30 | 0.98 | 0.94 | 0.47 | 0.43 | 0.49 | 0.46 |
This lists the average rate of inserts/s for the tests that do inserts concurrent with queries. For such tests the query rate is listed in the table above. The read+write tests are setup so that the insert rate should match the target rate every second. Cells that are not at least 95% of the target have a red background to indicate a failure to satisfy the target.
| dbms | q100.1 | q500.1 | q1000.1 |
|---|---|---|---|
| my5740_rel_lto.cy10a_gcp_c2s30 | 789 | 3969 | 7943 |
| my5740_rel_lto.cy10a1_gcp_c2s30 | 789 | 3956 | 7916 |
| my5740_rel_lto.cy10a2_gcp_c2s30 | 789 | 3969 | 7938 |
| my5740_rel_lto.cy10a3_gcp_c2s30 | 789 | 3969 | 7938 |
| my5740_rel_lto.cy10a4_gcp_c2s30 | 754 | 3875 | 7705 |
| target | 800 | 4000 | 8000 |
l.i0
l.i0: load without secondary indexes. Graphs for performance per 1-second interval are here.
Average throughput:
Insert response time histogram: each cell has the percentage of responses that take <= the time in the header and max is the max response time in seconds. For the max column values in the top 25% of the range have a red background and in the bottom 25% of the range have a green background. The red background is not used when the min value is within 80% of the max value.
| dbms | 256us | 1ms | 4ms | 16ms | 64ms | 256ms | 1s | 4s | 16s | gt | max |
|---|---|---|---|---|---|---|---|---|---|---|---|
| my5740_rel_lto.cy10a_gcp_c2s30 | 94.985 | 4.937 | 0.046 | 0.016 | 0.015 | 0.001 | nonzero | 1.626 | |||
| my5740_rel_lto.cy10a1_gcp_c2s30 | 92.352 | 7.573 | 0.044 | 0.015 | 0.015 | nonzero | 0.662 | ||||
| my5740_rel_lto.cy10a2_gcp_c2s30 | 95.581 | 4.337 | 0.048 | 0.018 | 0.015 | 0.001 | nonzero | 2.727 | |||
| my5740_rel_lto.cy10a3_gcp_c2s30 | 94.771 | 5.148 | 0.048 | 0.017 | 0.015 | 0.001 | nonzero | 3.529 | |||
| my5740_rel_lto.cy10a4_gcp_c2s30 | 93.548 | 6.186 | 0.229 | 0.022 | 0.015 | nonzero | nonzero | nonzero | 6.066 |
Performance metrics for the DBMS listed above. Some are normalized by throughput, others are not. Legend for results is here.
ips	qps	rps	rmbps	wps	wmbps	rpq	rkbpq	wpi	wkbpi	csps	cpups	cspq	cpupq	dbgb1	dbgb2	rss	maxop	p50	p99	tag
833854	0	0	0.0	4013.5	233.9	0.000	0.000	0.005	0.287	85613	73.2	0.103	13	263.1	391.6	86.8	1.626	107384	82111	4000m.my5740_rel_lto.cy10a_gcp_c2s30
820681	0	0	0.0	3945.2	230.3	0.000	0.000	0.005	0.287	86745	73.4	0.106	13	263.1	391.6	86.8	0.662	105087	81538	4000m.my5740_rel_lto.cy10a1_gcp_c2s30
839454	0	0	0.0	4091.3	236.8	0.000	0.000	0.005	0.289	86787	73.4	0.103	13	263.1	391.6	86.8	2.727	107819	81239	4000m.my5740_rel_lto.cy10a2_gcp_c2s30
822199	0	0	0.0	4016.7	232.3	0.000	0.000	0.005	0.289	84250	72.4	0.102	13	263.1	391.6	86.8	3.529	107020	77041	4000m.my5740_rel_lto.cy10a3_gcp_c2s30
816326	0	0	0.0	953.5	211.6	0.000	0.000	0.001	0.265	86374	72.4	0.106	13	263.1	391.6	86.7	6.066	104786	80014	4000m.my5740_rel_lto.cy10a4_gcp_c2s30
l.x
l.x: create secondary indexes.
Average throughput:
Performance metrics for the DBMS listed above. Some are normalized by throughput, others are not. Legend for results is here.
ips	qps	rps	rmbps	wps	wmbps	rpq	rkbpq	wpi	wkbpi	csps	cpups	cspq	cpupq	dbgb1	dbgb2	rss	maxop	p50	p99	tag
764253	0	4027	672.1	7717.6	864.1	0.005	0.900	0.010	1.158	27488	29.5	0.036	6	588.3	716.8	87.3	0.033	NA	NA	4000m.my5740_rel_lto.cy10a_gcp_c2s30
713284	0	3759	625.9	7143.7	808.4	0.005	0.899	0.010	1.161	38006	26.8	0.053	6	588.3	716.8	87.3	0.030	NA	NA	4000m.my5740_rel_lto.cy10a1_gcp_c2s30
769398	0	4055	675.6	7625.8	863.0	0.005	0.899	0.010	1.149	27015	29.4	0.035	6	588.3	716.8	87.3	0.033	NA	NA	4000m.my5740_rel_lto.cy10a2_gcp_c2s30
776417	0	4096	678.0	7550.8	862.6	0.005	0.894	0.010	1.138	25588	29.9	0.033	6	588.3	716.8	87.3	0.030	NA	NA	4000m.my5740_rel_lto.cy10a3_gcp_c2s30
719701	0	1435	621.4	3172.4	762.8	0.002	0.884	0.004	1.085	27352	28.0	0.038	6	588.3	716.8	87.3	0.037	NA	NA	4000m.my5740_rel_lto.cy10a4_gcp_c2s30
l.i1
l.i1: continue load after secondary indexes created. Graphs for performance per 1-second interval are here.
Average throughput:
Insert response time histogram: each cell has the percentage of responses that take <= the time in the header and max is the max response time in seconds. For the max column values in the top 25% of the range have a red background and in the bottom 25% of the range have a green background. The red background is not used when the min value is within 80% of the max value.
| dbms | 256us | 1ms | 4ms | 16ms | 64ms | 256ms | 1s | 4s | 16s | gt | max |
|---|---|---|---|---|---|---|---|---|---|---|---|
| my5740_rel_lto.cy10a_gcp_c2s30 | 2.418 | 58.267 | 27.289 | 11.991 | 0.035 | 0.337 | |||||
| my5740_rel_lto.cy10a1_gcp_c2s30 | 3.781 | 56.438 | 26.243 | 13.527 | 0.011 | 0.348 | |||||
| my5740_rel_lto.cy10a2_gcp_c2s30 | 3.059 | 55.789 | 28.719 | 12.376 | 0.057 | 0.377 | |||||
| my5740_rel_lto.cy10a3_gcp_c2s30 | 3.149 | 56.149 | 28.426 | 12.188 | 0.088 | nonzero | 1.079 | ||||
| my5740_rel_lto.cy10a4_gcp_c2s30 | 5.024 | 43.110 | 28.054 | 16.929 | 6.883 | 0.690 |
Delete response time histogram: each cell has the percentage of responses that take <= the time in the header and max is the max response time in seconds. For the max column values in the top 25% of the range have a red background and in the bottom 25% of the range have a green background. The red background is not used when the min value is within 80% of the max value.
| dbms | 256us | 1ms | 4ms | 16ms | 64ms | 256ms | 1s | 4s | 16s | gt | max |
|---|---|---|---|---|---|---|---|---|---|---|---|
| my5740_rel_lto.cy10a_gcp_c2s30 | 29.605 | 66.350 | 3.903 | 0.143 | 0.179 | ||||||
| my5740_rel_lto.cy10a1_gcp_c2s30 | 32.018 | 63.981 | 3.743 | 0.253 | 0.006 | 0.347 | |||||
| my5740_rel_lto.cy10a2_gcp_c2s30 | 32.691 | 61.753 | 5.410 | 0.146 | 0.168 | ||||||
| my5740_rel_lto.cy10a3_gcp_c2s30 | 31.883 | 62.794 | 5.179 | 0.144 | 0.152 | ||||||
| my5740_rel_lto.cy10a4_gcp_c2s30 | 35.036 | 53.312 | 11.314 | 0.337 | 0.245 |
Performance metrics for the DBMS listed above. Some are normalized by throughput, others are not. Legend for results is here.
ips	qps	rps	rmbps	wps	wmbps	rpq	rkbpq	wpi	wkbpi	csps	cpups	cspq	cpupq	dbgb1	dbgb2	rss	maxop	p50	p99	tag
14167	0	15840	247.5	31321.4	730.8	1.118	17.889	2.211	52.821	129654	28.2	9.152	299	812.3	979.0	87.1	0.337	749	250	4000m.my5740_rel_lto.cy10a_gcp_c2s30
13364	0	14480	226.3	27699.1	675.9	1.083	17.336	2.073	51.789	137549	28.2	10.292	317	812.5	979.3	86.9	0.348	749	250	4000m.my5740_rel_lto.cy10a1_gcp_c2s30
13798	0	15584	243.5	32364.9	741.1	1.129	18.071	2.346	55.000	130393	26.0	9.450	283	812.4	978.5	87.0	0.377	749	250	4000m.my5740_rel_lto.cy10a2_gcp_c2s30
13836	0	15626	244.2	32442.1	747.6	1.129	18.070	2.345	55.331	129137	26.5	9.333	287	812.5	978.2	86.9	1.079	749	250	4000m.my5740_rel_lto.cy10a3_gcp_c2s30
6612	0	7391	197.0	12241.5	335.6	1.118	30.513	1.852	51.983	110293	15.7	16.682	356	812.4	980.2	87.0	0.690	250	100	4000m.my5740_rel_lto.cy10a4_gcp_c2s30
q100.1
q100.1: range queries with 100 insert/s per client. Graphs for performance per 1-second interval are here.
Average throughput:
Query response time histogram: each cell has the percentage of responses that take <= the time in the header and max is the max response time in seconds. For max values in the top 25% of the range have a red background and in the bottom 25% of the range have a green background. The red background is not used when the min value is within 80% of the max value.
| dbms | 256us | 1ms | 4ms | 16ms | 64ms | 256ms | 1s | 4s | 16s | gt | max |
|---|---|---|---|---|---|---|---|---|---|---|---|
| my5740_rel_lto.cy10a_gcp_c2s30 | 38.995 | 2.272 | 46.436 | 12.267 | 0.030 | nonzero | 0.074 | ||||
| my5740_rel_lto.cy10a1_gcp_c2s30 | 39.151 | 2.519 | 49.484 | 8.754 | 0.082 | 0.012 | nonzero | 0.792 | |||
| my5740_rel_lto.cy10a2_gcp_c2s30 | 39.026 | 2.255 | 45.718 | 12.964 | 0.037 | nonzero | 0.105 | ||||
| my5740_rel_lto.cy10a3_gcp_c2s30 | 38.806 | 2.367 | 46.078 | 12.718 | 0.032 | nonzero | 0.147 | ||||
| my5740_rel_lto.cy10a4_gcp_c2s30 | 39.822 | 2.290 | 25.736 | 24.844 | 7.282 | 0.026 | 0.184 |
Insert response time histogram: each cell has the percentage of responses that take <= the time in the header and max is the max response time in seconds. For max values in the top 25% of the range have a red background and in the bottom 25% of the range have a green background. The red background is not used when the min value is within 80% of the max value.
| dbms | 256us | 1ms | 4ms | 16ms | 64ms | 256ms | 1s | 4s | 16s | gt | max |
|---|---|---|---|---|---|---|---|---|---|---|---|
| my5740_rel_lto.cy10a_gcp_c2s30 | 27.243 | 71.983 | 0.771 | 0.003 | 0.072 | ||||||
| my5740_rel_lto.cy10a1_gcp_c2s30 | 26.882 | 70.333 | 2.323 | 0.458 | 0.003 | 0.371 | |||||
| my5740_rel_lto.cy10a2_gcp_c2s30 | 39.497 | 59.670 | 0.833 | 0.061 | |||||||
| my5740_rel_lto.cy10a3_gcp_c2s30 | 34.938 | 64.094 | 0.951 | 0.017 | 0.209 | ||||||
| my5740_rel_lto.cy10a4_gcp_c2s30 | 19.375 | 58.278 | 22.198 | 0.149 | 0.170 |
Delete response time histogram: each cell has the percentage of responses that take <= the time in the header and max is the max response time in seconds. For max values in the top 25% of the range have a red background and in the bottom 25% of the range have a green background. The red background is not used when the min value is within 80% of the max value.
| dbms | 256us | 1ms | 4ms | 16ms | 64ms | 256ms | 1s | 4s | 16s | gt | max |
|---|---|---|---|---|---|---|---|---|---|---|---|
| my5740_rel_lto.cy10a_gcp_c2s30 | 37.878 | 61.493 | 0.625 | 0.003 | 0.072 | ||||||
| my5740_rel_lto.cy10a1_gcp_c2s30 | 34.389 | 63.167 | 2.021 | 0.420 | 0.003 | 0.371 | |||||
| my5740_rel_lto.cy10a2_gcp_c2s30 | 48.253 | 51.045 | 0.701 | 0.063 | |||||||
| my5740_rel_lto.cy10a3_gcp_c2s30 | 43.691 | 55.479 | 0.812 | 0.017 | 0.209 | ||||||
| my5740_rel_lto.cy10a4_gcp_c2s30 | 23.965 | 57.111 | 18.774 | 0.149 | 0.174 |
Performance metrics for the DBMS listed above. Some are normalized by throughput, others are not. Legend for results is here.
ips	qps	rps	rmbps	wps	wmbps	rpq	rkbpq	wpi	wkbpi	csps	cpups	cspq	cpupq	dbgb1	dbgb2	rss	maxop	p50	p99	tag
789	3835	30976	484.0	22554.2	551.0	8.076	129.221	28.571	714.715	130370	20.0	33.991	782	812.3	979.0	87.0	0.074	511	224	4000m.my5740_rel_lto.cy10a_gcp_c2s30
789	4074	30670	479.2	19959.5	512.3	7.529	120.467	25.297	664.911	143279	21.3	35.173	784	812.5	979.3	86.9	0.792	543	240	4000m.my5740_rel_lto.cy10a1_gcp_c2s30
789	3787	31185	487.3	23495.2	564.5	8.235	131.767	29.778	732.672	131820	19.5	34.811	772	812.4	978.5	86.9	0.105	496	208	4000m.my5740_rel_lto.cy10a2_gcp_c2s30
789	3811	31487	492.0	23033.5	567.9	8.261	132.178	29.179	736.685	130264	19.9	34.177	783	812.5	978.2	86.9	0.147	511	224	4000m.my5740_rel_lto.cy10a3_gcp_c2s30
754	1663	11902	926.5	10084.8	252.7	7.157	570.432	13.384	343.424	101731	15.2	61.169	1371	812.4	980.2	86.9	0.184	224	112	4000m.my5740_rel_lto.cy10a4_gcp_c2s30
q500.1
q500.1: range queries with 500 insert/s per client. Graphs for performance per 1-second interval are here.
Average throughput:
Query response time histogram: each cell has the percentage of responses that take <= the time in the header and max is the max response time in seconds. For max values in the top 25% of the range have a red background and in the bottom 25% of the range have a green background. The red background is not used when the min value is within 80% of the max value.
| dbms | 256us | 1ms | 4ms | 16ms | 64ms | 256ms | 1s | 4s | 16s | gt | max |
|---|---|---|---|---|---|---|---|---|---|---|---|
| my5740_rel_lto.cy10a_gcp_c2s30 | 39.177 | 2.650 | 50.461 | 7.704 | 0.007 | nonzero | 0.066 | ||||
| my5740_rel_lto.cy10a1_gcp_c2s30 | 39.309 | 2.959 | 53.221 | 4.464 | 0.047 | 0.058 | |||||
| my5740_rel_lto.cy10a2_gcp_c2s30 | 39.309 | 2.666 | 49.666 | 8.320 | 0.040 | nonzero | 0.114 | ||||
| my5740_rel_lto.cy10a3_gcp_c2s30 | 39.053 | 2.807 | 50.658 | 7.475 | 0.006 | 0.064 | |||||
| my5740_rel_lto.cy10a4_gcp_c2s30 | 41.148 | 2.617 | 29.418 | 21.867 | 4.942 | 0.008 | 0.177 |
Insert response time histogram: each cell has the percentage of responses that take <= the time in the header and max is the max response time in seconds. For max values in the top 25% of the range have a red background and in the bottom 25% of the range have a green background. The red background is not used when the min value is within 80% of the max value.
| dbms | 256us | 1ms | 4ms | 16ms | 64ms | 256ms | 1s | 4s | 16s | gt | max |
|---|---|---|---|---|---|---|---|---|---|---|---|
| my5740_rel_lto.cy10a_gcp_c2s30 | 47.357 | 52.433 | 0.210 | 0.033 | |||||||
| my5740_rel_lto.cy10a1_gcp_c2s30 | 54.142 | 45.091 | 0.763 | 0.004 | 0.103 | ||||||
| my5740_rel_lto.cy10a2_gcp_c2s30 | 58.983 | 40.669 | 0.345 | 0.002 | 0.079 | ||||||
| my5740_rel_lto.cy10a3_gcp_c2s30 | 58.064 | 41.742 | 0.194 | 0.001 | 0.065 | ||||||
| my5740_rel_lto.cy10a4_gcp_c2s30 | 39.865 | 49.001 | 11.065 | 0.069 | 0.176 |
Delete response time histogram: each cell has the percentage of responses that take <= the time in the header and max is the max response time in seconds. For max values in the top 25% of the range have a red background and in the bottom 25% of the range have a green background. The red background is not used when the min value is within 80% of the max value.
| dbms | 256us | 1ms | 4ms | 16ms | 64ms | 256ms | 1s | 4s | 16s | gt | max |
|---|---|---|---|---|---|---|---|---|---|---|---|
| my5740_rel_lto.cy10a_gcp_c2s30 | 70.837 | 29.073 | 0.090 | 0.034 | |||||||
| my5740_rel_lto.cy10a1_gcp_c2s30 | 70.781 | 28.670 | 0.545 | 0.004 | 0.098 | ||||||
| my5740_rel_lto.cy10a2_gcp_c2s30 | 76.481 | 23.326 | 0.193 | 0.051 | |||||||
| my5740_rel_lto.cy10a3_gcp_c2s30 | 76.020 | 23.860 | 0.120 | 0.057 | |||||||
| my5740_rel_lto.cy10a4_gcp_c2s30 | 48.778 | 43.094 | 8.048 | 0.079 | 0.177 |
Performance metrics for the DBMS listed above. Some are normalized by throughput, others are not. Legend for results is here.
ips	qps	rps	rmbps	wps	wmbps	rpq	rkbpq	wpi	wkbpi	csps	cpups	cspq	cpupq	dbgb1	dbgb2	rss	maxop	p50	p99	tag
3969	4268	33534	524.0	20684.4	528.4	7.857	125.716	5.211	136.322	136167	21.9	31.905	770	812.3	979.0	86.9	0.066	543	479	4000m.my5740_rel_lto.cy10a_gcp_c2s30
3956	4544	32965	515.1	17503.8	477.2	7.254	116.062	4.425	123.524	147255	23.1	32.403	762	812.5	979.3	86.9	0.058	575	511	4000m.my5740_rel_lto.cy10a1_gcp_c2s30
3969	4216	33436	522.4	21421.9	535.1	7.931	126.893	5.397	138.042	137737	20.9	32.670	744	812.4	978.5	86.9	0.114	528	304	4000m.my5740_rel_lto.cy10a2_gcp_c2s30
3969	4294	34232	534.9	21381.2	548.5	7.973	127.564	5.387	141.501	138705	21.7	32.305	758	812.5	978.2	86.9	0.064	543	479	4000m.my5740_rel_lto.cy10a3_gcp_c2s30
3875	2097	13994	1058.9	9871.3	237.2	6.674	517.111	2.547	62.686	107109	17.8	51.080	1273	812.4	980.4	86.9	0.177	272	208	4000m.my5740_rel_lto.cy10a4_gcp_c2s30
q1000.1
q1000.1: range queries with 1000 insert/s per client. Graphs for performance per 1-second interval are here.
Average throughput:
Query response time histogram: each cell has the percentage of responses that take <= the time in the header and max is the max response time in seconds. For max values in the top 25% of the range have a red background and in the bottom 25% of the range have a green background. The red background is not used when the min value is within 80% of the max value.
| dbms | 256us | 1ms | 4ms | 16ms | 64ms | 256ms | 1s | 4s | 16s | gt | max |
|---|---|---|---|---|---|---|---|---|---|---|---|
| my5740_rel_lto.cy10a_gcp_c2s30 | 38.713 | 2.527 | 48.355 | 10.389 | 0.016 | 0.063 | |||||
| my5740_rel_lto.cy10a1_gcp_c2s30 | 38.715 | 2.840 | 50.794 | 7.593 | 0.058 | nonzero | nonzero | 1.018 | |||
| my5740_rel_lto.cy10a2_gcp_c2s30 | 38.922 | 2.508 | 47.814 | 10.737 | 0.019 | nonzero | 0.064 | ||||
| my5740_rel_lto.cy10a3_gcp_c2s30 | 38.676 | 2.648 | 48.303 | 10.358 | 0.014 | nonzero | 0.081 | ||||
| my5740_rel_lto.cy10a4_gcp_c2s30 | 39.697 | 2.892 | 27.735 | 23.184 | 6.478 | 0.015 | 0.234 |
Insert response time histogram: each cell has the percentage of responses that take <= the time in the header and max is the max response time in seconds. For max values in the top 25% of the range have a red background and in the bottom 25% of the range have a green background. The red background is not used when the min value is within 80% of the max value.
| dbms | 256us | 1ms | 4ms | 16ms | 64ms | 256ms | 1s | 4s | 16s | gt | max |
|---|---|---|---|---|---|---|---|---|---|---|---|
| my5740_rel_lto.cy10a_gcp_c2s30 | 46.219 | 53.477 | 0.304 | 0.049 | |||||||
| my5740_rel_lto.cy10a1_gcp_c2s30 | 47.677 | 51.190 | 1.127 | 0.005 | nonzero | 1.217 | |||||
| my5740_rel_lto.cy10a2_gcp_c2s30 | 61.751 | 38.069 | 0.180 | 0.060 | |||||||
| my5740_rel_lto.cy10a3_gcp_c2s30 | 59.437 | 40.396 | 0.167 | 0.032 | |||||||
| my5740_rel_lto.cy10a4_gcp_c2s30 | 34.818 | 52.439 | 12.664 | 0.079 | 0.170 |
Delete response time histogram: each cell has the percentage of responses that take <= the time in the header and max is the max response time in seconds. For max values in the top 25% of the range have a red background and in the bottom 25% of the range have a green background. The red background is not used when the min value is within 80% of the max value.
| dbms | 256us | 1ms | 4ms | 16ms | 64ms | 256ms | 1s | 4s | 16s | gt | max |
|---|---|---|---|---|---|---|---|---|---|---|---|
| my5740_rel_lto.cy10a_gcp_c2s30 | 67.314 | 32.538 | 0.148 | nonzero | 0.073 | ||||||
| my5740_rel_lto.cy10a1_gcp_c2s30 | 62.325 | 36.897 | 0.772 | 0.006 | nonzero | 1.216 | |||||
| my5740_rel_lto.cy10a2_gcp_c2s30 | 77.625 | 22.256 | 0.118 | 0.001 | 0.087 | ||||||
| my5740_rel_lto.cy10a3_gcp_c2s30 | 76.163 | 23.734 | 0.102 | 0.001 | 0.068 | ||||||
| my5740_rel_lto.cy10a4_gcp_c2s30 | 40.269 | 48.979 | 10.655 | 0.097 | 0.187 |
Performance metrics for the DBMS listed above. Some are normalized by throughput, others are not. Legend for results is here.
ips	qps	rps	rmbps	wps	wmbps	rpq	rkbpq	wpi	wkbpi	csps	cpups	cspq	cpupq	dbgb1	dbgb2	rss	maxop	p50	p99	tag
7943	4019	31423	491.0	22910.8	558.9	7.818	125.090	2.885	72.054	138359	25.1	34.424	937	812.3	979.1	86.9	0.063	511	448	4000m.my5740_rel_lto.cy10a_gcp_c2s30
7916	4228	30642	478.8	20035.1	513.1	7.248	115.966	2.531	66.370	148099	26.4	35.031	937	812.5	979.6	86.9	1.018	528	479	4000m.my5740_rel_lto.cy10a1_gcp_c2s30
7938	4006	31454	491.5	23866.3	568.7	7.851	125.613	3.007	73.357	139796	23.4	34.893	876	812.4	978.8	86.9	0.064	496	448	4000m.my5740_rel_lto.cy10a2_gcp_c2s30
7938	4035	31874	498.0	23647.5	578.7	7.899	126.383	2.979	74.654	139845	24.2	34.655	900	812.5	978.4	86.9	0.081	511	448	4000m.my5740_rel_lto.cy10a3_gcp_c2s30
7705	1834	12426	961.6	10403.9	252.8	6.774	536.783	1.350	33.599	109259	20.6	59.558	1684	813.4	982.4	86.9	0.234	240	144	4000m.my5740_rel_lto.cy10a4_gcp_c2s30
l.i0
l.i0: load without secondary indexes
Performance metrics for all DBMS, not just the ones listed above. Some are normalized by throughput, others are not. Legend for results is here.
ips	qps	rps	rmbps	wps	wmbps	rpq	rkbpq	wpi	wkbpi	csps	cpups	cspq	cpupq	dbgb1	dbgb2	rss	maxop	p50	p99	tag
833854	0	0	0.0	4013.5	233.9	0.000	0.000	0.005	0.287	85613	73.2	0.103	13	263.1	391.6	86.8	1.626	107384	82111	4000m.my5740_rel_lto.cy10a_gcp_c2s30
820681	0	0	0.0	3945.2	230.3	0.000	0.000	0.005	0.287	86745	73.4	0.106	13	263.1	391.6	86.8	0.662	105087	81538	4000m.my5740_rel_lto.cy10a1_gcp_c2s30
839454	0	0	0.0	4091.3	236.8	0.000	0.000	0.005	0.289	86787	73.4	0.103	13	263.1	391.6	86.8	2.727	107819	81239	4000m.my5740_rel_lto.cy10a2_gcp_c2s30
822199	0	0	0.0	4016.7	232.3	0.000	0.000	0.005	0.289	84250	72.4	0.102	13	263.1	391.6	86.8	3.529	107020	77041	4000m.my5740_rel_lto.cy10a3_gcp_c2s30
816326	0	0	0.0	953.5	211.6	0.000	0.000	0.001	0.265	86374	72.4	0.106	13	263.1	391.6	86.7	6.066	104786	80014	4000m.my5740_rel_lto.cy10a4_gcp_c2s30
l.x
l.x: create secondary indexes
Performance metrics for all DBMS, not just the ones listed above. Some are normalized by throughput, others are not. Legend for results is here.
ips	qps	rps	rmbps	wps	wmbps	rpq	rkbpq	wpi	wkbpi	csps	cpups	cspq	cpupq	dbgb1	dbgb2	rss	maxop	p50	p99	tag
764253	0	4027	672.1	7717.6	864.1	0.005	0.900	0.010	1.158	27488	29.5	0.036	6	588.3	716.8	87.3	0.033	NA	NA	4000m.my5740_rel_lto.cy10a_gcp_c2s30
713284	0	3759	625.9	7143.7	808.4	0.005	0.899	0.010	1.161	38006	26.8	0.053	6	588.3	716.8	87.3	0.030	NA	NA	4000m.my5740_rel_lto.cy10a1_gcp_c2s30
769398	0	4055	675.6	7625.8	863.0	0.005	0.899	0.010	1.149	27015	29.4	0.035	6	588.3	716.8	87.3	0.033	NA	NA	4000m.my5740_rel_lto.cy10a2_gcp_c2s30
776417	0	4096	678.0	7550.8	862.6	0.005	0.894	0.010	1.138	25588	29.9	0.033	6	588.3	716.8	87.3	0.030	NA	NA	4000m.my5740_rel_lto.cy10a3_gcp_c2s30
719701	0	1435	621.4	3172.4	762.8	0.002	0.884	0.004	1.085	27352	28.0	0.038	6	588.3	716.8	87.3	0.037	NA	NA	4000m.my5740_rel_lto.cy10a4_gcp_c2s30
l.i1
l.i1: continue load after secondary indexes created
Performance metrics for all DBMS, not just the ones listed above. Some are normalized by throughput, others are not. Legend for results is here.
ips	qps	rps	rmbps	wps	wmbps	rpq	rkbpq	wpi	wkbpi	csps	cpups	cspq	cpupq	dbgb1	dbgb2	rss	maxop	p50	p99	tag
14167	0	15840	247.5	31321.4	730.8	1.118	17.889	2.211	52.821	129654	28.2	9.152	299	812.3	979.0	87.1	0.337	749	250	4000m.my5740_rel_lto.cy10a_gcp_c2s30
13364	0	14480	226.3	27699.1	675.9	1.083	17.336	2.073	51.789	137549	28.2	10.292	317	812.5	979.3	86.9	0.348	749	250	4000m.my5740_rel_lto.cy10a1_gcp_c2s30
13798	0	15584	243.5	32364.9	741.1	1.129	18.071	2.346	55.000	130393	26.0	9.450	283	812.4	978.5	87.0	0.377	749	250	4000m.my5740_rel_lto.cy10a2_gcp_c2s30
13836	0	15626	244.2	32442.1	747.6	1.129	18.070	2.345	55.331	129137	26.5	9.333	287	812.5	978.2	86.9	1.079	749	250	4000m.my5740_rel_lto.cy10a3_gcp_c2s30
6612	0	7391	197.0	12241.5	335.6	1.118	30.513	1.852	51.983	110293	15.7	16.682	356	812.4	980.2	87.0	0.690	250	100	4000m.my5740_rel_lto.cy10a4_gcp_c2s30
q100.1
q100.1: range queries with 100 insert/s per client
Performance metrics for all DBMS, not just the ones listed above. Some are normalized by throughput, others are not. Legend for results is here.
ips	qps	rps	rmbps	wps	wmbps	rpq	rkbpq	wpi	wkbpi	csps	cpups	cspq	cpupq	dbgb1	dbgb2	rss	maxop	p50	p99	tag
789	3835	30976	484.0	22554.2	551.0	8.076	129.221	28.571	714.715	130370	20.0	33.991	782	812.3	979.0	87.0	0.074	511	224	4000m.my5740_rel_lto.cy10a_gcp_c2s30
789	4074	30670	479.2	19959.5	512.3	7.529	120.467	25.297	664.911	143279	21.3	35.173	784	812.5	979.3	86.9	0.792	543	240	4000m.my5740_rel_lto.cy10a1_gcp_c2s30
789	3787	31185	487.3	23495.2	564.5	8.235	131.767	29.778	732.672	131820	19.5	34.811	772	812.4	978.5	86.9	0.105	496	208	4000m.my5740_rel_lto.cy10a2_gcp_c2s30
789	3811	31487	492.0	23033.5	567.9	8.261	132.178	29.179	736.685	130264	19.9	34.177	783	812.5	978.2	86.9	0.147	511	224	4000m.my5740_rel_lto.cy10a3_gcp_c2s30
754	1663	11902	926.5	10084.8	252.7	7.157	570.432	13.384	343.424	101731	15.2	61.169	1371	812.4	980.2	86.9	0.184	224	112	4000m.my5740_rel_lto.cy10a4_gcp_c2s30
q500.1
q500.1: range queries with 500 insert/s per client
Performance metrics for all DBMS, not just the ones listed above. Some are normalized by throughput, others are not. Legend for results is here.
ips	qps	rps	rmbps	wps	wmbps	rpq	rkbpq	wpi	wkbpi	csps	cpups	cspq	cpupq	dbgb1	dbgb2	rss	maxop	p50	p99	tag
3969	4268	33534	524.0	20684.4	528.4	7.857	125.716	5.211	136.322	136167	21.9	31.905	770	812.3	979.0	86.9	0.066	543	479	4000m.my5740_rel_lto.cy10a_gcp_c2s30
3956	4544	32965	515.1	17503.8	477.2	7.254	116.062	4.425	123.524	147255	23.1	32.403	762	812.5	979.3	86.9	0.058	575	511	4000m.my5740_rel_lto.cy10a1_gcp_c2s30
3969	4216	33436	522.4	21421.9	535.1	7.931	126.893	5.397	138.042	137737	20.9	32.670	744	812.4	978.5	86.9	0.114	528	304	4000m.my5740_rel_lto.cy10a2_gcp_c2s30
3969	4294	34232	534.9	21381.2	548.5	7.973	127.564	5.387	141.501	138705	21.7	32.305	758	812.5	978.2	86.9	0.064	543	479	4000m.my5740_rel_lto.cy10a3_gcp_c2s30
3875	2097	13994	1058.9	9871.3	237.2	6.674	517.111	2.547	62.686	107109	17.8	51.080	1273	812.4	980.4	86.9	0.177	272	208	4000m.my5740_rel_lto.cy10a4_gcp_c2s30
q1000.1
q1000.1: range queries with 1000 insert/s per client
Performance metrics for all DBMS, not just the ones listed above. Some are normalized by throughput, others are not. Legend for results is here.
ips	qps	rps	rmbps	wps	wmbps	rpq	rkbpq	wpi	wkbpi	csps	cpups	cspq	cpupq	dbgb1	dbgb2	rss	maxop	p50	p99	tag
7943	4019	31423	491.0	22910.8	558.9	7.818	125.090	2.885	72.054	138359	25.1	34.424	937	812.3	979.1	86.9	0.063	511	448	4000m.my5740_rel_lto.cy10a_gcp_c2s30
7916	4228	30642	478.8	20035.1	513.1	7.248	115.966	2.531	66.370	148099	26.4	35.031	937	812.5	979.6	86.9	1.018	528	479	4000m.my5740_rel_lto.cy10a1_gcp_c2s30
7938	4006	31454	491.5	23866.3	568.7	7.851	125.613	3.007	73.357	139796	23.4	34.893	876	812.4	978.8	86.9	0.064	496	448	4000m.my5740_rel_lto.cy10a2_gcp_c2s30
7938	4035	31874	498.0	23647.5	578.7	7.899	126.383	2.979	74.654	139845	24.2	34.655	900	812.5	978.4	86.9	0.081	511	448	4000m.my5740_rel_lto.cy10a3_gcp_c2s30
7705	1834	12426	961.6	10403.9	252.8	6.774	536.783	1.350	33.599	109259	20.6	59.558	1684	813.4	982.4	86.9	0.234	240	144	4000m.my5740_rel_lto.cy10a4_gcp_c2s30
l.i0
- l.i0: load without secondary indexes
- Legend for results is here.
- Each entry lists the percentage of responses that fit in that bucket (slower than max time for previous bucket, faster than min time for next bucket).
Insert response time histogram
256us	1ms	4ms	16ms	64ms	256ms	1s	4s	16s	gt	max	tag
0.000	94.985	4.937	0.046	0.016	0.015	0.001	nonzero	0.000	0.000	1.626	my5740_rel_lto.cy10a_gcp_c2s30
0.000	92.352	7.573	0.044	0.015	0.015	nonzero	0.000	0.000	0.000	0.662	my5740_rel_lto.cy10a1_gcp_c2s30
0.000	95.581	4.337	0.048	0.018	0.015	0.001	nonzero	0.000	0.000	2.727	my5740_rel_lto.cy10a2_gcp_c2s30
0.000	94.771	5.148	0.048	0.017	0.015	0.001	nonzero	0.000	0.000	3.529	my5740_rel_lto.cy10a3_gcp_c2s30
0.000	93.548	6.186	0.229	0.022	0.015	nonzero	nonzero	nonzero	0.000	6.066	my5740_rel_lto.cy10a4_gcp_c2s30
l.x
- l.x: create secondary indexes
- Legend for results is here.
- Each entry lists the percentage of responses that fit in that bucket (slower than max time for previous bucket, faster than min time for next bucket).
TODO - determine whether there is data for create index response time
l.i1
- l.i1: continue load after secondary indexes created
- Legend for results is here.
- Each entry lists the percentage of responses that fit in that bucket (slower than max time for previous bucket, faster than min time for next bucket).
Insert response time histogram
256us	1ms	4ms	16ms	64ms	256ms	1s	4s	16s	gt	max	tag
0.000	0.000	2.418	58.267	27.289	11.991	0.035	0.000	0.000	0.000	0.337	my5740_rel_lto.cy10a_gcp_c2s30
0.000	0.000	3.781	56.438	26.243	13.527	0.011	0.000	0.000	0.000	0.348	my5740_rel_lto.cy10a1_gcp_c2s30
0.000	0.000	3.059	55.789	28.719	12.376	0.057	0.000	0.000	0.000	0.377	my5740_rel_lto.cy10a2_gcp_c2s30
0.000	0.000	3.149	56.149	28.426	12.188	0.088	nonzero	0.000	0.000	1.079	my5740_rel_lto.cy10a3_gcp_c2s30
0.000	0.000	5.024	43.110	28.054	16.929	6.883	0.000	0.000	0.000	0.690	my5740_rel_lto.cy10a4_gcp_c2s30
Delete response time histogram
256us	1ms	4ms	16ms	64ms	256ms	1s	4s	16s	gt	max	tag
0.000	0.000	29.605	66.350	3.903	0.143	0.000	0.000	0.000	0.000	0.179	my5740_rel_lto.cy10a_gcp_c2s30
0.000	0.000	32.018	63.981	3.743	0.253	0.006	0.000	0.000	0.000	0.347	my5740_rel_lto.cy10a1_gcp_c2s30
0.000	0.000	32.691	61.753	5.410	0.146	0.000	0.000	0.000	0.000	0.168	my5740_rel_lto.cy10a2_gcp_c2s30
0.000	0.000	31.883	62.794	5.179	0.144	0.000	0.000	0.000	0.000	0.152	my5740_rel_lto.cy10a3_gcp_c2s30
0.000	0.000	35.036	53.312	11.314	0.337	0.000	0.000	0.000	0.000	0.245	my5740_rel_lto.cy10a4_gcp_c2s30
q100.1
- q100.1: range queries with 100 insert/s per client
- Legend for results is here.
- Each entry lists the percentage of responses that fit in that bucket (slower than max time for previous bucket, faster than min time for next bucket).
Query response time histogram
256us	1ms	4ms	16ms	64ms	256ms	1s	4s	16s	gt	max	tag
38.995	2.272	46.436	12.267	0.030	nonzero	0.000	0.000	0.000	0.000	0.074	my5740_rel_lto.cy10a_gcp_c2s30
39.151	2.519	49.484	8.754	0.082	0.012	nonzero	0.000	0.000	0.000	0.792	my5740_rel_lto.cy10a1_gcp_c2s30
39.026	2.255	45.718	12.964	0.037	nonzero	0.000	0.000	0.000	0.000	0.105	my5740_rel_lto.cy10a2_gcp_c2s30
38.806	2.367	46.078	12.718	0.032	nonzero	0.000	0.000	0.000	0.000	0.147	my5740_rel_lto.cy10a3_gcp_c2s30
39.822	2.290	25.736	24.844	7.282	0.026	0.000	0.000	0.000	0.000	0.184	my5740_rel_lto.cy10a4_gcp_c2s30
Insert response time histogram
256us	1ms	4ms	16ms	64ms	256ms	1s	4s	16s	gt	max	tag
0.000	0.000	27.243	71.983	0.771	0.003	0.000	0.000	0.000	0.000	0.072	my5740_rel_lto.cy10a_gcp_c2s30
0.000	0.000	26.882	70.333	2.323	0.458	0.003	0.000	0.000	0.000	0.371	my5740_rel_lto.cy10a1_gcp_c2s30
0.000	0.000	39.497	59.670	0.833	0.000	0.000	0.000	0.000	0.000	0.061	my5740_rel_lto.cy10a2_gcp_c2s30
0.000	0.000	34.938	64.094	0.951	0.017	0.000	0.000	0.000	0.000	0.209	my5740_rel_lto.cy10a3_gcp_c2s30
0.000	0.000	19.375	58.278	22.198	0.149	0.000	0.000	0.000	0.000	0.170	my5740_rel_lto.cy10a4_gcp_c2s30
Delete response time histogram
256us	1ms	4ms	16ms	64ms	256ms	1s	4s	16s	gt	max	tag
0.000	0.000	37.878	61.493	0.625	0.003	0.000	0.000	0.000	0.000	0.072	my5740_rel_lto.cy10a_gcp_c2s30
0.000	0.000	34.389	63.167	2.021	0.420	0.003	0.000	0.000	0.000	0.371	my5740_rel_lto.cy10a1_gcp_c2s30
0.000	0.000	48.253	51.045	0.701	0.000	0.000	0.000	0.000	0.000	0.063	my5740_rel_lto.cy10a2_gcp_c2s30
0.000	0.000	43.691	55.479	0.812	0.017	0.000	0.000	0.000	0.000	0.209	my5740_rel_lto.cy10a3_gcp_c2s30
0.000	0.000	23.965	57.111	18.774	0.149	0.000	0.000	0.000	0.000	0.174	my5740_rel_lto.cy10a4_gcp_c2s30
q500.1
- q500.1: range queries with 500 insert/s per client
- Legend for results is here.
- Each entry lists the percentage of responses that fit in that bucket (slower than max time for previous bucket, faster than min time for next bucket).
Query response time histogram
256us	1ms	4ms	16ms	64ms	256ms	1s	4s	16s	gt	max	tag
39.177	2.650	50.461	7.704	0.007	nonzero	0.000	0.000	0.000	0.000	0.066	my5740_rel_lto.cy10a_gcp_c2s30
39.309	2.959	53.221	4.464	0.047	0.000	0.000	0.000	0.000	0.000	0.058	my5740_rel_lto.cy10a1_gcp_c2s30
39.309	2.666	49.666	8.320	0.040	nonzero	0.000	0.000	0.000	0.000	0.114	my5740_rel_lto.cy10a2_gcp_c2s30
39.053	2.807	50.658	7.475	0.006	0.000	0.000	0.000	0.000	0.000	0.064	my5740_rel_lto.cy10a3_gcp_c2s30
41.148	2.617	29.418	21.867	4.942	0.008	0.000	0.000	0.000	0.000	0.177	my5740_rel_lto.cy10a4_gcp_c2s30
Insert response time histogram
256us	1ms	4ms	16ms	64ms	256ms	1s	4s	16s	gt	max	tag
0.000	0.000	47.357	52.433	0.210	0.000	0.000	0.000	0.000	0.000	0.033	my5740_rel_lto.cy10a_gcp_c2s30
0.000	0.000	54.142	45.091	0.763	0.004	0.000	0.000	0.000	0.000	0.103	my5740_rel_lto.cy10a1_gcp_c2s30
0.000	0.000	58.983	40.669	0.345	0.002	0.000	0.000	0.000	0.000	0.079	my5740_rel_lto.cy10a2_gcp_c2s30
0.000	0.000	58.064	41.742	0.194	0.001	0.000	0.000	0.000	0.000	0.065	my5740_rel_lto.cy10a3_gcp_c2s30
0.000	0.000	39.865	49.001	11.065	0.069	0.000	0.000	0.000	0.000	0.176	my5740_rel_lto.cy10a4_gcp_c2s30
Delete response time histogram
256us	1ms	4ms	16ms	64ms	256ms	1s	4s	16s	gt	max	tag
0.000	0.000	70.837	29.073	0.090	0.000	0.000	0.000	0.000	0.000	0.034	my5740_rel_lto.cy10a_gcp_c2s30
0.000	0.000	70.781	28.670	0.545	0.004	0.000	0.000	0.000	0.000	0.098	my5740_rel_lto.cy10a1_gcp_c2s30
0.000	0.000	76.481	23.326	0.193	0.000	0.000	0.000	0.000	0.000	0.051	my5740_rel_lto.cy10a2_gcp_c2s30
0.000	0.000	76.020	23.860	0.120	0.000	0.000	0.000	0.000	0.000	0.057	my5740_rel_lto.cy10a3_gcp_c2s30
0.000	0.000	48.778	43.094	8.048	0.079	0.000	0.000	0.000	0.000	0.177	my5740_rel_lto.cy10a4_gcp_c2s30
q1000.1
- q1000.1: range queries with 1000 insert/s per client
- Legend for results is here.
- Each entry lists the percentage of responses that fit in that bucket (slower than max time for previous bucket, faster than min time for next bucket).
Query response time histogram
256us	1ms	4ms	16ms	64ms	256ms	1s	4s	16s	gt	max	tag
38.713	2.527	48.355	10.389	0.016	0.000	0.000	0.000	0.000	0.000	0.063	my5740_rel_lto.cy10a_gcp_c2s30
38.715	2.840	50.794	7.593	0.058	nonzero	0.000	nonzero	0.000	0.000	1.018	my5740_rel_lto.cy10a1_gcp_c2s30
38.922	2.508	47.814	10.737	0.019	nonzero	0.000	0.000	0.000	0.000	0.064	my5740_rel_lto.cy10a2_gcp_c2s30
38.676	2.648	48.303	10.358	0.014	nonzero	0.000	0.000	0.000	0.000	0.081	my5740_rel_lto.cy10a3_gcp_c2s30
39.697	2.892	27.735	23.184	6.478	0.015	0.000	0.000	0.000	0.000	0.234	my5740_rel_lto.cy10a4_gcp_c2s30
Insert response time histogram
256us	1ms	4ms	16ms	64ms	256ms	1s	4s	16s	gt	max	tag
0.000	0.000	46.219	53.477	0.304	0.000	0.000	0.000	0.000	0.000	0.049	my5740_rel_lto.cy10a_gcp_c2s30
0.000	0.000	47.677	51.190	1.127	0.005	0.000	nonzero	0.000	0.000	1.217	my5740_rel_lto.cy10a1_gcp_c2s30
0.000	0.000	61.751	38.069	0.180	0.000	0.000	0.000	0.000	0.000	0.060	my5740_rel_lto.cy10a2_gcp_c2s30
0.000	0.000	59.437	40.396	0.167	0.000	0.000	0.000	0.000	0.000	0.032	my5740_rel_lto.cy10a3_gcp_c2s30
0.000	0.000	34.818	52.439	12.664	0.079	0.000	0.000	0.000	0.000	0.170	my5740_rel_lto.cy10a4_gcp_c2s30
Delete response time histogram
256us	1ms	4ms	16ms	64ms	256ms	1s	4s	16s	gt	max	tag
0.000	0.000	67.314	32.538	0.148	nonzero	0.000	0.000	0.000	0.000	0.073	my5740_rel_lto.cy10a_gcp_c2s30
0.000	0.000	62.325	36.897	0.772	0.006	0.000	nonzero	0.000	0.000	1.216	my5740_rel_lto.cy10a1_gcp_c2s30
0.000	0.000	77.625	22.256	0.118	0.001	0.000	0.000	0.000	0.000	0.087	my5740_rel_lto.cy10a2_gcp_c2s30
0.000	0.000	76.163	23.734	0.102	0.001	0.000	0.000	0.000	0.000	0.068	my5740_rel_lto.cy10a3_gcp_c2s30
0.000	0.000	40.269	48.979	10.655	0.097	0.000	0.000	0.000	0.000	0.187	my5740_rel_lto.cy10a4_gcp_c2s30