Introduction
This is a report for the insert benchmark with 160M docs and 8 client(s). It is generated by scripts (bash, awk, sed) and Tufte might not be impressed. An overview of the insert benchmark is here and a short update is here. Below, by DBMS, I mean DBMS+version.config. An example is my8020.c10b40 where my means MySQL, 8020 is version 8.0.20 and c10b40 is the name for the configuration file.
The test server is a c2-standard-30 from GCP with 15 cores, hyperthreads disabled, 120G RAM, XFS + SW RAID 0 on 4 NVMe devices (1.5TB). The benchmark was run with 8 client and there were 1 or 3 connections per client (1 for queries or inserts without rate limits, 1+1 for rate limited inserts+deletes). There are 8 tables, client per table. It loads 160M rows without secondary indexes, creates secondary indexes, then inserts 800M rows with a delete per insert to avoid growing the table. It then does 3 read+write tests for 1800s each that do queries as fast as possible with 100, 500 and then 1000 inserts/second/client concurrent with the queries and 1000 deletes/second to avoid growing the table. The database is cached by the OS but not by InnoDB.
The tested DBMS are:
- my5740_rel_lto.cy10a_4g_gcp_c2s30 - InnoDB and MySQL 5.7.40, rel_lto build, cy10a_gcp_c2s30 config, compiled with CMAKE_BUILD_TYPE=Release -O2, base config
- my5740_rel_lto.cy10a1_4g_gcp_c2s30 - InnoDB and MySQL 5.7.40, rel_lto build, cy10a_gcp_c2s30 config, compiled with CMAKE_BUILD_TYPE=Release -O2, adds innodb_use_native_aio=off
- my5740_rel_lto.cy10a2_4g_gcp_c2s30 - InnoDB and MySQL 5.7.40, rel_lto build, cy10a_gcp_c2s30 config, compiled with CMAKE_BUILD_TYPE=Release -O2, adds innodb_io_capacity=20k, innodb_io_capacity_max=40k
- my5740_rel_lto.cy10a3_4g_gcp_c2s30 - InnoDB and MySQL 5.7.40, rel_lto build, cy10a_gcp_c2s30 config, compiled with CMAKE_BUILD_TYPE=Release -O2, adds innodb_io_capacity=20k, innodb_io_capacity_max=40k, innodb_flush_sync=OFF
Contents
- Summary
- l.i0: load without secondary indexes
- l.x: create secondary indexes
- l.i1: continue load after secondary indexes created
- q100.1: range queries with 100 insert/s per client
- q500.1: range queries with 500 insert/s per client
- q1000.1: range queries with 1000 insert/s per client
Summary
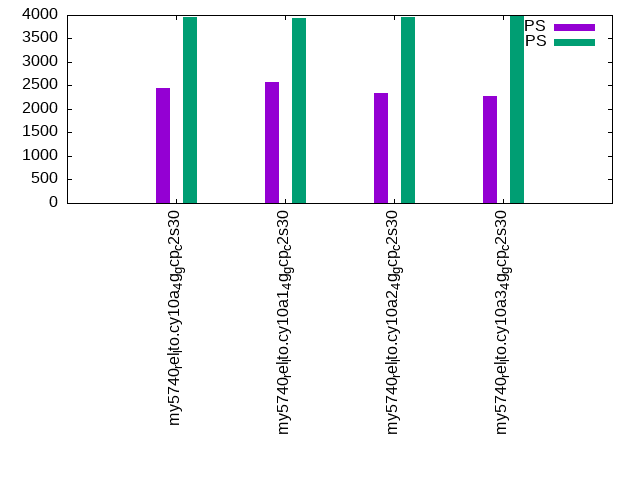
The numbers are inserts/s for l.i0 and l.i1, indexed docs (or rows) /s for l.x and queries/s for q*.2. The values are the average rate over the entire test for inserts (IPS) and queries (QPS). The range of values for IPS and QPS is split into 3 parts: bottom 25%, middle 50%, top 25%. Values in the bottom 25% have a red background, values in the top 25% have a green background and values in the middle have no color. A gray background is used for values that can be ignored because the DBMS did not sustain the target insert rate. Red backgrounds are not used when the minimum value is within 80% of the max value.
| dbms | l.i0 | l.x | l.i1 | q100.1 | q500.1 | q1000.1 |
|---|---|---|---|---|---|---|
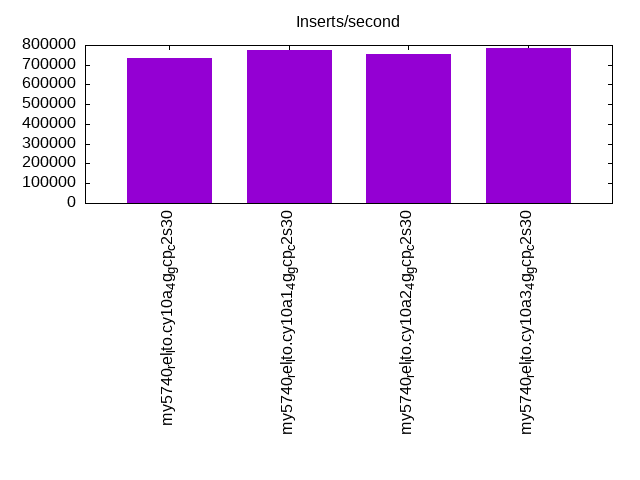
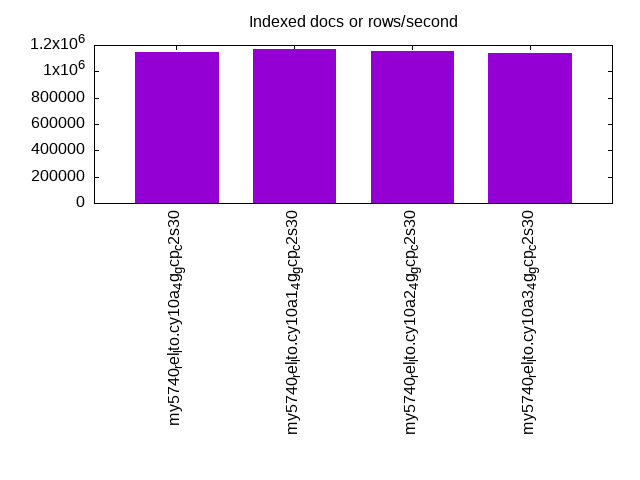
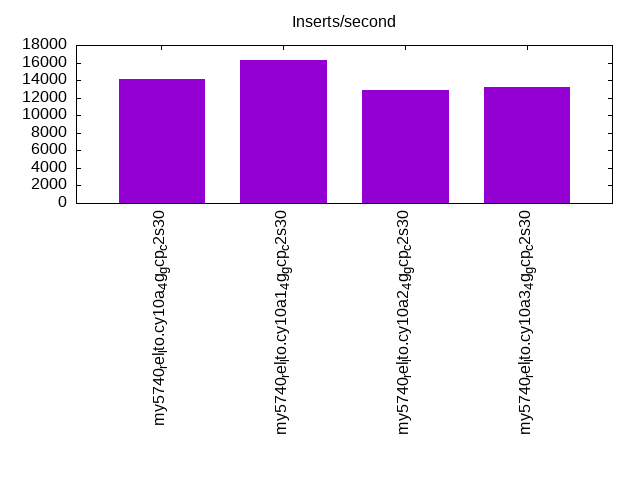
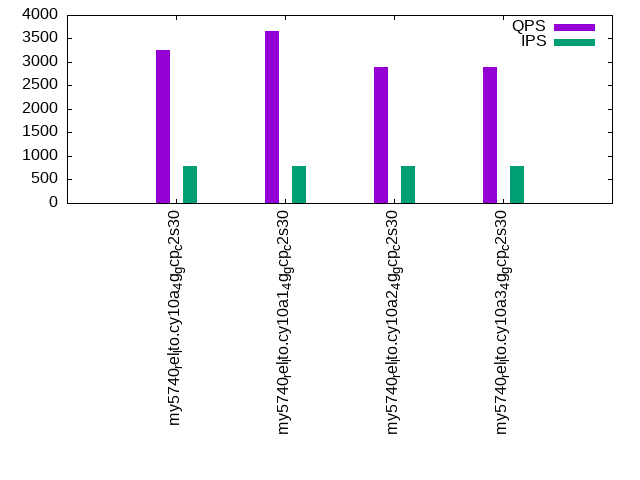
| my5740_rel_lto.cy10a_4g_gcp_c2s30 | 733945 | 1143571 | 14164 | 3257 | 2440 | 1275 |
| my5740_rel_lto.cy10a1_4g_gcp_c2s30 | 772947 | 1168613 | 16330 | 3653 | 2581 | 1394 |
| my5740_rel_lto.cy10a2_4g_gcp_c2s30 | 754717 | 1151798 | 12837 | 2900 | 2344 | 1187 |
| my5740_rel_lto.cy10a3_4g_gcp_c2s30 | 784314 | 1135461 | 13175 | 2895 | 2267 | 1169 |
This table has relative throughput, throughput for the DBMS relative to the DBMS in the first line, using the absolute throughput from the previous table. Values less than 0.95 have a yellow background. Values greater than 1.05 have a blue background.
| dbms | l.i0 | l.x | l.i1 | q100.1 | q500.1 | q1000.1 |
|---|---|---|---|---|---|---|
| my5740_rel_lto.cy10a_4g_gcp_c2s30 | 1.00 | 1.00 | 1.00 | 1.00 | 1.00 | 1.00 |
| my5740_rel_lto.cy10a1_4g_gcp_c2s30 | 1.05 | 1.02 | 1.15 | 1.12 | 1.06 | 1.09 |
| my5740_rel_lto.cy10a2_4g_gcp_c2s30 | 1.03 | 1.01 | 0.91 | 0.89 | 0.96 | 0.93 |
| my5740_rel_lto.cy10a3_4g_gcp_c2s30 | 1.07 | 0.99 | 0.93 | 0.89 | 0.93 | 0.92 |
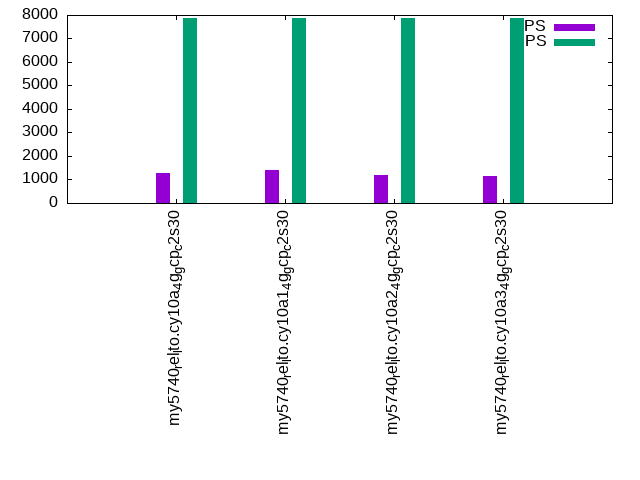
This lists the average rate of inserts/s for the tests that do inserts concurrent with queries. For such tests the query rate is listed in the table above. The read+write tests are setup so that the insert rate should match the target rate every second. Cells that are not at least 95% of the target have a red background to indicate a failure to satisfy the target.
| dbms | q100.1 | q500.1 | q1000.1 |
|---|---|---|---|
| my5740_rel_lto.cy10a_4g_gcp_c2s30 | 786 | 3947 | 7882 |
| my5740_rel_lto.cy10a1_4g_gcp_c2s30 | 784 | 3932 | 7869 |
| my5740_rel_lto.cy10a2_4g_gcp_c2s30 | 788 | 3965 | 7890 |
| my5740_rel_lto.cy10a3_4g_gcp_c2s30 | 789 | 3969 | 7890 |
| target | 800 | 4000 | 8000 |
l.i0
l.i0: load without secondary indexes. Graphs for performance per 1-second interval are here.
Average throughput:
Insert response time histogram: each cell has the percentage of responses that take <= the time in the header and max is the max response time in seconds. For the max column values in the top 25% of the range have a red background and in the bottom 25% of the range have a green background. The red background is not used when the min value is within 80% of the max value.
| dbms | 256us | 1ms | 4ms | 16ms | 64ms | 256ms | 1s | 4s | 16s | gt | max |
|---|---|---|---|---|---|---|---|---|---|---|---|
| my5740_rel_lto.cy10a_4g_gcp_c2s30 | 87.532 | 12.210 | 0.219 | 0.025 | 0.014 | 0.001 | 0.267 | ||||
| my5740_rel_lto.cy10a1_4g_gcp_c2s30 | 94.679 | 5.047 | 0.235 | 0.025 | 0.014 | 0.001 | 0.267 | ||||
| my5740_rel_lto.cy10a2_4g_gcp_c2s30 | 89.475 | 10.267 | 0.219 | 0.025 | 0.014 | 0.234 | |||||
| my5740_rel_lto.cy10a3_4g_gcp_c2s30 | 94.528 | 5.205 | 0.231 | 0.022 | 0.014 | 0.001 | 0.260 |
Performance metrics for the DBMS listed above. Some are normalized by throughput, others are not. Legend for results is here.
ips	qps	rps	rmbps	wps	wmbps	rpq	rkbpq	wpi	wkbpi	csps	cpups	cspq	cpupq	dbgb1	dbgb2	rss	maxop	p50	p99	tag
733945	0	0	0.0	711.4	178.2	0.000	0.000	0.001	0.249	76140	66.4	0.104	14	10.6	139.1	4.5	0.267	100790	76617	160m.my5740_rel_lto.cy10a_4g_gcp_c2s30
772947	0	0	0.0	766.5	180.5	0.000	0.000	0.001	0.239	83851	68.6	0.108	13	10.6	139.1	4.5	0.267	106485	79614	160m.my5740_rel_lto.cy10a1_4g_gcp_c2s30
754717	0	0	0.0	730.0	182.4	0.000	0.000	0.001	0.248	77393	67.0	0.103	13	10.6	139.1	4.5	0.234	102789	74944	160m.my5740_rel_lto.cy10a2_4g_gcp_c2s30
784314	0	0	0.0	737.4	190.7	0.000	0.000	0.001	0.249	81668	69.1	0.104	13	10.6	139.1	4.5	0.260	108183	75718	160m.my5740_rel_lto.cy10a3_4g_gcp_c2s30
l.x
l.x: create secondary indexes.
Average throughput:
Performance metrics for the DBMS listed above. Some are normalized by throughput, others are not. Legend for results is here.
ips	qps	rps	rmbps	wps	wmbps	rpq	rkbpq	wpi	wkbpi	csps	cpups	cspq	cpupq	dbgb1	dbgb2	rss	maxop	p50	p99	tag
1143571	0	0	0.0	3637.2	909.1	0.000	0.000	0.003	0.814	40469	32.6	0.035	4	23.6	152.1	4.7	0.031	NA	NA	160m.my5740_rel_lto.cy10a_4g_gcp_c2s30
1168613	0	0	0.0	3559.4	933.4	0.000	0.000	0.003	0.818	43427	34.5	0.037	4	23.6	152.1	4.7	0.026	NA	NA	160m.my5740_rel_lto.cy10a1_4g_gcp_c2s30
1151798	0	0	0.0	3412.3	937.7	0.000	0.000	0.003	0.834	35297	33.7	0.031	4	23.6	152.1	4.7	0.031	NA	NA	160m.my5740_rel_lto.cy10a2_4g_gcp_c2s30
1135461	0	0	0.0	3499.6	912.1	0.000	0.000	0.003	0.823	38394	33.0	0.034	4	23.6	152.1	4.7	0.030	NA	NA	160m.my5740_rel_lto.cy10a3_4g_gcp_c2s30
l.i1
l.i1: continue load after secondary indexes created. Graphs for performance per 1-second interval are here.
Average throughput:
Insert response time histogram: each cell has the percentage of responses that take <= the time in the header and max is the max response time in seconds. For the max column values in the top 25% of the range have a red background and in the bottom 25% of the range have a green background. The red background is not used when the min value is within 80% of the max value.
| dbms | 256us | 1ms | 4ms | 16ms | 64ms | 256ms | 1s | 4s | 16s | gt | max |
|---|---|---|---|---|---|---|---|---|---|---|---|
| my5740_rel_lto.cy10a_4g_gcp_c2s30 | 2.714 | 39.310 | 50.005 | 7.671 | 0.296 | 0.004 | 0.001 | 5.155 | |||
| my5740_rel_lto.cy10a1_4g_gcp_c2s30 | 1.948 | 52.199 | 40.350 | 5.041 | 0.461 | 0.003 | 3.240 | ||||
| my5740_rel_lto.cy10a2_4g_gcp_c2s30 | 2.813 | 31.148 | 57.043 | 8.658 | 0.336 | 0.002 | 3.521 | ||||
| my5740_rel_lto.cy10a3_4g_gcp_c2s30 | 2.778 | 31.924 | 56.945 | 8.041 | 0.311 | 0.770 |
Delete response time histogram: each cell has the percentage of responses that take <= the time in the header and max is the max response time in seconds. For the max column values in the top 25% of the range have a red background and in the bottom 25% of the range have a green background. The red background is not used when the min value is within 80% of the max value.
| dbms | 256us | 1ms | 4ms | 16ms | 64ms | 256ms | 1s | 4s | 16s | gt | max |
|---|---|---|---|---|---|---|---|---|---|---|---|
| my5740_rel_lto.cy10a_4g_gcp_c2s30 | 0.001 | 4.039 | 42.156 | 47.777 | 5.976 | 0.051 | 0.001 | 2.380 | |||
| my5740_rel_lto.cy10a1_4g_gcp_c2s30 | nonzero | 3.341 | 55.072 | 37.739 | 3.640 | 0.205 | 0.002 | 2.396 | |||
| my5740_rel_lto.cy10a2_4g_gcp_c2s30 | nonzero | 4.085 | 34.017 | 55.020 | 6.825 | 0.053 | 0.001 | 2.921 | |||
| my5740_rel_lto.cy10a3_4g_gcp_c2s30 | 0.001 | 4.023 | 34.830 | 54.877 | 6.236 | 0.034 | 0.516 |
Performance metrics for the DBMS listed above. Some are normalized by throughput, others are not. Legend for results is here.
ips	qps	rps	rmbps	wps	wmbps	rpq	rkbpq	wpi	wkbpi	csps	cpups	cspq	cpupq	dbgb1	dbgb2	rss	maxop	p50	p99	tag
14164	0	2	0.6	14620.9	449.0	0.000	0.040	1.032	32.462	134009	35.3	9.461	374	41.0	175.8	4.7	5.155	1799	150	160m.my5740_rel_lto.cy10a_4g_gcp_c2s30
16330	0	2	0.6	14173.8	468.7	0.000	0.036	0.868	29.391	168677	42.7	10.329	392	41.0	175.6	4.6	3.240	2098	150	160m.my5740_rel_lto.cy10a1_4g_gcp_c2s30
12837	0	2	0.5	14372.0	450.1	0.000	0.040	1.120	35.906	125770	32.3	9.798	377	41.1	176.0	4.7	3.521	1648	150	160m.my5740_rel_lto.cy10a2_4g_gcp_c2s30
13175	0	2	0.5	14855.9	462.5	0.000	0.039	1.128	35.946	129866	33.2	9.857	378	41.1	176.0	4.7	0.770	1698	150	160m.my5740_rel_lto.cy10a3_4g_gcp_c2s30
q100.1
q100.1: range queries with 100 insert/s per client. Graphs for performance per 1-second interval are here.
Average throughput:
Query response time histogram: each cell has the percentage of responses that take <= the time in the header and max is the max response time in seconds. For max values in the top 25% of the range have a red background and in the bottom 25% of the range have a green background. The red background is not used when the min value is within 80% of the max value.
| dbms | 256us | 1ms | 4ms | 16ms | 64ms | 256ms | 1s | 4s | 16s | gt | max |
|---|---|---|---|---|---|---|---|---|---|---|---|
| my5740_rel_lto.cy10a_4g_gcp_c2s30 | 39.352 | 27.653 | 12.333 | 18.035 | 2.622 | 0.005 | nonzero | 0.277 | |||
| my5740_rel_lto.cy10a1_4g_gcp_c2s30 | 39.960 | 31.905 | 10.432 | 15.317 | 2.363 | 0.021 | 0.001 | 0.758 | |||
| my5740_rel_lto.cy10a2_4g_gcp_c2s30 | 38.547 | 26.170 | 11.719 | 20.568 | 2.988 | 0.008 | 0.189 | ||||
| my5740_rel_lto.cy10a3_4g_gcp_c2s30 | 38.290 | 26.215 | 11.714 | 20.828 | 2.945 | 0.007 | nonzero | 0.290 |
Insert response time histogram: each cell has the percentage of responses that take <= the time in the header and max is the max response time in seconds. For max values in the top 25% of the range have a red background and in the bottom 25% of the range have a green background. The red background is not used when the min value is within 80% of the max value.
| dbms | 256us | 1ms | 4ms | 16ms | 64ms | 256ms | 1s | 4s | 16s | gt | max |
|---|---|---|---|---|---|---|---|---|---|---|---|
| my5740_rel_lto.cy10a_4g_gcp_c2s30 | 29.906 | 52.667 | 17.378 | 0.049 | 0.139 | ||||||
| my5740_rel_lto.cy10a1_4g_gcp_c2s30 | 33.177 | 48.708 | 17.444 | 0.580 | 0.090 | 0.557 | |||||
| my5740_rel_lto.cy10a2_4g_gcp_c2s30 | 22.521 | 46.840 | 30.368 | 0.260 | 0.010 | 0.374 | |||||
| my5740_rel_lto.cy10a3_4g_gcp_c2s30 | 24.045 | 49.090 | 26.674 | 0.188 | 0.003 | 0.292 |
Delete response time histogram: each cell has the percentage of responses that take <= the time in the header and max is the max response time in seconds. For max values in the top 25% of the range have a red background and in the bottom 25% of the range have a green background. The red background is not used when the min value is within 80% of the max value.
| dbms | 256us | 1ms | 4ms | 16ms | 64ms | 256ms | 1s | 4s | 16s | gt | max |
|---|---|---|---|---|---|---|---|---|---|---|---|
| my5740_rel_lto.cy10a_4g_gcp_c2s30 | 31.344 | 52.212 | 16.399 | 0.045 | 0.186 | ||||||
| my5740_rel_lto.cy10a1_4g_gcp_c2s30 | 34.785 | 48.170 | 16.399 | 0.566 | 0.080 | 0.683 | |||||
| my5740_rel_lto.cy10a2_4g_gcp_c2s30 | 23.757 | 46.899 | 29.153 | 0.188 | 0.003 | 0.279 | |||||
| my5740_rel_lto.cy10a3_4g_gcp_c2s30 | 25.368 | 49.135 | 25.361 | 0.132 | 0.003 | 0.297 |
Performance metrics for the DBMS listed above. Some are normalized by throughput, others are not. Legend for results is here.
ips	qps	rps	rmbps	wps	wmbps	rpq	rkbpq	wpi	wkbpi	csps	cpups	cspq	cpupq	dbgb1	dbgb2	rss	maxop	p50	p99	tag
786	3257	9	0.3	17696.8	421.7	0.003	0.101	22.504	549.108	116510	15.4	35.771	709	41.0	175.8	4.6	0.277	432	96	160m.my5740_rel_lto.cy10a_4g_gcp_c2s30
784	3653	10	0.3	16823.1	420.6	0.003	0.085	21.450	549.189	121679	16.7	33.311	686	41.0	175.6	4.6	0.758	480	64	160m.my5740_rel_lto.cy10a1_4g_gcp_c2s30
788	2900	12	0.4	17226.2	422.6	0.004	0.129	21.858	549.071	112875	14.6	38.920	755	41.1	176.0	4.6	0.189	384	96	160m.my5740_rel_lto.cy10a2_4g_gcp_c2s30
789	2895	11	0.3	17249.0	416.9	0.004	0.112	21.873	541.402	112668	14.6	38.917	756	41.1	176.0	4.6	0.290	384	96	160m.my5740_rel_lto.cy10a3_4g_gcp_c2s30
q500.1
q500.1: range queries with 500 insert/s per client. Graphs for performance per 1-second interval are here.
Average throughput:
Query response time histogram: each cell has the percentage of responses that take <= the time in the header and max is the max response time in seconds. For max values in the top 25% of the range have a red background and in the bottom 25% of the range have a green background. The red background is not used when the min value is within 80% of the max value.
| dbms | 256us | 1ms | 4ms | 16ms | 64ms | 256ms | 1s | 4s | 16s | gt | max |
|---|---|---|---|---|---|---|---|---|---|---|---|
| my5740_rel_lto.cy10a_4g_gcp_c2s30 | 27.612 | 30.580 | 14.390 | 23.324 | 4.076 | 0.017 | 0.143 | ||||
| my5740_rel_lto.cy10a1_4g_gcp_c2s30 | 27.951 | 35.169 | 12.257 | 20.615 | 3.964 | 0.041 | 0.003 | nonzero | 1.543 | ||
| my5740_rel_lto.cy10a2_4g_gcp_c2s30 | 27.820 | 29.911 | 13.791 | 23.988 | 4.473 | 0.017 | 0.154 | ||||
| my5740_rel_lto.cy10a3_4g_gcp_c2s30 | 27.174 | 30.189 | 13.366 | 24.482 | 4.769 | 0.019 | 0.160 |
Insert response time histogram: each cell has the percentage of responses that take <= the time in the header and max is the max response time in seconds. For max values in the top 25% of the range have a red background and in the bottom 25% of the range have a green background. The red background is not used when the min value is within 80% of the max value.
| dbms | 256us | 1ms | 4ms | 16ms | 64ms | 256ms | 1s | 4s | 16s | gt | max |
|---|---|---|---|---|---|---|---|---|---|---|---|
| my5740_rel_lto.cy10a_4g_gcp_c2s30 | 26.009 | 54.800 | 19.129 | 0.062 | 0.140 | ||||||
| my5740_rel_lto.cy10a1_4g_gcp_c2s30 | 25.582 | 52.047 | 21.426 | 0.801 | 0.128 | 0.015 | 1.693 | ||||
| my5740_rel_lto.cy10a2_4g_gcp_c2s30 | 28.797 | 54.107 | 17.057 | 0.040 | 0.119 | ||||||
| my5740_rel_lto.cy10a3_4g_gcp_c2s30 | 29.492 | 53.725 | 16.760 | 0.022 | 0.088 |
Delete response time histogram: each cell has the percentage of responses that take <= the time in the header and max is the max response time in seconds. For max values in the top 25% of the range have a red background and in the bottom 25% of the range have a green background. The red background is not used when the min value is within 80% of the max value.
| dbms | 256us | 1ms | 4ms | 16ms | 64ms | 256ms | 1s | 4s | 16s | gt | max |
|---|---|---|---|---|---|---|---|---|---|---|---|
| my5740_rel_lto.cy10a_4g_gcp_c2s30 | 27.228 | 54.202 | 18.522 | 0.047 | 0.139 | ||||||
| my5740_rel_lto.cy10a1_4g_gcp_c2s30 | 27.144 | 51.566 | 20.370 | 0.774 | 0.135 | 0.012 | 1.609 | ||||
| my5740_rel_lto.cy10a2_4g_gcp_c2s30 | 29.874 | 53.638 | 16.459 | 0.030 | 0.095 | ||||||
| my5740_rel_lto.cy10a3_4g_gcp_c2s30 | 30.179 | 53.785 | 16.017 | 0.019 | 0.094 |
Performance metrics for the DBMS listed above. Some are normalized by throughput, others are not. Legend for results is here.
ips	qps	rps	rmbps	wps	wmbps	rpq	rkbpq	wpi	wkbpi	csps	cpups	cspq	cpupq	dbgb1	dbgb2	rss	maxop	p50	p99	tag
3947	2440	55	1.2	17272.1	427.1	0.022	0.487	4.376	110.807	116510	17.5	47.760	1076	41.0	175.8	4.6	0.143	304	256	160m.my5740_rel_lto.cy10a_4g_gcp_c2s30
3932	2581	64	1.2	16777.1	434.5	0.025	0.489	4.267	113.151	124296	18.7	48.158	1087	41.0	175.6	4.6	1.543	336	32	160m.my5740_rel_lto.cy10a1_4g_gcp_c2s30
3965	2344	50	1.0	16877.5	430.3	0.021	0.447	4.257	111.145	115464	17.2	49.259	1101	41.1	176.0	4.6	0.154	288	240	160m.my5740_rel_lto.cy10a2_4g_gcp_c2s30
3969	2267	44	0.9	16525.2	415.6	0.019	0.423	4.163	107.215	112628	16.9	49.691	1118	41.1	176.0	4.6	0.160	288	224	160m.my5740_rel_lto.cy10a3_4g_gcp_c2s30
q1000.1
q1000.1: range queries with 1000 insert/s per client. Graphs for performance per 1-second interval are here.
Average throughput:
Query response time histogram: each cell has the percentage of responses that take <= the time in the header and max is the max response time in seconds. For max values in the top 25% of the range have a red background and in the bottom 25% of the range have a green background. The red background is not used when the min value is within 80% of the max value.
| dbms | 256us | 1ms | 4ms | 16ms | 64ms | 256ms | 1s | 4s | 16s | gt | max |
|---|---|---|---|---|---|---|---|---|---|---|---|
| my5740_rel_lto.cy10a_4g_gcp_c2s30 | 14.646 | 27.691 | 17.890 | 28.298 | 11.128 | 0.344 | 0.002 | 0.488 | |||
| my5740_rel_lto.cy10a1_4g_gcp_c2s30 | 15.386 | 31.311 | 17.122 | 26.224 | 9.569 | 0.378 | 0.010 | nonzero | 1.577 | ||
| my5740_rel_lto.cy10a2_4g_gcp_c2s30 | 14.781 | 26.949 | 16.474 | 29.353 | 11.916 | 0.524 | 0.003 | 0.560 | |||
| my5740_rel_lto.cy10a3_4g_gcp_c2s30 | 14.439 | 26.226 | 15.384 | 30.670 | 12.987 | 0.294 | nonzero | 0.373 |
Insert response time histogram: each cell has the percentage of responses that take <= the time in the header and max is the max response time in seconds. For max values in the top 25% of the range have a red background and in the bottom 25% of the range have a green background. The red background is not used when the min value is within 80% of the max value.
| dbms | 256us | 1ms | 4ms | 16ms | 64ms | 256ms | 1s | 4s | 16s | gt | max |
|---|---|---|---|---|---|---|---|---|---|---|---|
| my5740_rel_lto.cy10a_4g_gcp_c2s30 | 9.113 | 37.388 | 49.982 | 3.453 | 0.064 | 0.551 | |||||
| my5740_rel_lto.cy10a1_4g_gcp_c2s30 | 9.395 | 40.579 | 46.605 | 3.238 | 0.180 | 0.003 | 3.261 | ||||
| my5740_rel_lto.cy10a2_4g_gcp_c2s30 | 8.640 | 34.083 | 52.116 | 5.020 | 0.141 | 0.639 | |||||
| my5740_rel_lto.cy10a3_4g_gcp_c2s30 | 14.595 | 41.225 | 42.716 | 1.447 | 0.018 | 0.443 |
Delete response time histogram: each cell has the percentage of responses that take <= the time in the header and max is the max response time in seconds. For max values in the top 25% of the range have a red background and in the bottom 25% of the range have a green background. The red background is not used when the min value is within 80% of the max value.
| dbms | 256us | 1ms | 4ms | 16ms | 64ms | 256ms | 1s | 4s | 16s | gt | max |
|---|---|---|---|---|---|---|---|---|---|---|---|
| my5740_rel_lto.cy10a_4g_gcp_c2s30 | 9.784 | 38.263 | 49.109 | 2.807 | 0.037 | 0.763 | |||||
| my5740_rel_lto.cy10a1_4g_gcp_c2s30 | 10.135 | 41.565 | 45.376 | 2.775 | 0.146 | 0.003 | 1.827 | ||||
| my5740_rel_lto.cy10a2_4g_gcp_c2s30 | 8.948 | 34.731 | 51.878 | 4.363 | 0.081 | 0.584 | |||||
| my5740_rel_lto.cy10a3_4g_gcp_c2s30 | 15.281 | 41.796 | 41.789 | 1.127 | 0.007 | 0.430 |
Performance metrics for the DBMS listed above. Some are normalized by throughput, others are not. Legend for results is here.
ips	qps	rps	rmbps	wps	wmbps	rpq	rkbpq	wpi	wkbpi	csps	cpups	cspq	cpupq	dbgb1	dbgb2	rss	maxop	p50	p99	tag
7882	1275	77	1.5	16619.1	437.2	0.060	1.227	2.109	56.806	129851	24.2	101.812	2846	41.3	176.4	4.6	0.488	160	96	160m.my5740_rel_lto.cy10a_4g_gcp_c2s30
7869	1394	93	1.9	16529.8	452.6	0.067	1.401	2.101	58.893	143595	25.6	102.987	2754	41.2	176.1	4.6	1.577	176	80	160m.my5740_rel_lto.cy10a1_4g_gcp_c2s30
7890	1187	90	1.8	15970.2	430.9	0.076	1.531	2.024	55.925	130022	24.1	109.575	3047	41.5	176.8	4.6	0.560	144	64	160m.my5740_rel_lto.cy10a2_4g_gcp_c2s30
7890	1169	59	1.2	16159.3	425.6	0.050	1.010	2.048	55.232	125483	22.6	107.315	2899	41.5	176.8	4.6	0.373	144	80	160m.my5740_rel_lto.cy10a3_4g_gcp_c2s30
l.i0
l.i0: load without secondary indexes
Performance metrics for all DBMS, not just the ones listed above. Some are normalized by throughput, others are not. Legend for results is here.
ips	qps	rps	rmbps	wps	wmbps	rpq	rkbpq	wpi	wkbpi	csps	cpups	cspq	cpupq	dbgb1	dbgb2	rss	maxop	p50	p99	tag
733945	0	0	0.0	711.4	178.2	0.000	0.000	0.001	0.249	76140	66.4	0.104	14	10.6	139.1	4.5	0.267	100790	76617	160m.my5740_rel_lto.cy10a_4g_gcp_c2s30
772947	0	0	0.0	766.5	180.5	0.000	0.000	0.001	0.239	83851	68.6	0.108	13	10.6	139.1	4.5	0.267	106485	79614	160m.my5740_rel_lto.cy10a1_4g_gcp_c2s30
754717	0	0	0.0	730.0	182.4	0.000	0.000	0.001	0.248	77393	67.0	0.103	13	10.6	139.1	4.5	0.234	102789	74944	160m.my5740_rel_lto.cy10a2_4g_gcp_c2s30
784314	0	0	0.0	737.4	190.7	0.000	0.000	0.001	0.249	81668	69.1	0.104	13	10.6	139.1	4.5	0.260	108183	75718	160m.my5740_rel_lto.cy10a3_4g_gcp_c2s30
l.x
l.x: create secondary indexes
Performance metrics for all DBMS, not just the ones listed above. Some are normalized by throughput, others are not. Legend for results is here.
ips	qps	rps	rmbps	wps	wmbps	rpq	rkbpq	wpi	wkbpi	csps	cpups	cspq	cpupq	dbgb1	dbgb2	rss	maxop	p50	p99	tag
1143571	0	0	0.0	3637.2	909.1	0.000	0.000	0.003	0.814	40469	32.6	0.035	4	23.6	152.1	4.7	0.031	NA	NA	160m.my5740_rel_lto.cy10a_4g_gcp_c2s30
1168613	0	0	0.0	3559.4	933.4	0.000	0.000	0.003	0.818	43427	34.5	0.037	4	23.6	152.1	4.7	0.026	NA	NA	160m.my5740_rel_lto.cy10a1_4g_gcp_c2s30
1151798	0	0	0.0	3412.3	937.7	0.000	0.000	0.003	0.834	35297	33.7	0.031	4	23.6	152.1	4.7	0.031	NA	NA	160m.my5740_rel_lto.cy10a2_4g_gcp_c2s30
1135461	0	0	0.0	3499.6	912.1	0.000	0.000	0.003	0.823	38394	33.0	0.034	4	23.6	152.1	4.7	0.030	NA	NA	160m.my5740_rel_lto.cy10a3_4g_gcp_c2s30
l.i1
l.i1: continue load after secondary indexes created
Performance metrics for all DBMS, not just the ones listed above. Some are normalized by throughput, others are not. Legend for results is here.
ips	qps	rps	rmbps	wps	wmbps	rpq	rkbpq	wpi	wkbpi	csps	cpups	cspq	cpupq	dbgb1	dbgb2	rss	maxop	p50	p99	tag
14164	0	2	0.6	14620.9	449.0	0.000	0.040	1.032	32.462	134009	35.3	9.461	374	41.0	175.8	4.7	5.155	1799	150	160m.my5740_rel_lto.cy10a_4g_gcp_c2s30
16330	0	2	0.6	14173.8	468.7	0.000	0.036	0.868	29.391	168677	42.7	10.329	392	41.0	175.6	4.6	3.240	2098	150	160m.my5740_rel_lto.cy10a1_4g_gcp_c2s30
12837	0	2	0.5	14372.0	450.1	0.000	0.040	1.120	35.906	125770	32.3	9.798	377	41.1	176.0	4.7	3.521	1648	150	160m.my5740_rel_lto.cy10a2_4g_gcp_c2s30
13175	0	2	0.5	14855.9	462.5	0.000	0.039	1.128	35.946	129866	33.2	9.857	378	41.1	176.0	4.7	0.770	1698	150	160m.my5740_rel_lto.cy10a3_4g_gcp_c2s30
q100.1
q100.1: range queries with 100 insert/s per client
Performance metrics for all DBMS, not just the ones listed above. Some are normalized by throughput, others are not. Legend for results is here.
ips	qps	rps	rmbps	wps	wmbps	rpq	rkbpq	wpi	wkbpi	csps	cpups	cspq	cpupq	dbgb1	dbgb2	rss	maxop	p50	p99	tag
786	3257	9	0.3	17696.8	421.7	0.003	0.101	22.504	549.108	116510	15.4	35.771	709	41.0	175.8	4.6	0.277	432	96	160m.my5740_rel_lto.cy10a_4g_gcp_c2s30
784	3653	10	0.3	16823.1	420.6	0.003	0.085	21.450	549.189	121679	16.7	33.311	686	41.0	175.6	4.6	0.758	480	64	160m.my5740_rel_lto.cy10a1_4g_gcp_c2s30
788	2900	12	0.4	17226.2	422.6	0.004	0.129	21.858	549.071	112875	14.6	38.920	755	41.1	176.0	4.6	0.189	384	96	160m.my5740_rel_lto.cy10a2_4g_gcp_c2s30
789	2895	11	0.3	17249.0	416.9	0.004	0.112	21.873	541.402	112668	14.6	38.917	756	41.1	176.0	4.6	0.290	384	96	160m.my5740_rel_lto.cy10a3_4g_gcp_c2s30
q500.1
q500.1: range queries with 500 insert/s per client
Performance metrics for all DBMS, not just the ones listed above. Some are normalized by throughput, others are not. Legend for results is here.
ips	qps	rps	rmbps	wps	wmbps	rpq	rkbpq	wpi	wkbpi	csps	cpups	cspq	cpupq	dbgb1	dbgb2	rss	maxop	p50	p99	tag
3947	2440	55	1.2	17272.1	427.1	0.022	0.487	4.376	110.807	116510	17.5	47.760	1076	41.0	175.8	4.6	0.143	304	256	160m.my5740_rel_lto.cy10a_4g_gcp_c2s30
3932	2581	64	1.2	16777.1	434.5	0.025	0.489	4.267	113.151	124296	18.7	48.158	1087	41.0	175.6	4.6	1.543	336	32	160m.my5740_rel_lto.cy10a1_4g_gcp_c2s30
3965	2344	50	1.0	16877.5	430.3	0.021	0.447	4.257	111.145	115464	17.2	49.259	1101	41.1	176.0	4.6	0.154	288	240	160m.my5740_rel_lto.cy10a2_4g_gcp_c2s30
3969	2267	44	0.9	16525.2	415.6	0.019	0.423	4.163	107.215	112628	16.9	49.691	1118	41.1	176.0	4.6	0.160	288	224	160m.my5740_rel_lto.cy10a3_4g_gcp_c2s30
q1000.1
q1000.1: range queries with 1000 insert/s per client
Performance metrics for all DBMS, not just the ones listed above. Some are normalized by throughput, others are not. Legend for results is here.
ips	qps	rps	rmbps	wps	wmbps	rpq	rkbpq	wpi	wkbpi	csps	cpups	cspq	cpupq	dbgb1	dbgb2	rss	maxop	p50	p99	tag
7882	1275	77	1.5	16619.1	437.2	0.060	1.227	2.109	56.806	129851	24.2	101.812	2846	41.3	176.4	4.6	0.488	160	96	160m.my5740_rel_lto.cy10a_4g_gcp_c2s30
7869	1394	93	1.9	16529.8	452.6	0.067	1.401	2.101	58.893	143595	25.6	102.987	2754	41.2	176.1	4.6	1.577	176	80	160m.my5740_rel_lto.cy10a1_4g_gcp_c2s30
7890	1187	90	1.8	15970.2	430.9	0.076	1.531	2.024	55.925	130022	24.1	109.575	3047	41.5	176.8	4.6	0.560	144	64	160m.my5740_rel_lto.cy10a2_4g_gcp_c2s30
7890	1169	59	1.2	16159.3	425.6	0.050	1.010	2.048	55.232	125483	22.6	107.315	2899	41.5	176.8	4.6	0.373	144	80	160m.my5740_rel_lto.cy10a3_4g_gcp_c2s30
l.i0
- l.i0: load without secondary indexes
- Legend for results is here.
- Each entry lists the percentage of responses that fit in that bucket (slower than max time for previous bucket, faster than min time for next bucket).
Insert response time histogram
256us	1ms	4ms	16ms	64ms	256ms	1s	4s	16s	gt	max	tag
0.000	87.532	12.210	0.219	0.025	0.014	0.001	0.000	0.000	0.000	0.267	my5740_rel_lto.cy10a_4g_gcp_c2s30
0.000	94.679	5.047	0.235	0.025	0.014	0.001	0.000	0.000	0.000	0.267	my5740_rel_lto.cy10a1_4g_gcp_c2s30
0.000	89.475	10.267	0.219	0.025	0.014	0.000	0.000	0.000	0.000	0.234	my5740_rel_lto.cy10a2_4g_gcp_c2s30
0.000	94.528	5.205	0.231	0.022	0.014	0.001	0.000	0.000	0.000	0.260	my5740_rel_lto.cy10a3_4g_gcp_c2s30
l.x
- l.x: create secondary indexes
- Legend for results is here.
- Each entry lists the percentage of responses that fit in that bucket (slower than max time for previous bucket, faster than min time for next bucket).
TODO - determine whether there is data for create index response time
l.i1
- l.i1: continue load after secondary indexes created
- Legend for results is here.
- Each entry lists the percentage of responses that fit in that bucket (slower than max time for previous bucket, faster than min time for next bucket).
Insert response time histogram
256us	1ms	4ms	16ms	64ms	256ms	1s	4s	16s	gt	max	tag
0.000	0.000	2.714	39.310	50.005	7.671	0.296	0.004	0.001	0.000	5.155	my5740_rel_lto.cy10a_4g_gcp_c2s30
0.000	0.000	1.948	52.199	40.350	5.041	0.461	0.003	0.000	0.000	3.240	my5740_rel_lto.cy10a1_4g_gcp_c2s30
0.000	0.000	2.813	31.148	57.043	8.658	0.336	0.002	0.000	0.000	3.521	my5740_rel_lto.cy10a2_4g_gcp_c2s30
0.000	0.000	2.778	31.924	56.945	8.041	0.311	0.000	0.000	0.000	0.770	my5740_rel_lto.cy10a3_4g_gcp_c2s30
Delete response time histogram
256us	1ms	4ms	16ms	64ms	256ms	1s	4s	16s	gt	max	tag
0.000	0.001	4.039	42.156	47.777	5.976	0.051	0.001	0.000	0.000	2.380	my5740_rel_lto.cy10a_4g_gcp_c2s30
0.000	nonzero	3.341	55.072	37.739	3.640	0.205	0.002	0.000	0.000	2.396	my5740_rel_lto.cy10a1_4g_gcp_c2s30
0.000	nonzero	4.085	34.017	55.020	6.825	0.053	0.001	0.000	0.000	2.921	my5740_rel_lto.cy10a2_4g_gcp_c2s30
0.000	0.001	4.023	34.830	54.877	6.236	0.034	0.000	0.000	0.000	0.516	my5740_rel_lto.cy10a3_4g_gcp_c2s30
q100.1
- q100.1: range queries with 100 insert/s per client
- Legend for results is here.
- Each entry lists the percentage of responses that fit in that bucket (slower than max time for previous bucket, faster than min time for next bucket).
Query response time histogram
256us	1ms	4ms	16ms	64ms	256ms	1s	4s	16s	gt	max	tag
39.352	27.653	12.333	18.035	2.622	0.005	nonzero	0.000	0.000	0.000	0.277	my5740_rel_lto.cy10a_4g_gcp_c2s30
39.960	31.905	10.432	15.317	2.363	0.021	0.001	0.000	0.000	0.000	0.758	my5740_rel_lto.cy10a1_4g_gcp_c2s30
38.547	26.170	11.719	20.568	2.988	0.008	0.000	0.000	0.000	0.000	0.189	my5740_rel_lto.cy10a2_4g_gcp_c2s30
38.290	26.215	11.714	20.828	2.945	0.007	nonzero	0.000	0.000	0.000	0.290	my5740_rel_lto.cy10a3_4g_gcp_c2s30
Insert response time histogram
256us	1ms	4ms	16ms	64ms	256ms	1s	4s	16s	gt	max	tag
0.000	0.000	29.906	52.667	17.378	0.049	0.000	0.000	0.000	0.000	0.139	my5740_rel_lto.cy10a_4g_gcp_c2s30
0.000	0.000	33.177	48.708	17.444	0.580	0.090	0.000	0.000	0.000	0.557	my5740_rel_lto.cy10a1_4g_gcp_c2s30
0.000	0.000	22.521	46.840	30.368	0.260	0.010	0.000	0.000	0.000	0.374	my5740_rel_lto.cy10a2_4g_gcp_c2s30
0.000	0.000	24.045	49.090	26.674	0.188	0.003	0.000	0.000	0.000	0.292	my5740_rel_lto.cy10a3_4g_gcp_c2s30
Delete response time histogram
256us	1ms	4ms	16ms	64ms	256ms	1s	4s	16s	gt	max	tag
0.000	0.000	31.344	52.212	16.399	0.045	0.000	0.000	0.000	0.000	0.186	my5740_rel_lto.cy10a_4g_gcp_c2s30
0.000	0.000	34.785	48.170	16.399	0.566	0.080	0.000	0.000	0.000	0.683	my5740_rel_lto.cy10a1_4g_gcp_c2s30
0.000	0.000	23.757	46.899	29.153	0.188	0.003	0.000	0.000	0.000	0.279	my5740_rel_lto.cy10a2_4g_gcp_c2s30
0.000	0.000	25.368	49.135	25.361	0.132	0.003	0.000	0.000	0.000	0.297	my5740_rel_lto.cy10a3_4g_gcp_c2s30
q500.1
- q500.1: range queries with 500 insert/s per client
- Legend for results is here.
- Each entry lists the percentage of responses that fit in that bucket (slower than max time for previous bucket, faster than min time for next bucket).
Query response time histogram
256us	1ms	4ms	16ms	64ms	256ms	1s	4s	16s	gt	max	tag
27.612	30.580	14.390	23.324	4.076	0.017	0.000	0.000	0.000	0.000	0.143	my5740_rel_lto.cy10a_4g_gcp_c2s30
27.951	35.169	12.257	20.615	3.964	0.041	0.003	nonzero	0.000	0.000	1.543	my5740_rel_lto.cy10a1_4g_gcp_c2s30
27.820	29.911	13.791	23.988	4.473	0.017	0.000	0.000	0.000	0.000	0.154	my5740_rel_lto.cy10a2_4g_gcp_c2s30
27.174	30.189	13.366	24.482	4.769	0.019	0.000	0.000	0.000	0.000	0.160	my5740_rel_lto.cy10a3_4g_gcp_c2s30
Insert response time histogram
256us	1ms	4ms	16ms	64ms	256ms	1s	4s	16s	gt	max	tag
0.000	0.000	26.009	54.800	19.129	0.062	0.000	0.000	0.000	0.000	0.140	my5740_rel_lto.cy10a_4g_gcp_c2s30
0.000	0.000	25.582	52.047	21.426	0.801	0.128	0.015	0.000	0.000	1.693	my5740_rel_lto.cy10a1_4g_gcp_c2s30
0.000	0.000	28.797	54.107	17.057	0.040	0.000	0.000	0.000	0.000	0.119	my5740_rel_lto.cy10a2_4g_gcp_c2s30
0.000	0.000	29.492	53.725	16.760	0.022	0.000	0.000	0.000	0.000	0.088	my5740_rel_lto.cy10a3_4g_gcp_c2s30
Delete response time histogram
256us	1ms	4ms	16ms	64ms	256ms	1s	4s	16s	gt	max	tag
0.000	0.000	27.228	54.202	18.522	0.047	0.000	0.000	0.000	0.000	0.139	my5740_rel_lto.cy10a_4g_gcp_c2s30
0.000	0.000	27.144	51.566	20.370	0.774	0.135	0.012	0.000	0.000	1.609	my5740_rel_lto.cy10a1_4g_gcp_c2s30
0.000	0.000	29.874	53.638	16.459	0.030	0.000	0.000	0.000	0.000	0.095	my5740_rel_lto.cy10a2_4g_gcp_c2s30
0.000	0.000	30.179	53.785	16.017	0.019	0.000	0.000	0.000	0.000	0.094	my5740_rel_lto.cy10a3_4g_gcp_c2s30
q1000.1
- q1000.1: range queries with 1000 insert/s per client
- Legend for results is here.
- Each entry lists the percentage of responses that fit in that bucket (slower than max time for previous bucket, faster than min time for next bucket).
Query response time histogram
256us	1ms	4ms	16ms	64ms	256ms	1s	4s	16s	gt	max	tag
14.646	27.691	17.890	28.298	11.128	0.344	0.002	0.000	0.000	0.000	0.488	my5740_rel_lto.cy10a_4g_gcp_c2s30
15.386	31.311	17.122	26.224	9.569	0.378	0.010	nonzero	0.000	0.000	1.577	my5740_rel_lto.cy10a1_4g_gcp_c2s30
14.781	26.949	16.474	29.353	11.916	0.524	0.003	0.000	0.000	0.000	0.560	my5740_rel_lto.cy10a2_4g_gcp_c2s30
14.439	26.226	15.384	30.670	12.987	0.294	nonzero	0.000	0.000	0.000	0.373	my5740_rel_lto.cy10a3_4g_gcp_c2s30
Insert response time histogram
256us	1ms	4ms	16ms	64ms	256ms	1s	4s	16s	gt	max	tag
0.000	0.000	9.113	37.388	49.982	3.453	0.064	0.000	0.000	0.000	0.551	my5740_rel_lto.cy10a_4g_gcp_c2s30
0.000	0.000	9.395	40.579	46.605	3.238	0.180	0.003	0.000	0.000	3.261	my5740_rel_lto.cy10a1_4g_gcp_c2s30
0.000	0.000	8.640	34.083	52.116	5.020	0.141	0.000	0.000	0.000	0.639	my5740_rel_lto.cy10a2_4g_gcp_c2s30
0.000	0.000	14.595	41.225	42.716	1.447	0.018	0.000	0.000	0.000	0.443	my5740_rel_lto.cy10a3_4g_gcp_c2s30
Delete response time histogram
256us	1ms	4ms	16ms	64ms	256ms	1s	4s	16s	gt	max	tag
0.000	0.000	9.784	38.263	49.109	2.807	0.037	0.000	0.000	0.000	0.763	my5740_rel_lto.cy10a_4g_gcp_c2s30
0.000	0.000	10.135	41.565	45.376	2.775	0.146	0.003	0.000	0.000	1.827	my5740_rel_lto.cy10a1_4g_gcp_c2s30
0.000	0.000	8.948	34.731	51.878	4.363	0.081	0.000	0.000	0.000	0.584	my5740_rel_lto.cy10a2_4g_gcp_c2s30
0.000	0.000	15.281	41.796	41.789	1.127	0.007	0.000	0.000	0.000	0.430	my5740_rel_lto.cy10a3_4g_gcp_c2s30