Introduction
This is a report for the insert benchmark with 4000M docs and 8 client(s). It is generated by scripts (bash, awk, sed) and Tufte might not be impressed. An overview of the insert benchmark is here and a short update is here. Below, by DBMS, I mean DBMS+version.config. An example is my8020.c10b40 where my means MySQL, 8020 is version 8.0.20 and c10b40 is the name for the configuration file.
The test server is a c2-standard-30 from GCP with 15 cores, hyperthreads disabled, 120G RAM, XFS + SW RAID 0 on 4 NVMe devices (1.5TB). The benchmark was run with 8 client and there were 1 or 3 connections per client (1 for queries or inserts without rate limits, 1+1 for rate limited inserts+deletes). There are 8 tables, client per table. It loads 4000M rows without secondary indexes, creates secondary indexes, then inserts 80M rows with a delete per insert to avoid growing the table. It then does 3 read+write tests for 1800s each that do queries as fast as possible with 100, 500 and then 1000 inserts/second/client concurrent with the queries and 1000 deletes/second to avoid growing the table. The database is larger than memory.
The tested DBMS are:
- my5651_rel.cy10a_gcp_c2s30 - InnoDB and MySQL 5.6.51, rel build, cy10a_gcp_c2s30 config, compiled with CMAKE_BUILD_TYPE=Release -O2, base config
- my5651_rel.cy10a1_gcp_c2s30 - InnoDB and MySQL 5.6.51, rel build, cy10a_gcp_c2s30 config, compiled with CMAKE_BUILD_TYPE=Release -O2, adds innodb_use_native_aio=off
- my5651_rel.cy10a2_gcp_c2s30 - InnoDB and MySQL 5.6.51, rel build, cy10a_gcp_c2s30 config, compiled with CMAKE_BUILD_TYPE=Release -O2, adds innodb_io_capacity=20k, innodb_io_capacity_max=40k
- my5651_rel.cy10a4_gcp_c2s30 - InnoDB and MySQL 5.6.51, rel build, cy10a_gcp_c2s30 config, compiled with CMAKE_BUILD_TYPE=Release -O2, adds innodb_flush_method=fsync
Contents
- Summary
- l.i0: load without secondary indexes
- l.x: create secondary indexes
- l.i1: continue load after secondary indexes created
- q100.1: range queries with 100 insert/s per client
- q500.1: range queries with 500 insert/s per client
- q1000.1: range queries with 1000 insert/s per client
Summary
The numbers are inserts/s for l.i0 and l.i1, indexed docs (or rows) /s for l.x and queries/s for q*.2. The values are the average rate over the entire test for inserts (IPS) and queries (QPS). The range of values for IPS and QPS is split into 3 parts: bottom 25%, middle 50%, top 25%. Values in the bottom 25% have a red background, values in the top 25% have a green background and values in the middle have no color. A gray background is used for values that can be ignored because the DBMS did not sustain the target insert rate. Red backgrounds are not used when the minimum value is within 80% of the max value.
| dbms | l.i0 | l.x | l.i1 | q100.1 | q500.1 | q1000.1 |
|---|---|---|---|---|---|---|
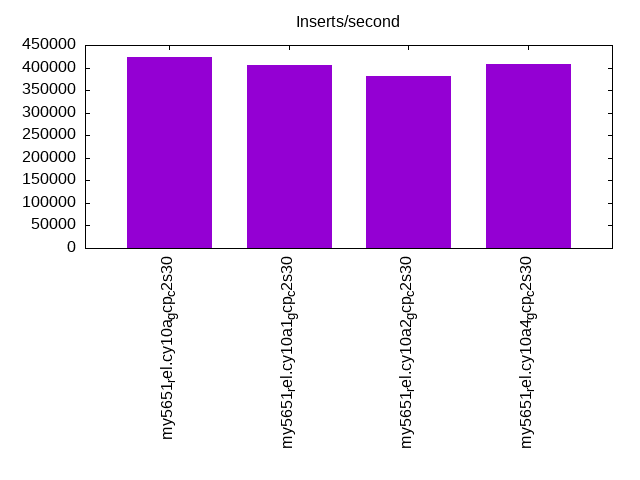
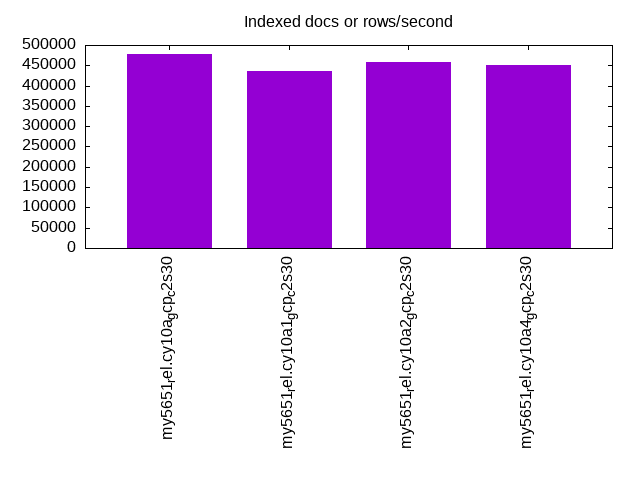
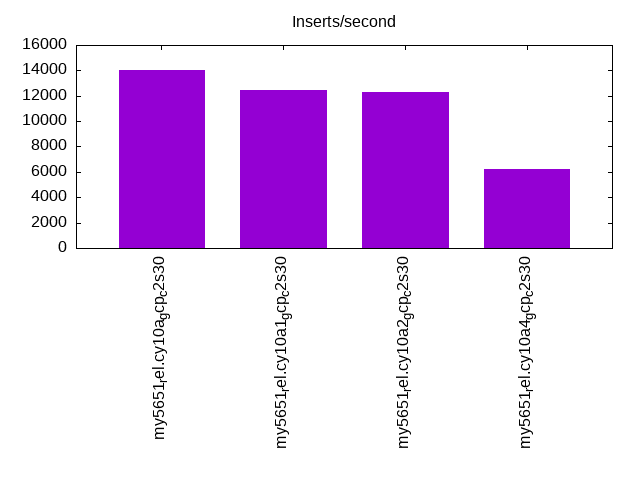
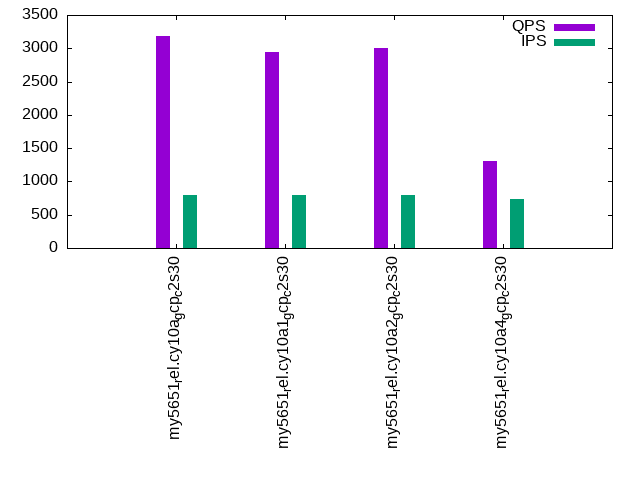
| my5651_rel.cy10a_gcp_c2s30 | 424133 | 478195 | 14035 | 3183 | 3513 | 3362 |
| my5651_rel.cy10a1_gcp_c2s30 | 406752 | 435931 | 12469 | 2942 | 3343 | 3184 |
| my5651_rel.cy10a2_gcp_c2s30 | 380445 | 457939 | 12317 | 3005 | 3369 | 3209 |
| my5651_rel.cy10a4_gcp_c2s30 | 407000 | 451275 | 6238 | 1309 | 1612 | 1330 |
This table has relative throughput, throughput for the DBMS relative to the DBMS in the first line, using the absolute throughput from the previous table. Values less than 0.95 have a yellow background. Values greater than 1.05 have a blue background.
| dbms | l.i0 | l.x | l.i1 | q100.1 | q500.1 | q1000.1 |
|---|---|---|---|---|---|---|
| my5651_rel.cy10a_gcp_c2s30 | 1.00 | 1.00 | 1.00 | 1.00 | 1.00 | 1.00 |
| my5651_rel.cy10a1_gcp_c2s30 | 0.96 | 0.91 | 0.89 | 0.92 | 0.95 | 0.95 |
| my5651_rel.cy10a2_gcp_c2s30 | 0.90 | 0.96 | 0.88 | 0.94 | 0.96 | 0.95 |
| my5651_rel.cy10a4_gcp_c2s30 | 0.96 | 0.94 | 0.44 | 0.41 | 0.46 | 0.40 |
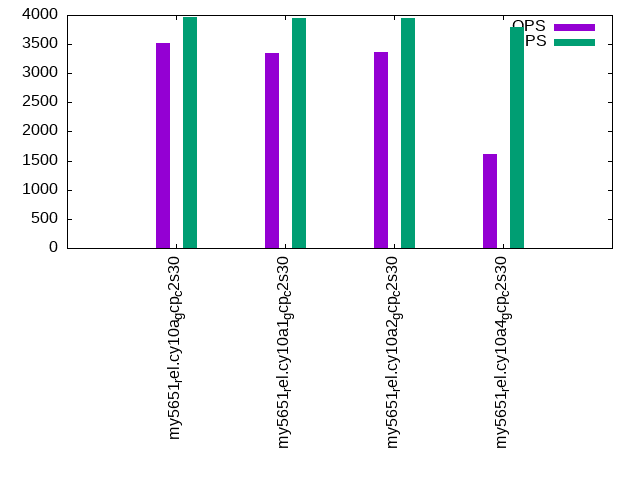
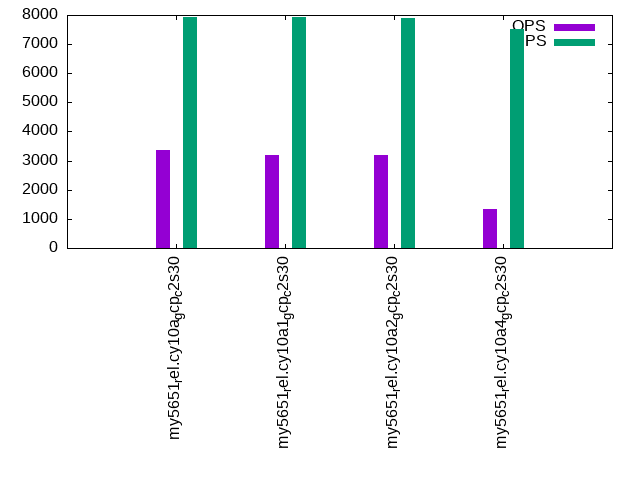
This lists the average rate of inserts/s for the tests that do inserts concurrent with queries. For such tests the query rate is listed in the table above. The read+write tests are setup so that the insert rate should match the target rate every second. Cells that are not at least 95% of the target have a red background to indicate a failure to satisfy the target.
| dbms | q100.1 | q500.1 | q1000.1 |
|---|---|---|---|
| my5651_rel.cy10a_gcp_c2s30 | 789 | 3965 | 7930 |
| my5651_rel.cy10a1_gcp_c2s30 | 789 | 3954 | 7916 |
| my5651_rel.cy10a2_gcp_c2s30 | 789 | 3954 | 7899 |
| my5651_rel.cy10a4_gcp_c2s30 | 734 | 3797 | 7508 |
| target | 800 | 4000 | 8000 |
l.i0
l.i0: load without secondary indexes. Graphs for performance per 1-second interval are here.
Average throughput:
Insert response time histogram: each cell has the percentage of responses that take <= the time in the header and max is the max response time in seconds. For the max column values in the top 25% of the range have a red background and in the bottom 25% of the range have a green background. The red background is not used when the min value is within 80% of the max value.
| dbms | 256us | 1ms | 4ms | 16ms | 64ms | 256ms | 1s | 4s | 16s | gt | max |
|---|---|---|---|---|---|---|---|---|---|---|---|
| my5651_rel.cy10a_gcp_c2s30 | 0.158 | 99.517 | 0.141 | 0.169 | 0.014 | nonzero | nonzero | nonzero | 5.979 | ||
| my5651_rel.cy10a1_gcp_c2s30 | 0.181 | 98.759 | 0.869 | 0.174 | 0.014 | 0.002 | nonzero | nonzero | 11.323 | ||
| my5651_rel.cy10a2_gcp_c2s30 | 0.136 | 98.988 | 0.289 | 0.564 | 0.019 | 0.002 | 0.001 | nonzero | 5.916 | ||
| my5651_rel.cy10a4_gcp_c2s30 | 0.211 | 99.239 | 0.344 | 0.190 | 0.012 | 0.004 | 0.001 | nonzero | 5.616 |
Performance metrics for the DBMS listed above. Some are normalized by throughput, others are not. Legend for results is here.
ips	qps	rps	rmbps	wps	wmbps	rpq	rkbpq	wpi	wkbpi	csps	cpups	cspq	cpupq	dbgb1	dbgb2	rss	maxop	p50	p99	tag
424133	0	3330	13.0	2021.6	119.1	0.008	0.031	0.005	0.287	89571	42.6	0.211	15	263.1	391.6	85.7	5.979	54141	13898	4000m.my5651_rel.cy10a_gcp_c2s30
406752	0	3185	12.4	375.4	111.0	0.008	0.031	0.001	0.279	84974	40.6	0.209	15	263.1	391.6	85.7	11.323	53542	0	4000m.my5651_rel.cy10a1_gcp_c2s30
380445	0	2980	11.6	1846.0	107.7	0.008	0.031	0.005	0.290	81170	39.1	0.213	15	263.1	391.6	85.7	5.916	52244	0	4000m.my5651_rel.cy10a2_gcp_c2s30
407000	0	3188	12.5	419.6	108.6	0.008	0.031	0.001	0.273	89432	41.5	0.220	15	263.1	391.6	85.7	5.616	52843	0	4000m.my5651_rel.cy10a4_gcp_c2s30
l.x
l.x: create secondary indexes.
Average throughput:
Performance metrics for the DBMS listed above. Some are normalized by throughput, others are not. Legend for results is here.
ips	qps	rps	rmbps	wps	wmbps	rpq	rkbpq	wpi	wkbpi	csps	cpups	cspq	cpupq	dbgb1	dbgb2	rss	maxop	p50	p99	tag
478195	0	2714	349.3	5299.5	594.0	0.006	0.748	0.011	1.272	14859	33.0	0.031	10	542.2	670.7	85.7	0.002	NA	NA	4000m.my5651_rel.cy10a_gcp_c2s30
435931	0	1095	380.3	2411.3	524.6	0.003	0.893	0.006	1.232	10799	33.2	0.025	11	542.2	670.7	85.7	0.002	NA	NA	4000m.my5651_rel.cy10a1_gcp_c2s30
457939	0	2595	381.0	4514.0	550.2	0.006	0.852	0.010	1.230	11723	32.9	0.026	11	542.2	670.7	85.7	0.002	NA	NA	4000m.my5651_rel.cy10a2_gcp_c2s30
451275	0	1059	380.6	2431.8	531.0	0.002	0.864	0.005	1.205	18314	33.4	0.041	11	542.2	670.7	85.7	0.003	NA	NA	4000m.my5651_rel.cy10a4_gcp_c2s30
l.i1
l.i1: continue load after secondary indexes created. Graphs for performance per 1-second interval are here.
Average throughput:
Insert response time histogram: each cell has the percentage of responses that take <= the time in the header and max is the max response time in seconds. For the max column values in the top 25% of the range have a red background and in the bottom 25% of the range have a green background. The red background is not used when the min value is within 80% of the max value.
| dbms | 256us | 1ms | 4ms | 16ms | 64ms | 256ms | 1s | 4s | 16s | gt | max |
|---|---|---|---|---|---|---|---|---|---|---|---|
| my5651_rel.cy10a_gcp_c2s30 | 0.904 | 59.370 | 28.048 | 11.558 | 0.119 | 0.001 | nonzero | 4.794 | |||
| my5651_rel.cy10a1_gcp_c2s30 | 1.244 | 54.555 | 31.108 | 12.752 | 0.340 | nonzero | nonzero | 4.634 | |||
| my5651_rel.cy10a2_gcp_c2s30 | 1.654 | 51.832 | 33.421 | 12.786 | 0.306 | nonzero | nonzero | 4.805 | |||
| my5651_rel.cy10a4_gcp_c2s30 | 3.477 | 44.458 | 28.958 | 16.567 | 6.522 | 0.017 | 3.651 |
Delete response time histogram: each cell has the percentage of responses that take <= the time in the header and max is the max response time in seconds. For the max column values in the top 25% of the range have a red background and in the bottom 25% of the range have a green background. The red background is not used when the min value is within 80% of the max value.
| dbms | 256us | 1ms | 4ms | 16ms | 64ms | 256ms | 1s | 4s | 16s | gt | max |
|---|---|---|---|---|---|---|---|---|---|---|---|
| my5651_rel.cy10a_gcp_c2s30 | 6.144 | 81.264 | 12.463 | 0.127 | 0.001 | 0.001 | nonzero | 4.080 | |||
| my5651_rel.cy10a1_gcp_c2s30 | 8.205 | 75.625 | 16.000 | 0.169 | nonzero | nonzero | 3.948 | ||||
| my5651_rel.cy10a2_gcp_c2s30 | 8.022 | 73.389 | 18.365 | 0.224 | nonzero | nonzero | nonzero | 4.013 | |||
| my5651_rel.cy10a4_gcp_c2s30 | 12.832 | 58.379 | 25.727 | 3.045 | 0.015 | 0.001 | 2.649 |
Performance metrics for the DBMS listed above. Some are normalized by throughput, others are not. Legend for results is here.
ips	qps	rps	rmbps	wps	wmbps	rpq	rkbpq	wpi	wkbpi	csps	cpups	cspq	cpupq	dbgb1	dbgb2	rss	maxop	p50	p99	tag
14035	0	14160	215.8	26901.3	679.9	1.009	15.748	1.917	49.606	110393	23.9	7.866	255	812.6	979.6	85.7	4.794	849	250	4000m.my5651_rel.cy10a_gcp_c2s30
12469	0	12147	190.0	22833.4	580.3	0.974	15.603	1.831	47.657	106446	20.8	8.537	250	812.7	980.7	85.7	4.634	699	200	4000m.my5651_rel.cy10a1_gcp_c2s30
12317	0	12622	192.4	25969.0	613.0	1.025	15.997	2.108	50.962	103627	20.3	8.413	247	812.8	979.3	85.7	4.805	749	200	4000m.my5651_rel.cy10a2_gcp_c2s30
6238	0	6142	175.0	9647.9	283.1	0.985	28.718	1.547	46.468	85476	13.1	13.702	315	812.7	980.6	85.7	3.651	250	50	4000m.my5651_rel.cy10a4_gcp_c2s30
q100.1
q100.1: range queries with 100 insert/s per client. Graphs for performance per 1-second interval are here.
Average throughput:
Query response time histogram: each cell has the percentage of responses that take <= the time in the header and max is the max response time in seconds. For max values in the top 25% of the range have a red background and in the bottom 25% of the range have a green background. The red background is not used when the min value is within 80% of the max value.
| dbms | 256us | 1ms | 4ms | 16ms | 64ms | 256ms | 1s | 4s | 16s | gt | max |
|---|---|---|---|---|---|---|---|---|---|---|---|
| my5651_rel.cy10a_gcp_c2s30 | 37.880 | 3.009 | 35.165 | 23.892 | 0.053 | nonzero | 0.082 | ||||
| my5651_rel.cy10a1_gcp_c2s30 | 38.068 | 2.536 | 33.970 | 25.095 | 0.330 | nonzero | 0.141 | ||||
| my5651_rel.cy10a2_gcp_c2s30 | 38.071 | 2.677 | 34.348 | 24.633 | 0.271 | nonzero | 0.089 | ||||
| my5651_rel.cy10a4_gcp_c2s30 | 37.384 | 3.334 | 26.644 | 21.593 | 11.011 | 0.034 | 0.205 |
Insert response time histogram: each cell has the percentage of responses that take <= the time in the header and max is the max response time in seconds. For max values in the top 25% of the range have a red background and in the bottom 25% of the range have a green background. The red background is not used when the min value is within 80% of the max value.
| dbms | 256us | 1ms | 4ms | 16ms | 64ms | 256ms | 1s | 4s | 16s | gt | max |
|---|---|---|---|---|---|---|---|---|---|---|---|
| my5651_rel.cy10a_gcp_c2s30 | 18.715 | 74.146 | 7.139 | 0.058 | |||||||
| my5651_rel.cy10a1_gcp_c2s30 | 20.444 | 72.319 | 7.233 | 0.003 | 0.082 | ||||||
| my5651_rel.cy10a2_gcp_c2s30 | 20.983 | 71.639 | 7.378 | 0.062 | |||||||
| my5651_rel.cy10a4_gcp_c2s30 | 17.889 | 52.243 | 28.569 | 1.295 | 0.003 | 0.261 |
Delete response time histogram: each cell has the percentage of responses that take <= the time in the header and max is the max response time in seconds. For max values in the top 25% of the range have a red background and in the bottom 25% of the range have a green background. The red background is not used when the min value is within 80% of the max value.
| dbms | 256us | 1ms | 4ms | 16ms | 64ms | 256ms | 1s | 4s | 16s | gt | max |
|---|---|---|---|---|---|---|---|---|---|---|---|
| my5651_rel.cy10a_gcp_c2s30 | 20.562 | 72.771 | 6.667 | 0.054 | |||||||
| my5651_rel.cy10a1_gcp_c2s30 | 22.493 | 70.812 | 6.681 | 0.014 | 0.083 | ||||||
| my5651_rel.cy10a2_gcp_c2s30 | 23.073 | 69.892 | 7.035 | 0.059 | |||||||
| my5651_rel.cy10a4_gcp_c2s30 | 19.326 | 51.993 | 27.503 | 1.167 | 0.010 | 0.316 |
Performance metrics for the DBMS listed above. Some are normalized by throughput, others are not. Legend for results is here.
ips	qps	rps	rmbps	wps	wmbps	rpq	rkbpq	wpi	wkbpi	csps	cpups	cspq	cpupq	dbgb1	dbgb2	rss	maxop	p50	p99	tag
789	3183	24350	380.1	20926.0	432.5	7.650	122.296	26.522	561.291	106329	17.7	33.406	834	812.6	979.6	85.7	0.082	416	208	4000m.my5651_rel.cy10a_gcp_c2s30
789	2942	21924	355.5	17861.0	417.9	7.451	123.734	22.649	542.692	99786	16.2	33.914	826	812.7	980.7	85.7	0.141	384	176	4000m.my5651_rel.cy10a1_gcp_c2s30
789	3005	23513	367.1	19909.7	425.8	7.825	125.085	25.247	552.895	101713	16.4	33.849	819	812.8	979.3	85.7	0.089	400	192	4000m.my5651_rel.cy10a2_gcp_c2s30
734	1309	9166	690.3	8072.2	205.2	7.002	539.998	10.993	286.190	76722	12.8	58.611	1467	812.7	980.7	85.7	0.205	176	64	4000m.my5651_rel.cy10a4_gcp_c2s30
q500.1
q500.1: range queries with 500 insert/s per client. Graphs for performance per 1-second interval are here.
Average throughput:
Query response time histogram: each cell has the percentage of responses that take <= the time in the header and max is the max response time in seconds. For max values in the top 25% of the range have a red background and in the bottom 25% of the range have a green background. The red background is not used when the min value is within 80% of the max value.
| dbms | 256us | 1ms | 4ms | 16ms | 64ms | 256ms | 1s | 4s | 16s | gt | max |
|---|---|---|---|---|---|---|---|---|---|---|---|
| my5651_rel.cy10a_gcp_c2s30 | 38.305 | 3.475 | 38.797 | 19.398 | 0.024 | nonzero | 0.079 | ||||
| my5651_rel.cy10a1_gcp_c2s30 | 38.662 | 2.909 | 39.001 | 19.244 | 0.184 | nonzero | 0.100 | ||||
| my5651_rel.cy10a2_gcp_c2s30 | 38.495 | 3.180 | 38.692 | 19.471 | 0.162 | nonzero | 0.081 | ||||
| my5651_rel.cy10a4_gcp_c2s30 | 38.534 | 3.710 | 29.592 | 19.763 | 8.375 | 0.025 | nonzero | 1.306 |
Insert response time histogram: each cell has the percentage of responses that take <= the time in the header and max is the max response time in seconds. For max values in the top 25% of the range have a red background and in the bottom 25% of the range have a green background. The red background is not used when the min value is within 80% of the max value.
| dbms | 256us | 1ms | 4ms | 16ms | 64ms | 256ms | 1s | 4s | 16s | gt | max |
|---|---|---|---|---|---|---|---|---|---|---|---|
| my5651_rel.cy10a_gcp_c2s30 | 41.917 | 55.125 | 2.958 | 0.061 | |||||||
| my5651_rel.cy10a1_gcp_c2s30 | 50.117 | 47.387 | 2.479 | 0.017 | 0.001 | 0.259 | |||||
| my5651_rel.cy10a2_gcp_c2s30 | 49.664 | 47.658 | 2.676 | 0.001 | 0.065 | ||||||
| my5651_rel.cy10a4_gcp_c2s30 | 34.874 | 50.087 | 14.464 | 0.566 | 0.007 | 0.002 | 1.317 |
Delete response time histogram: each cell has the percentage of responses that take <= the time in the header and max is the max response time in seconds. For max values in the top 25% of the range have a red background and in the bottom 25% of the range have a green background. The red background is not used when the min value is within 80% of the max value.
| dbms | 256us | 1ms | 4ms | 16ms | 64ms | 256ms | 1s | 4s | 16s | gt | max |
|---|---|---|---|---|---|---|---|---|---|---|---|
| my5651_rel.cy10a_gcp_c2s30 | 49.202 | 48.400 | 2.398 | 0.062 | |||||||
| my5651_rel.cy10a1_gcp_c2s30 | 58.396 | 39.617 | 1.969 | 0.018 | 0.226 | ||||||
| my5651_rel.cy10a2_gcp_c2s30 | 56.376 | 41.294 | 2.327 | 0.003 | 0.067 | ||||||
| my5651_rel.cy10a4_gcp_c2s30 | 38.224 | 47.787 | 13.473 | 0.503 | 0.012 | 0.002 | 1.319 |
Performance metrics for the DBMS listed above. Some are normalized by throughput, others are not. Legend for results is here.
ips	qps	rps	rmbps	wps	wmbps	rpq	rkbpq	wpi	wkbpi	csps	cpups	cspq	cpupq	dbgb1	dbgb2	rss	maxop	p50	p99	tag
3965	3513	25385	395.1	17897.8	376.7	7.226	115.159	4.514	97.304	106839	20.1	30.412	858	812.6	979.6	85.7	0.079	448	384	4000m.my5651_rel.cy10a_gcp_c2s30
3954	3343	23842	377.4	15168.5	364.5	7.133	115.618	3.836	94.392	101571	18.6	30.387	835	812.7	980.7	85.7	0.100	416	368	4000m.my5651_rel.cy10a1_gcp_c2s30
3954	3369	24746	385.1	17080.9	375.7	7.345	117.043	4.320	97.303	103297	18.7	30.658	833	812.8	979.3	85.7	0.081	432	368	4000m.my5651_rel.cy10a2_gcp_c2s30
3797	1612	10736	785.1	7863.2	194.1	6.659	498.601	2.071	52.334	80835	16.0	50.133	1488	812.9	981.2	85.7	1.306	208	128	4000m.my5651_rel.cy10a4_gcp_c2s30
q1000.1
q1000.1: range queries with 1000 insert/s per client. Graphs for performance per 1-second interval are here.
Average throughput:
Query response time histogram: each cell has the percentage of responses that take <= the time in the header and max is the max response time in seconds. For max values in the top 25% of the range have a red background and in the bottom 25% of the range have a green background. The red background is not used when the min value is within 80% of the max value.
| dbms | 256us | 1ms | 4ms | 16ms | 64ms | 256ms | 1s | 4s | 16s | gt | max |
|---|---|---|---|---|---|---|---|---|---|---|---|
| my5651_rel.cy10a_gcp_c2s30 | 37.854 | 3.013 | 37.892 | 21.192 | 0.049 | 0.001 | 0.098 | ||||
| my5651_rel.cy10a1_gcp_c2s30 | 38.277 | 2.512 | 37.482 | 21.499 | 0.229 | nonzero | 0.103 | ||||
| my5651_rel.cy10a2_gcp_c2s30 | 38.006 | 2.770 | 37.574 | 21.439 | 0.211 | 0.001 | 0.102 | ||||
| my5651_rel.cy10a4_gcp_c2s30 | 37.564 | 3.574 | 28.240 | 19.511 | 10.990 | 0.120 | 0.001 | nonzero | 1.514 |
Insert response time histogram: each cell has the percentage of responses that take <= the time in the header and max is the max response time in seconds. For max values in the top 25% of the range have a red background and in the bottom 25% of the range have a green background. The red background is not used when the min value is within 80% of the max value.
| dbms | 256us | 1ms | 4ms | 16ms | 64ms | 256ms | 1s | 4s | 16s | gt | max |
|---|---|---|---|---|---|---|---|---|---|---|---|
| my5651_rel.cy10a_gcp_c2s30 | 31.002 | 64.813 | 4.183 | 0.002 | nonzero | 0.299 | |||||
| my5651_rel.cy10a1_gcp_c2s30 | 56.101 | 41.830 | 2.067 | 0.001 | 0.093 | ||||||
| my5651_rel.cy10a2_gcp_c2s30 | 42.506 | 53.941 | 3.548 | 0.006 | 0.216 | ||||||
| my5651_rel.cy10a4_gcp_c2s30 | 31.333 | 47.564 | 19.868 | 1.220 | 0.013 | 0.002 | 1.490 |
Delete response time histogram: each cell has the percentage of responses that take <= the time in the header and max is the max response time in seconds. For max values in the top 25% of the range have a red background and in the bottom 25% of the range have a green background. The red background is not used when the min value is within 80% of the max value.
| dbms | 256us | 1ms | 4ms | 16ms | 64ms | 256ms | 1s | 4s | 16s | gt | max |
|---|---|---|---|---|---|---|---|---|---|---|---|
| my5651_rel.cy10a_gcp_c2s30 | 36.843 | 59.622 | 3.531 | 0.003 | nonzero | 0.333 | |||||
| my5651_rel.cy10a1_gcp_c2s30 | 63.164 | 35.107 | 1.725 | 0.004 | 0.102 | ||||||
| my5651_rel.cy10a2_gcp_c2s30 | 48.955 | 47.941 | 3.093 | 0.010 | 0.193 | ||||||
| my5651_rel.cy10a4_gcp_c2s30 | 33.217 | 46.300 | 19.309 | 1.152 | 0.020 | 0.002 | 1.526 |
Performance metrics for the DBMS listed above. Some are normalized by throughput, others are not. Legend for results is here.
ips	qps	rps	rmbps	wps	wmbps	rpq	rkbpq	wpi	wkbpi	csps	cpups	cspq	cpupq	dbgb1	dbgb2	rss	maxop	p50	p99	tag
7930	3362	24500	379.8	20512.3	424.5	7.288	115.676	2.587	54.817	115497	22.6	34.356	1008	812.9	980.5	85.7	0.098	432	368	4000m.my5651_rel.cy10a_gcp_c2s30
7916	3184	22800	359.9	17313.0	406.5	7.160	115.751	2.187	52.580	105863	20.2	33.247	952	813.0	981.7	85.7	0.103	400	336	4000m.my5651_rel.cy10a1_gcp_c2s30
7899	3209	23702	367.3	19374.1	424.7	7.387	117.216	2.453	55.054	109443	20.9	34.107	977	813.2	980.4	85.7	0.102	400	352	4000m.my5651_rel.cy10a2_gcp_c2s30
7508	1330	9258	675.4	8514.4	211.8	6.961	520.040	1.134	28.888	84004	17.9	63.166	2019	813.9	983.2	85.7	1.514	176	64	4000m.my5651_rel.cy10a4_gcp_c2s30
l.i0
l.i0: load without secondary indexes
Performance metrics for all DBMS, not just the ones listed above. Some are normalized by throughput, others are not. Legend for results is here.
ips	qps	rps	rmbps	wps	wmbps	rpq	rkbpq	wpi	wkbpi	csps	cpups	cspq	cpupq	dbgb1	dbgb2	rss	maxop	p50	p99	tag
424133	0	3330	13.0	2021.6	119.1	0.008	0.031	0.005	0.287	89571	42.6	0.211	15	263.1	391.6	85.7	5.979	54141	13898	4000m.my5651_rel.cy10a_gcp_c2s30
406752	0	3185	12.4	375.4	111.0	0.008	0.031	0.001	0.279	84974	40.6	0.209	15	263.1	391.6	85.7	11.323	53542	0	4000m.my5651_rel.cy10a1_gcp_c2s30
380445	0	2980	11.6	1846.0	107.7	0.008	0.031	0.005	0.290	81170	39.1	0.213	15	263.1	391.6	85.7	5.916	52244	0	4000m.my5651_rel.cy10a2_gcp_c2s30
407000	0	3188	12.5	419.6	108.6	0.008	0.031	0.001	0.273	89432	41.5	0.220	15	263.1	391.6	85.7	5.616	52843	0	4000m.my5651_rel.cy10a4_gcp_c2s30
l.x
l.x: create secondary indexes
Performance metrics for all DBMS, not just the ones listed above. Some are normalized by throughput, others are not. Legend for results is here.
ips	qps	rps	rmbps	wps	wmbps	rpq	rkbpq	wpi	wkbpi	csps	cpups	cspq	cpupq	dbgb1	dbgb2	rss	maxop	p50	p99	tag
478195	0	2714	349.3	5299.5	594.0	0.006	0.748	0.011	1.272	14859	33.0	0.031	10	542.2	670.7	85.7	0.002	NA	NA	4000m.my5651_rel.cy10a_gcp_c2s30
435931	0	1095	380.3	2411.3	524.6	0.003	0.893	0.006	1.232	10799	33.2	0.025	11	542.2	670.7	85.7	0.002	NA	NA	4000m.my5651_rel.cy10a1_gcp_c2s30
457939	0	2595	381.0	4514.0	550.2	0.006	0.852	0.010	1.230	11723	32.9	0.026	11	542.2	670.7	85.7	0.002	NA	NA	4000m.my5651_rel.cy10a2_gcp_c2s30
451275	0	1059	380.6	2431.8	531.0	0.002	0.864	0.005	1.205	18314	33.4	0.041	11	542.2	670.7	85.7	0.003	NA	NA	4000m.my5651_rel.cy10a4_gcp_c2s30
l.i1
l.i1: continue load after secondary indexes created
Performance metrics for all DBMS, not just the ones listed above. Some are normalized by throughput, others are not. Legend for results is here.
ips	qps	rps	rmbps	wps	wmbps	rpq	rkbpq	wpi	wkbpi	csps	cpups	cspq	cpupq	dbgb1	dbgb2	rss	maxop	p50	p99	tag
14035	0	14160	215.8	26901.3	679.9	1.009	15.748	1.917	49.606	110393	23.9	7.866	255	812.6	979.6	85.7	4.794	849	250	4000m.my5651_rel.cy10a_gcp_c2s30
12469	0	12147	190.0	22833.4	580.3	0.974	15.603	1.831	47.657	106446	20.8	8.537	250	812.7	980.7	85.7	4.634	699	200	4000m.my5651_rel.cy10a1_gcp_c2s30
12317	0	12622	192.4	25969.0	613.0	1.025	15.997	2.108	50.962	103627	20.3	8.413	247	812.8	979.3	85.7	4.805	749	200	4000m.my5651_rel.cy10a2_gcp_c2s30
6238	0	6142	175.0	9647.9	283.1	0.985	28.718	1.547	46.468	85476	13.1	13.702	315	812.7	980.6	85.7	3.651	250	50	4000m.my5651_rel.cy10a4_gcp_c2s30
q100.1
q100.1: range queries with 100 insert/s per client
Performance metrics for all DBMS, not just the ones listed above. Some are normalized by throughput, others are not. Legend for results is here.
ips	qps	rps	rmbps	wps	wmbps	rpq	rkbpq	wpi	wkbpi	csps	cpups	cspq	cpupq	dbgb1	dbgb2	rss	maxop	p50	p99	tag
789	3183	24350	380.1	20926.0	432.5	7.650	122.296	26.522	561.291	106329	17.7	33.406	834	812.6	979.6	85.7	0.082	416	208	4000m.my5651_rel.cy10a_gcp_c2s30
789	2942	21924	355.5	17861.0	417.9	7.451	123.734	22.649	542.692	99786	16.2	33.914	826	812.7	980.7	85.7	0.141	384	176	4000m.my5651_rel.cy10a1_gcp_c2s30
789	3005	23513	367.1	19909.7	425.8	7.825	125.085	25.247	552.895	101713	16.4	33.849	819	812.8	979.3	85.7	0.089	400	192	4000m.my5651_rel.cy10a2_gcp_c2s30
734	1309	9166	690.3	8072.2	205.2	7.002	539.998	10.993	286.190	76722	12.8	58.611	1467	812.7	980.7	85.7	0.205	176	64	4000m.my5651_rel.cy10a4_gcp_c2s30
q500.1
q500.1: range queries with 500 insert/s per client
Performance metrics for all DBMS, not just the ones listed above. Some are normalized by throughput, others are not. Legend for results is here.
ips	qps	rps	rmbps	wps	wmbps	rpq	rkbpq	wpi	wkbpi	csps	cpups	cspq	cpupq	dbgb1	dbgb2	rss	maxop	p50	p99	tag
3965	3513	25385	395.1	17897.8	376.7	7.226	115.159	4.514	97.304	106839	20.1	30.412	858	812.6	979.6	85.7	0.079	448	384	4000m.my5651_rel.cy10a_gcp_c2s30
3954	3343	23842	377.4	15168.5	364.5	7.133	115.618	3.836	94.392	101571	18.6	30.387	835	812.7	980.7	85.7	0.100	416	368	4000m.my5651_rel.cy10a1_gcp_c2s30
3954	3369	24746	385.1	17080.9	375.7	7.345	117.043	4.320	97.303	103297	18.7	30.658	833	812.8	979.3	85.7	0.081	432	368	4000m.my5651_rel.cy10a2_gcp_c2s30
3797	1612	10736	785.1	7863.2	194.1	6.659	498.601	2.071	52.334	80835	16.0	50.133	1488	812.9	981.2	85.7	1.306	208	128	4000m.my5651_rel.cy10a4_gcp_c2s30
q1000.1
q1000.1: range queries with 1000 insert/s per client
Performance metrics for all DBMS, not just the ones listed above. Some are normalized by throughput, others are not. Legend for results is here.
ips	qps	rps	rmbps	wps	wmbps	rpq	rkbpq	wpi	wkbpi	csps	cpups	cspq	cpupq	dbgb1	dbgb2	rss	maxop	p50	p99	tag
7930	3362	24500	379.8	20512.3	424.5	7.288	115.676	2.587	54.817	115497	22.6	34.356	1008	812.9	980.5	85.7	0.098	432	368	4000m.my5651_rel.cy10a_gcp_c2s30
7916	3184	22800	359.9	17313.0	406.5	7.160	115.751	2.187	52.580	105863	20.2	33.247	952	813.0	981.7	85.7	0.103	400	336	4000m.my5651_rel.cy10a1_gcp_c2s30
7899	3209	23702	367.3	19374.1	424.7	7.387	117.216	2.453	55.054	109443	20.9	34.107	977	813.2	980.4	85.7	0.102	400	352	4000m.my5651_rel.cy10a2_gcp_c2s30
7508	1330	9258	675.4	8514.4	211.8	6.961	520.040	1.134	28.888	84004	17.9	63.166	2019	813.9	983.2	85.7	1.514	176	64	4000m.my5651_rel.cy10a4_gcp_c2s30
l.i0
- l.i0: load without secondary indexes
- Legend for results is here.
- Each entry lists the percentage of responses that fit in that bucket (slower than max time for previous bucket, faster than min time for next bucket).
Insert response time histogram
256us	1ms	4ms	16ms	64ms	256ms	1s	4s	16s	gt	max	tag
0.000	0.158	99.517	0.141	0.169	0.014	nonzero	nonzero	nonzero	0.000	5.979	my5651_rel.cy10a_gcp_c2s30
0.000	0.181	98.759	0.869	0.174	0.014	0.002	nonzero	nonzero	0.000	11.323	my5651_rel.cy10a1_gcp_c2s30
0.000	0.136	98.988	0.289	0.564	0.019	0.002	0.001	nonzero	0.000	5.916	my5651_rel.cy10a2_gcp_c2s30
0.000	0.211	99.239	0.344	0.190	0.012	0.004	0.001	nonzero	0.000	5.616	my5651_rel.cy10a4_gcp_c2s30
l.x
- l.x: create secondary indexes
- Legend for results is here.
- Each entry lists the percentage of responses that fit in that bucket (slower than max time for previous bucket, faster than min time for next bucket).
TODO - determine whether there is data for create index response time
l.i1
- l.i1: continue load after secondary indexes created
- Legend for results is here.
- Each entry lists the percentage of responses that fit in that bucket (slower than max time for previous bucket, faster than min time for next bucket).
Insert response time histogram
256us	1ms	4ms	16ms	64ms	256ms	1s	4s	16s	gt	max	tag
0.000	0.000	0.904	59.370	28.048	11.558	0.119	0.001	nonzero	0.000	4.794	my5651_rel.cy10a_gcp_c2s30
0.000	0.000	1.244	54.555	31.108	12.752	0.340	nonzero	nonzero	0.000	4.634	my5651_rel.cy10a1_gcp_c2s30
0.000	0.000	1.654	51.832	33.421	12.786	0.306	nonzero	nonzero	0.000	4.805	my5651_rel.cy10a2_gcp_c2s30
0.000	0.000	3.477	44.458	28.958	16.567	6.522	0.017	0.000	0.000	3.651	my5651_rel.cy10a4_gcp_c2s30
Delete response time histogram
256us	1ms	4ms	16ms	64ms	256ms	1s	4s	16s	gt	max	tag
0.000	0.000	6.144	81.264	12.463	0.127	0.001	0.001	nonzero	0.000	4.080	my5651_rel.cy10a_gcp_c2s30
0.000	0.000	8.205	75.625	16.000	0.169	nonzero	nonzero	0.000	0.000	3.948	my5651_rel.cy10a1_gcp_c2s30
0.000	0.000	8.022	73.389	18.365	0.224	nonzero	nonzero	nonzero	0.000	4.013	my5651_rel.cy10a2_gcp_c2s30
0.000	0.000	12.832	58.379	25.727	3.045	0.015	0.001	0.000	0.000	2.649	my5651_rel.cy10a4_gcp_c2s30
q100.1
- q100.1: range queries with 100 insert/s per client
- Legend for results is here.
- Each entry lists the percentage of responses that fit in that bucket (slower than max time for previous bucket, faster than min time for next bucket).
Query response time histogram
256us	1ms	4ms	16ms	64ms	256ms	1s	4s	16s	gt	max	tag
37.880	3.009	35.165	23.892	0.053	nonzero	0.000	0.000	0.000	0.000	0.082	my5651_rel.cy10a_gcp_c2s30
38.068	2.536	33.970	25.095	0.330	nonzero	0.000	0.000	0.000	0.000	0.141	my5651_rel.cy10a1_gcp_c2s30
38.071	2.677	34.348	24.633	0.271	nonzero	0.000	0.000	0.000	0.000	0.089	my5651_rel.cy10a2_gcp_c2s30
37.384	3.334	26.644	21.593	11.011	0.034	0.000	0.000	0.000	0.000	0.205	my5651_rel.cy10a4_gcp_c2s30
Insert response time histogram
256us	1ms	4ms	16ms	64ms	256ms	1s	4s	16s	gt	max	tag
0.000	0.000	18.715	74.146	7.139	0.000	0.000	0.000	0.000	0.000	0.058	my5651_rel.cy10a_gcp_c2s30
0.000	0.000	20.444	72.319	7.233	0.003	0.000	0.000	0.000	0.000	0.082	my5651_rel.cy10a1_gcp_c2s30
0.000	0.000	20.983	71.639	7.378	0.000	0.000	0.000	0.000	0.000	0.062	my5651_rel.cy10a2_gcp_c2s30
0.000	0.000	17.889	52.243	28.569	1.295	0.003	0.000	0.000	0.000	0.261	my5651_rel.cy10a4_gcp_c2s30
Delete response time histogram
256us	1ms	4ms	16ms	64ms	256ms	1s	4s	16s	gt	max	tag
0.000	0.000	20.562	72.771	6.667	0.000	0.000	0.000	0.000	0.000	0.054	my5651_rel.cy10a_gcp_c2s30
0.000	0.000	22.493	70.812	6.681	0.014	0.000	0.000	0.000	0.000	0.083	my5651_rel.cy10a1_gcp_c2s30
0.000	0.000	23.073	69.892	7.035	0.000	0.000	0.000	0.000	0.000	0.059	my5651_rel.cy10a2_gcp_c2s30
0.000	0.000	19.326	51.993	27.503	1.167	0.010	0.000	0.000	0.000	0.316	my5651_rel.cy10a4_gcp_c2s30
q500.1
- q500.1: range queries with 500 insert/s per client
- Legend for results is here.
- Each entry lists the percentage of responses that fit in that bucket (slower than max time for previous bucket, faster than min time for next bucket).
Query response time histogram
256us	1ms	4ms	16ms	64ms	256ms	1s	4s	16s	gt	max	tag
38.305	3.475	38.797	19.398	0.024	nonzero	0.000	0.000	0.000	0.000	0.079	my5651_rel.cy10a_gcp_c2s30
38.662	2.909	39.001	19.244	0.184	nonzero	0.000	0.000	0.000	0.000	0.100	my5651_rel.cy10a1_gcp_c2s30
38.495	3.180	38.692	19.471	0.162	nonzero	0.000	0.000	0.000	0.000	0.081	my5651_rel.cy10a2_gcp_c2s30
38.534	3.710	29.592	19.763	8.375	0.025	0.000	nonzero	0.000	0.000	1.306	my5651_rel.cy10a4_gcp_c2s30
Insert response time histogram
256us	1ms	4ms	16ms	64ms	256ms	1s	4s	16s	gt	max	tag
0.000	0.000	41.917	55.125	2.958	0.000	0.000	0.000	0.000	0.000	0.061	my5651_rel.cy10a_gcp_c2s30
0.000	0.000	50.117	47.387	2.479	0.017	0.001	0.000	0.000	0.000	0.259	my5651_rel.cy10a1_gcp_c2s30
0.000	0.000	49.664	47.658	2.676	0.001	0.000	0.000	0.000	0.000	0.065	my5651_rel.cy10a2_gcp_c2s30
0.000	0.000	34.874	50.087	14.464	0.566	0.007	0.002	0.000	0.000	1.317	my5651_rel.cy10a4_gcp_c2s30
Delete response time histogram
256us	1ms	4ms	16ms	64ms	256ms	1s	4s	16s	gt	max	tag
0.000	0.000	49.202	48.400	2.398	0.000	0.000	0.000	0.000	0.000	0.062	my5651_rel.cy10a_gcp_c2s30
0.000	0.000	58.396	39.617	1.969	0.018	0.000	0.000	0.000	0.000	0.226	my5651_rel.cy10a1_gcp_c2s30
0.000	0.000	56.376	41.294	2.327	0.003	0.000	0.000	0.000	0.000	0.067	my5651_rel.cy10a2_gcp_c2s30
0.000	0.000	38.224	47.787	13.473	0.503	0.012	0.002	0.000	0.000	1.319	my5651_rel.cy10a4_gcp_c2s30
q1000.1
- q1000.1: range queries with 1000 insert/s per client
- Legend for results is here.
- Each entry lists the percentage of responses that fit in that bucket (slower than max time for previous bucket, faster than min time for next bucket).
Query response time histogram
256us	1ms	4ms	16ms	64ms	256ms	1s	4s	16s	gt	max	tag
37.854	3.013	37.892	21.192	0.049	0.001	0.000	0.000	0.000	0.000	0.098	my5651_rel.cy10a_gcp_c2s30
38.277	2.512	37.482	21.499	0.229	nonzero	0.000	0.000	0.000	0.000	0.103	my5651_rel.cy10a1_gcp_c2s30
38.006	2.770	37.574	21.439	0.211	0.001	0.000	0.000	0.000	0.000	0.102	my5651_rel.cy10a2_gcp_c2s30
37.564	3.574	28.240	19.511	10.990	0.120	0.001	nonzero	0.000	0.000	1.514	my5651_rel.cy10a4_gcp_c2s30
Insert response time histogram
256us	1ms	4ms	16ms	64ms	256ms	1s	4s	16s	gt	max	tag
0.000	0.000	31.002	64.813	4.183	0.002	nonzero	0.000	0.000	0.000	0.299	my5651_rel.cy10a_gcp_c2s30
0.000	0.000	56.101	41.830	2.067	0.001	0.000	0.000	0.000	0.000	0.093	my5651_rel.cy10a1_gcp_c2s30
0.000	0.000	42.506	53.941	3.548	0.006	0.000	0.000	0.000	0.000	0.216	my5651_rel.cy10a2_gcp_c2s30
0.000	0.000	31.333	47.564	19.868	1.220	0.013	0.002	0.000	0.000	1.490	my5651_rel.cy10a4_gcp_c2s30
Delete response time histogram
256us	1ms	4ms	16ms	64ms	256ms	1s	4s	16s	gt	max	tag
0.000	0.000	36.843	59.622	3.531	0.003	nonzero	0.000	0.000	0.000	0.333	my5651_rel.cy10a_gcp_c2s30
0.000	0.000	63.164	35.107	1.725	0.004	0.000	0.000	0.000	0.000	0.102	my5651_rel.cy10a1_gcp_c2s30
0.000	0.000	48.955	47.941	3.093	0.010	0.000	0.000	0.000	0.000	0.193	my5651_rel.cy10a2_gcp_c2s30
0.000	0.000	33.217	46.300	19.309	1.152	0.020	0.002	0.000	0.000	1.526	my5651_rel.cy10a4_gcp_c2s30