Introduction
This is a report for the insert benchmark with 160M docs and 8 client(s). It is generated by scripts (bash, awk, sed) and Tufte might not be impressed. An overview of the insert benchmark is here and a short update is here. Below, by DBMS, I mean DBMS+version.config. An example is my8020.c10b40 where my means MySQL, 8020 is version 8.0.20 and c10b40 is the name for the configuration file.
The test server is a c2-standard-30 from GCP with 15 cores, hyperthreads disabled, 120G RAM, XFS + SW RAID 0 on 4 NVMe devices (1.5TB). The benchmark was run with 8 client and there were 1 or 3 connections per client (1 for queries or inserts without rate limits, 1+1 for rate limited inserts+deletes). There are 8 tables, client per table. It loads 20M rows per table without secondary indexes, creates secondary indexes, then inserts 50M rows with a delete per insert to avoid growing the table. It then does 3 read+write tests for 3600s each that do queries as fast as possible with 100, 500 and then 1000 inserts/second/client concurrent with the queries and 1000 deletes/second to avoid growing the table. The database is cached by MyRocks and the only IO is for writes.
The tested DBMS are:
- fbmy8028_rel_lto_jun23_ef5b9b101_hack.cy9c_gcp_c2s30 - MyRocks and FB MySQL 8.0.28 from git ef5b9b101 (June 2023), rel_lto build, cy9c_gcp_c2s30 config, has rocksdb_block_cache_size=80G
- fbmy8028_rel_lto_jun23_ef5b9b101_hack.cy9c1_bc60g_gcp_c2s30 - MyRocks and FB MySQL 8.0.28 from git ef5b9b101 (June 2023), rel_lto build, cy9c1_gcp_c2s30 config, adds rocksdb_use_hyper_clock_cache=ON, reduces rocksdb_block_cache_size to 60G
- fbmy8028_rel_lto_jun23_ef5b9b101_hack.cy9c2_gcp_c2s30 - MyRocks and FB MySQL 8.0.28 from git ef5b9b101 (June 2023), rel_lto build, cy9c2_gcp_c2s30 config, adds rocksdb_block_cache_numshardbits=4 (was 6)
- fbmy8028_rel_lto_jun23_ef5b9b101_hack.cy9c3_gcp_c2s30 - MyRocks and FB MySQL 8.0.28 from git ef5b9b101 (June 2023), rel_lto build, cy9c3_gcp_c2s30 config, adds rocksdb_min_blob_size (via hack this disables intra-L0 compaction)
- fbmy8028_rel_lto_jun23_ef5b9b101_hack.cy9c4_gcp_c2s30 - MyRocks and FB MySQL 8.0.28 from git ef5b9b101 (June 2023), rel_lto build, cy9c4_gcp_c2s30 config, reduces level0_slowdown_writes_trigger from 20 to 8, reduces level0_stop_writes_trigger from 36 to 12
- fbmy8028_rel_lto_jun23_ef5b9b101_hack.cy9c5_gcp_c2s30 - MyRocks and FB MySQL 8.0.28 from git ef5b9b101 (June 2023), rel_lto build, cy9c5_gcp_c2s30 config, adds rocksdb_max_subcompactions=4 (was 1)
- fbmy8028_rel_lto_jun23_ef5b9b101_hack.cy9c6_gcp_c2s30 - MyRocks and FB MySQL 8.0.28 from git ef5b9b101 (June 2023), rel_lto build, cy9c6_gcp_c2s30 config, combines c1, c2, c5
- fbmy8028_rel_lto_jun23_ef5b9b101_hack.cy9c7_gcp_c2s30 - MyRocks and FB MySQL 8.0.28 from git ef5b9b101 (June 2023), rel_lto build, cy9c7_gcp_c2s30 config, combines c1, c5
Contents
- Summary
- l.i0: load without secondary indexes
- l.x: create secondary indexes
- l.i1: continue load after secondary indexes created
- q100.1: range queries with 100 insert/s per client
- q500.1: range queries with 500 insert/s per client
- q1000.1: range queries with 1000 insert/s per client
Summary
The numbers are inserts/s for l.i0 and l.i1, indexed docs (or rows) /s for l.x and queries/s for q*.2. The values are the average rate over the entire test for inserts (IPS) and queries (QPS). The range of values for IPS and QPS is split into 3 parts: bottom 25%, middle 50%, top 25%. Values in the bottom 25% have a red background, values in the top 25% have a green background and values in the middle have no color. A gray background is used for values that can be ignored because the DBMS did not sustain the target insert rate. Red backgrounds are not used when the minimum value is within 80% of the max value.
| dbms | l.i0 | l.x | l.i1 | q100.1 | q500.1 | q1000.1 |
|---|---|---|---|---|---|---|
| fbmy8028_rel_lto_jun23_ef5b9b101_hack.cy9c_gcp_c2s30 | 509554 | 714732 | 94051 | 42559 | 40689 | 38792 |
| fbmy8028_rel_lto_jun23_ef5b9b101_hack.cy9c1_bc60g_gcp_c2s30 | 536913 | 714732 | 92614 | 44018 | 42705 | 40812 |
| fbmy8028_rel_lto_jun23_ef5b9b101_hack.cy9c2_gcp_c2s30 | 509554 | 711556 | 91282 | 41520 | 39964 | 38332 |
| fbmy8028_rel_lto_jun23_ef5b9b101_hack.cy9c3_gcp_c2s30 | 423280 | 696087 | 40205 | 42555 | 40916 | 38968 |
| fbmy8028_rel_lto_jun23_ef5b9b101_hack.cy9c4_gcp_c2s30 | 492308 | 708407 | 60178 | 42797 | 40839 | 38831 |
| fbmy8028_rel_lto_jun23_ef5b9b101_hack.cy9c5_gcp_c2s30 | 549828 | 708407 | 94007 | 42543 | 40718 | 39006 |
| fbmy8028_rel_lto_jun23_ef5b9b101_hack.cy9c6_gcp_c2s30 | 561404 | 708407 | 93175 | 44162 | 42925 | 41023 |
| fbmy8028_rel_lto_jun23_ef5b9b101_hack.cy9c7_gcp_c2s30 | 549828 | 699127 | 92764 | 43884 | 42504 | 40615 |
This table has relative throughput, throughput for the DBMS relative to the DBMS in the first line, using the absolute throughput from the previous table. Values less than 0.95 have a yellow background. Values greater than 1.05 have a blue background.
| dbms | l.i0 | l.x | l.i1 | q100.1 | q500.1 | q1000.1 |
|---|---|---|---|---|---|---|
| fbmy8028_rel_lto_jun23_ef5b9b101_hack.cy9c_gcp_c2s30 | 1.00 | 1.00 | 1.00 | 1.00 | 1.00 | 1.00 |
| fbmy8028_rel_lto_jun23_ef5b9b101_hack.cy9c1_bc60g_gcp_c2s30 | 1.05 | 1.00 | 0.98 | 1.03 | 1.05 | 1.05 |
| fbmy8028_rel_lto_jun23_ef5b9b101_hack.cy9c2_gcp_c2s30 | 1.00 | 1.00 | 0.97 | 0.98 | 0.98 | 0.99 |
| fbmy8028_rel_lto_jun23_ef5b9b101_hack.cy9c3_gcp_c2s30 | 0.83 | 0.97 | 0.43 | 1.00 | 1.01 | 1.00 |
| fbmy8028_rel_lto_jun23_ef5b9b101_hack.cy9c4_gcp_c2s30 | 0.97 | 0.99 | 0.64 | 1.01 | 1.00 | 1.00 |
| fbmy8028_rel_lto_jun23_ef5b9b101_hack.cy9c5_gcp_c2s30 | 1.08 | 0.99 | 1.00 | 1.00 | 1.00 | 1.01 |
| fbmy8028_rel_lto_jun23_ef5b9b101_hack.cy9c6_gcp_c2s30 | 1.10 | 0.99 | 0.99 | 1.04 | 1.05 | 1.06 |
| fbmy8028_rel_lto_jun23_ef5b9b101_hack.cy9c7_gcp_c2s30 | 1.08 | 0.98 | 0.99 | 1.03 | 1.04 | 1.05 |
This lists the average rate of inserts/s for the tests that do inserts concurrent with queries. For such tests the query rate is listed in the table above. The read+write tests are setup so that the insert rate should match the target rate every second. Cells that are not at least 95% of the target have a red background to indicate a failure to satisfy the target.
| dbms | q100.1 | q500.1 | q1000.1 |
|---|---|---|---|
| fbmy8028_rel_lto_jun23_ef5b9b101_hack.cy9c_gcp_c2s30 | 797 | 3987 | 7973 |
| fbmy8028_rel_lto_jun23_ef5b9b101_hack.cy9c1_bc60g_gcp_c2s30 | 797 | 3987 | 7976 |
| fbmy8028_rel_lto_jun23_ef5b9b101_hack.cy9c2_gcp_c2s30 | 797 | 3987 | 7976 |
| fbmy8028_rel_lto_jun23_ef5b9b101_hack.cy9c3_gcp_c2s30 | 797 | 3987 | 7976 |
| fbmy8028_rel_lto_jun23_ef5b9b101_hack.cy9c4_gcp_c2s30 | 797 | 3988 | 7973 |
| fbmy8028_rel_lto_jun23_ef5b9b101_hack.cy9c5_gcp_c2s30 | 797 | 3988 | 7976 |
| fbmy8028_rel_lto_jun23_ef5b9b101_hack.cy9c6_gcp_c2s30 | 797 | 3987 | 7973 |
| fbmy8028_rel_lto_jun23_ef5b9b101_hack.cy9c7_gcp_c2s30 | 797 | 3987 | 7976 |
| target | 800 | 4000 | 8000 |
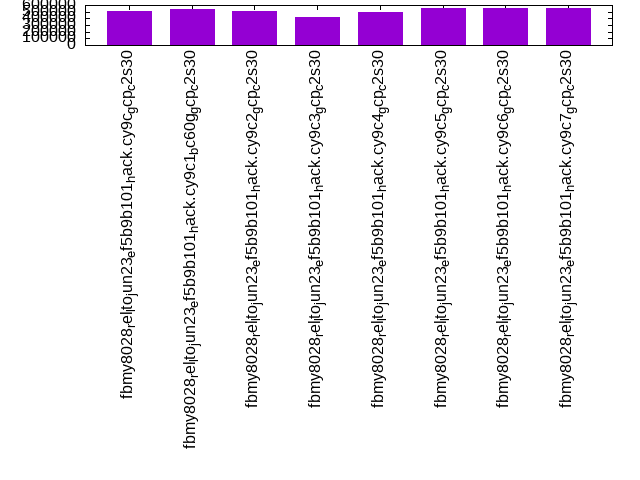
l.i0
l.i0: load without secondary indexes. Graphs for performance per 1-second interval are here.
Average throughput:
Insert response time histogram: each cell has the percentage of responses that take <= the time in the header and max is the max response time in seconds. For the max column values in the top 25% of the range have a red background and in the bottom 25% of the range have a green background. The red background is not used when the min value is within 80% of the max value.
| dbms | 256us | 1ms | 4ms | 16ms | 64ms | 256ms | 1s | 4s | 16s | gt | max |
|---|---|---|---|---|---|---|---|---|---|---|---|
| fbmy8028_rel_lto_jun23_ef5b9b101_hack.cy9c_gcp_c2s30 | 11.013 | 88.814 | 0.152 | 0.006 | 0.015 | 0.001 | 0.313 | ||||
| fbmy8028_rel_lto_jun23_ef5b9b101_hack.cy9c1_bc60g_gcp_c2s30 | 10.891 | 88.945 | 0.141 | 0.008 | 0.013 | 0.001 | 0.295 | ||||
| fbmy8028_rel_lto_jun23_ef5b9b101_hack.cy9c2_gcp_c2s30 | 11.737 | 88.087 | 0.157 | 0.005 | 0.014 | 0.240 | |||||
| fbmy8028_rel_lto_jun23_ef5b9b101_hack.cy9c3_gcp_c2s30 | 10.647 | 85.543 | 3.653 | 0.143 | 0.014 | 0.235 | |||||
| fbmy8028_rel_lto_jun23_ef5b9b101_hack.cy9c4_gcp_c2s30 | 10.720 | 87.909 | 1.353 | 0.004 | 0.013 | 0.001 | 0.420 | ||||
| fbmy8028_rel_lto_jun23_ef5b9b101_hack.cy9c5_gcp_c2s30 | 9.972 | 89.869 | 0.136 | 0.008 | 0.013 | 0.001 | 0.359 | ||||
| fbmy8028_rel_lto_jun23_ef5b9b101_hack.cy9c6_gcp_c2s30 | 10.039 | 89.800 | 0.137 | 0.009 | 0.014 | 0.001 | 0.387 | ||||
| fbmy8028_rel_lto_jun23_ef5b9b101_hack.cy9c7_gcp_c2s30 | 9.460 | 90.374 | 0.143 | 0.006 | 0.016 | nonzero | 0.264 |
Performance metrics for the DBMS listed above. Some are normalized by throughput, others are not. Legend for results is here.
ips	qps	rps	rmbps	wps	wmbps	rpq	rkbpq	wpi	wkbpi	csps	cpups	cspq	cpupq	dbgb1	dbgb2	rss	maxop	p50	p99	tag
509554	0	0	0.0	443.2	137.2	0.000	0.000	0.001	0.276	65785	70.6	0.129	21	5.0	6.7	1.7	0.313	67751	51044	160m.fbmy8028_rel_lto_jun23_ef5b9b101_hack.cy9c_gcp_c2s30
536913	0	0	0.0	470.6	142.9	0.000	0.000	0.001	0.273	62247	71.9	0.116	20	5.1	6.8	2.8	0.295	70727	52044	160m.fbmy8028_rel_lto_jun23_ef5b9b101_hack.cy9c1_bc60g_gcp_c2s30
509554	0	0	0.0	435.4	130.8	0.000	0.000	0.001	0.263	70356	70.2	0.138	21	5.1	6.8	1.7	0.240	66528	50940	160m.fbmy8028_rel_lto_jun23_ef5b9b101_hack.cy9c2_gcp_c2s30
423280	0	0	0.0	409.6	128.7	0.000	0.000	0.001	0.311	51083	59.9	0.121	21	5.8	7.5	1.9	0.235	63953	6495	160m.fbmy8028_rel_lto_jun23_ef5b9b101_hack.cy9c3_gcp_c2s30
492308	0	0	0.0	423.3	125.6	0.000	0.000	0.001	0.261	61996	65.4	0.126	20	5.1	6.8	1.8	0.420	68625	22476	160m.fbmy8028_rel_lto_jun23_ef5b9b101_hack.cy9c4_gcp_c2s30
549828	0	0	0.0	464.4	130.7	0.000	0.000	0.001	0.243	63442	71.4	0.115	19	5.1	6.8	1.5	0.359	74119	54541	160m.fbmy8028_rel_lto_jun23_ef5b9b101_hack.cy9c5_gcp_c2s30
561404	0	0	0.0	491.6	132.6	0.000	0.000	0.001	0.242	63996	72.2	0.114	19	5.1	6.8	2.6	0.387	76117	58036	160m.fbmy8028_rel_lto_jun23_ef5b9b101_hack.cy9c6_gcp_c2s30
549828	0	0	0.0	483.5	129.3	0.000	0.000	0.001	0.241	63030	72.2	0.115	20	5.1	6.8	2.6	0.264	75054	53541	160m.fbmy8028_rel_lto_jun23_ef5b9b101_hack.cy9c7_gcp_c2s30
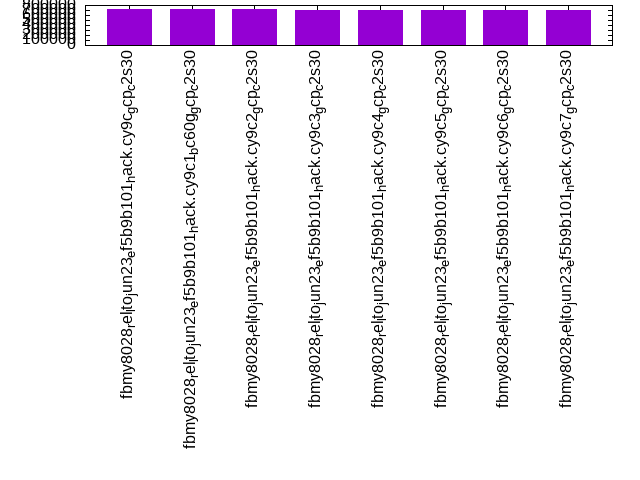
l.x
l.x: create secondary indexes.
Average throughput:
Performance metrics for the DBMS listed above. Some are normalized by throughput, others are not. Legend for results is here.
ips	qps	rps	rmbps	wps	wmbps	rpq	rkbpq	wpi	wkbpi	csps	cpups	cspq	cpupq	dbgb1	dbgb2	rss	maxop	p50	p99	tag
714732	0	1	0.1	257.4	95.5	0.000	0.000	0.000	0.137	1364	49.2	0.002	10	10.8	12.5	13.5	0.003	NA	NA	160m.fbmy8028_rel_lto_jun23_ef5b9b101_hack.cy9c_gcp_c2s30
714732	0	1	0.0	255.2	94.7	0.000	0.000	0.000	0.136	1251	49.4	0.002	10	10.9	12.6	14.7	0.002	NA	NA	160m.fbmy8028_rel_lto_jun23_ef5b9b101_hack.cy9c1_bc60g_gcp_c2s30
711556	0	1	0.1	256.2	94.2	0.000	0.000	0.000	0.136	1374	48.6	0.002	10	10.9	12.6	13.4	0.002	NA	NA	160m.fbmy8028_rel_lto_jun23_ef5b9b101_hack.cy9c2_gcp_c2s30
696087	0	1	0.1	272.7	95.2	0.000	0.000	0.000	0.140	1385	48.7	0.002	10	10.8	12.5	15.7	0.003	NA	NA	160m.fbmy8028_rel_lto_jun23_ef5b9b101_hack.cy9c3_gcp_c2s30
708407	0	1	0.1	256.1	95.0	0.000	0.000	0.000	0.137	1256	48.7	0.002	10	10.8	12.5	13.7	0.002	NA	NA	160m.fbmy8028_rel_lto_jun23_ef5b9b101_hack.cy9c4_gcp_c2s30
708407	0	1	0.1	255.8	94.6	0.000	0.000	0.000	0.137	1438	48.9	0.002	10	10.9	12.6	13.4	0.002	NA	NA	160m.fbmy8028_rel_lto_jun23_ef5b9b101_hack.cy9c5_gcp_c2s30
708407	0	1	0.1	258.4	96.9	0.000	0.000	0.000	0.140	1271	49.1	0.002	10	10.8	12.4	14.6	0.002	NA	NA	160m.fbmy8028_rel_lto_jun23_ef5b9b101_hack.cy9c6_gcp_c2s30
699127	0	1	0.1	254.6	92.6	0.000	0.000	0.000	0.136	1348	48.2	0.002	10	10.9	12.5	14.4	0.002	NA	NA	160m.fbmy8028_rel_lto_jun23_ef5b9b101_hack.cy9c7_gcp_c2s30
l.i1
l.i1: continue load after secondary indexes created. Graphs for performance per 1-second interval are here.
Average throughput:

Insert response time histogram: each cell has the percentage of responses that take <= the time in the header and max is the max response time in seconds. For the max column values in the top 25% of the range have a red background and in the bottom 25% of the range have a green background. The red background is not used when the min value is within 80% of the max value.
| dbms | 256us | 1ms | 4ms | 16ms | 64ms | 256ms | 1s | 4s | 16s | gt | max |
|---|---|---|---|---|---|---|---|---|---|---|---|
| fbmy8028_rel_lto_jun23_ef5b9b101_hack.cy9c_gcp_c2s30 | 0.015 | 46.629 | 53.212 | 0.124 | 0.017 | 0.002 | 0.725 | ||||
| fbmy8028_rel_lto_jun23_ef5b9b101_hack.cy9c1_bc60g_gcp_c2s30 | 0.010 | 47.065 | 52.675 | 0.230 | 0.018 | 0.002 | 0.651 | ||||
| fbmy8028_rel_lto_jun23_ef5b9b101_hack.cy9c2_gcp_c2s30 | 0.006 | 46.782 | 52.866 | 0.327 | 0.017 | 0.002 | 0.732 | ||||
| fbmy8028_rel_lto_jun23_ef5b9b101_hack.cy9c3_gcp_c2s30 | 0.012 | 48.986 | 44.151 | 1.843 | 4.996 | 0.012 | 0.699 | ||||
| fbmy8028_rel_lto_jun23_ef5b9b101_hack.cy9c4_gcp_c2s30 | 0.013 | 43.496 | 46.817 | 9.540 | 0.134 | nonzero | 0.389 | ||||
| fbmy8028_rel_lto_jun23_ef5b9b101_hack.cy9c5_gcp_c2s30 | 0.022 | 44.729 | 55.150 | 0.081 | 0.015 | 0.001 | 0.360 | ||||
| fbmy8028_rel_lto_jun23_ef5b9b101_hack.cy9c6_gcp_c2s30 | 0.026 | 41.296 | 58.584 | 0.077 | 0.016 | 0.001 | 0.396 | ||||
| fbmy8028_rel_lto_jun23_ef5b9b101_hack.cy9c7_gcp_c2s30 | 0.025 | 41.186 | 58.698 | 0.076 | 0.015 | 0.001 | 0.436 |
Delete response time histogram: each cell has the percentage of responses that take <= the time in the header and max is the max response time in seconds. For the max column values in the top 25% of the range have a red background and in the bottom 25% of the range have a green background. The red background is not used when the min value is within 80% of the max value.
| dbms | 256us | 1ms | 4ms | 16ms | 64ms | 256ms | 1s | 4s | 16s | gt | max |
|---|---|---|---|---|---|---|---|---|---|---|---|
| fbmy8028_rel_lto_jun23_ef5b9b101_hack.cy9c_gcp_c2s30 | 0.016 | 43.429 | 56.407 | 0.128 | 0.017 | 0.002 | 0.724 | ||||
| fbmy8028_rel_lto_jun23_ef5b9b101_hack.cy9c1_bc60g_gcp_c2s30 | 0.014 | 45.337 | 54.396 | 0.232 | 0.018 | 0.002 | 0.649 | ||||
| fbmy8028_rel_lto_jun23_ef5b9b101_hack.cy9c2_gcp_c2s30 | 0.010 | 40.852 | 58.778 | 0.340 | 0.017 | 0.002 | 0.732 | ||||
| fbmy8028_rel_lto_jun23_ef5b9b101_hack.cy9c3_gcp_c2s30 | 0.012 | 48.489 | 44.647 | 1.843 | 4.998 | 0.012 | 0.698 | ||||
| fbmy8028_rel_lto_jun23_ef5b9b101_hack.cy9c4_gcp_c2s30 | 0.017 | 47.274 | 43.079 | 9.496 | 0.134 | nonzero | 0.389 | ||||
| fbmy8028_rel_lto_jun23_ef5b9b101_hack.cy9c5_gcp_c2s30 | 0.024 | 46.416 | 53.464 | 0.080 | 0.015 | 0.001 | 0.361 | ||||
| fbmy8028_rel_lto_jun23_ef5b9b101_hack.cy9c6_gcp_c2s30 | 0.033 | 43.907 | 55.969 | 0.074 | 0.016 | 0.001 | 0.394 | ||||
| fbmy8028_rel_lto_jun23_ef5b9b101_hack.cy9c7_gcp_c2s30 | 0.028 | 43.489 | 56.392 | 0.074 | 0.015 | 0.001 | 0.436 |
Performance metrics for the DBMS listed above. Some are normalized by throughput, others are not. Legend for results is here.
ips	qps	rps	rmbps	wps	wmbps	rpq	rkbpq	wpi	wkbpi	csps	cpups	cspq	cpupq	dbgb1	dbgb2	rss	maxop	p50	p99	tag
94051	0	3	1.3	477.1	126.2	0.000	0.014	0.005	1.374	74446	65.3	0.792	104	15.8	17.3	51.3	0.725	12140	6493	160m.fbmy8028_rel_lto_jun23_ef5b9b101_hack.cy9c_gcp_c2s30
92614	0	3	1.3	461.3	125.3	0.000	0.014	0.005	1.386	53975	59.9	0.583	97	25.1	26.6	52.5	0.651	12187	4146	160m.fbmy8028_rel_lto_jun23_ef5b9b101_hack.cy9c1_bc60g_gcp_c2s30
91282	0	3	1.3	462.6	124.4	0.000	0.014	0.005	1.396	122402	66.9	1.341	110	18.5	20.1	51.6	0.732	11887	3196	160m.fbmy8028_rel_lto_jun23_ef5b9b101_hack.cy9c2_gcp_c2s30
40205	0	1	0.6	242.4	71.2	0.000	0.014	0.006	1.812	26666	27.5	0.663	103	13.6	15.1	64.9	0.699	749	250	160m.fbmy8028_rel_lto_jun23_ef5b9b101_hack.cy9c3_gcp_c2s30
60178	0	2	0.8	370.7	101.5	0.000	0.014	0.006	1.728	42398	42.1	0.705	105	13.4	14.9	56.1	0.389	8691	849	160m.fbmy8028_rel_lto_jun23_ef5b9b101_hack.cy9c4_gcp_c2s30
94007	0	3	1.3	556.4	156.7	0.000	0.014	0.006	1.707	56565	63.5	0.602	101	13.2	14.7	57.5	0.360	11943	8744	160m.fbmy8028_rel_lto_jun23_ef5b9b101_hack.cy9c5_gcp_c2s30
93175	0	3	1.3	541.9	151.8	0.000	0.014	0.006	1.668	54018	61.1	0.580	98	13.4	14.9	57.5	0.396	11887	8648	160m.fbmy8028_rel_lto_jun23_ef5b9b101_hack.cy9c6_gcp_c2s30
92764	0	3	1.3	539.5	150.8	0.000	0.014	0.006	1.665	53055	62.3	0.572	101	15.6	17.1	57.0	0.436	11824	8640	160m.fbmy8028_rel_lto_jun23_ef5b9b101_hack.cy9c7_gcp_c2s30
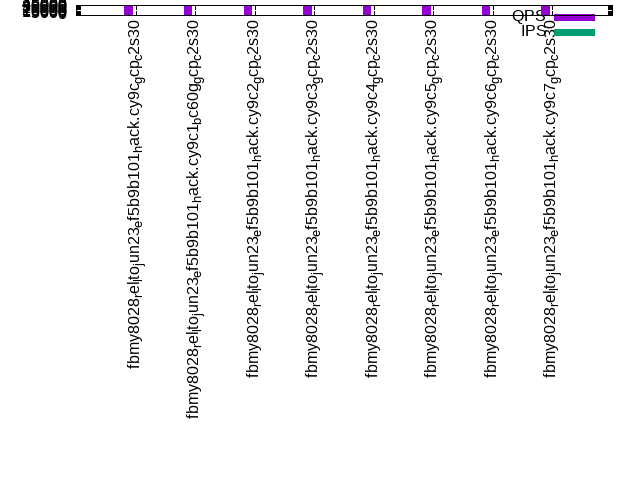
q100.1
q100.1: range queries with 100 insert/s per client. Graphs for performance per 1-second interval are here.
Average throughput:
Query response time histogram: each cell has the percentage of responses that take <= the time in the header and max is the max response time in seconds. For max values in the top 25% of the range have a red background and in the bottom 25% of the range have a green background. The red background is not used when the min value is within 80% of the max value.
| dbms | 256us | 1ms | 4ms | 16ms | 64ms | 256ms | 1s | 4s | 16s | gt | max |
|---|---|---|---|---|---|---|---|---|---|---|---|
| fbmy8028_rel_lto_jun23_ef5b9b101_hack.cy9c_gcp_c2s30 | 98.527 | 1.472 | 0.001 | nonzero | nonzero | 0.039 | |||||
| fbmy8028_rel_lto_jun23_ef5b9b101_hack.cy9c1_bc60g_gcp_c2s30 | 98.823 | 1.176 | 0.001 | nonzero | 0.014 | ||||||
| fbmy8028_rel_lto_jun23_ef5b9b101_hack.cy9c2_gcp_c2s30 | 98.573 | 1.427 | 0.001 | nonzero | nonzero | nonzero | 0.069 | ||||
| fbmy8028_rel_lto_jun23_ef5b9b101_hack.cy9c3_gcp_c2s30 | 99.080 | 0.918 | 0.001 | nonzero | nonzero | 0.022 | |||||
| fbmy8028_rel_lto_jun23_ef5b9b101_hack.cy9c4_gcp_c2s30 | 99.347 | 0.652 | 0.001 | nonzero | nonzero | 0.026 | |||||
| fbmy8028_rel_lto_jun23_ef5b9b101_hack.cy9c5_gcp_c2s30 | 99.216 | 0.782 | 0.001 | nonzero | nonzero | 0.021 | |||||
| fbmy8028_rel_lto_jun23_ef5b9b101_hack.cy9c6_gcp_c2s30 | 99.349 | 0.650 | 0.001 | nonzero | nonzero | 0.062 | |||||
| fbmy8028_rel_lto_jun23_ef5b9b101_hack.cy9c7_gcp_c2s30 | 99.115 | 0.884 | 0.001 | nonzero | nonzero | 0.023 |
Insert response time histogram: each cell has the percentage of responses that take <= the time in the header and max is the max response time in seconds. For max values in the top 25% of the range have a red background and in the bottom 25% of the range have a green background. The red background is not used when the min value is within 80% of the max value.
| dbms | 256us | 1ms | 4ms | 16ms | 64ms | 256ms | 1s | 4s | 16s | gt | max |
|---|---|---|---|---|---|---|---|---|---|---|---|
| fbmy8028_rel_lto_jun23_ef5b9b101_hack.cy9c_gcp_c2s30 | 19.741 | 80.253 | 0.002 | 0.003 | 0.018 | ||||||
| fbmy8028_rel_lto_jun23_ef5b9b101_hack.cy9c1_bc60g_gcp_c2s30 | 10.356 | 89.625 | 0.010 | 0.003 | 0.005 | 0.232 | |||||
| fbmy8028_rel_lto_jun23_ef5b9b101_hack.cy9c2_gcp_c2s30 | 9.384 | 90.613 | 0.003 | 0.014 | |||||||
| fbmy8028_rel_lto_jun23_ef5b9b101_hack.cy9c3_gcp_c2s30 | 12.438 | 87.559 | 0.002 | 0.002 | 0.022 | ||||||
| fbmy8028_rel_lto_jun23_ef5b9b101_hack.cy9c4_gcp_c2s30 | 2.243 | 97.750 | 0.005 | 0.002 | 0.020 | ||||||
| fbmy8028_rel_lto_jun23_ef5b9b101_hack.cy9c5_gcp_c2s30 | 6.733 | 93.262 | 0.005 | 0.016 | |||||||
| fbmy8028_rel_lto_jun23_ef5b9b101_hack.cy9c6_gcp_c2s30 | 7.755 | 92.241 | 0.003 | 0.006 | |||||||
| fbmy8028_rel_lto_jun23_ef5b9b101_hack.cy9c7_gcp_c2s30 | 7.910 | 92.082 | 0.007 | 0.002 | 0.020 |
Delete response time histogram: each cell has the percentage of responses that take <= the time in the header and max is the max response time in seconds. For max values in the top 25% of the range have a red background and in the bottom 25% of the range have a green background. The red background is not used when the min value is within 80% of the max value.
| dbms | 256us | 1ms | 4ms | 16ms | 64ms | 256ms | 1s | 4s | 16s | gt | max |
|---|---|---|---|---|---|---|---|---|---|---|---|
| fbmy8028_rel_lto_jun23_ef5b9b101_hack.cy9c_gcp_c2s30 | 12.344 | 87.649 | 0.003 | 0.003 | 0.021 | ||||||
| fbmy8028_rel_lto_jun23_ef5b9b101_hack.cy9c1_bc60g_gcp_c2s30 | 16.127 | 83.858 | 0.009 | 0.002 | 0.005 | 0.233 | |||||
| fbmy8028_rel_lto_jun23_ef5b9b101_hack.cy9c2_gcp_c2s30 | 11.056 | 88.934 | 0.005 | 0.005 | 0.061 | ||||||
| fbmy8028_rel_lto_jun23_ef5b9b101_hack.cy9c3_gcp_c2s30 | 12.826 | 87.168 | 0.003 | 0.002 | 0.025 | ||||||
| fbmy8028_rel_lto_jun23_ef5b9b101_hack.cy9c4_gcp_c2s30 | 15.009 | 84.984 | 0.005 | 0.002 | 0.020 | ||||||
| fbmy8028_rel_lto_jun23_ef5b9b101_hack.cy9c5_gcp_c2s30 | 11.134 | 88.861 | 0.005 | 0.006 | |||||||
| fbmy8028_rel_lto_jun23_ef5b9b101_hack.cy9c6_gcp_c2s30 | 17.252 | 82.745 | 0.003 | 0.010 | |||||||
| fbmy8028_rel_lto_jun23_ef5b9b101_hack.cy9c7_gcp_c2s30 | 17.042 | 82.953 | 0.003 | 0.002 | 0.021 |
Performance metrics for the DBMS listed above. Some are normalized by throughput, others are not. Legend for results is here.
ips	qps	rps	rmbps	wps	wmbps	rpq	rkbpq	wpi	wkbpi	csps	cpups	cspq	cpupq	dbgb1	dbgb2	rss	maxop	p50	p99	tag
797	42559	0	0.0	16.6	3.1	0.000	0.000	0.021	3.933	164699	54.9	3.870	193	12.1	14.2	73.6	0.039	5354	3692	160m.fbmy8028_rel_lto_jun23_ef5b9b101_hack.cy9c_gcp_c2s30
797	44018	0	0.0	19.8	3.1	0.000	0.000	0.025	3.921	168528	55.1	3.829	188	11.9	14.0	61.4	0.014	5516	3534	160m.fbmy8028_rel_lto_jun23_ef5b9b101_hack.cy9c1_bc60g_gcp_c2s30
797	41520	0	0.0	15.7	2.6	0.000	0.000	0.020	3.287	167661	54.5	4.038	197	12.0	14.1	71.5	0.069	5178	3548	160m.fbmy8028_rel_lto_jun23_ef5b9b101_hack.cy9c2_gcp_c2s30
797	42555	0	0.0	10.8	1.7	0.000	0.000	0.014	2.241	164734	54.6	3.871	192	12.4	14.5	79.0	0.022	5322	4491	160m.fbmy8028_rel_lto_jun23_ef5b9b101_hack.cy9c3_gcp_c2s30
797	42797	0	0.0	10.9	2.0	0.000	0.000	0.014	2.515	165456	54.7	3.866	192	12.7	14.9	73.0	0.026	5418	4796	160m.fbmy8028_rel_lto_jun23_ef5b9b101_hack.cy9c4_gcp_c2s30
797	42543	0	0.0	11.4	1.9	0.000	0.000	0.014	2.408	164436	54.7	3.865	193	12.5	14.6	73.5	0.021	5306	4589	160m.fbmy8028_rel_lto_jun23_ef5b9b101_hack.cy9c5_gcp_c2s30
797	44162	0	0.0	12.4	1.5	0.000	0.000	0.016	1.942	169124	54.8	3.830	186	12.4	14.6	62.7	0.062	5514	4683	160m.fbmy8028_rel_lto_jun23_ef5b9b101_hack.cy9c6_gcp_c2s30
797	43884	0	0.0	13.0	1.5	0.000	0.000	0.016	1.877	168036	54.8	3.829	187	12.6	14.7	62.2	0.023	5594	4427	160m.fbmy8028_rel_lto_jun23_ef5b9b101_hack.cy9c7_gcp_c2s30
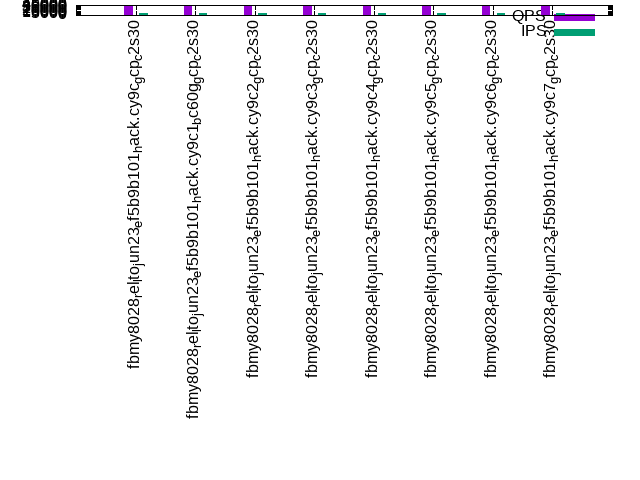
q500.1
q500.1: range queries with 500 insert/s per client. Graphs for performance per 1-second interval are here.
Average throughput:

Query response time histogram: each cell has the percentage of responses that take <= the time in the header and max is the max response time in seconds. For max values in the top 25% of the range have a red background and in the bottom 25% of the range have a green background. The red background is not used when the min value is within 80% of the max value.
| dbms | 256us | 1ms | 4ms | 16ms | 64ms | 256ms | 1s | 4s | 16s | gt | max |
|---|---|---|---|---|---|---|---|---|---|---|---|
| fbmy8028_rel_lto_jun23_ef5b9b101_hack.cy9c_gcp_c2s30 | 97.951 | 2.044 | 0.004 | nonzero | 0.016 | ||||||
| fbmy8028_rel_lto_jun23_ef5b9b101_hack.cy9c1_bc60g_gcp_c2s30 | 98.172 | 1.821 | 0.006 | nonzero | nonzero | 0.027 | |||||
| fbmy8028_rel_lto_jun23_ef5b9b101_hack.cy9c2_gcp_c2s30 | 97.213 | 2.783 | 0.004 | nonzero | nonzero | 0.016 | |||||
| fbmy8028_rel_lto_jun23_ef5b9b101_hack.cy9c3_gcp_c2s30 | 98.205 | 1.791 | 0.004 | nonzero | nonzero | 0.018 | |||||
| fbmy8028_rel_lto_jun23_ef5b9b101_hack.cy9c4_gcp_c2s30 | 97.540 | 2.454 | 0.006 | nonzero | nonzero | 0.027 | |||||
| fbmy8028_rel_lto_jun23_ef5b9b101_hack.cy9c5_gcp_c2s30 | 97.446 | 2.550 | 0.004 | nonzero | nonzero | 0.019 | |||||
| fbmy8028_rel_lto_jun23_ef5b9b101_hack.cy9c6_gcp_c2s30 | 98.057 | 1.938 | 0.005 | nonzero | 0.016 | ||||||
| fbmy8028_rel_lto_jun23_ef5b9b101_hack.cy9c7_gcp_c2s30 | 97.927 | 2.067 | 0.006 | nonzero | nonzero | 0.017 |
Insert response time histogram: each cell has the percentage of responses that take <= the time in the header and max is the max response time in seconds. For max values in the top 25% of the range have a red background and in the bottom 25% of the range have a green background. The red background is not used when the min value is within 80% of the max value.
| dbms | 256us | 1ms | 4ms | 16ms | 64ms | 256ms | 1s | 4s | 16s | gt | max |
|---|---|---|---|---|---|---|---|---|---|---|---|
| fbmy8028_rel_lto_jun23_ef5b9b101_hack.cy9c_gcp_c2s30 | 17.999 | 81.883 | 0.117 | 0.011 | |||||||
| fbmy8028_rel_lto_jun23_ef5b9b101_hack.cy9c1_bc60g_gcp_c2s30 | 10.547 | 87.608 | 1.843 | 0.001 | 0.002 | 0.089 | |||||
| fbmy8028_rel_lto_jun23_ef5b9b101_hack.cy9c2_gcp_c2s30 | 2.026 | 97.286 | 0.686 | 0.002 | 0.018 | ||||||
| fbmy8028_rel_lto_jun23_ef5b9b101_hack.cy9c3_gcp_c2s30 | 29.284 | 70.711 | 0.005 | 0.010 | |||||||
| fbmy8028_rel_lto_jun23_ef5b9b101_hack.cy9c4_gcp_c2s30 | 5.779 | 93.468 | 0.748 | 0.005 | 0.024 | ||||||
| fbmy8028_rel_lto_jun23_ef5b9b101_hack.cy9c5_gcp_c2s30 | 15.289 | 84.621 | 0.089 | 0.001 | 0.021 | ||||||
| fbmy8028_rel_lto_jun23_ef5b9b101_hack.cy9c6_gcp_c2s30 | 13.551 | 86.229 | 0.213 | 0.005 | 0.002 | 0.085 | |||||
| fbmy8028_rel_lto_jun23_ef5b9b101_hack.cy9c7_gcp_c2s30 | 12.693 | 86.695 | 0.608 | 0.004 | 0.029 |
Delete response time histogram: each cell has the percentage of responses that take <= the time in the header and max is the max response time in seconds. For max values in the top 25% of the range have a red background and in the bottom 25% of the range have a green background. The red background is not used when the min value is within 80% of the max value.
| dbms | 256us | 1ms | 4ms | 16ms | 64ms | 256ms | 1s | 4s | 16s | gt | max |
|---|---|---|---|---|---|---|---|---|---|---|---|
| fbmy8028_rel_lto_jun23_ef5b9b101_hack.cy9c_gcp_c2s30 | 27.216 | 72.680 | 0.103 | 0.001 | 0.016 | ||||||
| fbmy8028_rel_lto_jun23_ef5b9b101_hack.cy9c1_bc60g_gcp_c2s30 | 19.629 | 78.757 | 1.609 | 0.003 | 0.002 | 0.088 | |||||
| fbmy8028_rel_lto_jun23_ef5b9b101_hack.cy9c2_gcp_c2s30 | 8.133 | 91.266 | 0.599 | 0.002 | 0.017 | ||||||
| fbmy8028_rel_lto_jun23_ef5b9b101_hack.cy9c3_gcp_c2s30 | 36.666 | 63.328 | 0.005 | 0.001 | 0.032 | ||||||
| fbmy8028_rel_lto_jun23_ef5b9b101_hack.cy9c4_gcp_c2s30 | 16.201 | 83.121 | 0.673 | 0.005 | 0.026 | ||||||
| fbmy8028_rel_lto_jun23_ef5b9b101_hack.cy9c5_gcp_c2s30 | 26.024 | 73.891 | 0.084 | 0.001 | 0.021 | ||||||
| fbmy8028_rel_lto_jun23_ef5b9b101_hack.cy9c6_gcp_c2s30 | 24.169 | 75.615 | 0.210 | 0.004 | 0.002 | 0.085 | |||||
| fbmy8028_rel_lto_jun23_ef5b9b101_hack.cy9c7_gcp_c2s30 | 23.546 | 75.911 | 0.539 | 0.004 | 0.032 |
Performance metrics for the DBMS listed above. Some are normalized by throughput, others are not. Legend for results is here.
ips	qps	rps	rmbps	wps	wmbps	rpq	rkbpq	wpi	wkbpi	csps	cpups	cspq	cpupq	dbgb1	dbgb2	rss	maxop	p50	p99	tag
3987	40689	0	0.0	28.3	7.3	0.000	0.000	0.007	1.877	159109	56.3	3.910	208	12.2	13.5	81.8	0.016	5050	4587	160m.fbmy8028_rel_lto_jun23_ef5b9b101_hack.cy9c_gcp_c2s30
3987	42705	0	0.0	31.0	5.9	0.000	0.000	0.008	1.512	164302	56.4	3.847	198	12.2	13.4	62.1	0.027	5354	4843	160m.fbmy8028_rel_lto_jun23_ef5b9b101_hack.cy9c1_bc60g_gcp_c2s30
3987	39964	0	0.0	29.3	7.6	0.000	0.000	0.007	1.959	165668	56.1	4.145	211	12.0	13.3	81.9	0.016	4971	4507	160m.fbmy8028_rel_lto_jun23_ef5b9b101_hack.cy9c2_gcp_c2s30
3987	40916	0	0.0	29.8	7.1	0.000	0.000	0.007	1.829	160069	56.4	3.912	207	12.4	13.6	81.3	0.018	5162	4651	160m.fbmy8028_rel_lto_jun23_ef5b9b101_hack.cy9c3_gcp_c2s30
3988	40839	0	0.0	31.7	8.7	0.000	0.000	0.008	2.222	159425	56.7	3.904	208	13.0	14.2	82.3	0.027	5117	4683	160m.fbmy8028_rel_lto_jun23_ef5b9b101_hack.cy9c4_gcp_c2s30
3988	40718	0	0.0	31.7	8.2	0.000	0.000	0.008	2.101	158632	56.7	3.896	209	12.6	13.8	82.7	0.019	5146	4283	160m.fbmy8028_rel_lto_jun23_ef5b9b101_hack.cy9c5_gcp_c2s30
3987	42925	0	0.0	32.5	7.1	0.000	0.000	0.008	1.817	164672	56.6	3.836	198	12.6	13.8	65.6	0.016	5386	4509	160m.fbmy8028_rel_lto_jun23_ef5b9b101_hack.cy9c6_gcp_c2s30
3987	42504	0	0.0	32.6	6.9	0.000	0.000	0.008	1.773	163038	56.6	3.836	200	12.5	13.7	65.3	0.017	5402	4411	160m.fbmy8028_rel_lto_jun23_ef5b9b101_hack.cy9c7_gcp_c2s30
q1000.1
q1000.1: range queries with 1000 insert/s per client. Graphs for performance per 1-second interval are here.
Average throughput:
Query response time histogram: each cell has the percentage of responses that take <= the time in the header and max is the max response time in seconds. For max values in the top 25% of the range have a red background and in the bottom 25% of the range have a green background. The red background is not used when the min value is within 80% of the max value.
| dbms | 256us | 1ms | 4ms | 16ms | 64ms | 256ms | 1s | 4s | 16s | gt | max |
|---|---|---|---|---|---|---|---|---|---|---|---|
| fbmy8028_rel_lto_jun23_ef5b9b101_hack.cy9c_gcp_c2s30 | 94.466 | 5.526 | 0.008 | nonzero | nonzero | 0.042 | |||||
| fbmy8028_rel_lto_jun23_ef5b9b101_hack.cy9c1_bc60g_gcp_c2s30 | 95.732 | 4.259 | 0.008 | nonzero | nonzero | 0.025 | |||||
| fbmy8028_rel_lto_jun23_ef5b9b101_hack.cy9c2_gcp_c2s30 | 93.914 | 6.080 | 0.006 | nonzero | nonzero | nonzero | 0.152 | ||||
| fbmy8028_rel_lto_jun23_ef5b9b101_hack.cy9c3_gcp_c2s30 | 94.794 | 5.194 | 0.011 | nonzero | nonzero | 0.047 | |||||
| fbmy8028_rel_lto_jun23_ef5b9b101_hack.cy9c4_gcp_c2s30 | 94.414 | 5.566 | 0.020 | nonzero | nonzero | 0.042 | |||||
| fbmy8028_rel_lto_jun23_ef5b9b101_hack.cy9c5_gcp_c2s30 | 93.919 | 6.063 | 0.018 | nonzero | nonzero | 0.044 | |||||
| fbmy8028_rel_lto_jun23_ef5b9b101_hack.cy9c6_gcp_c2s30 | 95.392 | 4.594 | 0.013 | nonzero | nonzero | 0.026 | |||||
| fbmy8028_rel_lto_jun23_ef5b9b101_hack.cy9c7_gcp_c2s30 | 95.181 | 4.803 | 0.016 | nonzero | nonzero | 0.022 |
Insert response time histogram: each cell has the percentage of responses that take <= the time in the header and max is the max response time in seconds. For max values in the top 25% of the range have a red background and in the bottom 25% of the range have a green background. The red background is not used when the min value is within 80% of the max value.
| dbms | 256us | 1ms | 4ms | 16ms | 64ms | 256ms | 1s | 4s | 16s | gt | max |
|---|---|---|---|---|---|---|---|---|---|---|---|
| fbmy8028_rel_lto_jun23_ef5b9b101_hack.cy9c_gcp_c2s30 | 5.260 | 94.471 | 0.268 | 0.001 | 0.039 | ||||||
| fbmy8028_rel_lto_jun23_ef5b9b101_hack.cy9c1_bc60g_gcp_c2s30 | 8.998 | 90.638 | 0.362 | 0.002 | 0.024 | ||||||
| fbmy8028_rel_lto_jun23_ef5b9b101_hack.cy9c2_gcp_c2s30 | 2.624 | 96.657 | 0.714 | 0.004 | 0.001 | 0.151 | |||||
| fbmy8028_rel_lto_jun23_ef5b9b101_hack.cy9c3_gcp_c2s30 | 13.599 | 83.225 | 3.169 | 0.007 | 0.048 | ||||||
| fbmy8028_rel_lto_jun23_ef5b9b101_hack.cy9c4_gcp_c2s30 | 2.710 | 74.283 | 22.990 | 0.017 | 0.040 | ||||||
| fbmy8028_rel_lto_jun23_ef5b9b101_hack.cy9c5_gcp_c2s30 | 4.872 | 83.838 | 11.277 | 0.013 | 0.034 | ||||||
| fbmy8028_rel_lto_jun23_ef5b9b101_hack.cy9c6_gcp_c2s30 | 5.870 | 89.659 | 4.455 | 0.016 | 0.055 | ||||||
| fbmy8028_rel_lto_jun23_ef5b9b101_hack.cy9c7_gcp_c2s30 | 8.151 | 82.884 | 8.946 | 0.019 | 0.028 |
Delete response time histogram: each cell has the percentage of responses that take <= the time in the header and max is the max response time in seconds. For max values in the top 25% of the range have a red background and in the bottom 25% of the range have a green background. The red background is not used when the min value is within 80% of the max value.
| dbms | 256us | 1ms | 4ms | 16ms | 64ms | 256ms | 1s | 4s | 16s | gt | max |
|---|---|---|---|---|---|---|---|---|---|---|---|
| fbmy8028_rel_lto_jun23_ef5b9b101_hack.cy9c_gcp_c2s30 | 14.984 | 84.769 | 0.243 | 0.003 | 0.042 | ||||||
| fbmy8028_rel_lto_jun23_ef5b9b101_hack.cy9c1_bc60g_gcp_c2s30 | 21.615 | 78.054 | 0.328 | 0.003 | 0.030 | ||||||
| fbmy8028_rel_lto_jun23_ef5b9b101_hack.cy9c2_gcp_c2s30 | 8.857 | 90.547 | 0.590 | 0.005 | 0.001 | 0.150 | |||||
| fbmy8028_rel_lto_jun23_ef5b9b101_hack.cy9c3_gcp_c2s30 | 15.983 | 81.101 | 2.909 | 0.007 | 0.046 | ||||||
| fbmy8028_rel_lto_jun23_ef5b9b101_hack.cy9c4_gcp_c2s30 | 5.718 | 72.781 | 21.484 | 0.018 | 0.047 | ||||||
| fbmy8028_rel_lto_jun23_ef5b9b101_hack.cy9c5_gcp_c2s30 | 8.705 | 80.861 | 10.423 | 0.010 | 0.043 | ||||||
| fbmy8028_rel_lto_jun23_ef5b9b101_hack.cy9c6_gcp_c2s30 | 11.898 | 84.126 | 3.959 | 0.018 | 0.056 | ||||||
| fbmy8028_rel_lto_jun23_ef5b9b101_hack.cy9c7_gcp_c2s30 | 12.492 | 79.234 | 8.255 | 0.018 | 0.032 |
Performance metrics for the DBMS listed above. Some are normalized by throughput, others are not. Legend for results is here.
ips	qps	rps	rmbps	wps	wmbps	rpq	rkbpq	wpi	wkbpi	csps	cpups	cspq	cpupq	dbgb1	dbgb2	rss	maxop	p50	p99	tag
7973	38792	0	0.0	58.4	15.2	0.000	0.000	0.007	1.953	152607	58.9	3.934	228	12.2	13.6	82.8	0.042	4859	4379	160m.fbmy8028_rel_lto_jun23_ef5b9b101_hack.cy9c_gcp_c2s30
7976	40812	0	0.0	61.1	13.5	0.000	0.000	0.008	1.736	157642	59.0	3.863	217	12.2	13.6	62.5	0.025	5130	4619	160m.fbmy8028_rel_lto_jun23_ef5b9b101_hack.cy9c1_bc60g_gcp_c2s30
7976	38332	0	0.0	58.3	14.7	0.000	0.000	0.007	1.890	160997	58.6	4.200	229	12.2	13.6	83.0	0.152	4811	4301	160m.fbmy8028_rel_lto_jun23_ef5b9b101_hack.cy9c2_gcp_c2s30
7976	38968	0	0.0	57.9	15.7	0.000	0.000	0.007	2.012	153318	58.9	3.934	227	12.6	14.0	82.9	0.047	4891	4411	160m.fbmy8028_rel_lto_jun23_ef5b9b101_hack.cy9c3_gcp_c2s30
7973	38831	0	0.0	66.3	16.5	0.000	0.000	0.008	2.115	152033	59.6	3.915	230	13.1	14.5	83.2	0.042	4860	4363	160m.fbmy8028_rel_lto_jun23_ef5b9b101_hack.cy9c4_gcp_c2s30
7976	39006	0	0.0	62.4	15.2	0.000	0.000	0.008	1.946	152162	59.2	3.901	228	12.8	14.2	84.7	0.044	4925	3884	160m.fbmy8028_rel_lto_jun23_ef5b9b101_hack.cy9c5_gcp_c2s30
7973	41023	0	0.0	64.7	14.0	0.000	0.000	0.008	1.802	157158	59.2	3.831	216	12.7	14.1	64.4	0.026	5194	4155	160m.fbmy8028_rel_lto_jun23_ef5b9b101_hack.cy9c6_gcp_c2s30
7976	40615	0	0.0	64.1	13.9	0.000	0.000	0.008	1.789	155670	59.3	3.833	219	12.6	14.0	64.1	0.022	5146	3980	160m.fbmy8028_rel_lto_jun23_ef5b9b101_hack.cy9c7_gcp_c2s30
l.i0
l.i0: load without secondary indexes
Performance metrics for all DBMS, not just the ones listed above. Some are normalized by throughput, others are not. Legend for results is here.
ips	qps	rps	rmbps	wps	wmbps	rpq	rkbpq	wpi	wkbpi	csps	cpups	cspq	cpupq	dbgb1	dbgb2	rss	maxop	p50	p99	tag
509554	0	0	0.0	443.2	137.2	0.000	0.000	0.001	0.276	65785	70.6	0.129	21	5.0	6.7	1.7	0.313	67751	51044	160m.fbmy8028_rel_lto_jun23_ef5b9b101_hack.cy9c_gcp_c2s30
536913	0	0	0.0	470.6	142.9	0.000	0.000	0.001	0.273	62247	71.9	0.116	20	5.1	6.8	2.8	0.295	70727	52044	160m.fbmy8028_rel_lto_jun23_ef5b9b101_hack.cy9c1_bc60g_gcp_c2s30
509554	0	0	0.0	435.4	130.8	0.000	0.000	0.001	0.263	70356	70.2	0.138	21	5.1	6.8	1.7	0.240	66528	50940	160m.fbmy8028_rel_lto_jun23_ef5b9b101_hack.cy9c2_gcp_c2s30
423280	0	0	0.0	409.6	128.7	0.000	0.000	0.001	0.311	51083	59.9	0.121	21	5.8	7.5	1.9	0.235	63953	6495	160m.fbmy8028_rel_lto_jun23_ef5b9b101_hack.cy9c3_gcp_c2s30
492308	0	0	0.0	423.3	125.6	0.000	0.000	0.001	0.261	61996	65.4	0.126	20	5.1	6.8	1.8	0.420	68625	22476	160m.fbmy8028_rel_lto_jun23_ef5b9b101_hack.cy9c4_gcp_c2s30
549828	0	0	0.0	464.4	130.7	0.000	0.000	0.001	0.243	63442	71.4	0.115	19	5.1	6.8	1.5	0.359	74119	54541	160m.fbmy8028_rel_lto_jun23_ef5b9b101_hack.cy9c5_gcp_c2s30
561404	0	0	0.0	491.6	132.6	0.000	0.000	0.001	0.242	63996	72.2	0.114	19	5.1	6.8	2.6	0.387	76117	58036	160m.fbmy8028_rel_lto_jun23_ef5b9b101_hack.cy9c6_gcp_c2s30
549828	0	0	0.0	483.5	129.3	0.000	0.000	0.001	0.241	63030	72.2	0.115	20	5.1	6.8	2.6	0.264	75054	53541	160m.fbmy8028_rel_lto_jun23_ef5b9b101_hack.cy9c7_gcp_c2s30
l.x
l.x: create secondary indexes
Performance metrics for all DBMS, not just the ones listed above. Some are normalized by throughput, others are not. Legend for results is here.
ips	qps	rps	rmbps	wps	wmbps	rpq	rkbpq	wpi	wkbpi	csps	cpups	cspq	cpupq	dbgb1	dbgb2	rss	maxop	p50	p99	tag
714732	0	1	0.1	257.4	95.5	0.000	0.000	0.000	0.137	1364	49.2	0.002	10	10.8	12.5	13.5	0.003	NA	NA	160m.fbmy8028_rel_lto_jun23_ef5b9b101_hack.cy9c_gcp_c2s30
714732	0	1	0.0	255.2	94.7	0.000	0.000	0.000	0.136	1251	49.4	0.002	10	10.9	12.6	14.7	0.002	NA	NA	160m.fbmy8028_rel_lto_jun23_ef5b9b101_hack.cy9c1_bc60g_gcp_c2s30
711556	0	1	0.1	256.2	94.2	0.000	0.000	0.000	0.136	1374	48.6	0.002	10	10.9	12.6	13.4	0.002	NA	NA	160m.fbmy8028_rel_lto_jun23_ef5b9b101_hack.cy9c2_gcp_c2s30
696087	0	1	0.1	272.7	95.2	0.000	0.000	0.000	0.140	1385	48.7	0.002	10	10.8	12.5	15.7	0.003	NA	NA	160m.fbmy8028_rel_lto_jun23_ef5b9b101_hack.cy9c3_gcp_c2s30
708407	0	1	0.1	256.1	95.0	0.000	0.000	0.000	0.137	1256	48.7	0.002	10	10.8	12.5	13.7	0.002	NA	NA	160m.fbmy8028_rel_lto_jun23_ef5b9b101_hack.cy9c4_gcp_c2s30
708407	0	1	0.1	255.8	94.6	0.000	0.000	0.000	0.137	1438	48.9	0.002	10	10.9	12.6	13.4	0.002	NA	NA	160m.fbmy8028_rel_lto_jun23_ef5b9b101_hack.cy9c5_gcp_c2s30
708407	0	1	0.1	258.4	96.9	0.000	0.000	0.000	0.140	1271	49.1	0.002	10	10.8	12.4	14.6	0.002	NA	NA	160m.fbmy8028_rel_lto_jun23_ef5b9b101_hack.cy9c6_gcp_c2s30
699127	0	1	0.1	254.6	92.6	0.000	0.000	0.000	0.136	1348	48.2	0.002	10	10.9	12.5	14.4	0.002	NA	NA	160m.fbmy8028_rel_lto_jun23_ef5b9b101_hack.cy9c7_gcp_c2s30
l.i1
l.i1: continue load after secondary indexes created
Performance metrics for all DBMS, not just the ones listed above. Some are normalized by throughput, others are not. Legend for results is here.
ips	qps	rps	rmbps	wps	wmbps	rpq	rkbpq	wpi	wkbpi	csps	cpups	cspq	cpupq	dbgb1	dbgb2	rss	maxop	p50	p99	tag
94051	0	3	1.3	477.1	126.2	0.000	0.014	0.005	1.374	74446	65.3	0.792	104	15.8	17.3	51.3	0.725	12140	6493	160m.fbmy8028_rel_lto_jun23_ef5b9b101_hack.cy9c_gcp_c2s30
92614	0	3	1.3	461.3	125.3	0.000	0.014	0.005	1.386	53975	59.9	0.583	97	25.1	26.6	52.5	0.651	12187	4146	160m.fbmy8028_rel_lto_jun23_ef5b9b101_hack.cy9c1_bc60g_gcp_c2s30
91282	0	3	1.3	462.6	124.4	0.000	0.014	0.005	1.396	122402	66.9	1.341	110	18.5	20.1	51.6	0.732	11887	3196	160m.fbmy8028_rel_lto_jun23_ef5b9b101_hack.cy9c2_gcp_c2s30
40205	0	1	0.6	242.4	71.2	0.000	0.014	0.006	1.812	26666	27.5	0.663	103	13.6	15.1	64.9	0.699	749	250	160m.fbmy8028_rel_lto_jun23_ef5b9b101_hack.cy9c3_gcp_c2s30
60178	0	2	0.8	370.7	101.5	0.000	0.014	0.006	1.728	42398	42.1	0.705	105	13.4	14.9	56.1	0.389	8691	849	160m.fbmy8028_rel_lto_jun23_ef5b9b101_hack.cy9c4_gcp_c2s30
94007	0	3	1.3	556.4	156.7	0.000	0.014	0.006	1.707	56565	63.5	0.602	101	13.2	14.7	57.5	0.360	11943	8744	160m.fbmy8028_rel_lto_jun23_ef5b9b101_hack.cy9c5_gcp_c2s30
93175	0	3	1.3	541.9	151.8	0.000	0.014	0.006	1.668	54018	61.1	0.580	98	13.4	14.9	57.5	0.396	11887	8648	160m.fbmy8028_rel_lto_jun23_ef5b9b101_hack.cy9c6_gcp_c2s30
92764	0	3	1.3	539.5	150.8	0.000	0.014	0.006	1.665	53055	62.3	0.572	101	15.6	17.1	57.0	0.436	11824	8640	160m.fbmy8028_rel_lto_jun23_ef5b9b101_hack.cy9c7_gcp_c2s30
q100.1
q100.1: range queries with 100 insert/s per client
Performance metrics for all DBMS, not just the ones listed above. Some are normalized by throughput, others are not. Legend for results is here.
ips	qps	rps	rmbps	wps	wmbps	rpq	rkbpq	wpi	wkbpi	csps	cpups	cspq	cpupq	dbgb1	dbgb2	rss	maxop	p50	p99	tag
797	42559	0	0.0	16.6	3.1	0.000	0.000	0.021	3.933	164699	54.9	3.870	193	12.1	14.2	73.6	0.039	5354	3692	160m.fbmy8028_rel_lto_jun23_ef5b9b101_hack.cy9c_gcp_c2s30
797	44018	0	0.0	19.8	3.1	0.000	0.000	0.025	3.921	168528	55.1	3.829	188	11.9	14.0	61.4	0.014	5516	3534	160m.fbmy8028_rel_lto_jun23_ef5b9b101_hack.cy9c1_bc60g_gcp_c2s30
797	41520	0	0.0	15.7	2.6	0.000	0.000	0.020	3.287	167661	54.5	4.038	197	12.0	14.1	71.5	0.069	5178	3548	160m.fbmy8028_rel_lto_jun23_ef5b9b101_hack.cy9c2_gcp_c2s30
797	42555	0	0.0	10.8	1.7	0.000	0.000	0.014	2.241	164734	54.6	3.871	192	12.4	14.5	79.0	0.022	5322	4491	160m.fbmy8028_rel_lto_jun23_ef5b9b101_hack.cy9c3_gcp_c2s30
797	42797	0	0.0	10.9	2.0	0.000	0.000	0.014	2.515	165456	54.7	3.866	192	12.7	14.9	73.0	0.026	5418	4796	160m.fbmy8028_rel_lto_jun23_ef5b9b101_hack.cy9c4_gcp_c2s30
797	42543	0	0.0	11.4	1.9	0.000	0.000	0.014	2.408	164436	54.7	3.865	193	12.5	14.6	73.5	0.021	5306	4589	160m.fbmy8028_rel_lto_jun23_ef5b9b101_hack.cy9c5_gcp_c2s30
797	44162	0	0.0	12.4	1.5	0.000	0.000	0.016	1.942	169124	54.8	3.830	186	12.4	14.6	62.7	0.062	5514	4683	160m.fbmy8028_rel_lto_jun23_ef5b9b101_hack.cy9c6_gcp_c2s30
797	43884	0	0.0	13.0	1.5	0.000	0.000	0.016	1.877	168036	54.8	3.829	187	12.6	14.7	62.2	0.023	5594	4427	160m.fbmy8028_rel_lto_jun23_ef5b9b101_hack.cy9c7_gcp_c2s30
q500.1
q500.1: range queries with 500 insert/s per client
Performance metrics for all DBMS, not just the ones listed above. Some are normalized by throughput, others are not. Legend for results is here.
ips	qps	rps	rmbps	wps	wmbps	rpq	rkbpq	wpi	wkbpi	csps	cpups	cspq	cpupq	dbgb1	dbgb2	rss	maxop	p50	p99	tag
3987	40689	0	0.0	28.3	7.3	0.000	0.000	0.007	1.877	159109	56.3	3.910	208	12.2	13.5	81.8	0.016	5050	4587	160m.fbmy8028_rel_lto_jun23_ef5b9b101_hack.cy9c_gcp_c2s30
3987	42705	0	0.0	31.0	5.9	0.000	0.000	0.008	1.512	164302	56.4	3.847	198	12.2	13.4	62.1	0.027	5354	4843	160m.fbmy8028_rel_lto_jun23_ef5b9b101_hack.cy9c1_bc60g_gcp_c2s30
3987	39964	0	0.0	29.3	7.6	0.000	0.000	0.007	1.959	165668	56.1	4.145	211	12.0	13.3	81.9	0.016	4971	4507	160m.fbmy8028_rel_lto_jun23_ef5b9b101_hack.cy9c2_gcp_c2s30
3987	40916	0	0.0	29.8	7.1	0.000	0.000	0.007	1.829	160069	56.4	3.912	207	12.4	13.6	81.3	0.018	5162	4651	160m.fbmy8028_rel_lto_jun23_ef5b9b101_hack.cy9c3_gcp_c2s30
3988	40839	0	0.0	31.7	8.7	0.000	0.000	0.008	2.222	159425	56.7	3.904	208	13.0	14.2	82.3	0.027	5117	4683	160m.fbmy8028_rel_lto_jun23_ef5b9b101_hack.cy9c4_gcp_c2s30
3988	40718	0	0.0	31.7	8.2	0.000	0.000	0.008	2.101	158632	56.7	3.896	209	12.6	13.8	82.7	0.019	5146	4283	160m.fbmy8028_rel_lto_jun23_ef5b9b101_hack.cy9c5_gcp_c2s30
3987	42925	0	0.0	32.5	7.1	0.000	0.000	0.008	1.817	164672	56.6	3.836	198	12.6	13.8	65.6	0.016	5386	4509	160m.fbmy8028_rel_lto_jun23_ef5b9b101_hack.cy9c6_gcp_c2s30
3987	42504	0	0.0	32.6	6.9	0.000	0.000	0.008	1.773	163038	56.6	3.836	200	12.5	13.7	65.3	0.017	5402	4411	160m.fbmy8028_rel_lto_jun23_ef5b9b101_hack.cy9c7_gcp_c2s30
q1000.1
q1000.1: range queries with 1000 insert/s per client
Performance metrics for all DBMS, not just the ones listed above. Some are normalized by throughput, others are not. Legend for results is here.
ips	qps	rps	rmbps	wps	wmbps	rpq	rkbpq	wpi	wkbpi	csps	cpups	cspq	cpupq	dbgb1	dbgb2	rss	maxop	p50	p99	tag
7973	38792	0	0.0	58.4	15.2	0.000	0.000	0.007	1.953	152607	58.9	3.934	228	12.2	13.6	82.8	0.042	4859	4379	160m.fbmy8028_rel_lto_jun23_ef5b9b101_hack.cy9c_gcp_c2s30
7976	40812	0	0.0	61.1	13.5	0.000	0.000	0.008	1.736	157642	59.0	3.863	217	12.2	13.6	62.5	0.025	5130	4619	160m.fbmy8028_rel_lto_jun23_ef5b9b101_hack.cy9c1_bc60g_gcp_c2s30
7976	38332	0	0.0	58.3	14.7	0.000	0.000	0.007	1.890	160997	58.6	4.200	229	12.2	13.6	83.0	0.152	4811	4301	160m.fbmy8028_rel_lto_jun23_ef5b9b101_hack.cy9c2_gcp_c2s30
7976	38968	0	0.0	57.9	15.7	0.000	0.000	0.007	2.012	153318	58.9	3.934	227	12.6	14.0	82.9	0.047	4891	4411	160m.fbmy8028_rel_lto_jun23_ef5b9b101_hack.cy9c3_gcp_c2s30
7973	38831	0	0.0	66.3	16.5	0.000	0.000	0.008	2.115	152033	59.6	3.915	230	13.1	14.5	83.2	0.042	4860	4363	160m.fbmy8028_rel_lto_jun23_ef5b9b101_hack.cy9c4_gcp_c2s30
7976	39006	0	0.0	62.4	15.2	0.000	0.000	0.008	1.946	152162	59.2	3.901	228	12.8	14.2	84.7	0.044	4925	3884	160m.fbmy8028_rel_lto_jun23_ef5b9b101_hack.cy9c5_gcp_c2s30
7973	41023	0	0.0	64.7	14.0	0.000	0.000	0.008	1.802	157158	59.2	3.831	216	12.7	14.1	64.4	0.026	5194	4155	160m.fbmy8028_rel_lto_jun23_ef5b9b101_hack.cy9c6_gcp_c2s30
7976	40615	0	0.0	64.1	13.9	0.000	0.000	0.008	1.789	155670	59.3	3.833	219	12.6	14.0	64.1	0.022	5146	3980	160m.fbmy8028_rel_lto_jun23_ef5b9b101_hack.cy9c7_gcp_c2s30
l.i0
- l.i0: load without secondary indexes
- Legend for results is here.
- Each entry lists the percentage of responses that fit in that bucket (slower than max time for previous bucket, faster than min time for next bucket).
Insert response time histogram
256us	1ms	4ms	16ms	64ms	256ms	1s	4s	16s	gt	max	tag
0.000	11.013	88.814	0.152	0.006	0.015	0.001	0.000	0.000	0.000	0.313	fbmy8028_rel_lto_jun23_ef5b9b101_hack.cy9c_gcp_c2s30
0.000	10.891	88.945	0.141	0.008	0.013	0.001	0.000	0.000	0.000	0.295	fbmy8028_rel_lto_jun23_ef5b9b101_hack.cy9c1_bc60g_gcp_c2s30
0.000	11.737	88.087	0.157	0.005	0.014	0.000	0.000	0.000	0.000	0.240	fbmy8028_rel_lto_jun23_ef5b9b101_hack.cy9c2_gcp_c2s30
0.000	10.647	85.543	3.653	0.143	0.014	0.000	0.000	0.000	0.000	0.235	fbmy8028_rel_lto_jun23_ef5b9b101_hack.cy9c3_gcp_c2s30
0.000	10.720	87.909	1.353	0.004	0.013	0.001	0.000	0.000	0.000	0.420	fbmy8028_rel_lto_jun23_ef5b9b101_hack.cy9c4_gcp_c2s30
0.000	9.972	89.869	0.136	0.008	0.013	0.001	0.000	0.000	0.000	0.359	fbmy8028_rel_lto_jun23_ef5b9b101_hack.cy9c5_gcp_c2s30
0.000	10.039	89.800	0.137	0.009	0.014	0.001	0.000	0.000	0.000	0.387	fbmy8028_rel_lto_jun23_ef5b9b101_hack.cy9c6_gcp_c2s30
0.000	9.460	90.374	0.143	0.006	0.016	nonzero	0.000	0.000	0.000	0.264	fbmy8028_rel_lto_jun23_ef5b9b101_hack.cy9c7_gcp_c2s30
l.x
- l.x: create secondary indexes
- Legend for results is here.
- Each entry lists the percentage of responses that fit in that bucket (slower than max time for previous bucket, faster than min time for next bucket).
TODO - determine whether there is data for create index response time
l.i1
- l.i1: continue load after secondary indexes created
- Legend for results is here.
- Each entry lists the percentage of responses that fit in that bucket (slower than max time for previous bucket, faster than min time for next bucket).
Insert response time histogram
256us	1ms	4ms	16ms	64ms	256ms	1s	4s	16s	gt	max	tag
0.000	0.015	46.629	53.212	0.124	0.017	0.002	0.000	0.000	0.000	0.725	fbmy8028_rel_lto_jun23_ef5b9b101_hack.cy9c_gcp_c2s30
0.000	0.010	47.065	52.675	0.230	0.018	0.002	0.000	0.000	0.000	0.651	fbmy8028_rel_lto_jun23_ef5b9b101_hack.cy9c1_bc60g_gcp_c2s30
0.000	0.006	46.782	52.866	0.327	0.017	0.002	0.000	0.000	0.000	0.732	fbmy8028_rel_lto_jun23_ef5b9b101_hack.cy9c2_gcp_c2s30
0.000	0.012	48.986	44.151	1.843	4.996	0.012	0.000	0.000	0.000	0.699	fbmy8028_rel_lto_jun23_ef5b9b101_hack.cy9c3_gcp_c2s30
0.000	0.013	43.496	46.817	9.540	0.134	nonzero	0.000	0.000	0.000	0.389	fbmy8028_rel_lto_jun23_ef5b9b101_hack.cy9c4_gcp_c2s30
0.000	0.022	44.729	55.150	0.081	0.015	0.001	0.000	0.000	0.000	0.360	fbmy8028_rel_lto_jun23_ef5b9b101_hack.cy9c5_gcp_c2s30
0.000	0.026	41.296	58.584	0.077	0.016	0.001	0.000	0.000	0.000	0.396	fbmy8028_rel_lto_jun23_ef5b9b101_hack.cy9c6_gcp_c2s30
0.000	0.025	41.186	58.698	0.076	0.015	0.001	0.000	0.000	0.000	0.436	fbmy8028_rel_lto_jun23_ef5b9b101_hack.cy9c7_gcp_c2s30
Delete response time histogram
256us	1ms	4ms	16ms	64ms	256ms	1s	4s	16s	gt	max	tag
0.000	0.016	43.429	56.407	0.128	0.017	0.002	0.000	0.000	0.000	0.724	fbmy8028_rel_lto_jun23_ef5b9b101_hack.cy9c_gcp_c2s30
0.000	0.014	45.337	54.396	0.232	0.018	0.002	0.000	0.000	0.000	0.649	fbmy8028_rel_lto_jun23_ef5b9b101_hack.cy9c1_bc60g_gcp_c2s30
0.000	0.010	40.852	58.778	0.340	0.017	0.002	0.000	0.000	0.000	0.732	fbmy8028_rel_lto_jun23_ef5b9b101_hack.cy9c2_gcp_c2s30
0.000	0.012	48.489	44.647	1.843	4.998	0.012	0.000	0.000	0.000	0.698	fbmy8028_rel_lto_jun23_ef5b9b101_hack.cy9c3_gcp_c2s30
0.000	0.017	47.274	43.079	9.496	0.134	nonzero	0.000	0.000	0.000	0.389	fbmy8028_rel_lto_jun23_ef5b9b101_hack.cy9c4_gcp_c2s30
0.000	0.024	46.416	53.464	0.080	0.015	0.001	0.000	0.000	0.000	0.361	fbmy8028_rel_lto_jun23_ef5b9b101_hack.cy9c5_gcp_c2s30
0.000	0.033	43.907	55.969	0.074	0.016	0.001	0.000	0.000	0.000	0.394	fbmy8028_rel_lto_jun23_ef5b9b101_hack.cy9c6_gcp_c2s30
0.000	0.028	43.489	56.392	0.074	0.015	0.001	0.000	0.000	0.000	0.436	fbmy8028_rel_lto_jun23_ef5b9b101_hack.cy9c7_gcp_c2s30
q100.1
- q100.1: range queries with 100 insert/s per client
- Legend for results is here.
- Each entry lists the percentage of responses that fit in that bucket (slower than max time for previous bucket, faster than min time for next bucket).
Query response time histogram
256us	1ms	4ms	16ms	64ms	256ms	1s	4s	16s	gt	max	tag
98.527	1.472	0.001	nonzero	nonzero	0.000	0.000	0.000	0.000	0.000	0.039	fbmy8028_rel_lto_jun23_ef5b9b101_hack.cy9c_gcp_c2s30
98.823	1.176	0.001	nonzero	0.000	0.000	0.000	0.000	0.000	0.000	0.014	fbmy8028_rel_lto_jun23_ef5b9b101_hack.cy9c1_bc60g_gcp_c2s30
98.573	1.427	0.001	nonzero	nonzero	nonzero	0.000	0.000	0.000	0.000	0.069	fbmy8028_rel_lto_jun23_ef5b9b101_hack.cy9c2_gcp_c2s30
99.080	0.918	0.001	nonzero	nonzero	0.000	0.000	0.000	0.000	0.000	0.022	fbmy8028_rel_lto_jun23_ef5b9b101_hack.cy9c3_gcp_c2s30
99.347	0.652	0.001	nonzero	nonzero	0.000	0.000	0.000	0.000	0.000	0.026	fbmy8028_rel_lto_jun23_ef5b9b101_hack.cy9c4_gcp_c2s30
99.216	0.782	0.001	nonzero	nonzero	0.000	0.000	0.000	0.000	0.000	0.021	fbmy8028_rel_lto_jun23_ef5b9b101_hack.cy9c5_gcp_c2s30
99.349	0.650	0.001	nonzero	nonzero	0.000	0.000	0.000	0.000	0.000	0.062	fbmy8028_rel_lto_jun23_ef5b9b101_hack.cy9c6_gcp_c2s30
99.115	0.884	0.001	nonzero	nonzero	0.000	0.000	0.000	0.000	0.000	0.023	fbmy8028_rel_lto_jun23_ef5b9b101_hack.cy9c7_gcp_c2s30
Insert response time histogram
256us	1ms	4ms	16ms	64ms	256ms	1s	4s	16s	gt	max	tag
0.000	19.741	80.253	0.002	0.003	0.000	0.000	0.000	0.000	0.000	0.018	fbmy8028_rel_lto_jun23_ef5b9b101_hack.cy9c_gcp_c2s30
0.000	10.356	89.625	0.010	0.003	0.005	0.000	0.000	0.000	0.000	0.232	fbmy8028_rel_lto_jun23_ef5b9b101_hack.cy9c1_bc60g_gcp_c2s30
0.000	9.384	90.613	0.003	0.000	0.000	0.000	0.000	0.000	0.000	0.014	fbmy8028_rel_lto_jun23_ef5b9b101_hack.cy9c2_gcp_c2s30
0.000	12.438	87.559	0.002	0.002	0.000	0.000	0.000	0.000	0.000	0.022	fbmy8028_rel_lto_jun23_ef5b9b101_hack.cy9c3_gcp_c2s30
0.000	2.243	97.750	0.005	0.002	0.000	0.000	0.000	0.000	0.000	0.020	fbmy8028_rel_lto_jun23_ef5b9b101_hack.cy9c4_gcp_c2s30
0.000	6.733	93.262	0.005	0.000	0.000	0.000	0.000	0.000	0.000	0.016	fbmy8028_rel_lto_jun23_ef5b9b101_hack.cy9c5_gcp_c2s30
0.000	7.755	92.241	0.003	0.000	0.000	0.000	0.000	0.000	0.000	0.006	fbmy8028_rel_lto_jun23_ef5b9b101_hack.cy9c6_gcp_c2s30
0.000	7.910	92.082	0.007	0.002	0.000	0.000	0.000	0.000	0.000	0.020	fbmy8028_rel_lto_jun23_ef5b9b101_hack.cy9c7_gcp_c2s30
Delete response time histogram
256us	1ms	4ms	16ms	64ms	256ms	1s	4s	16s	gt	max	tag
0.000	12.344	87.649	0.003	0.003	0.000	0.000	0.000	0.000	0.000	0.021	fbmy8028_rel_lto_jun23_ef5b9b101_hack.cy9c_gcp_c2s30
0.000	16.127	83.858	0.009	0.002	0.005	0.000	0.000	0.000	0.000	0.233	fbmy8028_rel_lto_jun23_ef5b9b101_hack.cy9c1_bc60g_gcp_c2s30
0.000	11.056	88.934	0.005	0.005	0.000	0.000	0.000	0.000	0.000	0.061	fbmy8028_rel_lto_jun23_ef5b9b101_hack.cy9c2_gcp_c2s30
0.000	12.826	87.168	0.003	0.002	0.000	0.000	0.000	0.000	0.000	0.025	fbmy8028_rel_lto_jun23_ef5b9b101_hack.cy9c3_gcp_c2s30
0.000	15.009	84.984	0.005	0.002	0.000	0.000	0.000	0.000	0.000	0.020	fbmy8028_rel_lto_jun23_ef5b9b101_hack.cy9c4_gcp_c2s30
0.000	11.134	88.861	0.005	0.000	0.000	0.000	0.000	0.000	0.000	0.006	fbmy8028_rel_lto_jun23_ef5b9b101_hack.cy9c5_gcp_c2s30
0.000	17.252	82.745	0.003	0.000	0.000	0.000	0.000	0.000	0.000	0.010	fbmy8028_rel_lto_jun23_ef5b9b101_hack.cy9c6_gcp_c2s30
0.000	17.042	82.953	0.003	0.002	0.000	0.000	0.000	0.000	0.000	0.021	fbmy8028_rel_lto_jun23_ef5b9b101_hack.cy9c7_gcp_c2s30
q500.1
- q500.1: range queries with 500 insert/s per client
- Legend for results is here.
- Each entry lists the percentage of responses that fit in that bucket (slower than max time for previous bucket, faster than min time for next bucket).
Query response time histogram
256us	1ms	4ms	16ms	64ms	256ms	1s	4s	16s	gt	max	tag
97.951	2.044	0.004	nonzero	0.000	0.000	0.000	0.000	0.000	0.000	0.016	fbmy8028_rel_lto_jun23_ef5b9b101_hack.cy9c_gcp_c2s30
98.172	1.821	0.006	nonzero	nonzero	0.000	0.000	0.000	0.000	0.000	0.027	fbmy8028_rel_lto_jun23_ef5b9b101_hack.cy9c1_bc60g_gcp_c2s30
97.213	2.783	0.004	nonzero	nonzero	0.000	0.000	0.000	0.000	0.000	0.016	fbmy8028_rel_lto_jun23_ef5b9b101_hack.cy9c2_gcp_c2s30
98.205	1.791	0.004	nonzero	nonzero	0.000	0.000	0.000	0.000	0.000	0.018	fbmy8028_rel_lto_jun23_ef5b9b101_hack.cy9c3_gcp_c2s30
97.540	2.454	0.006	nonzero	nonzero	0.000	0.000	0.000	0.000	0.000	0.027	fbmy8028_rel_lto_jun23_ef5b9b101_hack.cy9c4_gcp_c2s30
97.446	2.550	0.004	nonzero	nonzero	0.000	0.000	0.000	0.000	0.000	0.019	fbmy8028_rel_lto_jun23_ef5b9b101_hack.cy9c5_gcp_c2s30
98.057	1.938	0.005	nonzero	0.000	0.000	0.000	0.000	0.000	0.000	0.016	fbmy8028_rel_lto_jun23_ef5b9b101_hack.cy9c6_gcp_c2s30
97.927	2.067	0.006	nonzero	nonzero	0.000	0.000	0.000	0.000	0.000	0.017	fbmy8028_rel_lto_jun23_ef5b9b101_hack.cy9c7_gcp_c2s30
Insert response time histogram
256us	1ms	4ms	16ms	64ms	256ms	1s	4s	16s	gt	max	tag
0.000	17.999	81.883	0.117	0.000	0.000	0.000	0.000	0.000	0.000	0.011	fbmy8028_rel_lto_jun23_ef5b9b101_hack.cy9c_gcp_c2s30
0.000	10.547	87.608	1.843	0.001	0.002	0.000	0.000	0.000	0.000	0.089	fbmy8028_rel_lto_jun23_ef5b9b101_hack.cy9c1_bc60g_gcp_c2s30
0.000	2.026	97.286	0.686	0.002	0.000	0.000	0.000	0.000	0.000	0.018	fbmy8028_rel_lto_jun23_ef5b9b101_hack.cy9c2_gcp_c2s30
0.000	29.284	70.711	0.005	0.000	0.000	0.000	0.000	0.000	0.000	0.010	fbmy8028_rel_lto_jun23_ef5b9b101_hack.cy9c3_gcp_c2s30
0.000	5.779	93.468	0.748	0.005	0.000	0.000	0.000	0.000	0.000	0.024	fbmy8028_rel_lto_jun23_ef5b9b101_hack.cy9c4_gcp_c2s30
0.000	15.289	84.621	0.089	0.001	0.000	0.000	0.000	0.000	0.000	0.021	fbmy8028_rel_lto_jun23_ef5b9b101_hack.cy9c5_gcp_c2s30
0.000	13.551	86.229	0.213	0.005	0.002	0.000	0.000	0.000	0.000	0.085	fbmy8028_rel_lto_jun23_ef5b9b101_hack.cy9c6_gcp_c2s30
0.000	12.693	86.695	0.608	0.004	0.000	0.000	0.000	0.000	0.000	0.029	fbmy8028_rel_lto_jun23_ef5b9b101_hack.cy9c7_gcp_c2s30
Delete response time histogram
256us	1ms	4ms	16ms	64ms	256ms	1s	4s	16s	gt	max	tag
0.000	27.216	72.680	0.103	0.001	0.000	0.000	0.000	0.000	0.000	0.016	fbmy8028_rel_lto_jun23_ef5b9b101_hack.cy9c_gcp_c2s30
0.000	19.629	78.757	1.609	0.003	0.002	0.000	0.000	0.000	0.000	0.088	fbmy8028_rel_lto_jun23_ef5b9b101_hack.cy9c1_bc60g_gcp_c2s30
0.000	8.133	91.266	0.599	0.002	0.000	0.000	0.000	0.000	0.000	0.017	fbmy8028_rel_lto_jun23_ef5b9b101_hack.cy9c2_gcp_c2s30
0.000	36.666	63.328	0.005	0.001	0.000	0.000	0.000	0.000	0.000	0.032	fbmy8028_rel_lto_jun23_ef5b9b101_hack.cy9c3_gcp_c2s30
0.000	16.201	83.121	0.673	0.005	0.000	0.000	0.000	0.000	0.000	0.026	fbmy8028_rel_lto_jun23_ef5b9b101_hack.cy9c4_gcp_c2s30
0.000	26.024	73.891	0.084	0.001	0.000	0.000	0.000	0.000	0.000	0.021	fbmy8028_rel_lto_jun23_ef5b9b101_hack.cy9c5_gcp_c2s30
0.000	24.169	75.615	0.210	0.004	0.002	0.000	0.000	0.000	0.000	0.085	fbmy8028_rel_lto_jun23_ef5b9b101_hack.cy9c6_gcp_c2s30
0.000	23.546	75.911	0.539	0.004	0.000	0.000	0.000	0.000	0.000	0.032	fbmy8028_rel_lto_jun23_ef5b9b101_hack.cy9c7_gcp_c2s30
q1000.1
- q1000.1: range queries with 1000 insert/s per client
- Legend for results is here.
- Each entry lists the percentage of responses that fit in that bucket (slower than max time for previous bucket, faster than min time for next bucket).
Query response time histogram
256us	1ms	4ms	16ms	64ms	256ms	1s	4s	16s	gt	max	tag
94.466	5.526	0.008	nonzero	nonzero	0.000	0.000	0.000	0.000	0.000	0.042	fbmy8028_rel_lto_jun23_ef5b9b101_hack.cy9c_gcp_c2s30
95.732	4.259	0.008	nonzero	nonzero	0.000	0.000	0.000	0.000	0.000	0.025	fbmy8028_rel_lto_jun23_ef5b9b101_hack.cy9c1_bc60g_gcp_c2s30
93.914	6.080	0.006	nonzero	nonzero	nonzero	0.000	0.000	0.000	0.000	0.152	fbmy8028_rel_lto_jun23_ef5b9b101_hack.cy9c2_gcp_c2s30
94.794	5.194	0.011	nonzero	nonzero	0.000	0.000	0.000	0.000	0.000	0.047	fbmy8028_rel_lto_jun23_ef5b9b101_hack.cy9c3_gcp_c2s30
94.414	5.566	0.020	nonzero	nonzero	0.000	0.000	0.000	0.000	0.000	0.042	fbmy8028_rel_lto_jun23_ef5b9b101_hack.cy9c4_gcp_c2s30
93.919	6.063	0.018	nonzero	nonzero	0.000	0.000	0.000	0.000	0.000	0.044	fbmy8028_rel_lto_jun23_ef5b9b101_hack.cy9c5_gcp_c2s30
95.392	4.594	0.013	nonzero	nonzero	0.000	0.000	0.000	0.000	0.000	0.026	fbmy8028_rel_lto_jun23_ef5b9b101_hack.cy9c6_gcp_c2s30
95.181	4.803	0.016	nonzero	nonzero	0.000	0.000	0.000	0.000	0.000	0.022	fbmy8028_rel_lto_jun23_ef5b9b101_hack.cy9c7_gcp_c2s30
Insert response time histogram
256us	1ms	4ms	16ms	64ms	256ms	1s	4s	16s	gt	max	tag
0.000	5.260	94.471	0.268	0.001	0.000	0.000	0.000	0.000	0.000	0.039	fbmy8028_rel_lto_jun23_ef5b9b101_hack.cy9c_gcp_c2s30
0.000	8.998	90.638	0.362	0.002	0.000	0.000	0.000	0.000	0.000	0.024	fbmy8028_rel_lto_jun23_ef5b9b101_hack.cy9c1_bc60g_gcp_c2s30
0.000	2.624	96.657	0.714	0.004	0.001	0.000	0.000	0.000	0.000	0.151	fbmy8028_rel_lto_jun23_ef5b9b101_hack.cy9c2_gcp_c2s30
0.000	13.599	83.225	3.169	0.007	0.000	0.000	0.000	0.000	0.000	0.048	fbmy8028_rel_lto_jun23_ef5b9b101_hack.cy9c3_gcp_c2s30
0.000	2.710	74.283	22.990	0.017	0.000	0.000	0.000	0.000	0.000	0.040	fbmy8028_rel_lto_jun23_ef5b9b101_hack.cy9c4_gcp_c2s30
0.000	4.872	83.838	11.277	0.013	0.000	0.000	0.000	0.000	0.000	0.034	fbmy8028_rel_lto_jun23_ef5b9b101_hack.cy9c5_gcp_c2s30
0.000	5.870	89.659	4.455	0.016	0.000	0.000	0.000	0.000	0.000	0.055	fbmy8028_rel_lto_jun23_ef5b9b101_hack.cy9c6_gcp_c2s30
0.000	8.151	82.884	8.946	0.019	0.000	0.000	0.000	0.000	0.000	0.028	fbmy8028_rel_lto_jun23_ef5b9b101_hack.cy9c7_gcp_c2s30
Delete response time histogram
256us	1ms	4ms	16ms	64ms	256ms	1s	4s	16s	gt	max	tag
0.000	14.984	84.769	0.243	0.003	0.000	0.000	0.000	0.000	0.000	0.042	fbmy8028_rel_lto_jun23_ef5b9b101_hack.cy9c_gcp_c2s30
0.000	21.615	78.054	0.328	0.003	0.000	0.000	0.000	0.000	0.000	0.030	fbmy8028_rel_lto_jun23_ef5b9b101_hack.cy9c1_bc60g_gcp_c2s30
0.000	8.857	90.547	0.590	0.005	0.001	0.000	0.000	0.000	0.000	0.150	fbmy8028_rel_lto_jun23_ef5b9b101_hack.cy9c2_gcp_c2s30
0.000	15.983	81.101	2.909	0.007	0.000	0.000	0.000	0.000	0.000	0.046	fbmy8028_rel_lto_jun23_ef5b9b101_hack.cy9c3_gcp_c2s30
0.000	5.718	72.781	21.484	0.018	0.000	0.000	0.000	0.000	0.000	0.047	fbmy8028_rel_lto_jun23_ef5b9b101_hack.cy9c4_gcp_c2s30
0.000	8.705	80.861	10.423	0.010	0.000	0.000	0.000	0.000	0.000	0.043	fbmy8028_rel_lto_jun23_ef5b9b101_hack.cy9c5_gcp_c2s30
0.000	11.898	84.126	3.959	0.018	0.000	0.000	0.000	0.000	0.000	0.056	fbmy8028_rel_lto_jun23_ef5b9b101_hack.cy9c6_gcp_c2s30
0.000	12.492	79.234	8.255	0.018	0.000	0.000	0.000	0.000	0.000	0.032	fbmy8028_rel_lto_jun23_ef5b9b101_hack.cy9c7_gcp_c2s30