Introduction
This is a report for the insert benchmark with 800M docs and 1 client(s). It is generated by scripts (bash, awk, sed) and Tufte might not be impressed. An overview of the insert benchmark is here and a short update is here. Below, by DBMS, I mean DBMS+version.config. An example is my8020.c10b40 where my means MySQL, 8020 is version 8.0.20 and c10b40 is the name for the configuration file.
The test server has 8 AMD cores, 16G RAM and an NVMe SSD. It is described here as the Beelink. The benchmark was run with 1 client and there were 1 or 3 connections per client (1 for queries or inserts without rate limits, 1+1 for rate limited inserts+deletes). It uses 1 table. It loads 800M rows per table without secondary indexes, creates secondary indexes, then inserts 10M rows per table with a delete per insert to avoid growing the table. It then does 3 read+write tests for 1800s each that do queries as fast as possible with 100, 500 and then 1000 inserts/second/client concurrent with the queries and 1000 deletes/second to avoid growing the table. The database is cached by Postgres. Clients and the DBMS share one server. The per-database configs are in the per-database subdirectories here.
The tested DBMS are:
- pg152_o2_nofp.cx8_bee - Postgres 15.2, cx8_bee config, o2_nofp build that used: -O2 -no-omit-frame-pointer
- pg152_o2_nofp.cx8a1_bee - Postgres 15.2, cx8a1_bee config, o2_nofp build that used: -O2 -no-omit-frame-pointer, adds wal_compression=lz4
- pg152_o2_nofp.cx8a2_bee - Postgres 15.2, cx8a2_bee config, o2_nofp build that used: -O2 -no-omit-frame-pointer, adds backend_flush_after=256kb
- pg152_o2_nofp.cx8a3_bee - Postgres 15.2, cx8a3_bee config, o2_nofp build that used: -O2 -no-omit-frame-pointer, adds full_page_writes=off
- pg152_o2_nofp.cx8a4_bee - Postgres 15.2, cx8a4_bee config, o2_nofp build that used: -O2 -no-omit-frame-pointer, adds checkpoint_timeout=1800s which already set in the cx8_bee config
- pg152_o2_nofp.cx8a9_bee - Postgres 15.2, cx8a9_bee config, o2_nofp build that used: -O2 -no-omit-frame-pointer, adds checkpoint_timeout=900s
- pg152_o2_nofp.cx8a10_bee - Postgres 15.2, cx8a10_bee config, o2_nofp build that used: -O2 -no-omit-frame-pointer, adds autovacuum_work_mem=256MB
- pg152_o2_nofp.cx8a12_bee - Postgres 15.2, cx8a12_bee config, o2_nofp build that used: -O2 -no-omit-frame-pointer, adds wal_buffers=64MB
- pg152_o2_nofp.cx8a14_bee - Postgres 15.2, cx8a14_bee config, o2_nofp build that used: -O2 -no-omit-frame-pointer, adds backend_flush_after=1MB
- pg152_o2_nofp.cx8a15_bee - Postgres 15.2, cx8a15_bee config, o2_nofp build that used: -O2 -no-omit-frame-pointer, adds max_wal_size=10G
- pg152_o2_nofp.cx8a16_bee - Postgres 15.2, cx8a16_bee config, o2_nofp build that used: -O2 -no-omit-frame-pointer, adds autovacuum_vacuum_scale_factor=0.05 autovacuum_vacuum_insert_scale_factor=0.05
- pg152_o2_nofp.cx8a17_bee - Postgres 15.2, cx8a17_bee config, o2_nofp build that used: -O2 -no-omit-frame-pointer, reduces bgwriter_lru_maxpages from 2000 to 500
- pg152_o2_nofp.cx8a18_bee - Postgres 15.2, cx8a18_bee config, o2_nofp build that used: -O2 -no-omit-frame-pointer, combines a1, a10, a12, a16
- pg152_o2_nofp.cx8a20_bee - Postgres 15.2, cx8a20_bee config, o2_nofp build that used: -O2 -no-omit-frame-pointer, combines a10, a12, a16
- pg152_o2_nofp.cx8a21_bee - Postgres 15.2, cx8a21_bee config, o2_nofp build that used: -O2 -no-omit-frame-pointer, combines a1, a4, a10, a16
- pg152_o2_nofp.cx8a22_bee - Postgres 15.2, cx8a22_bee config, o2_nofp build that used: -O2 -no-omit-frame-pointer, combines a1, a10, a16
Contents
- Summary
- l.i0: load without secondary indexes
- l.x: create secondary indexes
- l.i1: continue load after secondary indexes created
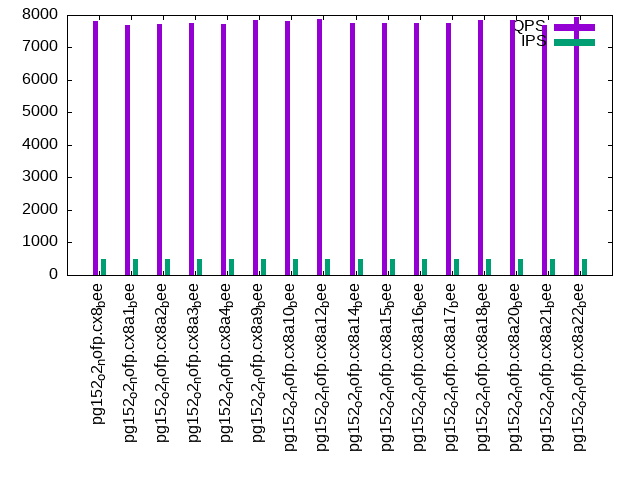
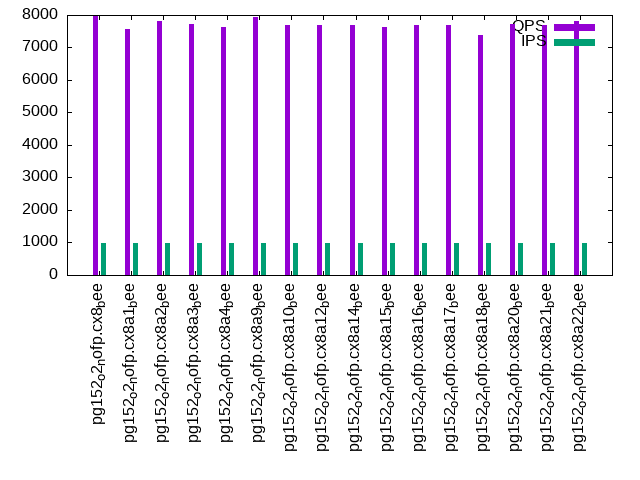
- q100.1: range queries with 100 insert/s per client
- q500.1: range queries with 500 insert/s per client
- q1000.1: range queries with 1000 insert/s per client
Summary
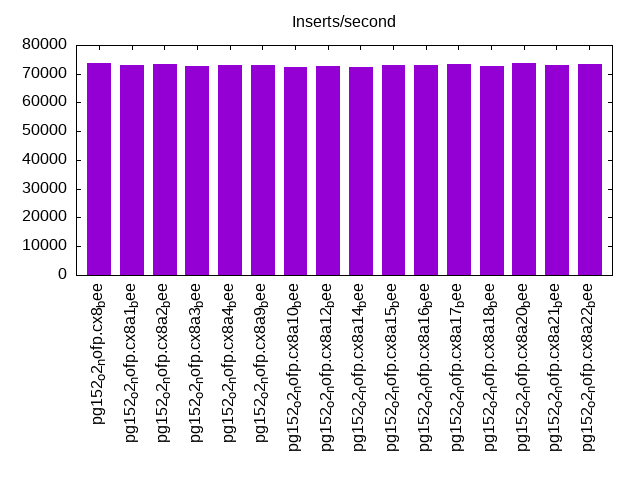
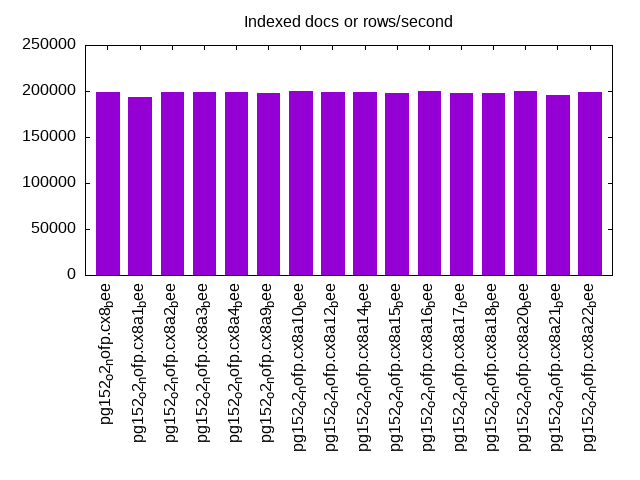
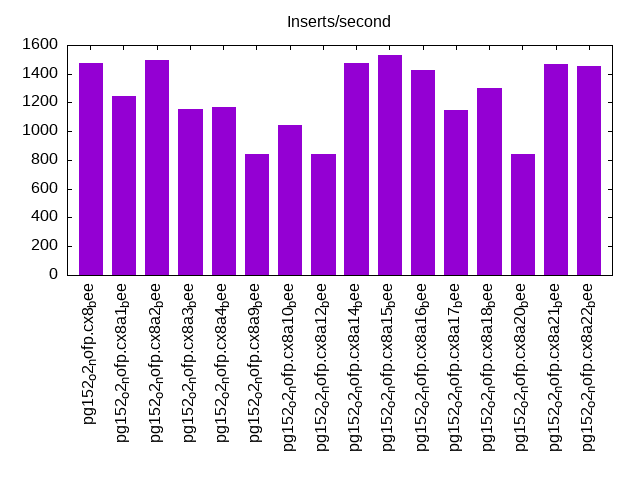
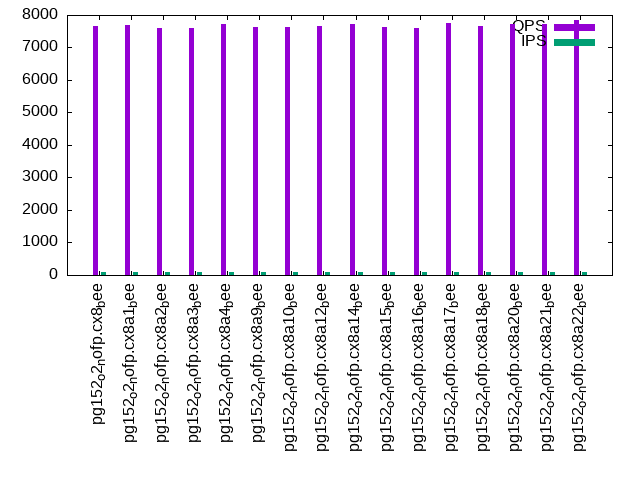
The numbers are inserts/s for l.i0 and l.i1, indexed docs (or rows) /s for l.x and queries/s for q*.2. The values are the average rate over the entire test for inserts (IPS) and queries (QPS). The range of values for IPS and QPS is split into 3 parts: bottom 25%, middle 50%, top 25%. Values in the bottom 25% have a red background, values in the top 25% have a green background and values in the middle have no color. A gray background is used for values that can be ignored because the DBMS did not sustain the target insert rate. Red backgrounds are not used when the minimum value is within 80% of the max value.
| dbms | l.i0 | l.x | l.i1 | q100.1 | q500.1 | q1000.1 |
|---|---|---|---|---|---|---|
| pg152_o2_nofp.cx8_bee | 73590 | 198536 | 1473 | 7651 | 7822 | 7992 |
| pg152_o2_nofp.cx8a1_bee | 72946 | 193917 | 1246 | 7697 | 7693 | 7584 |
| pg152_o2_nofp.cx8a2_bee | 73354 | 198536 | 1494 | 7605 | 7710 | 7805 |
| pg152_o2_nofp.cx8a3_bee | 72760 | 199129 | 1158 | 7606 | 7768 | 7728 |
| pg152_o2_nofp.cx8a4_bee | 73039 | 198684 | 1170 | 7725 | 7733 | 7631 |
| pg152_o2_nofp.cx8a9_bee | 73053 | 198290 | 844 | 7631 | 7852 | 7944 |
| pg152_o2_nofp.cx8a10_bee | 72497 | 200275 | 1041 | 7624 | 7813 | 7688 |
| pg152_o2_nofp.cx8a12_bee | 72767 | 199427 | 841 | 7659 | 7875 | 7688 |
| pg152_o2_nofp.cx8a14_bee | 72418 | 198684 | 1478 | 7726 | 7758 | 7690 |
| pg152_o2_nofp.cx8a15_bee | 73006 | 197898 | 1529 | 7645 | 7768 | 7618 |
| pg152_o2_nofp.cx8a16_bee | 73146 | 199775 | 1428 | 7599 | 7766 | 7706 |
| pg152_o2_nofp.cx8a17_bee | 73327 | 198339 | 1149 | 7754 | 7768 | 7699 |
| pg152_o2_nofp.cx8a18_bee | 72820 | 198044 | 1304 | 7664 | 7855 | 7383 |
| pg152_o2_nofp.cx8a20_bee | 73644 | 199825 | 843 | 7734 | 7861 | 7734 |
| pg152_o2_nofp.cx8a21_bee | 73133 | 195719 | 1470 | 7734 | 7688 | 7697 |
| pg152_o2_nofp.cx8a22_bee | 73314 | 199278 | 1454 | 7845 | 7948 | 7812 |
This table has relative throughput, throughput for the DBMS relative to the DBMS in the first line, using the absolute throughput from the previous table. Values less than 0.95 have a yellow background. Values greater than 1.05 have a blue background.
| dbms | l.i0 | l.x | l.i1 | q100.1 | q500.1 | q1000.1 |
|---|---|---|---|---|---|---|
| pg152_o2_nofp.cx8_bee | 1.00 | 1.00 | 1.00 | 1.00 | 1.00 | 1.00 |
| pg152_o2_nofp.cx8a1_bee | 0.99 | 0.98 | 0.85 | 1.01 | 0.98 | 0.95 |
| pg152_o2_nofp.cx8a2_bee | 1.00 | 1.00 | 1.01 | 0.99 | 0.99 | 0.98 |
| pg152_o2_nofp.cx8a3_bee | 0.99 | 1.00 | 0.79 | 0.99 | 0.99 | 0.97 |
| pg152_o2_nofp.cx8a4_bee | 0.99 | 1.00 | 0.79 | 1.01 | 0.99 | 0.95 |
| pg152_o2_nofp.cx8a9_bee | 0.99 | 1.00 | 0.57 | 1.00 | 1.00 | 0.99 |
| pg152_o2_nofp.cx8a10_bee | 0.99 | 1.01 | 0.71 | 1.00 | 1.00 | 0.96 |
| pg152_o2_nofp.cx8a12_bee | 0.99 | 1.00 | 0.57 | 1.00 | 1.01 | 0.96 |
| pg152_o2_nofp.cx8a14_bee | 0.98 | 1.00 | 1.00 | 1.01 | 0.99 | 0.96 |
| pg152_o2_nofp.cx8a15_bee | 0.99 | 1.00 | 1.04 | 1.00 | 0.99 | 0.95 |
| pg152_o2_nofp.cx8a16_bee | 0.99 | 1.01 | 0.97 | 0.99 | 0.99 | 0.96 |
| pg152_o2_nofp.cx8a17_bee | 1.00 | 1.00 | 0.78 | 1.01 | 0.99 | 0.96 |
| pg152_o2_nofp.cx8a18_bee | 0.99 | 1.00 | 0.89 | 1.00 | 1.00 | 0.92 |
| pg152_o2_nofp.cx8a20_bee | 1.00 | 1.01 | 0.57 | 1.01 | 1.00 | 0.97 |
| pg152_o2_nofp.cx8a21_bee | 0.99 | 0.99 | 1.00 | 1.01 | 0.98 | 0.96 |
| pg152_o2_nofp.cx8a22_bee | 1.00 | 1.00 | 0.99 | 1.03 | 1.02 | 0.98 |
This lists the average rate of inserts/s for the tests that do inserts concurrent with queries. For such tests the query rate is listed in the table above. The read+write tests are setup so that the insert rate should match the target rate every second. Cells that are not at least 95% of the target have a red background to indicate a failure to satisfy the target.
| dbms | q100.1 | q500.1 | q1000.1 |
|---|---|---|---|
| pg152_o2_nofp.cx8_bee | 100 | 499 | 998 |
| pg152_o2_nofp.cx8a1_bee | 100 | 499 | 998 |
| pg152_o2_nofp.cx8a2_bee | 100 | 499 | 998 |
| pg152_o2_nofp.cx8a3_bee | 100 | 499 | 998 |
| pg152_o2_nofp.cx8a4_bee | 100 | 499 | 998 |
| pg152_o2_nofp.cx8a9_bee | 100 | 499 | 998 |
| pg152_o2_nofp.cx8a10_bee | 100 | 499 | 998 |
| pg152_o2_nofp.cx8a12_bee | 100 | 499 | 998 |
| pg152_o2_nofp.cx8a14_bee | 100 | 499 | 998 |
| pg152_o2_nofp.cx8a15_bee | 100 | 499 | 998 |
| pg152_o2_nofp.cx8a16_bee | 100 | 499 | 998 |
| pg152_o2_nofp.cx8a17_bee | 100 | 499 | 998 |
| pg152_o2_nofp.cx8a18_bee | 100 | 499 | 998 |
| pg152_o2_nofp.cx8a20_bee | 100 | 499 | 998 |
| pg152_o2_nofp.cx8a21_bee | 100 | 499 | 998 |
| pg152_o2_nofp.cx8a22_bee | 100 | 499 | 998 |
| target | 100 | 500 | 1000 |
l.i0
l.i0: load without secondary indexes. Graphs for performance per 1-second interval are here.
Average throughput:
Insert response time histogram: each cell has the percentage of responses that take <= the time in the header and max is the max response time in seconds. For the max column values in the top 25% of the range have a red background and in the bottom 25% of the range have a green background. The red background is not used when the min value is within 80% of the max value.
| dbms | 256us | 1ms | 4ms | 16ms | 64ms | 256ms | 1s | 4s | 16s | gt | max |
|---|---|---|---|---|---|---|---|---|---|---|---|
| pg152_o2_nofp.cx8_bee | 99.998 | 0.001 | nonzero | nonzero | 0.123 | ||||||
| pg152_o2_nofp.cx8a1_bee | 99.999 | 0.001 | nonzero | 0.060 | |||||||
| pg152_o2_nofp.cx8a2_bee | 99.998 | 0.002 | 0.001 | 0.058 | |||||||
| pg152_o2_nofp.cx8a3_bee | 99.999 | nonzero | nonzero | 0.058 | |||||||
| pg152_o2_nofp.cx8a4_bee | 99.998 | 0.002 | nonzero | nonzero | 0.144 | ||||||
| pg152_o2_nofp.cx8a9_bee | 99.997 | 0.002 | 0.001 | nonzero | 0.079 | ||||||
| pg152_o2_nofp.cx8a10_bee | 99.995 | 0.003 | 0.001 | nonzero | 0.099 | ||||||
| pg152_o2_nofp.cx8a12_bee | 99.999 | 0.001 | nonzero | 0.056 | |||||||
| pg152_o2_nofp.cx8a14_bee | 99.998 | 0.001 | nonzero | 0.057 | |||||||
| pg152_o2_nofp.cx8a15_bee | 99.998 | 0.002 | nonzero | nonzero | 0.524 | ||||||
| pg152_o2_nofp.cx8a16_bee | 99.998 | 0.001 | nonzero | 0.056 | |||||||
| pg152_o2_nofp.cx8a17_bee | 99.997 | 0.002 | nonzero | nonzero | 0.129 | ||||||
| pg152_o2_nofp.cx8a18_bee | 99.999 | nonzero | nonzero | 0.057 | |||||||
| pg152_o2_nofp.cx8a20_bee | 99.999 | nonzero | nonzero | 0.056 | |||||||
| pg152_o2_nofp.cx8a21_bee | 99.999 | 0.001 | nonzero | 0.060 | |||||||
| pg152_o2_nofp.cx8a22_bee | 99.999 | 0.001 | nonzero | 0.056 |
Performance metrics for the DBMS listed above. Some are normalized by throughput, others are not. Legend for results is here.
ips	qps	rps	rmbps	wps	wmbps	rpq	rkbpq	wpi	wkbpi	csps	cpups	cspq	cpupq	dbgb1	dbgb2	rss	maxop	p50	p99	tag
73590	0	33	0.4	114.2	32.4	0.000	0.006	0.002	0.451	8985	23.1	0.122	25	76.5	116.6	0.0	0.123	73657	72517	800m.pg152_o2_nofp.cx8_bee
72946	0	33	0.4	109.9	31.6	0.000	0.006	0.002	0.443	8911	23.1	0.122	25	76.5	116.6	0.0	0.060	73019	71719	800m.pg152_o2_nofp.cx8a1_bee
73354	0	33	0.4	114.8	32.5	0.000	0.006	0.002	0.454	8955	23.1	0.122	25	76.5	116.6	0.0	0.058	73419	72218	800m.pg152_o2_nofp.cx8a2_bee
72760	0	35	0.7	112.0	30.4	0.000	0.009	0.002	0.428	8898	23.0	0.122	25	76.5	116.6	0.0	0.058	72850	71720	800m.pg152_o2_nofp.cx8a3_bee
73039	0	34	0.5	119.3	32.3	0.000	0.007	0.002	0.453	8916	23.2	0.122	25	76.5	116.6	0.0	0.144	73117	71818	800m.pg152_o2_nofp.cx8a4_bee
73053	0	32	0.4	116.1	32.9	0.000	0.005	0.002	0.461	8910	23.1	0.122	25	76.5	106.1	0.0	0.079	73158	71621	800m.pg152_o2_nofp.cx8a9_bee
72497	0	34	0.7	121.2	33.8	0.000	0.010	0.002	0.478	8857	23.1	0.122	25	76.5	116.6	0.0	0.099	72617	71318	800m.pg152_o2_nofp.cx8a10_bee
72767	0	33	0.5	115.6	32.5	0.000	0.007	0.002	0.457	8889	23.0	0.122	25	76.5	116.6	0.1	0.056	72855	71619	800m.pg152_o2_nofp.cx8a12_bee
72418	0	35	0.5	113.6	31.6	0.000	0.007	0.002	0.447	8883	23.0	0.123	25	76.5	116.6	0.0	0.057	72517	71219	800m.pg152_o2_nofp.cx8a14_bee
73006	0	34	0.5	125.6	34.4	0.000	0.007	0.002	0.483	8882	23.2	0.122	25	76.5	86.6	0.0	0.524	73117	71652	800m.pg152_o2_nofp.cx8a15_bee
73146	0	32	0.3	104.8	30.2	0.000	0.004	0.001	0.423	8920	23.1	0.122	25	76.5	116.6	0.0	0.056	73219	71821	800m.pg152_o2_nofp.cx8a16_bee
73327	0	34	0.4	113.4	32.1	0.000	0.006	0.002	0.448	8947	23.0	0.122	25	76.5	116.6	0.0	0.129	73418	72121	800m.pg152_o2_nofp.cx8a17_bee
72820	0	31	0.2	104.9	29.8	0.000	0.003	0.001	0.418	8893	22.9	0.122	25	76.5	116.6	0.0	0.057	72915	71759	800m.pg152_o2_nofp.cx8a18_bee
73644	0	30	0.2	106.2	30.3	0.000	0.003	0.001	0.422	8990	23.2	0.122	25	76.5	116.6	0.0	0.056	73717	72417	800m.pg152_o2_nofp.cx8a20_bee
73133	0	32	0.3	105.5	29.9	0.000	0.004	0.001	0.419	8932	23.1	0.122	25	76.5	116.6	0.0	0.060	73217	71821	800m.pg152_o2_nofp.cx8a21_bee
73314	0	31	0.2	105.7	30.2	0.000	0.003	0.001	0.422	8936	23.0	0.122	25	76.5	116.6	0.0	0.056	73416	72315	800m.pg152_o2_nofp.cx8a22_bee
l.x
l.x: create secondary indexes.
Average throughput:
Performance metrics for the DBMS listed above. Some are normalized by throughput, others are not. Legend for results is here.
ips	qps	rps	rmbps	wps	wmbps	rpq	rkbpq	wpi	wkbpi	csps	cpups	cspq	cpupq	dbgb1	dbgb2	rss	maxop	p50	p99	tag
198536	0	586	71.8	200.3	69.9	0.003	0.370	0.001	0.361	430	12.5	0.002	5	147.0	187.1	0.0	0.004	NA	NA	800m.pg152_o2_nofp.cx8_bee
193917	0	573	70.2	177.6	62.2	0.003	0.371	0.001	0.328	377	12.6	0.002	5	147.0	187.1	0.0	0.005	NA	NA	800m.pg152_o2_nofp.cx8a1_bee
198536	0	585	71.8	202.0	70.0	0.003	0.370	0.001	0.361	407	12.5	0.002	5	147.0	187.1	0.0	0.005	NA	NA	800m.pg152_o2_nofp.cx8a2_bee
199129	0	582	71.7	191.1	68.0	0.003	0.369	0.001	0.350	424	12.4	0.002	5	147.0	187.1	0.0	0.005	NA	NA	800m.pg152_o2_nofp.cx8a3_bee
198684	0	584	71.9	200.8	69.8	0.003	0.370	0.001	0.360	413	12.5	0.002	5	147.0	187.1	0.0	0.006	NA	NA	800m.pg152_o2_nofp.cx8a4_bee
198290	0	584	71.8	206.6	72.5	0.003	0.371	0.001	0.374	434	12.5	0.002	5	147.0	176.6	0.0	0.005	NA	NA	800m.pg152_o2_nofp.cx8a9_bee
200275	0	581	71.6	193.2	68.0	0.003	0.366	0.001	0.348	400	12.4	0.002	5	147.0	187.1	0.0	0.005	NA	NA	800m.pg152_o2_nofp.cx8a10_bee
199427	0	589	72.2	204.7	72.2	0.003	0.371	0.001	0.371	423	12.5	0.002	5	147.0	187.1	0.0	0.003	NA	NA	800m.pg152_o2_nofp.cx8a12_bee
198684	0	583	71.8	198.8	69.3	0.003	0.370	0.001	0.357	412	12.5	0.002	5	147.0	187.1	0.0	0.004	NA	NA	800m.pg152_o2_nofp.cx8a14_bee
197898	0	582	71.7	205.4	71.5	0.003	0.371	0.001	0.370	402	12.5	0.002	5	147.0	157.1	0.0	0.005	NA	NA	800m.pg152_o2_nofp.cx8a15_bee
199775	0	585	72.0	192.5	68.0	0.003	0.369	0.001	0.349	396	12.5	0.002	5	147.0	187.1	0.0	0.004	NA	NA	800m.pg152_o2_nofp.cx8a16_bee
198339	0	583	71.8	209.8	72.6	0.003	0.371	0.001	0.375	413	12.5	0.002	5	147.0	187.1	0.0	0.004	NA	NA	800m.pg152_o2_nofp.cx8a17_bee
198044	0	580	71.4	167.9	60.9	0.003	0.369	0.001	0.315	378	12.6	0.002	5	147.0	187.1	0.0	0.007	NA	NA	800m.pg152_o2_nofp.cx8a18_bee
199825	0	586	72.0	194.7	68.2	0.003	0.369	0.001	0.350	388	12.4	0.002	5	147.0	187.1	0.0	0.004	NA	NA	800m.pg152_o2_nofp.cx8a20_bee
195719	0	574	70.6	168.2	60.2	0.003	0.369	0.001	0.315	380	12.5	0.002	5	147.0	187.1	0.0	0.005	NA	NA	800m.pg152_o2_nofp.cx8a21_bee
199278	0	584	71.9	193.3	68.2	0.003	0.369	0.001	0.350	404	12.5	0.002	5	147.0	187.1	0.0	0.006	NA	NA	800m.pg152_o2_nofp.cx8a22_bee
l.i1
l.i1: continue load after secondary indexes created. Graphs for performance per 1-second interval are here.
Average throughput:
Insert response time histogram: each cell has the percentage of responses that take <= the time in the header and max is the max response time in seconds. For the max column values in the top 25% of the range have a red background and in the bottom 25% of the range have a green background. The red background is not used when the min value is within 80% of the max value.
| dbms | 256us | 1ms | 4ms | 16ms | 64ms | 256ms | 1s | 4s | 16s | gt | max |
|---|---|---|---|---|---|---|---|---|---|---|---|
| pg152_o2_nofp.cx8_bee | 94.305 | 5.693 | 0.002 | 0.078 | |||||||
| pg152_o2_nofp.cx8a1_bee | 87.136 | 12.864 | 0.001 | 0.069 | |||||||
| pg152_o2_nofp.cx8a2_bee | 94.669 | 5.330 | 0.001 | 0.065 | |||||||
| pg152_o2_nofp.cx8a3_bee | 96.266 | 3.735 | 0.055 | ||||||||
| pg152_o2_nofp.cx8a4_bee | 94.079 | 5.919 | 0.002 | 0.067 | |||||||
| pg152_o2_nofp.cx8a9_bee | 92.633 | 7.366 | 0.057 | ||||||||
| pg152_o2_nofp.cx8a10_bee | 95.138 | 4.862 | 0.060 | ||||||||
| pg152_o2_nofp.cx8a12_bee | 94.309 | 5.691 | 0.062 | ||||||||
| pg152_o2_nofp.cx8a14_bee | 93.663 | 6.337 | 0.001 | 0.065 | |||||||
| pg152_o2_nofp.cx8a15_bee | 92.572 | 7.428 | 0.062 | ||||||||
| pg152_o2_nofp.cx8a16_bee | 92.805 | 7.187 | 0.008 | 0.144 | |||||||
| pg152_o2_nofp.cx8a17_bee | 81.029 | 18.904 | 0.067 | 0.214 | |||||||
| pg152_o2_nofp.cx8a18_bee | 88.890 | 11.110 | 0.001 | 0.070 | |||||||
| pg152_o2_nofp.cx8a20_bee | 92.492 | 7.508 | 0.064 | ||||||||
| pg152_o2_nofp.cx8a21_bee | 89.394 | 10.604 | 0.002 | 0.069 | |||||||
| pg152_o2_nofp.cx8a22_bee | 92.880 | 7.119 | 0.002 | 0.086 |
Delete response time histogram: each cell has the percentage of responses that take <= the time in the header and max is the max response time in seconds. For the max column values in the top 25% of the range have a red background and in the bottom 25% of the range have a green background. The red background is not used when the min value is within 80% of the max value.
| dbms | 256us | 1ms | 4ms | 16ms | 64ms | 256ms | 1s | 4s | 16s | gt | max |
|---|---|---|---|---|---|---|---|---|---|---|---|
| pg152_o2_nofp.cx8_bee | 0.003 | 30.128 | 2.154 | 10.919 | 41.547 | 15.249 | 0.001 | 0.310 | |||
| pg152_o2_nofp.cx8a1_bee | 0.001 | 21.827 | 2.071 | 11.068 | 41.308 | 23.726 | 0.096 | ||||
| pg152_o2_nofp.cx8a2_bee | 0.003 | 32.827 | 2.087 | 10.928 | 41.502 | 12.652 | 0.001 | 0.312 | |||
| pg152_o2_nofp.cx8a3_bee | 0.002 | 17.492 | 2.004 | 11.009 | 41.401 | 28.092 | 0.102 | ||||
| pg152_o2_nofp.cx8a4_bee | 0.003 | 18.334 | 2.027 | 11.023 | 41.512 | 27.101 | 0.100 | ||||
| pg152_o2_nofp.cx8a9_bee | 0.128 | 1.946 | 11.147 | 41.212 | 45.568 | 0.121 | |||||
| pg152_o2_nofp.cx8a10_bee | 0.003 | 11.807 | 1.991 | 11.166 | 41.528 | 33.505 | 0.110 | ||||
| pg152_o2_nofp.cx8a12_bee | 0.213 | 1.961 | 11.050 | 41.472 | 45.305 | 0.123 | |||||
| pg152_o2_nofp.cx8a14_bee | 0.005 | 30.255 | 2.055 | 11.159 | 41.279 | 15.248 | 0.087 | ||||
| pg152_o2_nofp.cx8a15_bee | 0.001 | 31.761 | 2.057 | 11.246 | 41.266 | 13.668 | 0.082 | ||||
| pg152_o2_nofp.cx8a16_bee | 0.004 | 28.662 | 1.954 | 11.127 | 41.459 | 16.794 | 0.089 | ||||
| pg152_o2_nofp.cx8a17_bee | 0.002 | 18.390 | 2.053 | 11.016 | 41.450 | 27.090 | 0.098 | ||||
| pg152_o2_nofp.cx8a18_bee | 0.003 | 24.075 | 1.867 | 11.293 | 41.247 | 21.516 | 0.092 | ||||
| pg152_o2_nofp.cx8a20_bee | 0.001 | 0.121 | 2.038 | 11.144 | 41.458 | 45.238 | 0.120 | ||||
| pg152_o2_nofp.cx8a21_bee | 0.003 | 30.152 | 2.008 | 11.236 | 41.314 | 15.287 | 0.088 | ||||
| pg152_o2_nofp.cx8a22_bee | 0.003 | 29.471 | 1.997 | 11.204 | 41.538 | 15.787 | 0.088 |
Performance metrics for the DBMS listed above. Some are normalized by throughput, others are not. Legend for results is here.
ips	qps	rps	rmbps	wps	wmbps	rpq	rkbpq	wpi	wkbpi	csps	cpups	cspq	cpupq	dbgb1	dbgb2	rss	maxop	p50	p99	tag
1473	0	2383	18.9	2677.7	37.8	1.618	13.175	1.818	26.252	5694	13.4	3.866	728	148.8	188.8	0.0	0.078	949	599	800m.pg152_o2_nofp.cx8_bee
1246	0	2005	15.9	2236.0	26.1	1.610	13.106	1.795	21.480	4786	13.7	3.842	880	148.8	188.6	0.0	0.069	799	549	800m.pg152_o2_nofp.cx8a1_bee
1494	0	2418	19.2	2716.7	38.1	1.618	13.180	1.818	26.085	5766	13.3	3.859	712	148.8	188.8	0.0	0.065	949	449	800m.pg152_o2_nofp.cx8a2_bee
1158	0	1873	15.0	2060.9	17.0	1.618	13.234	1.780	15.016	4438	13.4	3.834	926	148.8	187.6	0.0	0.055	749	499	800m.pg152_o2_nofp.cx8a3_bee
1170	0	1890	15.0	2139.8	30.2	1.616	13.126	1.829	26.470	4552	13.6	3.890	930	148.8	188.8	0.0	0.067	799	499	800m.pg152_o2_nofp.cx8a4_bee
844	0	1362	10.8	1573.3	24.7	1.614	13.105	1.864	29.996	3326	13.8	3.940	1308	148.8	175.0	0.0	0.057	599	400	800m.pg152_o2_nofp.cx8a9_bee
1041	0	1684	13.4	1901.3	27.1	1.618	13.141	1.826	26.670	4058	13.7	3.897	1053	148.8	188.8	0.0	0.060	699	499	800m.pg152_o2_nofp.cx8a10_bee
841	0	1358	10.8	1543.3	22.3	1.614	13.111	1.834	27.187	3304	13.7	3.928	1303	148.8	187.2	0.0	0.062	599	400	800m.pg152_o2_nofp.cx8a12_bee
1478	0	2384	18.9	2691.0	38.0	1.613	13.106	1.821	26.365	5693	13.3	3.853	720	148.8	188.8	0.0	0.065	949	599	800m.pg152_o2_nofp.cx8a14_bee
1529	0	2460	19.5	2972.4	48.3	1.608	13.060	1.944	32.314	5925	13.7	3.875	717	148.8	158.8	0.0	0.062	999	599	800m.pg152_o2_nofp.cx8a15_bee
1428	0	2315	18.8	2611.8	38.0	1.621	13.462	1.829	27.227	5543	13.4	3.881	751	148.8	188.8	0.0	0.144	949	599	800m.pg152_o2_nofp.cx8a16_bee
1149	0	1905	20.8	2173.1	37.2	1.658	18.552	1.892	33.182	4578	13.7	3.986	954	148.7	188.8	9.2	0.214	799	499	800m.pg152_o2_nofp.cx8a17_bee
1304	0	2110	16.8	2343.2	27.4	1.619	13.178	1.797	21.554	5022	13.7	3.852	841	148.8	187.9	0.0	0.070	849	549	800m.pg152_o2_nofp.cx8a18_bee
843	0	1369	10.9	1547.7	22.4	1.624	13.188	1.836	27.205	3329	13.8	3.949	1310	148.8	187.4	0.0	0.064	599	400	800m.pg152_o2_nofp.cx8a20_bee
1470	0	2378	18.9	2637.2	30.9	1.618	13.176	1.794	21.525	5644	13.6	3.840	740	148.8	188.8	0.0	0.069	949	599	800m.pg152_o2_nofp.cx8a21_bee
1454	0	2355	18.7	2647.3	37.2	1.619	13.158	1.820	26.168	5642	13.3	3.879	732	148.8	188.8	0.0	0.086	949	599	800m.pg152_o2_nofp.cx8a22_bee
q100.1
q100.1: range queries with 100 insert/s per client. Graphs for performance per 1-second interval are here.
Average throughput:
Query response time histogram: each cell has the percentage of responses that take <= the time in the header and max is the max response time in seconds. For max values in the top 25% of the range have a red background and in the bottom 25% of the range have a green background. The red background is not used when the min value is within 80% of the max value.
| dbms | 256us | 1ms | 4ms | 16ms | 64ms | 256ms | 1s | 4s | 16s | gt | max |
|---|---|---|---|---|---|---|---|---|---|---|---|
| pg152_o2_nofp.cx8_bee | 99.042 | 0.946 | 0.009 | 0.003 | nonzero | 0.030 | |||||
| pg152_o2_nofp.cx8a1_bee | 99.046 | 0.938 | 0.012 | 0.003 | nonzero | 0.032 | |||||
| pg152_o2_nofp.cx8a2_bee | 99.165 | 0.820 | 0.011 | 0.004 | nonzero | 0.019 | |||||
| pg152_o2_nofp.cx8a3_bee | 99.029 | 0.953 | 0.015 | 0.002 | nonzero | 0.019 | |||||
| pg152_o2_nofp.cx8a4_bee | 99.055 | 0.931 | 0.010 | 0.004 | nonzero | 0.032 | |||||
| pg152_o2_nofp.cx8a9_bee | 99.080 | 0.912 | 0.007 | 0.001 | nonzero | 0.020 | |||||
| pg152_o2_nofp.cx8a10_bee | 99.033 | 0.954 | 0.010 | 0.004 | nonzero | 0.019 | |||||
| pg152_o2_nofp.cx8a12_bee | 99.074 | 0.913 | 0.009 | 0.004 | nonzero | 0.033 | |||||
| pg152_o2_nofp.cx8a14_bee | 99.092 | 0.896 | 0.009 | 0.003 | nonzero | 0.025 | |||||
| pg152_o2_nofp.cx8a15_bee | 99.200 | 0.794 | 0.003 | 0.003 | 0.015 | ||||||
| pg152_o2_nofp.cx8a16_bee | 99.098 | 0.887 | 0.010 | 0.005 | nonzero | 0.031 | |||||
| pg152_o2_nofp.cx8a17_bee | 99.100 | 0.885 | 0.011 | 0.004 | nonzero | 0.024 | |||||
| pg152_o2_nofp.cx8a18_bee | 99.039 | 0.945 | 0.014 | 0.003 | nonzero | 0.020 | |||||
| pg152_o2_nofp.cx8a20_bee | 99.099 | 0.891 | 0.007 | 0.003 | nonzero | 0.030 | |||||
| pg152_o2_nofp.cx8a21_bee | 99.107 | 0.880 | 0.010 | 0.003 | nonzero | 0.021 | |||||
| pg152_o2_nofp.cx8a22_bee | 99.122 | 0.866 | 0.009 | 0.003 | nonzero | 0.024 |
Insert response time histogram: each cell has the percentage of responses that take <= the time in the header and max is the max response time in seconds. For max values in the top 25% of the range have a red background and in the bottom 25% of the range have a green background. The red background is not used when the min value is within 80% of the max value.
| dbms | 256us | 1ms | 4ms | 16ms | 64ms | 256ms | 1s | 4s | 16s | gt | max |
|---|---|---|---|---|---|---|---|---|---|---|---|
| pg152_o2_nofp.cx8_bee | 68.361 | 31.639 | 0.031 | ||||||||
| pg152_o2_nofp.cx8a1_bee | 47.556 | 52.444 | 0.033 | ||||||||
| pg152_o2_nofp.cx8a2_bee | 55.972 | 44.028 | 0.059 | ||||||||
| pg152_o2_nofp.cx8a3_bee | 66.694 | 33.306 | 0.059 | ||||||||
| pg152_o2_nofp.cx8a4_bee | 56.472 | 43.528 | 0.044 | ||||||||
| pg152_o2_nofp.cx8a9_bee | 82.361 | 17.639 | 0.040 | ||||||||
| pg152_o2_nofp.cx8a10_bee | 63.611 | 36.389 | 0.031 | ||||||||
| pg152_o2_nofp.cx8a12_bee | 61.306 | 38.694 | 0.032 | ||||||||
| pg152_o2_nofp.cx8a14_bee | 66.750 | 33.250 | 0.031 | ||||||||
| pg152_o2_nofp.cx8a15_bee | 73.972 | 26.028 | 0.049 | ||||||||
| pg152_o2_nofp.cx8a16_bee | 59.056 | 40.944 | 0.031 | ||||||||
| pg152_o2_nofp.cx8a17_bee | 54.389 | 45.611 | 0.053 | ||||||||
| pg152_o2_nofp.cx8a18_bee | 60.000 | 40.000 | 0.033 | ||||||||
| pg152_o2_nofp.cx8a20_bee | 73.778 | 26.222 | 0.030 | ||||||||
| pg152_o2_nofp.cx8a21_bee | 54.389 | 45.611 | 0.033 | ||||||||
| pg152_o2_nofp.cx8a22_bee | 72.333 | 27.667 | 0.031 |
Delete response time histogram: each cell has the percentage of responses that take <= the time in the header and max is the max response time in seconds. For max values in the top 25% of the range have a red background and in the bottom 25% of the range have a green background. The red background is not used when the min value is within 80% of the max value.
| dbms | 256us | 1ms | 4ms | 16ms | 64ms | 256ms | 1s | 4s | 16s | gt | max |
|---|---|---|---|---|---|---|---|---|---|---|---|
| pg152_o2_nofp.cx8_bee | 21.444 | 78.278 | 0.278 | 0.009 | |||||||
| pg152_o2_nofp.cx8a1_bee | 0.556 | 98.917 | 0.139 | 0.389 | 0.007 | ||||||
| pg152_o2_nofp.cx8a2_bee | 20.750 | 77.944 | 1.306 | 0.009 | |||||||
| pg152_o2_nofp.cx8a3_bee | 1.000 | 98.528 | 0.250 | 0.222 | 0.006 | ||||||
| pg152_o2_nofp.cx8a4_bee | 0.972 | 98.583 | 0.167 | 0.278 | 0.009 | ||||||
| pg152_o2_nofp.cx8a9_bee | 20.500 | 79.194 | 0.306 | 0.009 | |||||||
| pg152_o2_nofp.cx8a10_bee | 0.917 | 98.833 | 0.056 | 0.194 | 0.007 | ||||||
| pg152_o2_nofp.cx8a12_bee | 0.028 | 20.806 | 78.944 | 0.222 | 0.009 | ||||||
| pg152_o2_nofp.cx8a14_bee | 0.528 | 99.306 | 0.083 | 0.083 | 0.009 | ||||||
| pg152_o2_nofp.cx8a15_bee | 0.778 | 99.111 | 0.083 | 0.028 | 0.007 | ||||||
| pg152_o2_nofp.cx8a16_bee | 0.278 | 99.278 | 0.306 | 0.139 | 0.009 | ||||||
| pg152_o2_nofp.cx8a17_bee | 0.583 | 98.167 | 0.333 | 0.917 | 0.009 | ||||||
| pg152_o2_nofp.cx8a18_bee | 0.417 | 99.528 | 0.028 | 0.028 | 0.009 | ||||||
| pg152_o2_nofp.cx8a20_bee | 20.222 | 79.722 | 0.056 | 0.008 | |||||||
| pg152_o2_nofp.cx8a21_bee | 1.083 | 97.556 | 0.167 | 1.194 | 0.007 | ||||||
| pg152_o2_nofp.cx8a22_bee | 0.417 | 99.444 | 0.056 | 0.083 | 0.009 |
Performance metrics for the DBMS listed above. Some are normalized by throughput, others are not. Legend for results is here.
ips	qps	rps	rmbps	wps	wmbps	rpq	rkbpq	wpi	wkbpi	csps	cpups	cspq	cpupq	dbgb1	dbgb2	rss	maxop	p50	p99	tag
100	7651	254	2.1	253.9	3.8	0.033	0.278	2.547	38.633	29947	13.1	3.914	137	148.8	188.8	0.0	0.030	7431	4809	800m.pg152_o2_nofp.cx8_bee
100	7697	257	2.1	373.6	4.1	0.033	0.280	3.744	42.100	30099	12.9	3.911	134	148.8	188.8	0.0	0.032	7477	4650	800m.pg152_o2_nofp.cx8a1_bee
100	7605	253	2.1	289.3	3.7	0.033	0.278	2.899	37.709	29766	13.0	3.914	137	148.8	188.8	0.0	0.019	7352	4890	800m.pg152_o2_nofp.cx8a2_bee
100	7606	257	2.1	442.8	3.8	0.034	0.284	4.437	38.622	29745	13.0	3.910	137	148.8	186.0	0.0	0.019	7416	4667	800m.pg152_o2_nofp.cx8a3_bee
100	7725	254	2.1	272.9	3.7	0.033	0.275	2.735	38.124	30182	13.1	3.907	136	148.8	188.8	0.0	0.032	7431	4888	800m.pg152_o2_nofp.cx8a4_bee
100	7631	254	2.1	400.2	5.3	0.033	0.278	4.010	54.593	29909	13.2	3.919	138	148.8	188.8	0.0	0.020	7367	4938	800m.pg152_o2_nofp.cx8a9_bee
100	7624	255	2.1	303.1	3.9	0.033	0.280	3.037	39.744	29812	13.0	3.911	136	148.8	188.8	0.0	0.019	7365	4826	800m.pg152_o2_nofp.cx8a10_bee
100	7659	255	2.1	278.4	3.9	0.033	0.278	2.789	39.806	29948	12.9	3.910	135	148.8	188.8	0.0	0.033	7400	4825	800m.pg152_o2_nofp.cx8a12_bee
100	7726	254	2.1	297.3	3.6	0.033	0.275	2.979	36.852	30203	13.2	3.909	137	148.8	188.8	0.0	0.025	7447	4841	800m.pg152_o2_nofp.cx8a14_bee
100	7645	237	1.9	142.7	2.7	0.031	0.256	1.431	28.137	29876	13.0	3.908	136	148.8	158.8	0.0	0.015	7446	5049	800m.pg152_o2_nofp.cx8a15_bee
100	7599	252	2.1	222.8	3.2	0.033	0.277	2.233	32.876	29710	12.7	3.910	134	148.8	188.8	0.0	0.031	7415	4986	800m.pg152_o2_nofp.cx8a16_bee
100	7754	253	2.1	269.3	3.6	0.033	0.273	2.698	36.472	30330	13.2	3.911	136	148.7	188.8	0.0	0.024	7421	4762	800m.pg152_o2_nofp.cx8a17_bee
100	7664	258	2.1	449.6	4.7	0.034	0.283	4.505	48.082	30000	13.0	3.914	136	148.8	187.7	0.0	0.020	7446	4538	800m.pg152_o2_nofp.cx8a18_bee
100	7734	254	2.1	292.1	3.9	0.033	0.274	2.930	40.513	30261	13.2	3.913	137	148.8	188.8	0.0	0.030	7494	4937	800m.pg152_o2_nofp.cx8a20_bee
100	7734	254	2.1	333.5	3.4	0.033	0.274	3.342	35.353	30250	13.1	3.911	136	148.8	187.9	0.0	0.021	7511	4986	800m.pg152_o2_nofp.cx8a21_bee
100	7845	255	2.1	298.9	3.6	0.032	0.272	2.995	37.369	30666	12.8	3.909	131	148.8	188.8	0.0	0.024	7590	4795	800m.pg152_o2_nofp.cx8a22_bee
q500.1
q500.1: range queries with 500 insert/s per client. Graphs for performance per 1-second interval are here.
Average throughput:
Query response time histogram: each cell has the percentage of responses that take <= the time in the header and max is the max response time in seconds. For max values in the top 25% of the range have a red background and in the bottom 25% of the range have a green background. The red background is not used when the min value is within 80% of the max value.
| dbms | 256us | 1ms | 4ms | 16ms | 64ms | 256ms | 1s | 4s | 16s | gt | max |
|---|---|---|---|---|---|---|---|---|---|---|---|
| pg152_o2_nofp.cx8_bee | 99.900 | 0.097 | 0.001 | 0.003 | 0.016 | ||||||
| pg152_o2_nofp.cx8a1_bee | 99.890 | 0.108 | 0.001 | 0.002 | 0.010 | ||||||
| pg152_o2_nofp.cx8a2_bee | 99.880 | 0.116 | 0.001 | 0.002 | 0.014 | ||||||
| pg152_o2_nofp.cx8a3_bee | 99.899 | 0.098 | 0.001 | 0.003 | 0.010 | ||||||
| pg152_o2_nofp.cx8a4_bee | 99.908 | 0.089 | nonzero | 0.002 | 0.016 | ||||||
| pg152_o2_nofp.cx8a9_bee | 99.887 | 0.110 | 0.001 | 0.002 | 0.015 | ||||||
| pg152_o2_nofp.cx8a10_bee | 99.909 | 0.089 | 0.001 | 0.002 | 0.010 | ||||||
| pg152_o2_nofp.cx8a12_bee | 99.890 | 0.108 | 0.001 | 0.002 | 0.015 | ||||||
| pg152_o2_nofp.cx8a14_bee | 99.903 | 0.094 | 0.001 | 0.002 | nonzero | 0.016 | |||||
| pg152_o2_nofp.cx8a15_bee | 99.892 | 0.101 | 0.001 | 0.006 | 0.016 | ||||||
| pg152_o2_nofp.cx8a16_bee | 99.905 | 0.093 | 0.001 | 0.002 | 0.015 | ||||||
| pg152_o2_nofp.cx8a17_bee | 99.901 | 0.096 | 0.001 | 0.002 | 0.016 | ||||||
| pg152_o2_nofp.cx8a18_bee | 99.907 | 0.091 | nonzero | 0.002 | 0.011 | ||||||
| pg152_o2_nofp.cx8a20_bee | 99.901 | 0.096 | nonzero | 0.003 | 0.010 | ||||||
| pg152_o2_nofp.cx8a21_bee | 99.905 | 0.092 | nonzero | 0.003 | 0.015 | ||||||
| pg152_o2_nofp.cx8a22_bee | 99.915 | 0.082 | 0.001 | 0.002 | 0.015 |
Insert response time histogram: each cell has the percentage of responses that take <= the time in the header and max is the max response time in seconds. For max values in the top 25% of the range have a red background and in the bottom 25% of the range have a green background. The red background is not used when the min value is within 80% of the max value.
| dbms | 256us | 1ms | 4ms | 16ms | 64ms | 256ms | 1s | 4s | 16s | gt | max |
|---|---|---|---|---|---|---|---|---|---|---|---|
| pg152_o2_nofp.cx8_bee | 93.033 | 6.967 | 0.031 | ||||||||
| pg152_o2_nofp.cx8a1_bee | 90.289 | 9.711 | 0.033 | ||||||||
| pg152_o2_nofp.cx8a2_bee | 93.083 | 6.917 | 0.030 | ||||||||
| pg152_o2_nofp.cx8a3_bee | 94.617 | 5.383 | 0.030 | ||||||||
| pg152_o2_nofp.cx8a4_bee | 94.328 | 5.672 | 0.031 | ||||||||
| pg152_o2_nofp.cx8a9_bee | 94.017 | 5.983 | 0.030 | ||||||||
| pg152_o2_nofp.cx8a10_bee | 93.006 | 6.994 | 0.030 | ||||||||
| pg152_o2_nofp.cx8a12_bee | 94.667 | 5.333 | 0.030 | ||||||||
| pg152_o2_nofp.cx8a14_bee | 93.861 | 6.139 | 0.030 | ||||||||
| pg152_o2_nofp.cx8a15_bee | 91.133 | 8.867 | 0.030 | ||||||||
| pg152_o2_nofp.cx8a16_bee | 94.239 | 5.761 | 0.030 | ||||||||
| pg152_o2_nofp.cx8a17_bee | 93.806 | 6.194 | 0.030 | ||||||||
| pg152_o2_nofp.cx8a18_bee | 91.256 | 8.744 | 0.032 | ||||||||
| pg152_o2_nofp.cx8a20_bee | 93.128 | 6.872 | 0.031 | ||||||||
| pg152_o2_nofp.cx8a21_bee | 91.439 | 8.561 | 0.032 | ||||||||
| pg152_o2_nofp.cx8a22_bee | 93.478 | 6.522 | 0.032 |
Delete response time histogram: each cell has the percentage of responses that take <= the time in the header and max is the max response time in seconds. For max values in the top 25% of the range have a red background and in the bottom 25% of the range have a green background. The red background is not used when the min value is within 80% of the max value.
| dbms | 256us | 1ms | 4ms | 16ms | 64ms | 256ms | 1s | 4s | 16s | gt | max |
|---|---|---|---|---|---|---|---|---|---|---|---|
| pg152_o2_nofp.cx8_bee | 5.711 | 93.283 | 1.006 | 0.020 | |||||||
| pg152_o2_nofp.cx8a1_bee | 2.550 | 97.067 | 0.061 | 0.322 | 0.009 | ||||||
| pg152_o2_nofp.cx8a2_bee | 6.911 | 92.606 | 0.483 | 0.019 | |||||||
| pg152_o2_nofp.cx8a3_bee | 3.928 | 95.911 | 0.050 | 0.111 | 0.007 | ||||||
| pg152_o2_nofp.cx8a4_bee | 3.528 | 95.378 | 0.239 | 0.856 | 0.011 | ||||||
| pg152_o2_nofp.cx8a9_bee | 6.422 | 92.761 | 0.817 | 0.017 | |||||||
| pg152_o2_nofp.cx8a10_bee | 3.078 | 96.328 | 0.078 | 0.517 | 0.008 | ||||||
| pg152_o2_nofp.cx8a12_bee | 5.983 | 93.061 | 0.956 | 0.020 | |||||||
| pg152_o2_nofp.cx8a14_bee | 3.939 | 95.217 | 0.144 | 0.700 | 0.008 | ||||||
| pg152_o2_nofp.cx8a15_bee | 4.650 | 94.900 | 0.111 | 0.339 | 0.009 | ||||||
| pg152_o2_nofp.cx8a16_bee | 3.083 | 96.078 | 0.178 | 0.661 | 0.008 | ||||||
| pg152_o2_nofp.cx8a17_bee | 3.772 | 95.478 | 0.183 | 0.567 | 0.008 | ||||||
| pg152_o2_nofp.cx8a18_bee | 2.544 | 97.228 | 0.072 | 0.156 | 0.007 | ||||||
| pg152_o2_nofp.cx8a20_bee | 6.428 | 92.639 | 0.933 | 0.018 | |||||||
| pg152_o2_nofp.cx8a21_bee | 2.806 | 96.894 | 0.078 | 0.222 | 0.008 | ||||||
| pg152_o2_nofp.cx8a22_bee | 3.811 | 95.794 | 0.128 | 0.267 | 0.007 |
Performance metrics for the DBMS listed above. Some are normalized by throughput, others are not. Legend for results is here.
ips	qps	rps	rmbps	wps	wmbps	rpq	rkbpq	wpi	wkbpi	csps	cpups	cspq	cpupq	dbgb1	dbgb2	rss	maxop	p50	p99	tag
499	7822	805	6.4	985.7	14.9	0.103	0.840	1.976	30.565	31917	15.1	4.081	154	148.8	188.8	0.0	0.016	7478	7254	800m.pg152_o2_nofp.cx8_bee
499	7693	801	6.4	933.8	12.2	0.104	0.850	1.871	25.095	31385	14.3	4.079	149	148.8	188.8	0.0	0.010	7399	7144	800m.pg152_o2_nofp.cx8a1_bee
499	7710	807	6.4	949.8	14.8	0.105	0.854	1.903	30.457	31483	15.1	4.084	157	148.8	188.8	0.0	0.014	7302	7046	800m.pg152_o2_nofp.cx8a2_bee
499	7768	802	6.4	885.0	7.5	0.103	0.848	1.773	15.317	31584	13.8	4.066	142	148.8	185.7	0.0	0.010	7416	7195	800m.pg152_o2_nofp.cx8a3_bee
499	7733	801	6.4	937.4	14.7	0.104	0.845	1.879	30.223	31571	14.1	4.082	146	148.8	188.8	0.0	0.016	7383	7176	800m.pg152_o2_nofp.cx8a4_bee
499	7852	805	6.4	948.2	15.5	0.103	0.837	1.900	31.769	32072	15.2	4.085	155	148.8	185.3	0.0	0.015	7431	7146	800m.pg152_o2_nofp.cx8a9_bee
499	7813	804	6.4	931.3	14.7	0.103	0.839	1.866	30.164	31856	14.1	4.077	144	148.8	188.8	0.0	0.010	7389	7128	800m.pg152_o2_nofp.cx8a10_bee
499	7875	805	6.4	973.4	14.9	0.102	0.834	1.952	30.678	32120	15.1	4.079	153	148.8	188.8	0.0	0.015	7446	7212	800m.pg152_o2_nofp.cx8a12_bee
499	7758	801	6.4	925.4	14.6	0.103	0.842	1.854	30.054	31646	14.0	4.079	144	148.8	188.8	0.0	0.016	7414	7176	800m.pg152_o2_nofp.cx8a14_bee
499	7768	802	6.4	1024.0	16.6	0.103	0.842	2.053	34.099	31794	14.1	4.093	145	148.8	158.8	0.0	0.016	7400	7158	800m.pg152_o2_nofp.cx8a15_bee
499	7766	801	6.4	944.1	14.7	0.103	0.841	1.892	30.251	31692	14.1	4.081	145	148.8	188.8	0.0	0.015	7400	7144	800m.pg152_o2_nofp.cx8a16_bee
499	7768	800	6.4	916.8	14.5	0.103	0.841	1.837	29.833	31682	14.1	4.079	145	148.7	188.8	0.0	0.016	7431	7205	800m.pg152_o2_nofp.cx8a17_bee
499	7855	802	6.4	931.2	12.2	0.102	0.833	1.867	25.091	32012	14.5	4.075	148	148.8	187.7	0.0	0.011	7447	7195	800m.pg152_o2_nofp.cx8a18_bee
499	7861	805	6.4	949.2	14.8	0.102	0.835	1.903	30.449	32059	15.1	4.078	154	148.8	188.8	0.0	0.010	7527	7279	800m.pg152_o2_nofp.cx8a20_bee
499	7688	801	6.4	906.0	12.0	0.104	0.852	1.815	24.536	31356	14.1	4.079	147	148.8	187.9	0.0	0.015	7447	7192	800m.pg152_o2_nofp.cx8a21_bee
499	7948	801	6.4	927.5	14.7	0.101	0.822	1.858	30.098	32382	13.8	4.074	139	148.8	188.8	0.0	0.015	7575	7303	800m.pg152_o2_nofp.cx8a22_bee
q1000.1
q1000.1: range queries with 1000 insert/s per client. Graphs for performance per 1-second interval are here.
Average throughput:
Query response time histogram: each cell has the percentage of responses that take <= the time in the header and max is the max response time in seconds. For max values in the top 25% of the range have a red background and in the bottom 25% of the range have a green background. The red background is not used when the min value is within 80% of the max value.
| dbms | 256us | 1ms | 4ms | 16ms | 64ms | 256ms | 1s | 4s | 16s | gt | max |
|---|---|---|---|---|---|---|---|---|---|---|---|
| pg152_o2_nofp.cx8_bee | 99.802 | 0.187 | 0.003 | 0.008 | 0.016 | ||||||
| pg152_o2_nofp.cx8a1_bee | 99.854 | 0.138 | 0.001 | 0.007 | 0.016 | ||||||
| pg152_o2_nofp.cx8a2_bee | 99.792 | 0.198 | 0.002 | 0.008 | 0.015 | ||||||
| pg152_o2_nofp.cx8a3_bee | 99.869 | 0.125 | 0.001 | 0.005 | 0.010 | ||||||
| pg152_o2_nofp.cx8a4_bee | 99.836 | 0.154 | 0.001 | 0.009 | 0.016 | ||||||
| pg152_o2_nofp.cx8a9_bee | 99.790 | 0.203 | 0.003 | 0.004 | 0.015 | ||||||
| pg152_o2_nofp.cx8a10_bee | 99.840 | 0.150 | 0.001 | 0.009 | 0.016 | ||||||
| pg152_o2_nofp.cx8a12_bee | 99.829 | 0.161 | 0.001 | 0.009 | 0.015 | ||||||
| pg152_o2_nofp.cx8a14_bee | 99.854 | 0.136 | 0.001 | 0.009 | 0.015 | ||||||
| pg152_o2_nofp.cx8a15_bee | 99.821 | 0.171 | 0.002 | 0.007 | 0.016 | ||||||
| pg152_o2_nofp.cx8a16_bee | 99.839 | 0.150 | 0.001 | 0.009 | 0.015 | ||||||
| pg152_o2_nofp.cx8a17_bee | 99.852 | 0.140 | 0.001 | 0.007 | 0.011 | ||||||
| pg152_o2_nofp.cx8a18_bee | 99.842 | 0.149 | 0.001 | 0.007 | 0.016 | ||||||
| pg152_o2_nofp.cx8a20_bee | 99.834 | 0.156 | 0.002 | 0.009 | 0.012 | ||||||
| pg152_o2_nofp.cx8a21_bee | 99.845 | 0.148 | 0.001 | 0.006 | 0.010 | ||||||
| pg152_o2_nofp.cx8a22_bee | 99.845 | 0.146 | 0.001 | 0.009 | 0.016 |
Insert response time histogram: each cell has the percentage of responses that take <= the time in the header and max is the max response time in seconds. For max values in the top 25% of the range have a red background and in the bottom 25% of the range have a green background. The red background is not used when the min value is within 80% of the max value.
| dbms | 256us | 1ms | 4ms | 16ms | 64ms | 256ms | 1s | 4s | 16s | gt | max |
|---|---|---|---|---|---|---|---|---|---|---|---|
| pg152_o2_nofp.cx8_bee | 97.661 | 2.339 | 0.029 | ||||||||
| pg152_o2_nofp.cx8a1_bee | 96.808 | 3.192 | 0.030 | ||||||||
| pg152_o2_nofp.cx8a2_bee | 97.197 | 2.803 | 0.030 | ||||||||
| pg152_o2_nofp.cx8a3_bee | 98.025 | 1.975 | 0.029 | ||||||||
| pg152_o2_nofp.cx8a4_bee | 96.856 | 3.144 | 0.030 | ||||||||
| pg152_o2_nofp.cx8a9_bee | 96.850 | 3.150 | 0.029 | ||||||||
| pg152_o2_nofp.cx8a10_bee | 97.208 | 2.792 | 0.028 | ||||||||
| pg152_o2_nofp.cx8a12_bee | 96.697 | 3.303 | 0.029 | ||||||||
| pg152_o2_nofp.cx8a14_bee | 97.153 | 2.847 | 0.029 | ||||||||
| pg152_o2_nofp.cx8a15_bee | 95.806 | 4.194 | 0.030 | ||||||||
| pg152_o2_nofp.cx8a16_bee | 97.072 | 2.928 | 0.029 | ||||||||
| pg152_o2_nofp.cx8a17_bee | 97.047 | 2.953 | 0.040 | ||||||||
| pg152_o2_nofp.cx8a18_bee | 96.683 | 3.317 | 0.030 | ||||||||
| pg152_o2_nofp.cx8a20_bee | 96.947 | 3.053 | 0.029 | ||||||||
| pg152_o2_nofp.cx8a21_bee | 97.436 | 2.564 | 0.031 | ||||||||
| pg152_o2_nofp.cx8a22_bee | 97.083 | 2.917 | 0.029 |
Delete response time histogram: each cell has the percentage of responses that take <= the time in the header and max is the max response time in seconds. For max values in the top 25% of the range have a red background and in the bottom 25% of the range have a green background. The red background is not used when the min value is within 80% of the max value.
| dbms | 256us | 1ms | 4ms | 16ms | 64ms | 256ms | 1s | 4s | 16s | gt | max |
|---|---|---|---|---|---|---|---|---|---|---|---|
| pg152_o2_nofp.cx8_bee | 14.072 | 85.928 | 0.042 | ||||||||
| pg152_o2_nofp.cx8a1_bee | 1.458 | 98.414 | 0.083 | 0.044 | 0.010 | ||||||
| pg152_o2_nofp.cx8a2_bee | 14.047 | 85.953 | 0.043 | ||||||||
| pg152_o2_nofp.cx8a3_bee | 2.094 | 97.808 | 0.056 | 0.042 | 0.010 | ||||||
| pg152_o2_nofp.cx8a4_bee | 2.531 | 97.333 | 0.069 | 0.067 | 0.007 | ||||||
| pg152_o2_nofp.cx8a9_bee | 14.181 | 85.819 | 0.043 | ||||||||
| pg152_o2_nofp.cx8a10_bee | 2.633 | 97.261 | 0.050 | 0.056 | 0.008 | ||||||
| pg152_o2_nofp.cx8a12_bee | 2.631 | 85.686 | 0.036 | 11.278 | 0.369 | 0.043 | |||||
| pg152_o2_nofp.cx8a14_bee | 2.697 | 97.144 | 0.083 | 0.075 | 0.008 | ||||||
| pg152_o2_nofp.cx8a15_bee | 2.328 | 97.517 | 0.075 | 0.081 | 0.007 | ||||||
| pg152_o2_nofp.cx8a16_bee | 2.653 | 97.197 | 0.064 | 0.086 | 0.008 | ||||||
| pg152_o2_nofp.cx8a17_bee | 2.878 | 96.967 | 0.100 | 0.056 | 0.009 | ||||||
| pg152_o2_nofp.cx8a18_bee | 1.556 | 98.308 | 0.078 | 0.058 | 0.010 | ||||||
| pg152_o2_nofp.cx8a20_bee | 2.422 | 82.617 | 0.031 | 13.381 | 1.550 | 0.033 | |||||
| pg152_o2_nofp.cx8a21_bee | 1.700 | 98.178 | 0.072 | 0.050 | 0.009 | ||||||
| pg152_o2_nofp.cx8a22_bee | 2.528 | 97.322 | 0.086 | 0.064 | 0.008 |
Performance metrics for the DBMS listed above. Some are normalized by throughput, others are not. Legend for results is here.
ips	qps	rps	rmbps	wps	wmbps	rpq	rkbpq	wpi	wkbpi	csps	cpups	cspq	cpupq	dbgb1	dbgb2	rss	maxop	p50	p99	tag
998	7992	1605	12.8	1809.0	25.9	0.201	1.640	1.812	26.518	34381	20.7	4.302	207	148.9	187.5	0.0	0.016	7687	7068	800m.pg152_o2_nofp.cx8_bee
998	7584	1602	12.8	1797.6	22.0	0.211	1.728	1.801	22.551	32801	15.2	4.325	160	148.9	186.7	0.0	0.016	7333	7064	800m.pg152_o2_nofp.cx8a1_bee
998	7805	1604	12.8	1798.7	26.2	0.206	1.678	1.802	26.831	33666	20.6	4.313	211	148.9	188.9	0.0	0.015	7464	6952	800m.pg152_o2_nofp.cx8a2_bee
998	7728	1603	12.9	1775.5	14.7	0.207	1.705	1.779	15.122	33246	14.7	4.302	152	148.9	185.5	0.0	0.010	7414	7160	800m.pg152_o2_nofp.cx8a3_bee
998	7631	1602	12.8	1818.3	26.2	0.210	1.715	1.823	26.893	33037	15.2	4.329	159	148.9	188.5	0.0	0.016	7352	7064	800m.pg152_o2_nofp.cx8a4_bee
998	7944	1604	12.8	1849.9	28.5	0.202	1.648	1.853	29.236	34282	20.7	4.316	208	148.9	181.3	0.0	0.015	7607	6999	800m.pg152_o2_nofp.cx8a9_bee
998	7688	1603	12.8	1811.3	26.3	0.208	1.702	1.815	26.950	33248	15.2	4.325	158	148.9	188.9	0.0	0.016	7367	7094	800m.pg152_o2_nofp.cx8a10_bee
998	7688	1603	12.8	1800.4	25.9	0.209	1.703	1.805	26.630	33256	15.7	4.326	163	148.9	187.6	0.0	0.015	7339	7018	800m.pg152_o2_nofp.cx8a12_bee
998	7690	1603	12.8	1811.8	26.3	0.208	1.703	1.815	26.956	33250	15.2	4.324	158	148.9	188.9	0.0	0.015	7400	7112	800m.pg152_o2_nofp.cx8a14_bee
998	7618	1603	12.8	2108.6	34.0	0.210	1.717	2.113	34.850	33248	15.5	4.365	163	148.9	158.9	0.0	0.016	7334	6983	800m.pg152_o2_nofp.cx8a15_bee
998	7706	1603	12.8	1818.5	26.1	0.208	1.698	1.822	26.822	33323	15.1	4.325	157	148.9	188.0	0.0	0.015	7416	7128	800m.pg152_o2_nofp.cx8a16_bee
998	7699	1603	12.8	1845.4	26.4	0.208	1.702	1.849	27.032	33262	15.2	4.320	158	148.8	188.0	0.0	0.011	7403	7158	800m.pg152_o2_nofp.cx8a17_bee
998	7383	1602	12.8	1796.7	22.0	0.217	1.775	1.801	22.583	32059	15.3	4.342	166	148.9	186.8	0.0	0.016	7176	6902	800m.pg152_o2_nofp.cx8a18_bee
998	7734	1604	12.8	1789.0	26.1	0.207	1.693	1.793	26.787	33431	15.8	4.322	163	148.9	188.9	0.0	0.012	7416	7125	800m.pg152_o2_nofp.cx8a20_bee
998	7697	1603	12.8	1794.6	22.1	0.208	1.703	1.799	22.694	33271	15.5	4.322	161	148.9	187.9	0.0	0.010	7403	7096	800m.pg152_o2_nofp.cx8a21_bee
998	7812	1602	12.8	1811.2	26.3	0.205	1.675	1.815	26.963	33725	15.3	4.317	157	148.9	188.9	0.0	0.016	7496	7164	800m.pg152_o2_nofp.cx8a22_bee
l.i0
l.i0: load without secondary indexes
Performance metrics for all DBMS, not just the ones listed above. Some are normalized by throughput, others are not. Legend for results is here.
ips	qps	rps	rmbps	wps	wmbps	rpq	rkbpq	wpi	wkbpi	csps	cpups	cspq	cpupq	dbgb1	dbgb2	rss	maxop	p50	p99	tag
73590	0	33	0.4	114.2	32.4	0.000	0.006	0.002	0.451	8985	23.1	0.122	25	76.5	116.6	0.0	0.123	73657	72517	800m.pg152_o2_nofp.cx8_bee
72946	0	33	0.4	109.9	31.6	0.000	0.006	0.002	0.443	8911	23.1	0.122	25	76.5	116.6	0.0	0.060	73019	71719	800m.pg152_o2_nofp.cx8a1_bee
73354	0	33	0.4	114.8	32.5	0.000	0.006	0.002	0.454	8955	23.1	0.122	25	76.5	116.6	0.0	0.058	73419	72218	800m.pg152_o2_nofp.cx8a2_bee
72760	0	35	0.7	112.0	30.4	0.000	0.009	0.002	0.428	8898	23.0	0.122	25	76.5	116.6	0.0	0.058	72850	71720	800m.pg152_o2_nofp.cx8a3_bee
73039	0	34	0.5	119.3	32.3	0.000	0.007	0.002	0.453	8916	23.2	0.122	25	76.5	116.6	0.0	0.144	73117	71818	800m.pg152_o2_nofp.cx8a4_bee
73053	0	32	0.4	116.1	32.9	0.000	0.005	0.002	0.461	8910	23.1	0.122	25	76.5	106.1	0.0	0.079	73158	71621	800m.pg152_o2_nofp.cx8a9_bee
72497	0	34	0.7	121.2	33.8	0.000	0.010	0.002	0.478	8857	23.1	0.122	25	76.5	116.6	0.0	0.099	72617	71318	800m.pg152_o2_nofp.cx8a10_bee
72767	0	33	0.5	115.6	32.5	0.000	0.007	0.002	0.457	8889	23.0	0.122	25	76.5	116.6	0.1	0.056	72855	71619	800m.pg152_o2_nofp.cx8a12_bee
72418	0	35	0.5	113.6	31.6	0.000	0.007	0.002	0.447	8883	23.0	0.123	25	76.5	116.6	0.0	0.057	72517	71219	800m.pg152_o2_nofp.cx8a14_bee
73006	0	34	0.5	125.6	34.4	0.000	0.007	0.002	0.483	8882	23.2	0.122	25	76.5	86.6	0.0	0.524	73117	71652	800m.pg152_o2_nofp.cx8a15_bee
73146	0	32	0.3	104.8	30.2	0.000	0.004	0.001	0.423	8920	23.1	0.122	25	76.5	116.6	0.0	0.056	73219	71821	800m.pg152_o2_nofp.cx8a16_bee
73327	0	34	0.4	113.4	32.1	0.000	0.006	0.002	0.448	8947	23.0	0.122	25	76.5	116.6	0.0	0.129	73418	72121	800m.pg152_o2_nofp.cx8a17_bee
72820	0	31	0.2	104.9	29.8	0.000	0.003	0.001	0.418	8893	22.9	0.122	25	76.5	116.6	0.0	0.057	72915	71759	800m.pg152_o2_nofp.cx8a18_bee
73644	0	30	0.2	106.2	30.3	0.000	0.003	0.001	0.422	8990	23.2	0.122	25	76.5	116.6	0.0	0.056	73717	72417	800m.pg152_o2_nofp.cx8a20_bee
73133	0	32	0.3	105.5	29.9	0.000	0.004	0.001	0.419	8932	23.1	0.122	25	76.5	116.6	0.0	0.060	73217	71821	800m.pg152_o2_nofp.cx8a21_bee
73314	0	31	0.2	105.7	30.2	0.000	0.003	0.001	0.422	8936	23.0	0.122	25	76.5	116.6	0.0	0.056	73416	72315	800m.pg152_o2_nofp.cx8a22_bee
l.x
l.x: create secondary indexes
Performance metrics for all DBMS, not just the ones listed above. Some are normalized by throughput, others are not. Legend for results is here.
ips	qps	rps	rmbps	wps	wmbps	rpq	rkbpq	wpi	wkbpi	csps	cpups	cspq	cpupq	dbgb1	dbgb2	rss	maxop	p50	p99	tag
198536	0	586	71.8	200.3	69.9	0.003	0.370	0.001	0.361	430	12.5	0.002	5	147.0	187.1	0.0	0.004	NA	NA	800m.pg152_o2_nofp.cx8_bee
193917	0	573	70.2	177.6	62.2	0.003	0.371	0.001	0.328	377	12.6	0.002	5	147.0	187.1	0.0	0.005	NA	NA	800m.pg152_o2_nofp.cx8a1_bee
198536	0	585	71.8	202.0	70.0	0.003	0.370	0.001	0.361	407	12.5	0.002	5	147.0	187.1	0.0	0.005	NA	NA	800m.pg152_o2_nofp.cx8a2_bee
199129	0	582	71.7	191.1	68.0	0.003	0.369	0.001	0.350	424	12.4	0.002	5	147.0	187.1	0.0	0.005	NA	NA	800m.pg152_o2_nofp.cx8a3_bee
198684	0	584	71.9	200.8	69.8	0.003	0.370	0.001	0.360	413	12.5	0.002	5	147.0	187.1	0.0	0.006	NA	NA	800m.pg152_o2_nofp.cx8a4_bee
198290	0	584	71.8	206.6	72.5	0.003	0.371	0.001	0.374	434	12.5	0.002	5	147.0	176.6	0.0	0.005	NA	NA	800m.pg152_o2_nofp.cx8a9_bee
200275	0	581	71.6	193.2	68.0	0.003	0.366	0.001	0.348	400	12.4	0.002	5	147.0	187.1	0.0	0.005	NA	NA	800m.pg152_o2_nofp.cx8a10_bee
199427	0	589	72.2	204.7	72.2	0.003	0.371	0.001	0.371	423	12.5	0.002	5	147.0	187.1	0.0	0.003	NA	NA	800m.pg152_o2_nofp.cx8a12_bee
198684	0	583	71.8	198.8	69.3	0.003	0.370	0.001	0.357	412	12.5	0.002	5	147.0	187.1	0.0	0.004	NA	NA	800m.pg152_o2_nofp.cx8a14_bee
197898	0	582	71.7	205.4	71.5	0.003	0.371	0.001	0.370	402	12.5	0.002	5	147.0	157.1	0.0	0.005	NA	NA	800m.pg152_o2_nofp.cx8a15_bee
199775	0	585	72.0	192.5	68.0	0.003	0.369	0.001	0.349	396	12.5	0.002	5	147.0	187.1	0.0	0.004	NA	NA	800m.pg152_o2_nofp.cx8a16_bee
198339	0	583	71.8	209.8	72.6	0.003	0.371	0.001	0.375	413	12.5	0.002	5	147.0	187.1	0.0	0.004	NA	NA	800m.pg152_o2_nofp.cx8a17_bee
198044	0	580	71.4	167.9	60.9	0.003	0.369	0.001	0.315	378	12.6	0.002	5	147.0	187.1	0.0	0.007	NA	NA	800m.pg152_o2_nofp.cx8a18_bee
199825	0	586	72.0	194.7	68.2	0.003	0.369	0.001	0.350	388	12.4	0.002	5	147.0	187.1	0.0	0.004	NA	NA	800m.pg152_o2_nofp.cx8a20_bee
195719	0	574	70.6	168.2	60.2	0.003	0.369	0.001	0.315	380	12.5	0.002	5	147.0	187.1	0.0	0.005	NA	NA	800m.pg152_o2_nofp.cx8a21_bee
199278	0	584	71.9	193.3	68.2	0.003	0.369	0.001	0.350	404	12.5	0.002	5	147.0	187.1	0.0	0.006	NA	NA	800m.pg152_o2_nofp.cx8a22_bee
l.i1
l.i1: continue load after secondary indexes created
Performance metrics for all DBMS, not just the ones listed above. Some are normalized by throughput, others are not. Legend for results is here.
ips	qps	rps	rmbps	wps	wmbps	rpq	rkbpq	wpi	wkbpi	csps	cpups	cspq	cpupq	dbgb1	dbgb2	rss	maxop	p50	p99	tag
1473	0	2383	18.9	2677.7	37.8	1.618	13.175	1.818	26.252	5694	13.4	3.866	728	148.8	188.8	0.0	0.078	949	599	800m.pg152_o2_nofp.cx8_bee
1246	0	2005	15.9	2236.0	26.1	1.610	13.106	1.795	21.480	4786	13.7	3.842	880	148.8	188.6	0.0	0.069	799	549	800m.pg152_o2_nofp.cx8a1_bee
1494	0	2418	19.2	2716.7	38.1	1.618	13.180	1.818	26.085	5766	13.3	3.859	712	148.8	188.8	0.0	0.065	949	449	800m.pg152_o2_nofp.cx8a2_bee
1158	0	1873	15.0	2060.9	17.0	1.618	13.234	1.780	15.016	4438	13.4	3.834	926	148.8	187.6	0.0	0.055	749	499	800m.pg152_o2_nofp.cx8a3_bee
1170	0	1890	15.0	2139.8	30.2	1.616	13.126	1.829	26.470	4552	13.6	3.890	930	148.8	188.8	0.0	0.067	799	499	800m.pg152_o2_nofp.cx8a4_bee
844	0	1362	10.8	1573.3	24.7	1.614	13.105	1.864	29.996	3326	13.8	3.940	1308	148.8	175.0	0.0	0.057	599	400	800m.pg152_o2_nofp.cx8a9_bee
1041	0	1684	13.4	1901.3	27.1	1.618	13.141	1.826	26.670	4058	13.7	3.897	1053	148.8	188.8	0.0	0.060	699	499	800m.pg152_o2_nofp.cx8a10_bee
841	0	1358	10.8	1543.3	22.3	1.614	13.111	1.834	27.187	3304	13.7	3.928	1303	148.8	187.2	0.0	0.062	599	400	800m.pg152_o2_nofp.cx8a12_bee
1478	0	2384	18.9	2691.0	38.0	1.613	13.106	1.821	26.365	5693	13.3	3.853	720	148.8	188.8	0.0	0.065	949	599	800m.pg152_o2_nofp.cx8a14_bee
1529	0	2460	19.5	2972.4	48.3	1.608	13.060	1.944	32.314	5925	13.7	3.875	717	148.8	158.8	0.0	0.062	999	599	800m.pg152_o2_nofp.cx8a15_bee
1428	0	2315	18.8	2611.8	38.0	1.621	13.462	1.829	27.227	5543	13.4	3.881	751	148.8	188.8	0.0	0.144	949	599	800m.pg152_o2_nofp.cx8a16_bee
1149	0	1905	20.8	2173.1	37.2	1.658	18.552	1.892	33.182	4578	13.7	3.986	954	148.7	188.8	9.2	0.214	799	499	800m.pg152_o2_nofp.cx8a17_bee
1304	0	2110	16.8	2343.2	27.4	1.619	13.178	1.797	21.554	5022	13.7	3.852	841	148.8	187.9	0.0	0.070	849	549	800m.pg152_o2_nofp.cx8a18_bee
843	0	1369	10.9	1547.7	22.4	1.624	13.188	1.836	27.205	3329	13.8	3.949	1310	148.8	187.4	0.0	0.064	599	400	800m.pg152_o2_nofp.cx8a20_bee
1470	0	2378	18.9	2637.2	30.9	1.618	13.176	1.794	21.525	5644	13.6	3.840	740	148.8	188.8	0.0	0.069	949	599	800m.pg152_o2_nofp.cx8a21_bee
1454	0	2355	18.7	2647.3	37.2	1.619	13.158	1.820	26.168	5642	13.3	3.879	732	148.8	188.8	0.0	0.086	949	599	800m.pg152_o2_nofp.cx8a22_bee
q100.1
q100.1: range queries with 100 insert/s per client
Performance metrics for all DBMS, not just the ones listed above. Some are normalized by throughput, others are not. Legend for results is here.
ips	qps	rps	rmbps	wps	wmbps	rpq	rkbpq	wpi	wkbpi	csps	cpups	cspq	cpupq	dbgb1	dbgb2	rss	maxop	p50	p99	tag
100	7651	254	2.1	253.9	3.8	0.033	0.278	2.547	38.633	29947	13.1	3.914	137	148.8	188.8	0.0	0.030	7431	4809	800m.pg152_o2_nofp.cx8_bee
100	7697	257	2.1	373.6	4.1	0.033	0.280	3.744	42.100	30099	12.9	3.911	134	148.8	188.8	0.0	0.032	7477	4650	800m.pg152_o2_nofp.cx8a1_bee
100	7605	253	2.1	289.3	3.7	0.033	0.278	2.899	37.709	29766	13.0	3.914	137	148.8	188.8	0.0	0.019	7352	4890	800m.pg152_o2_nofp.cx8a2_bee
100	7606	257	2.1	442.8	3.8	0.034	0.284	4.437	38.622	29745	13.0	3.910	137	148.8	186.0	0.0	0.019	7416	4667	800m.pg152_o2_nofp.cx8a3_bee
100	7725	254	2.1	272.9	3.7	0.033	0.275	2.735	38.124	30182	13.1	3.907	136	148.8	188.8	0.0	0.032	7431	4888	800m.pg152_o2_nofp.cx8a4_bee
100	7631	254	2.1	400.2	5.3	0.033	0.278	4.010	54.593	29909	13.2	3.919	138	148.8	188.8	0.0	0.020	7367	4938	800m.pg152_o2_nofp.cx8a9_bee
100	7624	255	2.1	303.1	3.9	0.033	0.280	3.037	39.744	29812	13.0	3.911	136	148.8	188.8	0.0	0.019	7365	4826	800m.pg152_o2_nofp.cx8a10_bee
100	7659	255	2.1	278.4	3.9	0.033	0.278	2.789	39.806	29948	12.9	3.910	135	148.8	188.8	0.0	0.033	7400	4825	800m.pg152_o2_nofp.cx8a12_bee
100	7726	254	2.1	297.3	3.6	0.033	0.275	2.979	36.852	30203	13.2	3.909	137	148.8	188.8	0.0	0.025	7447	4841	800m.pg152_o2_nofp.cx8a14_bee
100	7645	237	1.9	142.7	2.7	0.031	0.256	1.431	28.137	29876	13.0	3.908	136	148.8	158.8	0.0	0.015	7446	5049	800m.pg152_o2_nofp.cx8a15_bee
100	7599	252	2.1	222.8	3.2	0.033	0.277	2.233	32.876	29710	12.7	3.910	134	148.8	188.8	0.0	0.031	7415	4986	800m.pg152_o2_nofp.cx8a16_bee
100	7754	253	2.1	269.3	3.6	0.033	0.273	2.698	36.472	30330	13.2	3.911	136	148.7	188.8	0.0	0.024	7421	4762	800m.pg152_o2_nofp.cx8a17_bee
100	7664	258	2.1	449.6	4.7	0.034	0.283	4.505	48.082	30000	13.0	3.914	136	148.8	187.7	0.0	0.020	7446	4538	800m.pg152_o2_nofp.cx8a18_bee
100	7734	254	2.1	292.1	3.9	0.033	0.274	2.930	40.513	30261	13.2	3.913	137	148.8	188.8	0.0	0.030	7494	4937	800m.pg152_o2_nofp.cx8a20_bee
100	7734	254	2.1	333.5	3.4	0.033	0.274	3.342	35.353	30250	13.1	3.911	136	148.8	187.9	0.0	0.021	7511	4986	800m.pg152_o2_nofp.cx8a21_bee
100	7845	255	2.1	298.9	3.6	0.032	0.272	2.995	37.369	30666	12.8	3.909	131	148.8	188.8	0.0	0.024	7590	4795	800m.pg152_o2_nofp.cx8a22_bee
q500.1
q500.1: range queries with 500 insert/s per client
Performance metrics for all DBMS, not just the ones listed above. Some are normalized by throughput, others are not. Legend for results is here.
ips	qps	rps	rmbps	wps	wmbps	rpq	rkbpq	wpi	wkbpi	csps	cpups	cspq	cpupq	dbgb1	dbgb2	rss	maxop	p50	p99	tag
499	7822	805	6.4	985.7	14.9	0.103	0.840	1.976	30.565	31917	15.1	4.081	154	148.8	188.8	0.0	0.016	7478	7254	800m.pg152_o2_nofp.cx8_bee
499	7693	801	6.4	933.8	12.2	0.104	0.850	1.871	25.095	31385	14.3	4.079	149	148.8	188.8	0.0	0.010	7399	7144	800m.pg152_o2_nofp.cx8a1_bee
499	7710	807	6.4	949.8	14.8	0.105	0.854	1.903	30.457	31483	15.1	4.084	157	148.8	188.8	0.0	0.014	7302	7046	800m.pg152_o2_nofp.cx8a2_bee
499	7768	802	6.4	885.0	7.5	0.103	0.848	1.773	15.317	31584	13.8	4.066	142	148.8	185.7	0.0	0.010	7416	7195	800m.pg152_o2_nofp.cx8a3_bee
499	7733	801	6.4	937.4	14.7	0.104	0.845	1.879	30.223	31571	14.1	4.082	146	148.8	188.8	0.0	0.016	7383	7176	800m.pg152_o2_nofp.cx8a4_bee
499	7852	805	6.4	948.2	15.5	0.103	0.837	1.900	31.769	32072	15.2	4.085	155	148.8	185.3	0.0	0.015	7431	7146	800m.pg152_o2_nofp.cx8a9_bee
499	7813	804	6.4	931.3	14.7	0.103	0.839	1.866	30.164	31856	14.1	4.077	144	148.8	188.8	0.0	0.010	7389	7128	800m.pg152_o2_nofp.cx8a10_bee
499	7875	805	6.4	973.4	14.9	0.102	0.834	1.952	30.678	32120	15.1	4.079	153	148.8	188.8	0.0	0.015	7446	7212	800m.pg152_o2_nofp.cx8a12_bee
499	7758	801	6.4	925.4	14.6	0.103	0.842	1.854	30.054	31646	14.0	4.079	144	148.8	188.8	0.0	0.016	7414	7176	800m.pg152_o2_nofp.cx8a14_bee
499	7768	802	6.4	1024.0	16.6	0.103	0.842	2.053	34.099	31794	14.1	4.093	145	148.8	158.8	0.0	0.016	7400	7158	800m.pg152_o2_nofp.cx8a15_bee
499	7766	801	6.4	944.1	14.7	0.103	0.841	1.892	30.251	31692	14.1	4.081	145	148.8	188.8	0.0	0.015	7400	7144	800m.pg152_o2_nofp.cx8a16_bee
499	7768	800	6.4	916.8	14.5	0.103	0.841	1.837	29.833	31682	14.1	4.079	145	148.7	188.8	0.0	0.016	7431	7205	800m.pg152_o2_nofp.cx8a17_bee
499	7855	802	6.4	931.2	12.2	0.102	0.833	1.867	25.091	32012	14.5	4.075	148	148.8	187.7	0.0	0.011	7447	7195	800m.pg152_o2_nofp.cx8a18_bee
499	7861	805	6.4	949.2	14.8	0.102	0.835	1.903	30.449	32059	15.1	4.078	154	148.8	188.8	0.0	0.010	7527	7279	800m.pg152_o2_nofp.cx8a20_bee
499	7688	801	6.4	906.0	12.0	0.104	0.852	1.815	24.536	31356	14.1	4.079	147	148.8	187.9	0.0	0.015	7447	7192	800m.pg152_o2_nofp.cx8a21_bee
499	7948	801	6.4	927.5	14.7	0.101	0.822	1.858	30.098	32382	13.8	4.074	139	148.8	188.8	0.0	0.015	7575	7303	800m.pg152_o2_nofp.cx8a22_bee
q1000.1
q1000.1: range queries with 1000 insert/s per client
Performance metrics for all DBMS, not just the ones listed above. Some are normalized by throughput, others are not. Legend for results is here.
ips	qps	rps	rmbps	wps	wmbps	rpq	rkbpq	wpi	wkbpi	csps	cpups	cspq	cpupq	dbgb1	dbgb2	rss	maxop	p50	p99	tag
998	7992	1605	12.8	1809.0	25.9	0.201	1.640	1.812	26.518	34381	20.7	4.302	207	148.9	187.5	0.0	0.016	7687	7068	800m.pg152_o2_nofp.cx8_bee
998	7584	1602	12.8	1797.6	22.0	0.211	1.728	1.801	22.551	32801	15.2	4.325	160	148.9	186.7	0.0	0.016	7333	7064	800m.pg152_o2_nofp.cx8a1_bee
998	7805	1604	12.8	1798.7	26.2	0.206	1.678	1.802	26.831	33666	20.6	4.313	211	148.9	188.9	0.0	0.015	7464	6952	800m.pg152_o2_nofp.cx8a2_bee
998	7728	1603	12.9	1775.5	14.7	0.207	1.705	1.779	15.122	33246	14.7	4.302	152	148.9	185.5	0.0	0.010	7414	7160	800m.pg152_o2_nofp.cx8a3_bee
998	7631	1602	12.8	1818.3	26.2	0.210	1.715	1.823	26.893	33037	15.2	4.329	159	148.9	188.5	0.0	0.016	7352	7064	800m.pg152_o2_nofp.cx8a4_bee
998	7944	1604	12.8	1849.9	28.5	0.202	1.648	1.853	29.236	34282	20.7	4.316	208	148.9	181.3	0.0	0.015	7607	6999	800m.pg152_o2_nofp.cx8a9_bee
998	7688	1603	12.8	1811.3	26.3	0.208	1.702	1.815	26.950	33248	15.2	4.325	158	148.9	188.9	0.0	0.016	7367	7094	800m.pg152_o2_nofp.cx8a10_bee
998	7688	1603	12.8	1800.4	25.9	0.209	1.703	1.805	26.630	33256	15.7	4.326	163	148.9	187.6	0.0	0.015	7339	7018	800m.pg152_o2_nofp.cx8a12_bee
998	7690	1603	12.8	1811.8	26.3	0.208	1.703	1.815	26.956	33250	15.2	4.324	158	148.9	188.9	0.0	0.015	7400	7112	800m.pg152_o2_nofp.cx8a14_bee
998	7618	1603	12.8	2108.6	34.0	0.210	1.717	2.113	34.850	33248	15.5	4.365	163	148.9	158.9	0.0	0.016	7334	6983	800m.pg152_o2_nofp.cx8a15_bee
998	7706	1603	12.8	1818.5	26.1	0.208	1.698	1.822	26.822	33323	15.1	4.325	157	148.9	188.0	0.0	0.015	7416	7128	800m.pg152_o2_nofp.cx8a16_bee
998	7699	1603	12.8	1845.4	26.4	0.208	1.702	1.849	27.032	33262	15.2	4.320	158	148.8	188.0	0.0	0.011	7403	7158	800m.pg152_o2_nofp.cx8a17_bee
998	7383	1602	12.8	1796.7	22.0	0.217	1.775	1.801	22.583	32059	15.3	4.342	166	148.9	186.8	0.0	0.016	7176	6902	800m.pg152_o2_nofp.cx8a18_bee
998	7734	1604	12.8	1789.0	26.1	0.207	1.693	1.793	26.787	33431	15.8	4.322	163	148.9	188.9	0.0	0.012	7416	7125	800m.pg152_o2_nofp.cx8a20_bee
998	7697	1603	12.8	1794.6	22.1	0.208	1.703	1.799	22.694	33271	15.5	4.322	161	148.9	187.9	0.0	0.010	7403	7096	800m.pg152_o2_nofp.cx8a21_bee
998	7812	1602	12.8	1811.2	26.3	0.205	1.675	1.815	26.963	33725	15.3	4.317	157	148.9	188.9	0.0	0.016	7496	7164	800m.pg152_o2_nofp.cx8a22_bee
l.i0
- l.i0: load without secondary indexes
- Legend for results is here.
- Each entry lists the percentage of responses that fit in that bucket (slower than max time for previous bucket, faster than min time for next bucket).
Insert response time histogram
256us	1ms	4ms	16ms	64ms	256ms	1s	4s	16s	gt	max	tag
0.000	0.000	99.998	0.001	nonzero	nonzero	0.000	0.000	0.000	0.000	0.123	pg152_o2_nofp.cx8_bee
0.000	0.000	99.999	0.001	nonzero	0.000	0.000	0.000	0.000	0.000	0.060	pg152_o2_nofp.cx8a1_bee
0.000	0.000	99.998	0.002	0.001	0.000	0.000	0.000	0.000	0.000	0.058	pg152_o2_nofp.cx8a2_bee
0.000	0.000	99.999	nonzero	nonzero	0.000	0.000	0.000	0.000	0.000	0.058	pg152_o2_nofp.cx8a3_bee
0.000	0.000	99.998	0.002	nonzero	nonzero	0.000	0.000	0.000	0.000	0.144	pg152_o2_nofp.cx8a4_bee
0.000	0.000	99.997	0.002	0.001	nonzero	0.000	0.000	0.000	0.000	0.079	pg152_o2_nofp.cx8a9_bee
0.000	0.000	99.995	0.003	0.001	nonzero	0.000	0.000	0.000	0.000	0.099	pg152_o2_nofp.cx8a10_bee
0.000	0.000	99.999	0.001	nonzero	0.000	0.000	0.000	0.000	0.000	0.056	pg152_o2_nofp.cx8a12_bee
0.000	0.000	99.998	0.001	nonzero	0.000	0.000	0.000	0.000	0.000	0.057	pg152_o2_nofp.cx8a14_bee
0.000	0.000	99.998	0.002	nonzero	0.000	nonzero	0.000	0.000	0.000	0.524	pg152_o2_nofp.cx8a15_bee
0.000	0.000	99.998	0.001	nonzero	0.000	0.000	0.000	0.000	0.000	0.056	pg152_o2_nofp.cx8a16_bee
0.000	0.000	99.997	0.002	nonzero	nonzero	0.000	0.000	0.000	0.000	0.129	pg152_o2_nofp.cx8a17_bee
0.000	0.000	99.999	nonzero	nonzero	0.000	0.000	0.000	0.000	0.000	0.057	pg152_o2_nofp.cx8a18_bee
0.000	0.000	99.999	nonzero	nonzero	0.000	0.000	0.000	0.000	0.000	0.056	pg152_o2_nofp.cx8a20_bee
0.000	0.000	99.999	0.001	nonzero	0.000	0.000	0.000	0.000	0.000	0.060	pg152_o2_nofp.cx8a21_bee
0.000	0.000	99.999	0.001	nonzero	0.000	0.000	0.000	0.000	0.000	0.056	pg152_o2_nofp.cx8a22_bee
l.x
- l.x: create secondary indexes
- Legend for results is here.
- Each entry lists the percentage of responses that fit in that bucket (slower than max time for previous bucket, faster than min time for next bucket).
TODO - determine whether there is data for create index response time
l.i1
- l.i1: continue load after secondary indexes created
- Legend for results is here.
- Each entry lists the percentage of responses that fit in that bucket (slower than max time for previous bucket, faster than min time for next bucket).
Insert response time histogram
256us	1ms	4ms	16ms	64ms	256ms	1s	4s	16s	gt	max	tag
0.000	0.000	0.000	94.305	5.693	0.002	0.000	0.000	0.000	0.000	0.078	pg152_o2_nofp.cx8_bee
0.000	0.000	0.000	87.136	12.864	0.001	0.000	0.000	0.000	0.000	0.069	pg152_o2_nofp.cx8a1_bee
0.000	0.000	0.000	94.669	5.330	0.001	0.000	0.000	0.000	0.000	0.065	pg152_o2_nofp.cx8a2_bee
0.000	0.000	0.000	96.266	3.735	0.000	0.000	0.000	0.000	0.000	0.055	pg152_o2_nofp.cx8a3_bee
0.000	0.000	0.000	94.079	5.919	0.002	0.000	0.000	0.000	0.000	0.067	pg152_o2_nofp.cx8a4_bee
0.000	0.000	0.000	92.633	7.366	0.000	0.000	0.000	0.000	0.000	0.057	pg152_o2_nofp.cx8a9_bee
0.000	0.000	0.000	95.138	4.862	0.000	0.000	0.000	0.000	0.000	0.060	pg152_o2_nofp.cx8a10_bee
0.000	0.000	0.000	94.309	5.691	0.000	0.000	0.000	0.000	0.000	0.062	pg152_o2_nofp.cx8a12_bee
0.000	0.000	0.000	93.663	6.337	0.001	0.000	0.000	0.000	0.000	0.065	pg152_o2_nofp.cx8a14_bee
0.000	0.000	0.000	92.572	7.428	0.000	0.000	0.000	0.000	0.000	0.062	pg152_o2_nofp.cx8a15_bee
0.000	0.000	0.000	92.805	7.187	0.008	0.000	0.000	0.000	0.000	0.144	pg152_o2_nofp.cx8a16_bee
0.000	0.000	0.000	81.029	18.904	0.067	0.000	0.000	0.000	0.000	0.214	pg152_o2_nofp.cx8a17_bee
0.000	0.000	0.000	88.890	11.110	0.001	0.000	0.000	0.000	0.000	0.070	pg152_o2_nofp.cx8a18_bee
0.000	0.000	0.000	92.492	7.508	0.000	0.000	0.000	0.000	0.000	0.064	pg152_o2_nofp.cx8a20_bee
0.000	0.000	0.000	89.394	10.604	0.002	0.000	0.000	0.000	0.000	0.069	pg152_o2_nofp.cx8a21_bee
0.000	0.000	0.000	92.880	7.119	0.002	0.000	0.000	0.000	0.000	0.086	pg152_o2_nofp.cx8a22_bee
Delete response time histogram
256us	1ms	4ms	16ms	64ms	256ms	1s	4s	16s	gt	max	tag
0.003	30.128	2.154	10.919	41.547	15.249	0.001	0.000	0.000	0.000	0.310	pg152_o2_nofp.cx8_bee
0.001	21.827	2.071	11.068	41.308	23.726	0.000	0.000	0.000	0.000	0.096	pg152_o2_nofp.cx8a1_bee
0.003	32.827	2.087	10.928	41.502	12.652	0.001	0.000	0.000	0.000	0.312	pg152_o2_nofp.cx8a2_bee
0.002	17.492	2.004	11.009	41.401	28.092	0.000	0.000	0.000	0.000	0.102	pg152_o2_nofp.cx8a3_bee
0.003	18.334	2.027	11.023	41.512	27.101	0.000	0.000	0.000	0.000	0.100	pg152_o2_nofp.cx8a4_bee
0.000	0.128	1.946	11.147	41.212	45.568	0.000	0.000	0.000	0.000	0.121	pg152_o2_nofp.cx8a9_bee
0.003	11.807	1.991	11.166	41.528	33.505	0.000	0.000	0.000	0.000	0.110	pg152_o2_nofp.cx8a10_bee
0.000	0.213	1.961	11.050	41.472	45.305	0.000	0.000	0.000	0.000	0.123	pg152_o2_nofp.cx8a12_bee
0.005	30.255	2.055	11.159	41.279	15.248	0.000	0.000	0.000	0.000	0.087	pg152_o2_nofp.cx8a14_bee
0.001	31.761	2.057	11.246	41.266	13.668	0.000	0.000	0.000	0.000	0.082	pg152_o2_nofp.cx8a15_bee
0.004	28.662	1.954	11.127	41.459	16.794	0.000	0.000	0.000	0.000	0.089	pg152_o2_nofp.cx8a16_bee
0.002	18.390	2.053	11.016	41.450	27.090	0.000	0.000	0.000	0.000	0.098	pg152_o2_nofp.cx8a17_bee
0.003	24.075	1.867	11.293	41.247	21.516	0.000	0.000	0.000	0.000	0.092	pg152_o2_nofp.cx8a18_bee
0.001	0.121	2.038	11.144	41.458	45.238	0.000	0.000	0.000	0.000	0.120	pg152_o2_nofp.cx8a20_bee
0.003	30.152	2.008	11.236	41.314	15.287	0.000	0.000	0.000	0.000	0.088	pg152_o2_nofp.cx8a21_bee
0.003	29.471	1.997	11.204	41.538	15.787	0.000	0.000	0.000	0.000	0.088	pg152_o2_nofp.cx8a22_bee
q100.1
- q100.1: range queries with 100 insert/s per client
- Legend for results is here.
- Each entry lists the percentage of responses that fit in that bucket (slower than max time for previous bucket, faster than min time for next bucket).
Query response time histogram
256us	1ms	4ms	16ms	64ms	256ms	1s	4s	16s	gt	max	tag
99.042	0.946	0.009	0.003	nonzero	0.000	0.000	0.000	0.000	0.000	0.030	pg152_o2_nofp.cx8_bee
99.046	0.938	0.012	0.003	nonzero	0.000	0.000	0.000	0.000	0.000	0.032	pg152_o2_nofp.cx8a1_bee
99.165	0.820	0.011	0.004	nonzero	0.000	0.000	0.000	0.000	0.000	0.019	pg152_o2_nofp.cx8a2_bee
99.029	0.953	0.015	0.002	nonzero	0.000	0.000	0.000	0.000	0.000	0.019	pg152_o2_nofp.cx8a3_bee
99.055	0.931	0.010	0.004	nonzero	0.000	0.000	0.000	0.000	0.000	0.032	pg152_o2_nofp.cx8a4_bee
99.080	0.912	0.007	0.001	nonzero	0.000	0.000	0.000	0.000	0.000	0.020	pg152_o2_nofp.cx8a9_bee
99.033	0.954	0.010	0.004	nonzero	0.000	0.000	0.000	0.000	0.000	0.019	pg152_o2_nofp.cx8a10_bee
99.074	0.913	0.009	0.004	nonzero	0.000	0.000	0.000	0.000	0.000	0.033	pg152_o2_nofp.cx8a12_bee
99.092	0.896	0.009	0.003	nonzero	0.000	0.000	0.000	0.000	0.000	0.025	pg152_o2_nofp.cx8a14_bee
99.200	0.794	0.003	0.003	0.000	0.000	0.000	0.000	0.000	0.000	0.015	pg152_o2_nofp.cx8a15_bee
99.098	0.887	0.010	0.005	nonzero	0.000	0.000	0.000	0.000	0.000	0.031	pg152_o2_nofp.cx8a16_bee
99.100	0.885	0.011	0.004	nonzero	0.000	0.000	0.000	0.000	0.000	0.024	pg152_o2_nofp.cx8a17_bee
99.039	0.945	0.014	0.003	nonzero	0.000	0.000	0.000	0.000	0.000	0.020	pg152_o2_nofp.cx8a18_bee
99.099	0.891	0.007	0.003	nonzero	0.000	0.000	0.000	0.000	0.000	0.030	pg152_o2_nofp.cx8a20_bee
99.107	0.880	0.010	0.003	nonzero	0.000	0.000	0.000	0.000	0.000	0.021	pg152_o2_nofp.cx8a21_bee
99.122	0.866	0.009	0.003	nonzero	0.000	0.000	0.000	0.000	0.000	0.024	pg152_o2_nofp.cx8a22_bee
Insert response time histogram
256us	1ms	4ms	16ms	64ms	256ms	1s	4s	16s	gt	max	tag
0.000	0.000	0.000	68.361	31.639	0.000	0.000	0.000	0.000	0.000	0.031	pg152_o2_nofp.cx8_bee
0.000	0.000	0.000	47.556	52.444	0.000	0.000	0.000	0.000	0.000	0.033	pg152_o2_nofp.cx8a1_bee
0.000	0.000	0.000	55.972	44.028	0.000	0.000	0.000	0.000	0.000	0.059	pg152_o2_nofp.cx8a2_bee
0.000	0.000	0.000	66.694	33.306	0.000	0.000	0.000	0.000	0.000	0.059	pg152_o2_nofp.cx8a3_bee
0.000	0.000	0.000	56.472	43.528	0.000	0.000	0.000	0.000	0.000	0.044	pg152_o2_nofp.cx8a4_bee
0.000	0.000	0.000	82.361	17.639	0.000	0.000	0.000	0.000	0.000	0.040	pg152_o2_nofp.cx8a9_bee
0.000	0.000	0.000	63.611	36.389	0.000	0.000	0.000	0.000	0.000	0.031	pg152_o2_nofp.cx8a10_bee
0.000	0.000	0.000	61.306	38.694	0.000	0.000	0.000	0.000	0.000	0.032	pg152_o2_nofp.cx8a12_bee
0.000	0.000	0.000	66.750	33.250	0.000	0.000	0.000	0.000	0.000	0.031	pg152_o2_nofp.cx8a14_bee
0.000	0.000	0.000	73.972	26.028	0.000	0.000	0.000	0.000	0.000	0.049	pg152_o2_nofp.cx8a15_bee
0.000	0.000	0.000	59.056	40.944	0.000	0.000	0.000	0.000	0.000	0.031	pg152_o2_nofp.cx8a16_bee
0.000	0.000	0.000	54.389	45.611	0.000	0.000	0.000	0.000	0.000	0.053	pg152_o2_nofp.cx8a17_bee
0.000	0.000	0.000	60.000	40.000	0.000	0.000	0.000	0.000	0.000	0.033	pg152_o2_nofp.cx8a18_bee
0.000	0.000	0.000	73.778	26.222	0.000	0.000	0.000	0.000	0.000	0.030	pg152_o2_nofp.cx8a20_bee
0.000	0.000	0.000	54.389	45.611	0.000	0.000	0.000	0.000	0.000	0.033	pg152_o2_nofp.cx8a21_bee
0.000	0.000	0.000	72.333	27.667	0.000	0.000	0.000	0.000	0.000	0.031	pg152_o2_nofp.cx8a22_bee
Delete response time histogram
256us	1ms	4ms	16ms	64ms	256ms	1s	4s	16s	gt	max	tag
0.000	21.444	78.278	0.278	0.000	0.000	0.000	0.000	0.000	0.000	0.009	pg152_o2_nofp.cx8_bee
0.556	98.917	0.139	0.389	0.000	0.000	0.000	0.000	0.000	0.000	0.007	pg152_o2_nofp.cx8a1_bee
0.000	20.750	77.944	1.306	0.000	0.000	0.000	0.000	0.000	0.000	0.009	pg152_o2_nofp.cx8a2_bee
1.000	98.528	0.250	0.222	0.000	0.000	0.000	0.000	0.000	0.000	0.006	pg152_o2_nofp.cx8a3_bee
0.972	98.583	0.167	0.278	0.000	0.000	0.000	0.000	0.000	0.000	0.009	pg152_o2_nofp.cx8a4_bee
0.000	20.500	79.194	0.306	0.000	0.000	0.000	0.000	0.000	0.000	0.009	pg152_o2_nofp.cx8a9_bee
0.917	98.833	0.056	0.194	0.000	0.000	0.000	0.000	0.000	0.000	0.007	pg152_o2_nofp.cx8a10_bee
0.028	20.806	78.944	0.222	0.000	0.000	0.000	0.000	0.000	0.000	0.009	pg152_o2_nofp.cx8a12_bee
0.528	99.306	0.083	0.083	0.000	0.000	0.000	0.000	0.000	0.000	0.009	pg152_o2_nofp.cx8a14_bee
0.778	99.111	0.083	0.028	0.000	0.000	0.000	0.000	0.000	0.000	0.007	pg152_o2_nofp.cx8a15_bee
0.278	99.278	0.306	0.139	0.000	0.000	0.000	0.000	0.000	0.000	0.009	pg152_o2_nofp.cx8a16_bee
0.583	98.167	0.333	0.917	0.000	0.000	0.000	0.000	0.000	0.000	0.009	pg152_o2_nofp.cx8a17_bee
0.417	99.528	0.028	0.028	0.000	0.000	0.000	0.000	0.000	0.000	0.009	pg152_o2_nofp.cx8a18_bee
0.000	20.222	79.722	0.056	0.000	0.000	0.000	0.000	0.000	0.000	0.008	pg152_o2_nofp.cx8a20_bee
1.083	97.556	0.167	1.194	0.000	0.000	0.000	0.000	0.000	0.000	0.007	pg152_o2_nofp.cx8a21_bee
0.417	99.444	0.056	0.083	0.000	0.000	0.000	0.000	0.000	0.000	0.009	pg152_o2_nofp.cx8a22_bee
q500.1
- q500.1: range queries with 500 insert/s per client
- Legend for results is here.
- Each entry lists the percentage of responses that fit in that bucket (slower than max time for previous bucket, faster than min time for next bucket).
Query response time histogram
256us	1ms	4ms	16ms	64ms	256ms	1s	4s	16s	gt	max	tag
99.900	0.097	0.001	0.003	0.000	0.000	0.000	0.000	0.000	0.000	0.016	pg152_o2_nofp.cx8_bee
99.890	0.108	0.001	0.002	0.000	0.000	0.000	0.000	0.000	0.000	0.010	pg152_o2_nofp.cx8a1_bee
99.880	0.116	0.001	0.002	0.000	0.000	0.000	0.000	0.000	0.000	0.014	pg152_o2_nofp.cx8a2_bee
99.899	0.098	0.001	0.003	0.000	0.000	0.000	0.000	0.000	0.000	0.010	pg152_o2_nofp.cx8a3_bee
99.908	0.089	nonzero	0.002	0.000	0.000	0.000	0.000	0.000	0.000	0.016	pg152_o2_nofp.cx8a4_bee
99.887	0.110	0.001	0.002	0.000	0.000	0.000	0.000	0.000	0.000	0.015	pg152_o2_nofp.cx8a9_bee
99.909	0.089	0.001	0.002	0.000	0.000	0.000	0.000	0.000	0.000	0.010	pg152_o2_nofp.cx8a10_bee
99.890	0.108	0.001	0.002	0.000	0.000	0.000	0.000	0.000	0.000	0.015	pg152_o2_nofp.cx8a12_bee
99.903	0.094	0.001	0.002	nonzero	0.000	0.000	0.000	0.000	0.000	0.016	pg152_o2_nofp.cx8a14_bee
99.892	0.101	0.001	0.006	0.000	0.000	0.000	0.000	0.000	0.000	0.016	pg152_o2_nofp.cx8a15_bee
99.905	0.093	0.001	0.002	0.000	0.000	0.000	0.000	0.000	0.000	0.015	pg152_o2_nofp.cx8a16_bee
99.901	0.096	0.001	0.002	0.000	0.000	0.000	0.000	0.000	0.000	0.016	pg152_o2_nofp.cx8a17_bee
99.907	0.091	nonzero	0.002	0.000	0.000	0.000	0.000	0.000	0.000	0.011	pg152_o2_nofp.cx8a18_bee
99.901	0.096	nonzero	0.003	0.000	0.000	0.000	0.000	0.000	0.000	0.010	pg152_o2_nofp.cx8a20_bee
99.905	0.092	nonzero	0.003	0.000	0.000	0.000	0.000	0.000	0.000	0.015	pg152_o2_nofp.cx8a21_bee
99.915	0.082	0.001	0.002	0.000	0.000	0.000	0.000	0.000	0.000	0.015	pg152_o2_nofp.cx8a22_bee
Insert response time histogram
256us	1ms	4ms	16ms	64ms	256ms	1s	4s	16s	gt	max	tag
0.000	0.000	0.000	93.033	6.967	0.000	0.000	0.000	0.000	0.000	0.031	pg152_o2_nofp.cx8_bee
0.000	0.000	0.000	90.289	9.711	0.000	0.000	0.000	0.000	0.000	0.033	pg152_o2_nofp.cx8a1_bee
0.000	0.000	0.000	93.083	6.917	0.000	0.000	0.000	0.000	0.000	0.030	pg152_o2_nofp.cx8a2_bee
0.000	0.000	0.000	94.617	5.383	0.000	0.000	0.000	0.000	0.000	0.030	pg152_o2_nofp.cx8a3_bee
0.000	0.000	0.000	94.328	5.672	0.000	0.000	0.000	0.000	0.000	0.031	pg152_o2_nofp.cx8a4_bee
0.000	0.000	0.000	94.017	5.983	0.000	0.000	0.000	0.000	0.000	0.030	pg152_o2_nofp.cx8a9_bee
0.000	0.000	0.000	93.006	6.994	0.000	0.000	0.000	0.000	0.000	0.030	pg152_o2_nofp.cx8a10_bee
0.000	0.000	0.000	94.667	5.333	0.000	0.000	0.000	0.000	0.000	0.030	pg152_o2_nofp.cx8a12_bee
0.000	0.000	0.000	93.861	6.139	0.000	0.000	0.000	0.000	0.000	0.030	pg152_o2_nofp.cx8a14_bee
0.000	0.000	0.000	91.133	8.867	0.000	0.000	0.000	0.000	0.000	0.030	pg152_o2_nofp.cx8a15_bee
0.000	0.000	0.000	94.239	5.761	0.000	0.000	0.000	0.000	0.000	0.030	pg152_o2_nofp.cx8a16_bee
0.000	0.000	0.000	93.806	6.194	0.000	0.000	0.000	0.000	0.000	0.030	pg152_o2_nofp.cx8a17_bee
0.000	0.000	0.000	91.256	8.744	0.000	0.000	0.000	0.000	0.000	0.032	pg152_o2_nofp.cx8a18_bee
0.000	0.000	0.000	93.128	6.872	0.000	0.000	0.000	0.000	0.000	0.031	pg152_o2_nofp.cx8a20_bee
0.000	0.000	0.000	91.439	8.561	0.000	0.000	0.000	0.000	0.000	0.032	pg152_o2_nofp.cx8a21_bee
0.000	0.000	0.000	93.478	6.522	0.000	0.000	0.000	0.000	0.000	0.032	pg152_o2_nofp.cx8a22_bee
Delete response time histogram
256us	1ms	4ms	16ms	64ms	256ms	1s	4s	16s	gt	max	tag
0.000	0.000	5.711	93.283	1.006	0.000	0.000	0.000	0.000	0.000	0.020	pg152_o2_nofp.cx8_bee
2.550	97.067	0.061	0.322	0.000	0.000	0.000	0.000	0.000	0.000	0.009	pg152_o2_nofp.cx8a1_bee
0.000	0.000	6.911	92.606	0.483	0.000	0.000	0.000	0.000	0.000	0.019	pg152_o2_nofp.cx8a2_bee
3.928	95.911	0.050	0.111	0.000	0.000	0.000	0.000	0.000	0.000	0.007	pg152_o2_nofp.cx8a3_bee
3.528	95.378	0.239	0.856	0.000	0.000	0.000	0.000	0.000	0.000	0.011	pg152_o2_nofp.cx8a4_bee
0.000	0.000	6.422	92.761	0.817	0.000	0.000	0.000	0.000	0.000	0.017	pg152_o2_nofp.cx8a9_bee
3.078	96.328	0.078	0.517	0.000	0.000	0.000	0.000	0.000	0.000	0.008	pg152_o2_nofp.cx8a10_bee
0.000	0.000	5.983	93.061	0.956	0.000	0.000	0.000	0.000	0.000	0.020	pg152_o2_nofp.cx8a12_bee
3.939	95.217	0.144	0.700	0.000	0.000	0.000	0.000	0.000	0.000	0.008	pg152_o2_nofp.cx8a14_bee
4.650	94.900	0.111	0.339	0.000	0.000	0.000	0.000	0.000	0.000	0.009	pg152_o2_nofp.cx8a15_bee
3.083	96.078	0.178	0.661	0.000	0.000	0.000	0.000	0.000	0.000	0.008	pg152_o2_nofp.cx8a16_bee
3.772	95.478	0.183	0.567	0.000	0.000	0.000	0.000	0.000	0.000	0.008	pg152_o2_nofp.cx8a17_bee
2.544	97.228	0.072	0.156	0.000	0.000	0.000	0.000	0.000	0.000	0.007	pg152_o2_nofp.cx8a18_bee
0.000	0.000	6.428	92.639	0.933	0.000	0.000	0.000	0.000	0.000	0.018	pg152_o2_nofp.cx8a20_bee
2.806	96.894	0.078	0.222	0.000	0.000	0.000	0.000	0.000	0.000	0.008	pg152_o2_nofp.cx8a21_bee
3.811	95.794	0.128	0.267	0.000	0.000	0.000	0.000	0.000	0.000	0.007	pg152_o2_nofp.cx8a22_bee
q1000.1
- q1000.1: range queries with 1000 insert/s per client
- Legend for results is here.
- Each entry lists the percentage of responses that fit in that bucket (slower than max time for previous bucket, faster than min time for next bucket).
Query response time histogram
256us	1ms	4ms	16ms	64ms	256ms	1s	4s	16s	gt	max	tag
99.802	0.187	0.003	0.008	0.000	0.000	0.000	0.000	0.000	0.000	0.016	pg152_o2_nofp.cx8_bee
99.854	0.138	0.001	0.007	0.000	0.000	0.000	0.000	0.000	0.000	0.016	pg152_o2_nofp.cx8a1_bee
99.792	0.198	0.002	0.008	0.000	0.000	0.000	0.000	0.000	0.000	0.015	pg152_o2_nofp.cx8a2_bee
99.869	0.125	0.001	0.005	0.000	0.000	0.000	0.000	0.000	0.000	0.010	pg152_o2_nofp.cx8a3_bee
99.836	0.154	0.001	0.009	0.000	0.000	0.000	0.000	0.000	0.000	0.016	pg152_o2_nofp.cx8a4_bee
99.790	0.203	0.003	0.004	0.000	0.000	0.000	0.000	0.000	0.000	0.015	pg152_o2_nofp.cx8a9_bee
99.840	0.150	0.001	0.009	0.000	0.000	0.000	0.000	0.000	0.000	0.016	pg152_o2_nofp.cx8a10_bee
99.829	0.161	0.001	0.009	0.000	0.000	0.000	0.000	0.000	0.000	0.015	pg152_o2_nofp.cx8a12_bee
99.854	0.136	0.001	0.009	0.000	0.000	0.000	0.000	0.000	0.000	0.015	pg152_o2_nofp.cx8a14_bee
99.821	0.171	0.002	0.007	0.000	0.000	0.000	0.000	0.000	0.000	0.016	pg152_o2_nofp.cx8a15_bee
99.839	0.150	0.001	0.009	0.000	0.000	0.000	0.000	0.000	0.000	0.015	pg152_o2_nofp.cx8a16_bee
99.852	0.140	0.001	0.007	0.000	0.000	0.000	0.000	0.000	0.000	0.011	pg152_o2_nofp.cx8a17_bee
99.842	0.149	0.001	0.007	0.000	0.000	0.000	0.000	0.000	0.000	0.016	pg152_o2_nofp.cx8a18_bee
99.834	0.156	0.002	0.009	0.000	0.000	0.000	0.000	0.000	0.000	0.012	pg152_o2_nofp.cx8a20_bee
99.845	0.148	0.001	0.006	0.000	0.000	0.000	0.000	0.000	0.000	0.010	pg152_o2_nofp.cx8a21_bee
99.845	0.146	0.001	0.009	0.000	0.000	0.000	0.000	0.000	0.000	0.016	pg152_o2_nofp.cx8a22_bee
Insert response time histogram
256us	1ms	4ms	16ms	64ms	256ms	1s	4s	16s	gt	max	tag
0.000	0.000	0.000	97.661	2.339	0.000	0.000	0.000	0.000	0.000	0.029	pg152_o2_nofp.cx8_bee
0.000	0.000	0.000	96.808	3.192	0.000	0.000	0.000	0.000	0.000	0.030	pg152_o2_nofp.cx8a1_bee
0.000	0.000	0.000	97.197	2.803	0.000	0.000	0.000	0.000	0.000	0.030	pg152_o2_nofp.cx8a2_bee
0.000	0.000	0.000	98.025	1.975	0.000	0.000	0.000	0.000	0.000	0.029	pg152_o2_nofp.cx8a3_bee
0.000	0.000	0.000	96.856	3.144	0.000	0.000	0.000	0.000	0.000	0.030	pg152_o2_nofp.cx8a4_bee
0.000	0.000	0.000	96.850	3.150	0.000	0.000	0.000	0.000	0.000	0.029	pg152_o2_nofp.cx8a9_bee
0.000	0.000	0.000	97.208	2.792	0.000	0.000	0.000	0.000	0.000	0.028	pg152_o2_nofp.cx8a10_bee
0.000	0.000	0.000	96.697	3.303	0.000	0.000	0.000	0.000	0.000	0.029	pg152_o2_nofp.cx8a12_bee
0.000	0.000	0.000	97.153	2.847	0.000	0.000	0.000	0.000	0.000	0.029	pg152_o2_nofp.cx8a14_bee
0.000	0.000	0.000	95.806	4.194	0.000	0.000	0.000	0.000	0.000	0.030	pg152_o2_nofp.cx8a15_bee
0.000	0.000	0.000	97.072	2.928	0.000	0.000	0.000	0.000	0.000	0.029	pg152_o2_nofp.cx8a16_bee
0.000	0.000	0.000	97.047	2.953	0.000	0.000	0.000	0.000	0.000	0.040	pg152_o2_nofp.cx8a17_bee
0.000	0.000	0.000	96.683	3.317	0.000	0.000	0.000	0.000	0.000	0.030	pg152_o2_nofp.cx8a18_bee
0.000	0.000	0.000	96.947	3.053	0.000	0.000	0.000	0.000	0.000	0.029	pg152_o2_nofp.cx8a20_bee
0.000	0.000	0.000	97.436	2.564	0.000	0.000	0.000	0.000	0.000	0.031	pg152_o2_nofp.cx8a21_bee
0.000	0.000	0.000	97.083	2.917	0.000	0.000	0.000	0.000	0.000	0.029	pg152_o2_nofp.cx8a22_bee
Delete response time histogram
256us	1ms	4ms	16ms	64ms	256ms	1s	4s	16s	gt	max	tag
0.000	0.000	0.000	14.072	85.928	0.000	0.000	0.000	0.000	0.000	0.042	pg152_o2_nofp.cx8_bee
1.458	98.414	0.083	0.044	0.000	0.000	0.000	0.000	0.000	0.000	0.010	pg152_o2_nofp.cx8a1_bee
0.000	0.000	0.000	14.047	85.953	0.000	0.000	0.000	0.000	0.000	0.043	pg152_o2_nofp.cx8a2_bee
2.094	97.808	0.056	0.042	0.000	0.000	0.000	0.000	0.000	0.000	0.010	pg152_o2_nofp.cx8a3_bee
2.531	97.333	0.069	0.067	0.000	0.000	0.000	0.000	0.000	0.000	0.007	pg152_o2_nofp.cx8a4_bee
0.000	0.000	0.000	14.181	85.819	0.000	0.000	0.000	0.000	0.000	0.043	pg152_o2_nofp.cx8a9_bee
2.633	97.261	0.050	0.056	0.000	0.000	0.000	0.000	0.000	0.000	0.008	pg152_o2_nofp.cx8a10_bee
2.631	85.686	0.036	11.278	0.369	0.000	0.000	0.000	0.000	0.000	0.043	pg152_o2_nofp.cx8a12_bee
2.697	97.144	0.083	0.075	0.000	0.000	0.000	0.000	0.000	0.000	0.008	pg152_o2_nofp.cx8a14_bee
2.328	97.517	0.075	0.081	0.000	0.000	0.000	0.000	0.000	0.000	0.007	pg152_o2_nofp.cx8a15_bee
2.653	97.197	0.064	0.086	0.000	0.000	0.000	0.000	0.000	0.000	0.008	pg152_o2_nofp.cx8a16_bee
2.878	96.967	0.100	0.056	0.000	0.000	0.000	0.000	0.000	0.000	0.009	pg152_o2_nofp.cx8a17_bee
1.556	98.308	0.078	0.058	0.000	0.000	0.000	0.000	0.000	0.000	0.010	pg152_o2_nofp.cx8a18_bee
2.422	82.617	0.031	13.381	1.550	0.000	0.000	0.000	0.000	0.000	0.033	pg152_o2_nofp.cx8a20_bee
1.700	98.178	0.072	0.050	0.000	0.000	0.000	0.000	0.000	0.000	0.009	pg152_o2_nofp.cx8a21_bee
2.528	97.322	0.086	0.064	0.000	0.000	0.000	0.000	0.000	0.000	0.008	pg152_o2_nofp.cx8a22_bee