Introduction
This is a report for the insert benchmark with 4000M docs and 8 client(s). It is generated by scripts (bash, awk, sed) and Tufte might not be impressed. An overview of the insert benchmark is here and a short update is here. Below, by DBMS, I mean DBMS+version.config. An example is my8020.c10b40 where my means MySQL, 8020 is version 8.0.20 and c10b40 is the name for the configuration file.
The test server is a c2-standard-30 with 15 cores, hyperthreads disabled, 120G RAM and XFS with SW RAID 0 across 4 NVMe SSD. The benchmark was run with 8 clients and there were 1 or 3 connections per client (1 for queries or inserts without rate limits, 1+1 for rate limited inserts+deletes). It uses 8 tables, 1 per client. It loads 500M rows per table without secondary indexes, creates secondary indexes, then inserts 20M rows per table with a delete per insert to avoid growing the table. It then does 3 read+write tests for 3600s each that do queries as fast as possible with 100, 500 and then 1000 inserts/second/client concurrent with the queries. There are also deletes to match the inserts and avoid growing the table. The database is larger than memory. Clients and the DBMS share one server. The per-database configs are in the per-database subdirectories here.
The tested DBMS are:
- pg153_o3_native_lto.cx7a_gcp_c2s30 - Postgres 15.3, the cx7a_gcp_c2s30 config and the build used: -O3 -march=native -mtune=native -flto
- pg153_o3_native_lto.cx7a1_gcp_c2s30 - Postgres 15.3, the cx7a1_gcp_c2s30 config and the build used: -O3 -march=native -mtune=native -flto, adds wal_compression=lz4
- pg153_o3_native_lto.cx7a4_gcp_c2s30 - Postgres 15.3, the cx7a4_gcp_c2s30 config and the build used: -O3 -march=native -mtune=native -flto, adds checkpoint_timeout=1800s
- pg153_o3_native_lto.cx7a7_gcp_c2s30 - Postgres 15.3, the cx7a7_gcp_c2s30 config and the build used: -O3 -march=native -mtune=native -flto, adds max_wal_size=16GB
- pg153_o3_native_lto.cx7a10_gcp_c2s30 - Postgres 15.3, the cx7a10_gcp_c2s30 config, compiled with -O3 -march=native -mtune=native -flto, adds autovacuum_work_mem=256MB
- pg153_o3_native_lto.cx7a12_gcp_c2s30 - Postgres 15.3, the cx7a12_gcp_c2s30 config, compiled with -O3 -march=native -mtune=native -flto, adds wal_buffers=64MB
- pg153_o3_native_lto.cx7a15_gcp_c2s30 - Postgres 15.3, the cx7a15_gcp_c2s30 config, compiled with -O3 -march=native -mtune=native -flto, adds max_wal_size=32GB
- pg153_o3_native_lto.cx7a16_gcp_c2s30 - Postgres 15.3, the cx7a16_gcp_c2s30 config, compiled with -O3 -march=native -mtune=native -flto, adds autovacuum_vacuum_scale_factor=0.05 autovacuum_vacuum_insert_scale_factor=0.05
- pg153_o3_native_lto.cx7a21_gcp_c2s30 - Postgres 15.3, the cx7a21_gcp_c2s30 config, compiled with -O3 -march=native -mtune=native -flto, combines a1, a4, a10 and a16
- pg153_o3_native_lto.cx7a22_gcp_c2s30 - Postgres 15.3, the cx7a22_gcp_c2s30 config, compiled with -O3 -march=native -mtune=native -flto, combines a4, a10 and a16
Contents
- Summary
- l.i0: load without secondary indexes
- l.x: create secondary indexes
- l.i1: continue load after secondary indexes created
- q100.1: range queries with 100 insert/s per client
- q500.1: range queries with 500 insert/s per client
- q1000.1: range queries with 1000 insert/s per client
Summary
The numbers are inserts/s for l.i0 and l.i1, indexed docs (or rows) /s for l.x and queries/s for q*.2. The values are the average rate over the entire test for inserts (IPS) and queries (QPS). The range of values for IPS and QPS is split into 3 parts: bottom 25%, middle 50%, top 25%. Values in the bottom 25% have a red background, values in the top 25% have a green background and values in the middle have no color. A gray background is used for values that can be ignored because the DBMS did not sustain the target insert rate. Red backgrounds are not used when the minimum value is within 80% of the max value.
| dbms | l.i0 | l.x | l.i1 | q100.1 | q500.1 | q1000.1 |
|---|---|---|---|---|---|---|
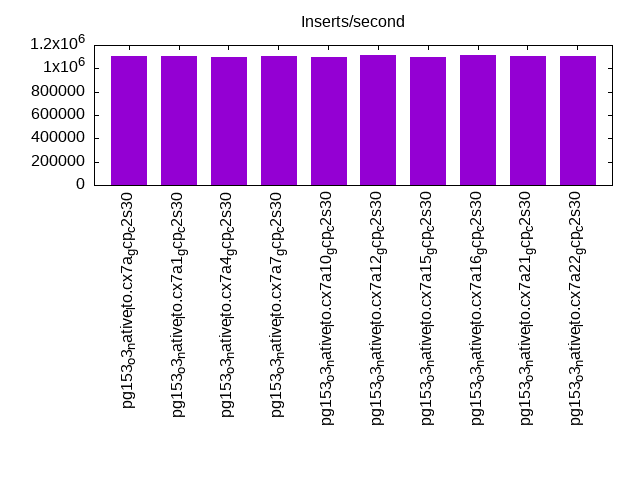
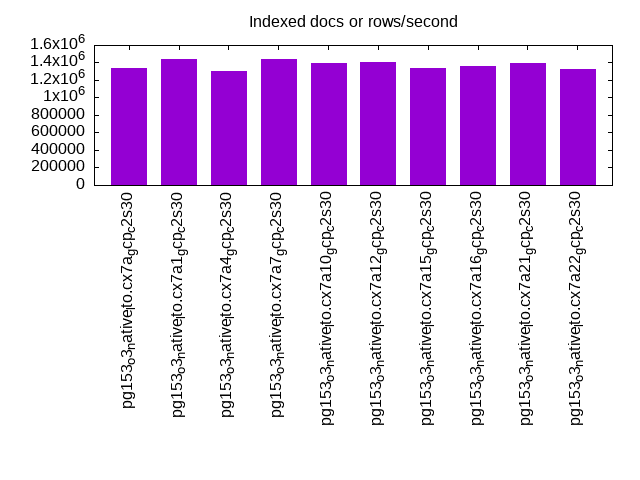
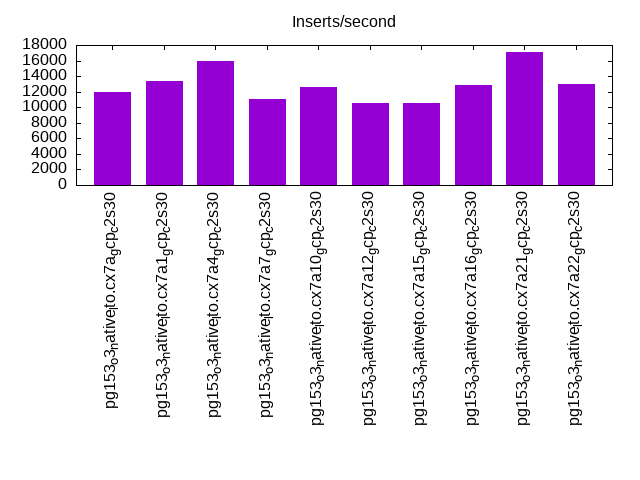
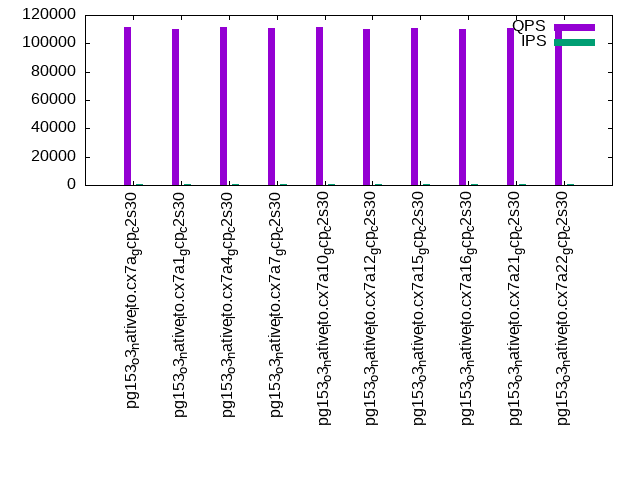
| pg153_o3_native_lto.cx7a_gcp_c2s30 | 1102232 | 1335147 | 11947 | 111723 | 103156 | 90694 |
| pg153_o3_native_lto.cx7a1_gcp_c2s30 | 1105889 | 1439921 | 13430 | 110114 | 100699 | 82821 |
| pg153_o3_native_lto.cx7a4_gcp_c2s30 | 1095890 | 1298312 | 15909 | 111620 | 103542 | 91871 |
| pg153_o3_native_lto.cx7a7_gcp_c2s30 | 1103448 | 1439403 | 11054 | 110928 | 100181 | 87861 |
| pg153_o3_native_lto.cx7a10_gcp_c2s30 | 1101322 | 1389889 | 12586 | 111521 | 102652 | 92298 |
| pg153_o3_native_lto.cx7a12_gcp_c2s30 | 1118256 | 1409975 | 10595 | 110339 | 101064 | 80797 |
| pg153_o3_native_lto.cx7a15_gcp_c2s30 | 1098901 | 1332035 | 10479 | 110841 | 101041 | 89143 |
| pg153_o3_native_lto.cx7a16_gcp_c2s30 | 1111111 | 1361504 | 12810 | 110068 | 100490 | 86253 |
| pg153_o3_native_lto.cx7a21_gcp_c2s30 | 1104362 | 1390372 | 17129 | 110845 | 102795 | 92676 |
| pg153_o3_native_lto.cx7a22_gcp_c2s30 | 1105583 | 1321910 | 13004 | 110148 | 101045 | 80552 |
This table has relative throughput, throughput for the DBMS relative to the DBMS in the first line, using the absolute throughput from the previous table. Values less than 0.95 have a yellow background. Values greater than 1.05 have a blue background.
| dbms | l.i0 | l.x | l.i1 | q100.1 | q500.1 | q1000.1 |
|---|---|---|---|---|---|---|
| pg153_o3_native_lto.cx7a_gcp_c2s30 | 1.00 | 1.00 | 1.00 | 1.00 | 1.00 | 1.00 |
| pg153_o3_native_lto.cx7a1_gcp_c2s30 | 1.00 | 1.08 | 1.12 | 0.99 | 0.98 | 0.91 |
| pg153_o3_native_lto.cx7a4_gcp_c2s30 | 0.99 | 0.97 | 1.33 | 1.00 | 1.00 | 1.01 |
| pg153_o3_native_lto.cx7a7_gcp_c2s30 | 1.00 | 1.08 | 0.93 | 0.99 | 0.97 | 0.97 |
| pg153_o3_native_lto.cx7a10_gcp_c2s30 | 1.00 | 1.04 | 1.05 | 1.00 | 1.00 | 1.02 |
| pg153_o3_native_lto.cx7a12_gcp_c2s30 | 1.01 | 1.06 | 0.89 | 0.99 | 0.98 | 0.89 |
| pg153_o3_native_lto.cx7a15_gcp_c2s30 | 1.00 | 1.00 | 0.88 | 0.99 | 0.98 | 0.98 |
| pg153_o3_native_lto.cx7a16_gcp_c2s30 | 1.01 | 1.02 | 1.07 | 0.99 | 0.97 | 0.95 |
| pg153_o3_native_lto.cx7a21_gcp_c2s30 | 1.00 | 1.04 | 1.43 | 0.99 | 1.00 | 1.02 |
| pg153_o3_native_lto.cx7a22_gcp_c2s30 | 1.00 | 0.99 | 1.09 | 0.99 | 0.98 | 0.89 |
This lists the average rate of inserts/s for the tests that do inserts concurrent with queries. For such tests the query rate is listed in the table above. The read+write tests are setup so that the insert rate should match the target rate every second. Cells that are not at least 95% of the target have a red background to indicate a failure to satisfy the target.
| dbms | q100.1 | q500.1 | q1000.1 |
|---|---|---|---|
| pg153_o3_native_lto.cx7a_gcp_c2s30 | 797 | 3988 | 7976 |
| pg153_o3_native_lto.cx7a1_gcp_c2s30 | 797 | 3987 | 7973 |
| pg153_o3_native_lto.cx7a4_gcp_c2s30 | 797 | 3987 | 7976 |
| pg153_o3_native_lto.cx7a7_gcp_c2s30 | 798 | 3987 | 7978 |
| pg153_o3_native_lto.cx7a10_gcp_c2s30 | 797 | 3987 | 7976 |
| pg153_o3_native_lto.cx7a12_gcp_c2s30 | 797 | 3987 | 7976 |
| pg153_o3_native_lto.cx7a15_gcp_c2s30 | 797 | 3987 | 7976 |
| pg153_o3_native_lto.cx7a16_gcp_c2s30 | 797 | 3988 | 7973 |
| pg153_o3_native_lto.cx7a21_gcp_c2s30 | 797 | 3987 | 7976 |
| pg153_o3_native_lto.cx7a22_gcp_c2s30 | 797 | 3987 | 7973 |
| target | 800 | 4000 | 8000 |
l.i0
l.i0: load without secondary indexes. Graphs for performance per 1-second interval are here.
Average throughput:
Insert response time histogram: each cell has the percentage of responses that take <= the time in the header and max is the max response time in seconds. For the max column values in the top 25% of the range have a red background and in the bottom 25% of the range have a green background. The red background is not used when the min value is within 80% of the max value.
| dbms | 256us | 1ms | 4ms | 16ms | 64ms | 256ms | 1s | 4s | 16s | gt | max |
|---|---|---|---|---|---|---|---|---|---|---|---|
| pg153_o3_native_lto.cx7a_gcp_c2s30 | 97.179 | 2.735 | 0.057 | 0.013 | 0.014 | 0.001 | 0.770 | ||||
| pg153_o3_native_lto.cx7a1_gcp_c2s30 | 97.263 | 2.674 | 0.038 | 0.012 | 0.012 | 0.001 | 0.856 | ||||
| pg153_o3_native_lto.cx7a4_gcp_c2s30 | 96.873 | 3.036 | 0.060 | 0.016 | 0.013 | 0.001 | 0.727 | ||||
| pg153_o3_native_lto.cx7a7_gcp_c2s30 | 96.901 | 3.027 | 0.042 | 0.021 | 0.009 | 0.001 | 0.493 | ||||
| pg153_o3_native_lto.cx7a10_gcp_c2s30 | 97.288 | 2.616 | 0.066 | 0.017 | 0.012 | 0.001 | 0.678 | ||||
| pg153_o3_native_lto.cx7a12_gcp_c2s30 | 97.166 | 2.771 | 0.048 | 0.010 | 0.004 | nonzero | 0.585 | ||||
| pg153_o3_native_lto.cx7a15_gcp_c2s30 | 96.823 | 3.103 | 0.048 | 0.015 | 0.010 | 0.001 | 0.566 | ||||
| pg153_o3_native_lto.cx7a16_gcp_c2s30 | 97.646 | 2.284 | 0.048 | 0.011 | 0.010 | 0.001 | 0.758 | ||||
| pg153_o3_native_lto.cx7a21_gcp_c2s30 | 97.333 | 2.615 | 0.031 | 0.009 | 0.011 | 0.001 | nonzero | 1.007 | |||
| pg153_o3_native_lto.cx7a22_gcp_c2s30 | 97.566 | 2.363 | 0.050 | 0.011 | 0.010 | 0.001 | nonzero | 5.617 |
Performance metrics for the DBMS listed above. Some are normalized by throughput, others are not. Legend for results is here.
ips	qps	rps	rmbps	wps	wmbps	rpq	rkbpq	wpi	wkbpi	csps	cpups	cspq	cpupq	dbgb1	dbgb2	rss	maxop	p50	p99	tag
1102232	0	567	4.8	1563.3	306.4	0.001	0.004	0.001	0.285	91674	81.9	0.083	11	382.7	452.8	0.0	0.770	145142	42653	4000m.pg153_o3_native_lto.cx7a_gcp_c2s30
1105889	0	569	4.9	1523.1	281.6	0.001	0.005	0.001	0.261	90062	83.7	0.081	11	382.7	452.8	0.0	0.856	144441	53141	4000m.pg153_o3_native_lto.cx7a1_gcp_c2s30
1095890	0	556	5.3	1568.2	307.3	0.001	0.005	0.001	0.287	90019	82.7	0.082	11	382.7	452.8	0.0	0.727	144135	48169	4000m.pg153_o3_native_lto.cx7a4_gcp_c2s30
1103448	0	563	4.8	1705.3	324.4	0.001	0.004	0.002	0.301	92328	83.4	0.084	11	382.7	398.8	0.0	0.493	143744	62731	4000m.pg153_o3_native_lto.cx7a7_gcp_c2s30
1101322	0	557	5.0	1587.7	303.4	0.001	0.005	0.001	0.282	90605	83.2	0.082	11	382.7	452.8	0.0	0.678	144043	52449	4000m.pg153_o3_native_lto.cx7a10_gcp_c2s30
1118256	0	574	4.5	1536.3	311.5	0.001	0.004	0.001	0.285	90930	84.8	0.081	11	382.7	452.8	0.0	0.585	143598	68425	4000m.pg153_o3_native_lto.cx7a12_gcp_c2s30
1098901	0	561	5.1	1631.5	314.5	0.001	0.005	0.001	0.293	90239	83.6	0.082	11	382.7	414.8	0.0	0.566	143045	58336	4000m.pg153_o3_native_lto.cx7a15_gcp_c2s30
1111111	0	557	4.4	1375.7	266.8	0.001	0.004	0.001	0.246	91091	83.7	0.082	11	382.7	452.8	0.0	0.758	144642	56238	4000m.pg153_o3_native_lto.cx7a16_gcp_c2s30
1104362	0	557	4.4	1344.0	251.1	0.001	0.004	0.001	0.233	91843	83.4	0.083	11	382.7	452.8	0.0	1.007	143143	55639	4000m.pg153_o3_native_lto.cx7a21_gcp_c2s30
1105583	0	556	4.4	1384.3	264.4	0.001	0.004	0.001	0.245	90419	83.9	0.082	11	382.7	452.8	0.0	5.617	143445	55140	4000m.pg153_o3_native_lto.cx7a22_gcp_c2s30
l.x
l.x: create secondary indexes.
Average throughput:
Performance metrics for the DBMS listed above. Some are normalized by throughput, others are not. Legend for results is here.
ips	qps	rps	rmbps	wps	wmbps	rpq	rkbpq	wpi	wkbpi	csps	cpups	cspq	cpupq	dbgb1	dbgb2	rss	maxop	p50	p99	tag
1335147	0	6304	916.2	1257.1	271.7	0.005	0.703	0.001	0.208	21602	30.9	0.016	3	735.2	802.4	0.1	0.002	NA	NA	4000m.pg153_o3_native_lto.cx7a_gcp_c2s30
1439921	0	6253	897.5	1267.7	275.3	0.004	0.638	0.001	0.196	7577	34.3	0.005	4	735.2	801.5	0.1	0.027	NA	NA	4000m.pg153_o3_native_lto.cx7a1_gcp_c2s30
1298312	0	6373	917.3	1235.8	267.2	0.005	0.723	0.001	0.211	20638	31.1	0.016	4	735.2	805.2	0.1	0.002	NA	NA	4000m.pg153_o3_native_lto.cx7a4_gcp_c2s30
1439403	0	6027	837.0	1361.4	300.5	0.004	0.595	0.001	0.214	23102	33.7	0.016	4	735.2	751.2	0.1	0.002	NA	NA	4000m.pg153_o3_native_lto.cx7a7_gcp_c2s30
1389889	0	6446	870.8	1348.4	293.0	0.005	0.642	0.001	0.216	21832	32.9	0.016	4	735.2	803.1	0.0	0.002	NA	NA	4000m.pg153_o3_native_lto.cx7a10_gcp_c2s30
1409975	0	6131	867.7	1365.2	295.8	0.004	0.630	0.001	0.215	22239	33.4	0.016	4	735.2	802.6	0.1	0.002	NA	NA	4000m.pg153_o3_native_lto.cx7a12_gcp_c2s30
1332035	0	6366	886.1	1281.8	278.6	0.005	0.681	0.001	0.214	20674	31.8	0.016	4	735.2	767.2	0.1	0.030	NA	NA	4000m.pg153_o3_native_lto.cx7a15_gcp_c2s30
1361504	0	6022	879.1	1247.1	270.2	0.004	0.661	0.001	0.203	20683	32.3	0.015	4	735.2	801.4	0.1	0.002	NA	NA	4000m.pg153_o3_native_lto.cx7a16_gcp_c2s30
1390372	0	6206	904.9	1143.8	251.0	0.004	0.666	0.001	0.185	6875	33.3	0.005	4	735.2	805.2	0.1	0.002	NA	NA	4000m.pg153_o3_native_lto.cx7a21_gcp_c2s30
1321910	0	6010	904.1	1206.6	263.6	0.005	0.700	0.001	0.204	19764	31.4	0.015	4	735.2	805.2	0.1	0.002	NA	NA	4000m.pg153_o3_native_lto.cx7a22_gcp_c2s30
l.i1
l.i1: continue load after secondary indexes created. Graphs for performance per 1-second interval are here.
Average throughput:
Insert response time histogram: each cell has the percentage of responses that take <= the time in the header and max is the max response time in seconds. For the max column values in the top 25% of the range have a red background and in the bottom 25% of the range have a green background. The red background is not used when the min value is within 80% of the max value.
| dbms | 256us | 1ms | 4ms | 16ms | 64ms | 256ms | 1s | 4s | 16s | gt | max |
|---|---|---|---|---|---|---|---|---|---|---|---|
| pg153_o3_native_lto.cx7a_gcp_c2s30 | 0.023 | 12.799 | 52.012 | 34.859 | 0.306 | 0.001 | nonzero | 1.137 | |||
| pg153_o3_native_lto.cx7a1_gcp_c2s30 | 4.293 | 57.868 | 37.801 | 0.034 | 0.004 | 0.971 | |||||
| pg153_o3_native_lto.cx7a4_gcp_c2s30 | 0.090 | 18.506 | 54.261 | 27.129 | 0.013 | nonzero | 0.606 | ||||
| pg153_o3_native_lto.cx7a7_gcp_c2s30 | 9.546 | 48.794 | 41.624 | 0.035 | nonzero | 0.744 | |||||
| pg153_o3_native_lto.cx7a10_gcp_c2s30 | 0.013 | 20.729 | 48.322 | 30.878 | 0.052 | 0.006 | nonzero | 1.021 | |||
| pg153_o3_native_lto.cx7a12_gcp_c2s30 | 0.022 | 13.787 | 51.440 | 34.725 | 0.022 | 0.003 | nonzero | 1.279 | |||
| pg153_o3_native_lto.cx7a15_gcp_c2s30 | 2.942 | 48.226 | 48.805 | 0.024 | 0.003 | nonzero | 1.168 | ||||
| pg153_o3_native_lto.cx7a16_gcp_c2s30 | 2.278 | 48.461 | 49.218 | 0.040 | 0.003 | nonzero | nonzero | nonzero | 17.755 | ||
| pg153_o3_native_lto.cx7a21_gcp_c2s30 | 0.006 | 1.693 | 45.136 | 53.134 | 0.029 | 0.002 | nonzero | 3.693 | |||
| pg153_o3_native_lto.cx7a22_gcp_c2s30 | 0.038 | 5.905 | 54.722 | 39.311 | 0.023 | 0.001 | 0.686 |
Delete response time histogram: each cell has the percentage of responses that take <= the time in the header and max is the max response time in seconds. For the max column values in the top 25% of the range have a red background and in the bottom 25% of the range have a green background. The red background is not used when the min value is within 80% of the max value.
| dbms | 256us | 1ms | 4ms | 16ms | 64ms | 256ms | 1s | 4s | 16s | gt | max |
|---|---|---|---|---|---|---|---|---|---|---|---|
| pg153_o3_native_lto.cx7a_gcp_c2s30 | 54.886 | 1.712 | 2.577 | 9.366 | 20.850 | 10.609 | nonzero | 0.816 | |||
| pg153_o3_native_lto.cx7a1_gcp_c2s30 | 54.821 | 4.193 | 3.317 | 11.016 | 18.357 | 8.296 | 0.001 | 0.427 | |||
| pg153_o3_native_lto.cx7a4_gcp_c2s30 | 54.094 | 1.012 | 2.478 | 9.562 | 29.694 | 3.159 | 0.183 | ||||
| pg153_o3_native_lto.cx7a7_gcp_c2s30 | 49.971 | 2.279 | 2.475 | 9.455 | 16.411 | 19.410 | 0.207 | ||||
| pg153_o3_native_lto.cx7a10_gcp_c2s30 | 50.862 | 1.501 | 3.105 | 9.945 | 21.621 | 12.965 | nonzero | 0.329 | |||
| pg153_o3_native_lto.cx7a12_gcp_c2s30 | 53.302 | 2.096 | 2.432 | 9.574 | 17.951 | 14.645 | nonzero | 0.331 | |||
| pg153_o3_native_lto.cx7a15_gcp_c2s30 | 60.991 | 4.555 | 2.501 | 9.397 | 12.047 | 10.509 | 0.248 | ||||
| pg153_o3_native_lto.cx7a16_gcp_c2s30 | 61.795 | 4.378 | 3.278 | 10.890 | 14.242 | 5.418 | nonzero | 0.311 | |||
| pg153_o3_native_lto.cx7a21_gcp_c2s30 | 60.051 | 9.937 | 3.192 | 12.384 | 11.981 | 2.455 | nonzero | 0.272 | |||
| pg153_o3_native_lto.cx7a22_gcp_c2s30 | 54.146 | 3.742 | 3.838 | 13.039 | 13.904 | 11.330 | nonzero | 0.288 |
Performance metrics for the DBMS listed above. Some are normalized by throughput, others are not. Legend for results is here.
ips	qps	rps	rmbps	wps	wmbps	rpq	rkbpq	wpi	wkbpi	csps	cpups	cspq	cpupq	dbgb1	dbgb2	rss	maxop	p50	p99	tag
11947	0	13748	117.6	18182.3	264.7	1.151	10.078	1.522	22.690	33525	34.3	2.806	431	761.7	806.8	0.1	1.137	3446	1899	4000m.pg153_o3_native_lto.cx7a_gcp_c2s30
13430	0	17018	164.0	22206.2	271.7	1.267	12.503	1.654	20.719	40594	33.1	3.023	370	759.8	802.6	0.1	0.971	699	549	4000m.pg153_o3_native_lto.cx7a1_gcp_c2s30
15909	0	16193	141.0	21681.7	323.9	1.018	9.074	1.363	20.847	40339	39.0	2.536	368	762.5	832.5	0.1	0.606	2647	1398	4000m.pg153_o3_native_lto.cx7a4_gcp_c2s30
11054	0	13761	114.3	24738.4	329.1	1.245	10.591	2.238	30.490	32963	39.7	2.982	539	762.7	778.7	0.0	0.744	649	499	4000m.pg153_o3_native_lto.cx7a7_gcp_c2s30
12586	0	13594	121.7	17750.4	270.3	1.080	9.905	1.410	21.989	33424	37.8	2.656	450	760.8	825.8	0.1	1.021	949	649	4000m.pg153_o3_native_lto.cx7a10_gcp_c2s30
10595	0	12462	114.6	16514.9	248.8	1.176	11.081	1.559	24.051	30357	33.9	2.865	480	762.1	820.2	0.1	1.279	1598	899	4000m.pg153_o3_native_lto.cx7a12_gcp_c2s30
10479	0	13731	115.2	21490.2	296.3	1.310	11.262	2.051	28.959	32909	25.0	3.141	358	761.9	786.9	0.0	1.168	2697	400	4000m.pg153_o3_native_lto.cx7a15_gcp_c2s30
12810	0	17543	182.0	24191.6	356.2	1.369	14.548	1.888	28.473	41889	26.2	3.270	307	761.2	802.6	0.1	17.755	600	499	4000m.pg153_o3_native_lto.cx7a16_gcp_c2s30
17129	0	23897	214.8	29470.7	348.1	1.395	12.841	1.721	20.809	56102	27.7	3.275	243	759.1	829.2	0.1	3.693	2847	1448	4000m.pg153_o3_native_lto.cx7a21_gcp_c2s30
13004	0	16853	160.0	21765.2	312.0	1.296	12.597	1.674	24.572	39921	34.2	3.070	394	761.0	831.1	0.1	0.686	2597	549	4000m.pg153_o3_native_lto.cx7a22_gcp_c2s30
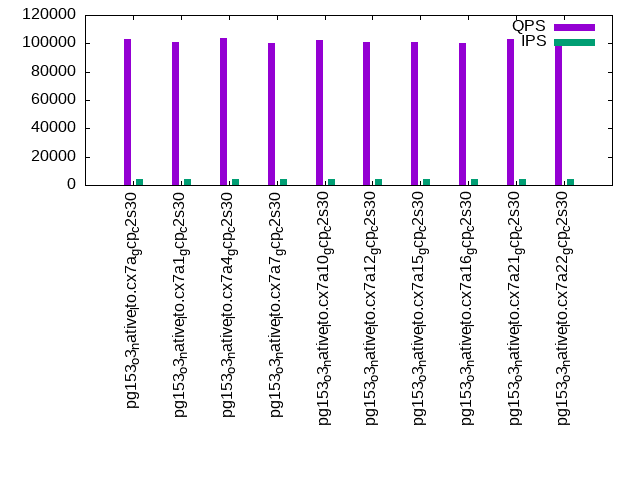
q100.1
q100.1: range queries with 100 insert/s per client. Graphs for performance per 1-second interval are here.
Average throughput:
Query response time histogram: each cell has the percentage of responses that take <= the time in the header and max is the max response time in seconds. For max values in the top 25% of the range have a red background and in the bottom 25% of the range have a green background. The red background is not used when the min value is within 80% of the max value.
| dbms | 256us | 1ms | 4ms | 16ms | 64ms | 256ms | 1s | 4s | 16s | gt | max |
|---|---|---|---|---|---|---|---|---|---|---|---|
| pg153_o3_native_lto.cx7a_gcp_c2s30 | 99.910 | 0.090 | 0.001 | nonzero | nonzero | nonzero | 0.157 | ||||
| pg153_o3_native_lto.cx7a1_gcp_c2s30 | 99.877 | 0.122 | 0.001 | nonzero | nonzero | nonzero | 0.123 | ||||
| pg153_o3_native_lto.cx7a4_gcp_c2s30 | 99.898 | 0.101 | 0.001 | nonzero | nonzero | nonzero | 0.157 | ||||
| pg153_o3_native_lto.cx7a7_gcp_c2s30 | 99.914 | 0.086 | nonzero | nonzero | nonzero | nonzero | 0.117 | ||||
| pg153_o3_native_lto.cx7a10_gcp_c2s30 | 99.910 | 0.090 | 0.001 | nonzero | nonzero | nonzero | 0.086 | ||||
| pg153_o3_native_lto.cx7a12_gcp_c2s30 | 99.862 | 0.137 | 0.001 | nonzero | nonzero | nonzero | 0.134 | ||||
| pg153_o3_native_lto.cx7a15_gcp_c2s30 | 99.911 | 0.088 | 0.001 | nonzero | nonzero | nonzero | 0.170 | ||||
| pg153_o3_native_lto.cx7a16_gcp_c2s30 | 99.856 | 0.143 | 0.001 | nonzero | nonzero | nonzero | 0.197 | ||||
| pg153_o3_native_lto.cx7a21_gcp_c2s30 | 99.906 | 0.093 | 0.001 | nonzero | nonzero | nonzero | 0.102 | ||||
| pg153_o3_native_lto.cx7a22_gcp_c2s30 | 99.820 | 0.177 | 0.002 | nonzero | nonzero | nonzero | 0.078 |
Insert response time histogram: each cell has the percentage of responses that take <= the time in the header and max is the max response time in seconds. For max values in the top 25% of the range have a red background and in the bottom 25% of the range have a green background. The red background is not used when the min value is within 80% of the max value.
| dbms | 256us | 1ms | 4ms | 16ms | 64ms | 256ms | 1s | 4s | 16s | gt | max |
|---|---|---|---|---|---|---|---|---|---|---|---|
| pg153_o3_native_lto.cx7a_gcp_c2s30 | 35.391 | 64.599 | 0.009 | 0.002 | 0.263 | ||||||
| pg153_o3_native_lto.cx7a1_gcp_c2s30 | 0.073 | 25.618 | 74.299 | 0.010 | 0.255 | ||||||
| pg153_o3_native_lto.cx7a4_gcp_c2s30 | 1.332 | 27.950 | 70.705 | 0.014 | 0.170 | ||||||
| pg153_o3_native_lto.cx7a7_gcp_c2s30 | 0.002 | 40.198 | 59.799 | 0.002 | 0.083 | ||||||
| pg153_o3_native_lto.cx7a10_gcp_c2s30 | 0.016 | 37.177 | 62.785 | 0.021 | 0.002 | 0.259 | |||||
| pg153_o3_native_lto.cx7a12_gcp_c2s30 | 45.799 | 54.160 | 0.040 | 0.002 | 0.308 | ||||||
| pg153_o3_native_lto.cx7a15_gcp_c2s30 | 0.003 | 38.189 | 61.792 | 0.014 | 0.002 | 0.410 | |||||
| pg153_o3_native_lto.cx7a16_gcp_c2s30 | 0.172 | 34.352 | 65.453 | 0.021 | 0.002 | 0.262 | |||||
| pg153_o3_native_lto.cx7a21_gcp_c2s30 | 0.007 | 22.477 | 77.503 | 0.012 | 0.211 | ||||||
| pg153_o3_native_lto.cx7a22_gcp_c2s30 | 0.056 | 38.755 | 61.161 | 0.024 | 0.003 | 0.304 |
Delete response time histogram: each cell has the percentage of responses that take <= the time in the header and max is the max response time in seconds. For max values in the top 25% of the range have a red background and in the bottom 25% of the range have a green background. The red background is not used when the min value is within 80% of the max value.
| dbms | 256us | 1ms | 4ms | 16ms | 64ms | 256ms | 1s | 4s | 16s | gt | max |
|---|---|---|---|---|---|---|---|---|---|---|---|
| pg153_o3_native_lto.cx7a_gcp_c2s30 | 70.347 | 22.510 | 7.139 | 0.003 | 0.015 | ||||||
| pg153_o3_native_lto.cx7a1_gcp_c2s30 | 60.957 | 32.113 | 6.929 | 0.002 | 0.004 | ||||||
| pg153_o3_native_lto.cx7a4_gcp_c2s30 | 79.064 | 20.776 | 0.153 | 0.007 | 0.015 | ||||||
| pg153_o3_native_lto.cx7a7_gcp_c2s30 | 73.307 | 19.512 | 7.172 | 0.009 | 0.016 | ||||||
| pg153_o3_native_lto.cx7a10_gcp_c2s30 | 81.691 | 18.135 | 0.170 | 0.003 | 0.015 | ||||||
| pg153_o3_native_lto.cx7a12_gcp_c2s30 | 80.365 | 19.457 | 0.177 | 0.002 | 0.012 | ||||||
| pg153_o3_native_lto.cx7a15_gcp_c2s30 | 61.297 | 24.910 | 13.790 | 0.003 | 0.012 | ||||||
| pg153_o3_native_lto.cx7a16_gcp_c2s30 | 70.307 | 22.743 | 6.948 | 0.002 | 0.004 | ||||||
| pg153_o3_native_lto.cx7a21_gcp_c2s30 | 45.812 | 31.745 | 22.429 | 0.009 | 0.005 | 0.036 | |||||
| pg153_o3_native_lto.cx7a22_gcp_c2s30 | 49.384 | 21.656 | 7.061 | 7.160 | 14.740 | 0.030 |
Performance metrics for the DBMS listed above. Some are normalized by throughput, others are not. Legend for results is here.
ips	qps	rps	rmbps	wps	wmbps	rpq	rkbpq	wpi	wkbpi	csps	cpups	cspq	cpupq	dbgb1	dbgb2	rss	maxop	p50	p99	tag
797	111723	1555	14.2	2566.2	35.4	0.014	0.130	3.219	45.484	428884	53.0	3.839	71	761.7	795.4	0.0	0.157	13985	10580	4000m.pg153_o3_native_lto.cx7a_gcp_c2s30
797	110114	1602	15.1	2645.5	33.4	0.015	0.140	3.318	42.855	422825	53.0	3.840	72	759.9	798.0	0.0	0.123	13825	13015	4000m.pg153_o3_native_lto.cx7a1_gcp_c2s30
797	111620	1569	14.5	1166.6	19.6	0.014	0.133	1.463	25.127	428001	52.8	3.834	71	762.5	832.6	0.0	0.157	13942	10021	4000m.pg153_o3_native_lto.cx7a4_gcp_c2s30
798	110928	1532	14.0	2540.5	34.0	0.014	0.129	3.186	43.713	425746	52.9	3.838	72	762.7	775.6	0.0	0.117	14160	12019	4000m.pg153_o3_native_lto.cx7a7_gcp_c2s30
797	111521	1563	14.3	2562.9	34.0	0.014	0.132	3.214	43.642	428180	53.0	3.839	71	761.0	801.3	0.0	0.086	14080	9721	4000m.pg153_o3_native_lto.cx7a10_gcp_c2s30
797	110339	1651	15.0	2588.9	35.3	0.015	0.139	3.247	45.395	423863	52.9	3.841	72	762.1	794.1	0.0	0.134	13969	4923	4000m.pg153_o3_native_lto.cx7a12_gcp_c2s30
797	110841	1562	14.4	2559.7	34.4	0.014	0.133	3.210	44.213	425562	53.0	3.839	72	762.0	780.7	0.0	0.170	13857	9733	4000m.pg153_o3_native_lto.cx7a15_gcp_c2s30
797	110068	1586	14.5	2646.1	36.3	0.014	0.135	3.319	46.619	422892	52.9	3.842	72	761.2	794.3	0.0	0.197	13921	11763	4000m.pg153_o3_native_lto.cx7a16_gcp_c2s30
797	110845	1527	14.0	1344.9	18.1	0.014	0.129	1.687	23.298	424858	52.9	3.833	72	759.2	829.3	0.0	0.102	14001	9689	4000m.pg153_o3_native_lto.cx7a21_gcp_c2s30
797	110148	1672	15.6	1327.5	20.5	0.015	0.145	1.665	26.369	422501	53.2	3.836	72	761.0	831.1	0.0	0.078	13761	4379	4000m.pg153_o3_native_lto.cx7a22_gcp_c2s30
q500.1
q500.1: range queries with 500 insert/s per client. Graphs for performance per 1-second interval are here.
Average throughput:
Query response time histogram: each cell has the percentage of responses that take <= the time in the header and max is the max response time in seconds. For max values in the top 25% of the range have a red background and in the bottom 25% of the range have a green background. The red background is not used when the min value is within 80% of the max value.
| dbms | 256us | 1ms | 4ms | 16ms | 64ms | 256ms | 1s | 4s | 16s | gt | max |
|---|---|---|---|---|---|---|---|---|---|---|---|
| pg153_o3_native_lto.cx7a_gcp_c2s30 | 99.929 | 0.069 | 0.002 | nonzero | nonzero | 0.042 | |||||
| pg153_o3_native_lto.cx7a1_gcp_c2s30 | 99.921 | 0.078 | 0.002 | nonzero | nonzero | 0.029 | |||||
| pg153_o3_native_lto.cx7a4_gcp_c2s30 | 99.931 | 0.067 | 0.001 | nonzero | nonzero | 0.022 | |||||
| pg153_o3_native_lto.cx7a7_gcp_c2s30 | 99.925 | 0.074 | 0.001 | nonzero | nonzero | 0.026 | |||||
| pg153_o3_native_lto.cx7a10_gcp_c2s30 | 99.935 | 0.064 | 0.001 | nonzero | nonzero | 0.041 | |||||
| pg153_o3_native_lto.cx7a12_gcp_c2s30 | 99.926 | 0.072 | 0.002 | nonzero | 0.016 | ||||||
| pg153_o3_native_lto.cx7a15_gcp_c2s30 | 99.906 | 0.092 | 0.002 | nonzero | nonzero | nonzero | 0.082 | ||||
| pg153_o3_native_lto.cx7a16_gcp_c2s30 | 99.928 | 0.070 | 0.002 | nonzero | nonzero | 0.040 | |||||
| pg153_o3_native_lto.cx7a21_gcp_c2s30 | 99.858 | 0.138 | 0.004 | nonzero | nonzero | 0.024 | |||||
| pg153_o3_native_lto.cx7a22_gcp_c2s30 | 99.925 | 0.073 | 0.002 | nonzero | nonzero | 0.025 |
Insert response time histogram: each cell has the percentage of responses that take <= the time in the header and max is the max response time in seconds. For max values in the top 25% of the range have a red background and in the bottom 25% of the range have a green background. The red background is not used when the min value is within 80% of the max value.
| dbms | 256us | 1ms | 4ms | 16ms | 64ms | 256ms | 1s | 4s | 16s | gt | max |
|---|---|---|---|---|---|---|---|---|---|---|---|
| pg153_o3_native_lto.cx7a_gcp_c2s30 | 28.537 | 71.452 | 0.010 | 0.106 | |||||||
| pg153_o3_native_lto.cx7a1_gcp_c2s30 | 14.172 | 85.819 | 0.009 | 0.092 | |||||||
| pg153_o3_native_lto.cx7a4_gcp_c2s30 | 19.164 | 80.830 | 0.007 | 0.101 | |||||||
| pg153_o3_native_lto.cx7a7_gcp_c2s30 | 15.943 | 84.050 | 0.007 | 0.094 | |||||||
| pg153_o3_native_lto.cx7a10_gcp_c2s30 | 16.150 | 83.847 | 0.003 | 0.092 | |||||||
| pg153_o3_native_lto.cx7a12_gcp_c2s30 | 19.960 | 80.037 | 0.002 | 0.094 | |||||||
| pg153_o3_native_lto.cx7a15_gcp_c2s30 | 14.134 | 85.817 | 0.048 | 0.113 | |||||||
| pg153_o3_native_lto.cx7a16_gcp_c2s30 | 13.792 | 86.202 | 0.006 | 0.079 | |||||||
| pg153_o3_native_lto.cx7a21_gcp_c2s30 | 12.695 | 87.301 | 0.004 | 0.136 | |||||||
| pg153_o3_native_lto.cx7a22_gcp_c2s30 | 29.830 | 70.165 | 0.005 | 0.089 |
Delete response time histogram: each cell has the percentage of responses that take <= the time in the header and max is the max response time in seconds. For max values in the top 25% of the range have a red background and in the bottom 25% of the range have a green background. The red background is not used when the min value is within 80% of the max value.
| dbms | 256us | 1ms | 4ms | 16ms | 64ms | 256ms | 1s | 4s | 16s | gt | max |
|---|---|---|---|---|---|---|---|---|---|---|---|
| pg153_o3_native_lto.cx7a_gcp_c2s30 | 83.318 | 4.017 | 3.196 | 9.466 | 0.003 | 0.043 | |||||
| pg153_o3_native_lto.cx7a1_gcp_c2s30 | 82.148 | 5.214 | 3.254 | 9.384 | 0.001 | 0.020 | |||||
| pg153_o3_native_lto.cx7a4_gcp_c2s30 | 94.761 | 5.042 | 0.189 | 0.007 | 0.015 | ||||||
| pg153_o3_native_lto.cx7a7_gcp_c2s30 | 83.757 | 3.578 | 3.241 | 9.422 | 0.001 | 0.028 | |||||
| pg153_o3_native_lto.cx7a10_gcp_c2s30 | 94.670 | 5.151 | 0.170 | 0.009 | 0.015 | ||||||
| pg153_o3_native_lto.cx7a12_gcp_c2s30 | 83.275 | 5.794 | 1.182 | 9.748 | 0.001 | 0.025 | |||||
| pg153_o3_native_lto.cx7a15_gcp_c2s30 | 71.183 | 3.678 | 5.804 | 19.323 | 0.013 | 0.056 | |||||
| pg153_o3_native_lto.cx7a16_gcp_c2s30 | 82.297 | 5.081 | 3.216 | 9.405 | 0.001 | 0.024 | |||||
| pg153_o3_native_lto.cx7a21_gcp_c2s30 | 42.552 | 6.845 | 8.195 | 42.070 | 0.338 | 0.037 | |||||
| pg153_o3_native_lto.cx7a22_gcp_c2s30 | 80.996 | 4.947 | 3.163 | 9.476 | 1.418 | 0.031 |
Performance metrics for the DBMS listed above. Some are normalized by throughput, others are not. Legend for results is here.
ips	qps	rps	rmbps	wps	wmbps	rpq	rkbpq	wpi	wkbpi	csps	cpups	cspq	cpupq	dbgb1	dbgb2	rss	maxop	p50	p99	tag
3988	103156	5814	47.3	8813.5	120.9	0.056	0.469	2.210	31.046	404597	56.0	3.922	81	762.2	803.1	0.0	0.042	12840	12163	4000m.pg153_o3_native_lto.cx7a_gcp_c2s30
3987	100699	5835	47.8	8773.8	103.8	0.058	0.486	2.201	26.667	394256	56.4	3.915	84	760.3	788.5	0.0	0.029	12450	12083	4000m.pg153_o3_native_lto.cx7a1_gcp_c2s30
3987	103542	5809	47.4	8133.7	106.4	0.056	0.469	2.040	27.331	405792	55.6	3.919	81	762.8	832.9	0.0	0.022	12898	12514	4000m.pg153_o3_native_lto.cx7a4_gcp_c2s30
3987	100181	5810	47.2	11873.3	147.3	0.058	0.483	2.978	37.827	395027	56.2	3.943	84	763.1	779.1	0.0	0.026	12471	12178	4000m.pg153_o3_native_lto.cx7a7_gcp_c2s30
3987	102652	5811	47.3	8835.1	120.1	0.057	0.472	2.216	30.848	403503	55.5	3.931	81	761.5	802.5	0.0	0.041	12855	12450	4000m.pg153_o3_native_lto.cx7a10_gcp_c2s30
3987	101064	5836	47.4	8841.4	121.4	0.058	0.481	2.218	31.174	396830	56.0	3.927	83	762.3	803.4	0.0	0.016	12647	12216	4000m.pg153_o3_native_lto.cx7a12_gcp_c2s30
3987	101041	5811	47.1	9645.1	129.4	0.058	0.477	2.419	33.240	395810	56.4	3.917	84	762.4	794.4	0.0	0.082	12546	11907	4000m.pg153_o3_native_lto.cx7a15_gcp_c2s30
3988	100490	5835	47.5	8818.6	120.9	0.058	0.484	2.211	31.044	394757	56.1	3.928	84	761.4	802.6	0.0	0.040	12354	11848	4000m.pg153_o3_native_lto.cx7a16_gcp_c2s30
3987	102795	5849	48.0	7463.8	84.6	0.057	0.478	1.872	21.731	394426	57.2	3.837	83	759.8	829.9	0.0	0.024	12818	12386	4000m.pg153_o3_native_lto.cx7a21_gcp_c2s30
3987	101045	5853	47.8	8105.5	106.6	0.058	0.485	2.033	27.374	395584	56.1	3.915	83	761.3	831.3	0.0	0.025	12647	12247	4000m.pg153_o3_native_lto.cx7a22_gcp_c2s30
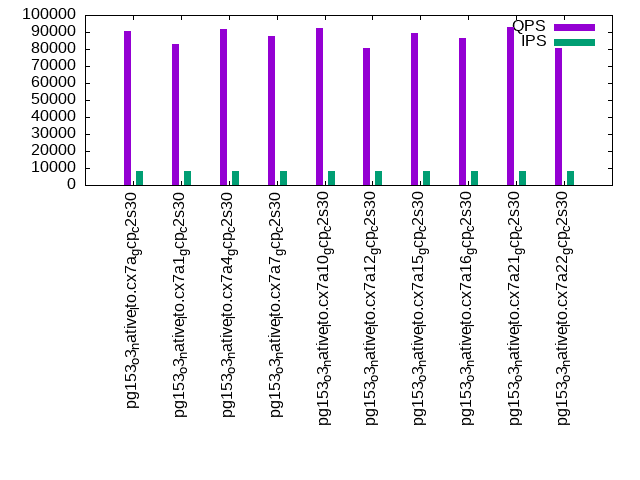
q1000.1
q1000.1: range queries with 1000 insert/s per client. Graphs for performance per 1-second interval are here.
Average throughput:
Query response time histogram: each cell has the percentage of responses that take <= the time in the header and max is the max response time in seconds. For max values in the top 25% of the range have a red background and in the bottom 25% of the range have a green background. The red background is not used when the min value is within 80% of the max value.
| dbms | 256us | 1ms | 4ms | 16ms | 64ms | 256ms | 1s | 4s | 16s | gt | max |
|---|---|---|---|---|---|---|---|---|---|---|---|
| pg153_o3_native_lto.cx7a_gcp_c2s30 | 99.756 | 0.239 | 0.004 | 0.001 | nonzero | 0.048 | |||||
| pg153_o3_native_lto.cx7a1_gcp_c2s30 | 99.804 | 0.191 | 0.005 | 0.001 | nonzero | nonzero | 0.074 | ||||
| pg153_o3_native_lto.cx7a4_gcp_c2s30 | 99.775 | 0.221 | 0.003 | nonzero | nonzero | 0.064 | |||||
| pg153_o3_native_lto.cx7a7_gcp_c2s30 | 99.805 | 0.193 | 0.001 | nonzero | nonzero | nonzero | 0.066 | ||||
| pg153_o3_native_lto.cx7a10_gcp_c2s30 | 99.787 | 0.209 | 0.003 | 0.001 | nonzero | nonzero | 0.072 | ||||
| pg153_o3_native_lto.cx7a12_gcp_c2s30 | 99.789 | 0.204 | 0.005 | 0.001 | nonzero | 0.064 | |||||
| pg153_o3_native_lto.cx7a15_gcp_c2s30 | 99.661 | 0.333 | 0.005 | 0.001 | nonzero | nonzero | 0.090 | ||||
| pg153_o3_native_lto.cx7a16_gcp_c2s30 | 99.705 | 0.287 | 0.007 | 0.001 | nonzero | 0.053 | |||||
| pg153_o3_native_lto.cx7a21_gcp_c2s30 | 99.706 | 0.284 | 0.008 | 0.001 | nonzero | 0.050 | |||||
| pg153_o3_native_lto.cx7a22_gcp_c2s30 | 99.816 | 0.179 | 0.004 | 0.001 | nonzero | nonzero | 0.087 |
Insert response time histogram: each cell has the percentage of responses that take <= the time in the header and max is the max response time in seconds. For max values in the top 25% of the range have a red background and in the bottom 25% of the range have a green background. The red background is not used when the min value is within 80% of the max value.
| dbms | 256us | 1ms | 4ms | 16ms | 64ms | 256ms | 1s | 4s | 16s | gt | max |
|---|---|---|---|---|---|---|---|---|---|---|---|
| pg153_o3_native_lto.cx7a_gcp_c2s30 | 24.313 | 75.674 | 0.013 | 0.120 | |||||||
| pg153_o3_native_lto.cx7a1_gcp_c2s30 | 20.803 | 78.928 | 0.268 | 0.001 | 0.465 | ||||||
| pg153_o3_native_lto.cx7a4_gcp_c2s30 | 13.840 | 86.148 | 0.013 | 0.178 | |||||||
| pg153_o3_native_lto.cx7a7_gcp_c2s30 | 13.596 | 86.315 | 0.089 | 0.216 | |||||||
| pg153_o3_native_lto.cx7a10_gcp_c2s30 | 9.973 | 89.992 | 0.035 | 0.116 | |||||||
| pg153_o3_native_lto.cx7a12_gcp_c2s30 | 41.337 | 58.523 | 0.139 | 0.001 | 0.328 | ||||||
| pg153_o3_native_lto.cx7a15_gcp_c2s30 | 10.365 | 89.565 | 0.070 | 0.199 | |||||||
| pg153_o3_native_lto.cx7a16_gcp_c2s30 | 24.514 | 75.341 | 0.145 | nonzero | 0.260 | ||||||
| pg153_o3_native_lto.cx7a21_gcp_c2s30 | 16.615 | 83.283 | 0.101 | 0.245 | |||||||
| pg153_o3_native_lto.cx7a22_gcp_c2s30 | 42.934 | 56.915 | 0.150 | 0.001 | 0.262 |
Delete response time histogram: each cell has the percentage of responses that take <= the time in the header and max is the max response time in seconds. For max values in the top 25% of the range have a red background and in the bottom 25% of the range have a green background. The red background is not used when the min value is within 80% of the max value.
| dbms | 256us | 1ms | 4ms | 16ms | 64ms | 256ms | 1s | 4s | 16s | gt | max |
|---|---|---|---|---|---|---|---|---|---|---|---|
| pg153_o3_native_lto.cx7a_gcp_c2s30 | 83.005 | 7.974 | 0.139 | 1.796 | 7.085 | 0.063 | |||||
| pg153_o3_native_lto.cx7a1_gcp_c2s30 | 83.548 | 12.228 | 0.166 | 1.236 | 2.822 | 0.057 | |||||
| pg153_o3_native_lto.cx7a4_gcp_c2s30 | 86.660 | 10.516 | 0.150 | 0.022 | 2.653 | nonzero | 0.082 | ||||
| pg153_o3_native_lto.cx7a7_gcp_c2s30 | 89.976 | 9.461 | 0.151 | 0.411 | 0.002 | 0.022 | |||||
| pg153_o3_native_lto.cx7a10_gcp_c2s30 | 86.886 | 12.935 | 0.151 | 0.025 | 0.002 | 0.064 | |||||
| pg153_o3_native_lto.cx7a12_gcp_c2s30 | 79.431 | 8.722 | 0.132 | 1.559 | 10.156 | 0.060 | |||||
| pg153_o3_native_lto.cx7a15_gcp_c2s30 | 59.510 | 14.273 | 0.162 | 3.068 | 22.985 | 0.002 | 0.099 | ||||
| pg153_o3_native_lto.cx7a16_gcp_c2s30 | 59.636 | 9.691 | 0.123 | 1.856 | 28.694 | 0.055 | |||||
| pg153_o3_native_lto.cx7a21_gcp_c2s30 | 38.143 | 14.567 | 0.118 | 4.581 | 42.590 | 0.001 | 0.073 | ||||
| pg153_o3_native_lto.cx7a22_gcp_c2s30 | 80.173 | 8.534 | 0.125 | 1.638 | 9.530 | 0.058 |
Performance metrics for the DBMS listed above. Some are normalized by throughput, others are not. Legend for results is here.
ips	qps	rps	rmbps	wps	wmbps	rpq	rkbpq	wpi	wkbpi	csps	cpups	cspq	cpupq	dbgb1	dbgb2	rss	maxop	p50	p99	tag
7976	90694	11736	95.3	16368.1	222.3	0.129	1.076	2.052	28.542	363304	60.4	4.006	100	763.8	833.9	0.0	0.048	11379	10708	4000m.pg153_o3_native_lto.cx7a_gcp_c2s30
7973	82821	11905	116.6	16800.9	208.4	0.144	1.442	2.107	26.766	335061	61.0	4.046	110	761.7	821.1	0.1	0.074	10389	9349	4000m.pg153_o3_native_lto.cx7a1_gcp_c2s30
7976	91871	11738	95.4	16617.8	217.1	0.128	1.064	2.084	27.870	370318	59.4	4.031	97	764.2	834.2	0.0	0.064	11523	10516	4000m.pg153_o3_native_lto.cx7a4_gcp_c2s30
7978	87861	11700	94.5	24269.1	299.5	0.133	1.101	3.042	38.445	361410	59.4	4.113	101	764.7	780.7	0.0	0.066	11001	10708	4000m.pg153_o3_native_lto.cx7a7_gcp_c2s30
7976	92298	11726	95.1	16483.5	224.2	0.127	1.056	2.067	28.783	373946	58.7	4.051	95	763.2	833.3	0.0	0.072	11619	10804	4000m.pg153_o3_native_lto.cx7a10_gcp_c2s30
7976	80797	11819	105.4	16806.9	231.1	0.146	1.336	2.107	29.673	328182	61.5	4.062	114	763.3	833.4	0.1	0.064	10117	9509	4000m.pg153_o3_native_lto.cx7a12_gcp_c2s30
7976	89143	11745	95.1	20255.6	261.0	0.132	1.092	2.540	33.504	332888	64.2	3.734	108	764.0	796.1	0.0	0.090	11028	9637	4000m.pg153_o3_native_lto.cx7a15_gcp_c2s30
7973	86253	11844	106.9	16872.6	231.3	0.137	1.269	2.116	29.709	318488	65.5	3.692	114	762.1	832.2	0.1	0.053	10692	9605	4000m.pg153_o3_native_lto.cx7a16_gcp_c2s30
7976	92676	11882	106.5	16023.0	182.0	0.128	1.177	2.009	23.368	310967	68.8	3.355	111	761.4	831.5	0.1	0.050	11891	9510	4000m.pg153_o3_native_lto.cx7a21_gcp_c2s30
7973	80552	11846	106.9	16992.1	226.2	0.147	1.359	2.131	29.053	328444	61.5	4.077	115	761.9	832.0	0.1	0.087	10069	9418	4000m.pg153_o3_native_lto.cx7a22_gcp_c2s30
l.i0
l.i0: load without secondary indexes
Performance metrics for all DBMS, not just the ones listed above. Some are normalized by throughput, others are not. Legend for results is here.
ips	qps	rps	rmbps	wps	wmbps	rpq	rkbpq	wpi	wkbpi	csps	cpups	cspq	cpupq	dbgb1	dbgb2	rss	maxop	p50	p99	tag
1102232	0	567	4.8	1563.3	306.4	0.001	0.004	0.001	0.285	91674	81.9	0.083	11	382.7	452.8	0.0	0.770	145142	42653	4000m.pg153_o3_native_lto.cx7a_gcp_c2s30
1105889	0	569	4.9	1523.1	281.6	0.001	0.005	0.001	0.261	90062	83.7	0.081	11	382.7	452.8	0.0	0.856	144441	53141	4000m.pg153_o3_native_lto.cx7a1_gcp_c2s30
1095890	0	556	5.3	1568.2	307.3	0.001	0.005	0.001	0.287	90019	82.7	0.082	11	382.7	452.8	0.0	0.727	144135	48169	4000m.pg153_o3_native_lto.cx7a4_gcp_c2s30
1103448	0	563	4.8	1705.3	324.4	0.001	0.004	0.002	0.301	92328	83.4	0.084	11	382.7	398.8	0.0	0.493	143744	62731	4000m.pg153_o3_native_lto.cx7a7_gcp_c2s30
1101322	0	557	5.0	1587.7	303.4	0.001	0.005	0.001	0.282	90605	83.2	0.082	11	382.7	452.8	0.0	0.678	144043	52449	4000m.pg153_o3_native_lto.cx7a10_gcp_c2s30
1118256	0	574	4.5	1536.3	311.5	0.001	0.004	0.001	0.285	90930	84.8	0.081	11	382.7	452.8	0.0	0.585	143598	68425	4000m.pg153_o3_native_lto.cx7a12_gcp_c2s30
1098901	0	561	5.1	1631.5	314.5	0.001	0.005	0.001	0.293	90239	83.6	0.082	11	382.7	414.8	0.0	0.566	143045	58336	4000m.pg153_o3_native_lto.cx7a15_gcp_c2s30
1111111	0	557	4.4	1375.7	266.8	0.001	0.004	0.001	0.246	91091	83.7	0.082	11	382.7	452.8	0.0	0.758	144642	56238	4000m.pg153_o3_native_lto.cx7a16_gcp_c2s30
1104362	0	557	4.4	1344.0	251.1	0.001	0.004	0.001	0.233	91843	83.4	0.083	11	382.7	452.8	0.0	1.007	143143	55639	4000m.pg153_o3_native_lto.cx7a21_gcp_c2s30
1105583	0	556	4.4	1384.3	264.4	0.001	0.004	0.001	0.245	90419	83.9	0.082	11	382.7	452.8	0.0	5.617	143445	55140	4000m.pg153_o3_native_lto.cx7a22_gcp_c2s30
l.x
l.x: create secondary indexes
Performance metrics for all DBMS, not just the ones listed above. Some are normalized by throughput, others are not. Legend for results is here.
ips	qps	rps	rmbps	wps	wmbps	rpq	rkbpq	wpi	wkbpi	csps	cpups	cspq	cpupq	dbgb1	dbgb2	rss	maxop	p50	p99	tag
1335147	0	6304	916.2	1257.1	271.7	0.005	0.703	0.001	0.208	21602	30.9	0.016	3	735.2	802.4	0.1	0.002	NA	NA	4000m.pg153_o3_native_lto.cx7a_gcp_c2s30
1439921	0	6253	897.5	1267.7	275.3	0.004	0.638	0.001	0.196	7577	34.3	0.005	4	735.2	801.5	0.1	0.027	NA	NA	4000m.pg153_o3_native_lto.cx7a1_gcp_c2s30
1298312	0	6373	917.3	1235.8	267.2	0.005	0.723	0.001	0.211	20638	31.1	0.016	4	735.2	805.2	0.1	0.002	NA	NA	4000m.pg153_o3_native_lto.cx7a4_gcp_c2s30
1439403	0	6027	837.0	1361.4	300.5	0.004	0.595	0.001	0.214	23102	33.7	0.016	4	735.2	751.2	0.1	0.002	NA	NA	4000m.pg153_o3_native_lto.cx7a7_gcp_c2s30
1389889	0	6446	870.8	1348.4	293.0	0.005	0.642	0.001	0.216	21832	32.9	0.016	4	735.2	803.1	0.0	0.002	NA	NA	4000m.pg153_o3_native_lto.cx7a10_gcp_c2s30
1409975	0	6131	867.7	1365.2	295.8	0.004	0.630	0.001	0.215	22239	33.4	0.016	4	735.2	802.6	0.1	0.002	NA	NA	4000m.pg153_o3_native_lto.cx7a12_gcp_c2s30
1332035	0	6366	886.1	1281.8	278.6	0.005	0.681	0.001	0.214	20674	31.8	0.016	4	735.2	767.2	0.1	0.030	NA	NA	4000m.pg153_o3_native_lto.cx7a15_gcp_c2s30
1361504	0	6022	879.1	1247.1	270.2	0.004	0.661	0.001	0.203	20683	32.3	0.015	4	735.2	801.4	0.1	0.002	NA	NA	4000m.pg153_o3_native_lto.cx7a16_gcp_c2s30
1390372	0	6206	904.9	1143.8	251.0	0.004	0.666	0.001	0.185	6875	33.3	0.005	4	735.2	805.2	0.1	0.002	NA	NA	4000m.pg153_o3_native_lto.cx7a21_gcp_c2s30
1321910	0	6010	904.1	1206.6	263.6	0.005	0.700	0.001	0.204	19764	31.4	0.015	4	735.2	805.2	0.1	0.002	NA	NA	4000m.pg153_o3_native_lto.cx7a22_gcp_c2s30
l.i1
l.i1: continue load after secondary indexes created
Performance metrics for all DBMS, not just the ones listed above. Some are normalized by throughput, others are not. Legend for results is here.
ips	qps	rps	rmbps	wps	wmbps	rpq	rkbpq	wpi	wkbpi	csps	cpups	cspq	cpupq	dbgb1	dbgb2	rss	maxop	p50	p99	tag
11947	0	13748	117.6	18182.3	264.7	1.151	10.078	1.522	22.690	33525	34.3	2.806	431	761.7	806.8	0.1	1.137	3446	1899	4000m.pg153_o3_native_lto.cx7a_gcp_c2s30
13430	0	17018	164.0	22206.2	271.7	1.267	12.503	1.654	20.719	40594	33.1	3.023	370	759.8	802.6	0.1	0.971	699	549	4000m.pg153_o3_native_lto.cx7a1_gcp_c2s30
15909	0	16193	141.0	21681.7	323.9	1.018	9.074	1.363	20.847	40339	39.0	2.536	368	762.5	832.5	0.1	0.606	2647	1398	4000m.pg153_o3_native_lto.cx7a4_gcp_c2s30
11054	0	13761	114.3	24738.4	329.1	1.245	10.591	2.238	30.490	32963	39.7	2.982	539	762.7	778.7	0.0	0.744	649	499	4000m.pg153_o3_native_lto.cx7a7_gcp_c2s30
12586	0	13594	121.7	17750.4	270.3	1.080	9.905	1.410	21.989	33424	37.8	2.656	450	760.8	825.8	0.1	1.021	949	649	4000m.pg153_o3_native_lto.cx7a10_gcp_c2s30
10595	0	12462	114.6	16514.9	248.8	1.176	11.081	1.559	24.051	30357	33.9	2.865	480	762.1	820.2	0.1	1.279	1598	899	4000m.pg153_o3_native_lto.cx7a12_gcp_c2s30
10479	0	13731	115.2	21490.2	296.3	1.310	11.262	2.051	28.959	32909	25.0	3.141	358	761.9	786.9	0.0	1.168	2697	400	4000m.pg153_o3_native_lto.cx7a15_gcp_c2s30
12810	0	17543	182.0	24191.6	356.2	1.369	14.548	1.888	28.473	41889	26.2	3.270	307	761.2	802.6	0.1	17.755	600	499	4000m.pg153_o3_native_lto.cx7a16_gcp_c2s30
17129	0	23897	214.8	29470.7	348.1	1.395	12.841	1.721	20.809	56102	27.7	3.275	243	759.1	829.2	0.1	3.693	2847	1448	4000m.pg153_o3_native_lto.cx7a21_gcp_c2s30
13004	0	16853	160.0	21765.2	312.0	1.296	12.597	1.674	24.572	39921	34.2	3.070	394	761.0	831.1	0.1	0.686	2597	549	4000m.pg153_o3_native_lto.cx7a22_gcp_c2s30
q100.1
q100.1: range queries with 100 insert/s per client
Performance metrics for all DBMS, not just the ones listed above. Some are normalized by throughput, others are not. Legend for results is here.
ips	qps	rps	rmbps	wps	wmbps	rpq	rkbpq	wpi	wkbpi	csps	cpups	cspq	cpupq	dbgb1	dbgb2	rss	maxop	p50	p99	tag
797	111723	1555	14.2	2566.2	35.4	0.014	0.130	3.219	45.484	428884	53.0	3.839	71	761.7	795.4	0.0	0.157	13985	10580	4000m.pg153_o3_native_lto.cx7a_gcp_c2s30
797	110114	1602	15.1	2645.5	33.4	0.015	0.140	3.318	42.855	422825	53.0	3.840	72	759.9	798.0	0.0	0.123	13825	13015	4000m.pg153_o3_native_lto.cx7a1_gcp_c2s30
797	111620	1569	14.5	1166.6	19.6	0.014	0.133	1.463	25.127	428001	52.8	3.834	71	762.5	832.6	0.0	0.157	13942	10021	4000m.pg153_o3_native_lto.cx7a4_gcp_c2s30
798	110928	1532	14.0	2540.5	34.0	0.014	0.129	3.186	43.713	425746	52.9	3.838	72	762.7	775.6	0.0	0.117	14160	12019	4000m.pg153_o3_native_lto.cx7a7_gcp_c2s30
797	111521	1563	14.3	2562.9	34.0	0.014	0.132	3.214	43.642	428180	53.0	3.839	71	761.0	801.3	0.0	0.086	14080	9721	4000m.pg153_o3_native_lto.cx7a10_gcp_c2s30
797	110339	1651	15.0	2588.9	35.3	0.015	0.139	3.247	45.395	423863	52.9	3.841	72	762.1	794.1	0.0	0.134	13969	4923	4000m.pg153_o3_native_lto.cx7a12_gcp_c2s30
797	110841	1562	14.4	2559.7	34.4	0.014	0.133	3.210	44.213	425562	53.0	3.839	72	762.0	780.7	0.0	0.170	13857	9733	4000m.pg153_o3_native_lto.cx7a15_gcp_c2s30
797	110068	1586	14.5	2646.1	36.3	0.014	0.135	3.319	46.619	422892	52.9	3.842	72	761.2	794.3	0.0	0.197	13921	11763	4000m.pg153_o3_native_lto.cx7a16_gcp_c2s30
797	110845	1527	14.0	1344.9	18.1	0.014	0.129	1.687	23.298	424858	52.9	3.833	72	759.2	829.3	0.0	0.102	14001	9689	4000m.pg153_o3_native_lto.cx7a21_gcp_c2s30
797	110148	1672	15.6	1327.5	20.5	0.015	0.145	1.665	26.369	422501	53.2	3.836	72	761.0	831.1	0.0	0.078	13761	4379	4000m.pg153_o3_native_lto.cx7a22_gcp_c2s30
q500.1
q500.1: range queries with 500 insert/s per client
Performance metrics for all DBMS, not just the ones listed above. Some are normalized by throughput, others are not. Legend for results is here.
ips	qps	rps	rmbps	wps	wmbps	rpq	rkbpq	wpi	wkbpi	csps	cpups	cspq	cpupq	dbgb1	dbgb2	rss	maxop	p50	p99	tag
3988	103156	5814	47.3	8813.5	120.9	0.056	0.469	2.210	31.046	404597	56.0	3.922	81	762.2	803.1	0.0	0.042	12840	12163	4000m.pg153_o3_native_lto.cx7a_gcp_c2s30
3987	100699	5835	47.8	8773.8	103.8	0.058	0.486	2.201	26.667	394256	56.4	3.915	84	760.3	788.5	0.0	0.029	12450	12083	4000m.pg153_o3_native_lto.cx7a1_gcp_c2s30
3987	103542	5809	47.4	8133.7	106.4	0.056	0.469	2.040	27.331	405792	55.6	3.919	81	762.8	832.9	0.0	0.022	12898	12514	4000m.pg153_o3_native_lto.cx7a4_gcp_c2s30
3987	100181	5810	47.2	11873.3	147.3	0.058	0.483	2.978	37.827	395027	56.2	3.943	84	763.1	779.1	0.0	0.026	12471	12178	4000m.pg153_o3_native_lto.cx7a7_gcp_c2s30
3987	102652	5811	47.3	8835.1	120.1	0.057	0.472	2.216	30.848	403503	55.5	3.931	81	761.5	802.5	0.0	0.041	12855	12450	4000m.pg153_o3_native_lto.cx7a10_gcp_c2s30
3987	101064	5836	47.4	8841.4	121.4	0.058	0.481	2.218	31.174	396830	56.0	3.927	83	762.3	803.4	0.0	0.016	12647	12216	4000m.pg153_o3_native_lto.cx7a12_gcp_c2s30
3987	101041	5811	47.1	9645.1	129.4	0.058	0.477	2.419	33.240	395810	56.4	3.917	84	762.4	794.4	0.0	0.082	12546	11907	4000m.pg153_o3_native_lto.cx7a15_gcp_c2s30
3988	100490	5835	47.5	8818.6	120.9	0.058	0.484	2.211	31.044	394757	56.1	3.928	84	761.4	802.6	0.0	0.040	12354	11848	4000m.pg153_o3_native_lto.cx7a16_gcp_c2s30
3987	102795	5849	48.0	7463.8	84.6	0.057	0.478	1.872	21.731	394426	57.2	3.837	83	759.8	829.9	0.0	0.024	12818	12386	4000m.pg153_o3_native_lto.cx7a21_gcp_c2s30
3987	101045	5853	47.8	8105.5	106.6	0.058	0.485	2.033	27.374	395584	56.1	3.915	83	761.3	831.3	0.0	0.025	12647	12247	4000m.pg153_o3_native_lto.cx7a22_gcp_c2s30
q1000.1
q1000.1: range queries with 1000 insert/s per client
Performance metrics for all DBMS, not just the ones listed above. Some are normalized by throughput, others are not. Legend for results is here.
ips	qps	rps	rmbps	wps	wmbps	rpq	rkbpq	wpi	wkbpi	csps	cpups	cspq	cpupq	dbgb1	dbgb2	rss	maxop	p50	p99	tag
7976	90694	11736	95.3	16368.1	222.3	0.129	1.076	2.052	28.542	363304	60.4	4.006	100	763.8	833.9	0.0	0.048	11379	10708	4000m.pg153_o3_native_lto.cx7a_gcp_c2s30
7973	82821	11905	116.6	16800.9	208.4	0.144	1.442	2.107	26.766	335061	61.0	4.046	110	761.7	821.1	0.1	0.074	10389	9349	4000m.pg153_o3_native_lto.cx7a1_gcp_c2s30
7976	91871	11738	95.4	16617.8	217.1	0.128	1.064	2.084	27.870	370318	59.4	4.031	97	764.2	834.2	0.0	0.064	11523	10516	4000m.pg153_o3_native_lto.cx7a4_gcp_c2s30
7978	87861	11700	94.5	24269.1	299.5	0.133	1.101	3.042	38.445	361410	59.4	4.113	101	764.7	780.7	0.0	0.066	11001	10708	4000m.pg153_o3_native_lto.cx7a7_gcp_c2s30
7976	92298	11726	95.1	16483.5	224.2	0.127	1.056	2.067	28.783	373946	58.7	4.051	95	763.2	833.3	0.0	0.072	11619	10804	4000m.pg153_o3_native_lto.cx7a10_gcp_c2s30
7976	80797	11819	105.4	16806.9	231.1	0.146	1.336	2.107	29.673	328182	61.5	4.062	114	763.3	833.4	0.1	0.064	10117	9509	4000m.pg153_o3_native_lto.cx7a12_gcp_c2s30
7976	89143	11745	95.1	20255.6	261.0	0.132	1.092	2.540	33.504	332888	64.2	3.734	108	764.0	796.1	0.0	0.090	11028	9637	4000m.pg153_o3_native_lto.cx7a15_gcp_c2s30
7973	86253	11844	106.9	16872.6	231.3	0.137	1.269	2.116	29.709	318488	65.5	3.692	114	762.1	832.2	0.1	0.053	10692	9605	4000m.pg153_o3_native_lto.cx7a16_gcp_c2s30
7976	92676	11882	106.5	16023.0	182.0	0.128	1.177	2.009	23.368	310967	68.8	3.355	111	761.4	831.5	0.1	0.050	11891	9510	4000m.pg153_o3_native_lto.cx7a21_gcp_c2s30
7973	80552	11846	106.9	16992.1	226.2	0.147	1.359	2.131	29.053	328444	61.5	4.077	115	761.9	832.0	0.1	0.087	10069	9418	4000m.pg153_o3_native_lto.cx7a22_gcp_c2s30
l.i0
- l.i0: load without secondary indexes
- Legend for results is here.
- Each entry lists the percentage of responses that fit in that bucket (slower than max time for previous bucket, faster than min time for next bucket).
Insert response time histogram
256us	1ms	4ms	16ms	64ms	256ms	1s	4s	16s	gt	max	tag
0.000	97.179	2.735	0.057	0.013	0.014	0.001	0.000	0.000	0.000	0.770	pg153_o3_native_lto.cx7a_gcp_c2s30
0.000	97.263	2.674	0.038	0.012	0.012	0.001	0.000	0.000	0.000	0.856	pg153_o3_native_lto.cx7a1_gcp_c2s30
0.000	96.873	3.036	0.060	0.016	0.013	0.001	0.000	0.000	0.000	0.727	pg153_o3_native_lto.cx7a4_gcp_c2s30
0.000	96.901	3.027	0.042	0.021	0.009	0.001	0.000	0.000	0.000	0.493	pg153_o3_native_lto.cx7a7_gcp_c2s30
0.000	97.288	2.616	0.066	0.017	0.012	0.001	0.000	0.000	0.000	0.678	pg153_o3_native_lto.cx7a10_gcp_c2s30
0.000	97.166	2.771	0.048	0.010	0.004	nonzero	0.000	0.000	0.000	0.585	pg153_o3_native_lto.cx7a12_gcp_c2s30
0.000	96.823	3.103	0.048	0.015	0.010	0.001	0.000	0.000	0.000	0.566	pg153_o3_native_lto.cx7a15_gcp_c2s30
0.000	97.646	2.284	0.048	0.011	0.010	0.001	0.000	0.000	0.000	0.758	pg153_o3_native_lto.cx7a16_gcp_c2s30
0.000	97.333	2.615	0.031	0.009	0.011	0.001	nonzero	0.000	0.000	1.007	pg153_o3_native_lto.cx7a21_gcp_c2s30
0.000	97.566	2.363	0.050	0.011	0.010	0.001	0.000	nonzero	0.000	5.617	pg153_o3_native_lto.cx7a22_gcp_c2s30
l.x
- l.x: create secondary indexes
- Legend for results is here.
- Each entry lists the percentage of responses that fit in that bucket (slower than max time for previous bucket, faster than min time for next bucket).
TODO - determine whether there is data for create index response time
l.i1
- l.i1: continue load after secondary indexes created
- Legend for results is here.
- Each entry lists the percentage of responses that fit in that bucket (slower than max time for previous bucket, faster than min time for next bucket).
Insert response time histogram
256us	1ms	4ms	16ms	64ms	256ms	1s	4s	16s	gt	max	tag
0.000	0.023	12.799	52.012	34.859	0.306	0.001	nonzero	0.000	0.000	1.137	pg153_o3_native_lto.cx7a_gcp_c2s30
0.000	0.000	4.293	57.868	37.801	0.034	0.004	0.000	0.000	0.000	0.971	pg153_o3_native_lto.cx7a1_gcp_c2s30
0.000	0.090	18.506	54.261	27.129	0.013	nonzero	0.000	0.000	0.000	0.606	pg153_o3_native_lto.cx7a4_gcp_c2s30
0.000	0.000	9.546	48.794	41.624	0.035	nonzero	0.000	0.000	0.000	0.744	pg153_o3_native_lto.cx7a7_gcp_c2s30
0.000	0.013	20.729	48.322	30.878	0.052	0.006	nonzero	0.000	0.000	1.021	pg153_o3_native_lto.cx7a10_gcp_c2s30
0.000	0.022	13.787	51.440	34.725	0.022	0.003	nonzero	0.000	0.000	1.279	pg153_o3_native_lto.cx7a12_gcp_c2s30
0.000	0.000	2.942	48.226	48.805	0.024	0.003	nonzero	0.000	0.000	1.168	pg153_o3_native_lto.cx7a15_gcp_c2s30
0.000	0.000	2.278	48.461	49.218	0.040	0.003	nonzero	nonzero	nonzero	17.755	pg153_o3_native_lto.cx7a16_gcp_c2s30
0.000	0.006	1.693	45.136	53.134	0.029	0.002	nonzero	0.000	0.000	3.693	pg153_o3_native_lto.cx7a21_gcp_c2s30
0.000	0.038	5.905	54.722	39.311	0.023	0.001	0.000	0.000	0.000	0.686	pg153_o3_native_lto.cx7a22_gcp_c2s30
Delete response time histogram
256us	1ms	4ms	16ms	64ms	256ms	1s	4s	16s	gt	max	tag
54.886	1.712	2.577	9.366	20.850	10.609	nonzero	0.000	0.000	0.000	0.816	pg153_o3_native_lto.cx7a_gcp_c2s30
54.821	4.193	3.317	11.016	18.357	8.296	0.001	0.000	0.000	0.000	0.427	pg153_o3_native_lto.cx7a1_gcp_c2s30
54.094	1.012	2.478	9.562	29.694	3.159	0.000	0.000	0.000	0.000	0.183	pg153_o3_native_lto.cx7a4_gcp_c2s30
49.971	2.279	2.475	9.455	16.411	19.410	0.000	0.000	0.000	0.000	0.207	pg153_o3_native_lto.cx7a7_gcp_c2s30
50.862	1.501	3.105	9.945	21.621	12.965	nonzero	0.000	0.000	0.000	0.329	pg153_o3_native_lto.cx7a10_gcp_c2s30
53.302	2.096	2.432	9.574	17.951	14.645	nonzero	0.000	0.000	0.000	0.331	pg153_o3_native_lto.cx7a12_gcp_c2s30
60.991	4.555	2.501	9.397	12.047	10.509	0.000	0.000	0.000	0.000	0.248	pg153_o3_native_lto.cx7a15_gcp_c2s30
61.795	4.378	3.278	10.890	14.242	5.418	nonzero	0.000	0.000	0.000	0.311	pg153_o3_native_lto.cx7a16_gcp_c2s30
60.051	9.937	3.192	12.384	11.981	2.455	nonzero	0.000	0.000	0.000	0.272	pg153_o3_native_lto.cx7a21_gcp_c2s30
54.146	3.742	3.838	13.039	13.904	11.330	nonzero	0.000	0.000	0.000	0.288	pg153_o3_native_lto.cx7a22_gcp_c2s30
q100.1
- q100.1: range queries with 100 insert/s per client
- Legend for results is here.
- Each entry lists the percentage of responses that fit in that bucket (slower than max time for previous bucket, faster than min time for next bucket).
Query response time histogram
256us	1ms	4ms	16ms	64ms	256ms	1s	4s	16s	gt	max	tag
99.910	0.090	0.001	nonzero	nonzero	nonzero	0.000	0.000	0.000	0.000	0.157	pg153_o3_native_lto.cx7a_gcp_c2s30
99.877	0.122	0.001	nonzero	nonzero	nonzero	0.000	0.000	0.000	0.000	0.123	pg153_o3_native_lto.cx7a1_gcp_c2s30
99.898	0.101	0.001	nonzero	nonzero	nonzero	0.000	0.000	0.000	0.000	0.157	pg153_o3_native_lto.cx7a4_gcp_c2s30
99.914	0.086	nonzero	nonzero	nonzero	nonzero	0.000	0.000	0.000	0.000	0.117	pg153_o3_native_lto.cx7a7_gcp_c2s30
99.910	0.090	0.001	nonzero	nonzero	nonzero	0.000	0.000	0.000	0.000	0.086	pg153_o3_native_lto.cx7a10_gcp_c2s30
99.862	0.137	0.001	nonzero	nonzero	nonzero	0.000	0.000	0.000	0.000	0.134	pg153_o3_native_lto.cx7a12_gcp_c2s30
99.911	0.088	0.001	nonzero	nonzero	nonzero	0.000	0.000	0.000	0.000	0.170	pg153_o3_native_lto.cx7a15_gcp_c2s30
99.856	0.143	0.001	nonzero	nonzero	nonzero	0.000	0.000	0.000	0.000	0.197	pg153_o3_native_lto.cx7a16_gcp_c2s30
99.906	0.093	0.001	nonzero	nonzero	nonzero	0.000	0.000	0.000	0.000	0.102	pg153_o3_native_lto.cx7a21_gcp_c2s30
99.820	0.177	0.002	nonzero	nonzero	nonzero	0.000	0.000	0.000	0.000	0.078	pg153_o3_native_lto.cx7a22_gcp_c2s30
Insert response time histogram
256us	1ms	4ms	16ms	64ms	256ms	1s	4s	16s	gt	max	tag
0.000	0.000	0.000	35.391	64.599	0.009	0.002	0.000	0.000	0.000	0.263	pg153_o3_native_lto.cx7a_gcp_c2s30
0.000	0.000	0.073	25.618	74.299	0.010	0.000	0.000	0.000	0.000	0.255	pg153_o3_native_lto.cx7a1_gcp_c2s30
0.000	0.000	1.332	27.950	70.705	0.014	0.000	0.000	0.000	0.000	0.170	pg153_o3_native_lto.cx7a4_gcp_c2s30
0.000	0.000	0.002	40.198	59.799	0.002	0.000	0.000	0.000	0.000	0.083	pg153_o3_native_lto.cx7a7_gcp_c2s30
0.000	0.000	0.016	37.177	62.785	0.021	0.002	0.000	0.000	0.000	0.259	pg153_o3_native_lto.cx7a10_gcp_c2s30
0.000	0.000	0.000	45.799	54.160	0.040	0.002	0.000	0.000	0.000	0.308	pg153_o3_native_lto.cx7a12_gcp_c2s30
0.000	0.000	0.003	38.189	61.792	0.014	0.002	0.000	0.000	0.000	0.410	pg153_o3_native_lto.cx7a15_gcp_c2s30
0.000	0.000	0.172	34.352	65.453	0.021	0.002	0.000	0.000	0.000	0.262	pg153_o3_native_lto.cx7a16_gcp_c2s30
0.000	0.000	0.007	22.477	77.503	0.012	0.000	0.000	0.000	0.000	0.211	pg153_o3_native_lto.cx7a21_gcp_c2s30
0.000	0.000	0.056	38.755	61.161	0.024	0.003	0.000	0.000	0.000	0.304	pg153_o3_native_lto.cx7a22_gcp_c2s30
Delete response time histogram
256us	1ms	4ms	16ms	64ms	256ms	1s	4s	16s	gt	max	tag
70.347	22.510	7.139	0.003	0.000	0.000	0.000	0.000	0.000	0.000	0.015	pg153_o3_native_lto.cx7a_gcp_c2s30
60.957	32.113	6.929	0.002	0.000	0.000	0.000	0.000	0.000	0.000	0.004	pg153_o3_native_lto.cx7a1_gcp_c2s30
79.064	20.776	0.153	0.007	0.000	0.000	0.000	0.000	0.000	0.000	0.015	pg153_o3_native_lto.cx7a4_gcp_c2s30
73.307	19.512	7.172	0.009	0.000	0.000	0.000	0.000	0.000	0.000	0.016	pg153_o3_native_lto.cx7a7_gcp_c2s30
81.691	18.135	0.170	0.003	0.000	0.000	0.000	0.000	0.000	0.000	0.015	pg153_o3_native_lto.cx7a10_gcp_c2s30
80.365	19.457	0.177	0.002	0.000	0.000	0.000	0.000	0.000	0.000	0.012	pg153_o3_native_lto.cx7a12_gcp_c2s30
61.297	24.910	13.790	0.003	0.000	0.000	0.000	0.000	0.000	0.000	0.012	pg153_o3_native_lto.cx7a15_gcp_c2s30
70.307	22.743	6.948	0.002	0.000	0.000	0.000	0.000	0.000	0.000	0.004	pg153_o3_native_lto.cx7a16_gcp_c2s30
45.812	31.745	22.429	0.009	0.005	0.000	0.000	0.000	0.000	0.000	0.036	pg153_o3_native_lto.cx7a21_gcp_c2s30
49.384	21.656	7.061	7.160	14.740	0.000	0.000	0.000	0.000	0.000	0.030	pg153_o3_native_lto.cx7a22_gcp_c2s30
q500.1
- q500.1: range queries with 500 insert/s per client
- Legend for results is here.
- Each entry lists the percentage of responses that fit in that bucket (slower than max time for previous bucket, faster than min time for next bucket).
Query response time histogram
256us	1ms	4ms	16ms	64ms	256ms	1s	4s	16s	gt	max	tag
99.929	0.069	0.002	nonzero	nonzero	0.000	0.000	0.000	0.000	0.000	0.042	pg153_o3_native_lto.cx7a_gcp_c2s30
99.921	0.078	0.002	nonzero	nonzero	0.000	0.000	0.000	0.000	0.000	0.029	pg153_o3_native_lto.cx7a1_gcp_c2s30
99.931	0.067	0.001	nonzero	nonzero	0.000	0.000	0.000	0.000	0.000	0.022	pg153_o3_native_lto.cx7a4_gcp_c2s30
99.925	0.074	0.001	nonzero	nonzero	0.000	0.000	0.000	0.000	0.000	0.026	pg153_o3_native_lto.cx7a7_gcp_c2s30
99.935	0.064	0.001	nonzero	nonzero	0.000	0.000	0.000	0.000	0.000	0.041	pg153_o3_native_lto.cx7a10_gcp_c2s30
99.926	0.072	0.002	nonzero	0.000	0.000	0.000	0.000	0.000	0.000	0.016	pg153_o3_native_lto.cx7a12_gcp_c2s30
99.906	0.092	0.002	nonzero	nonzero	nonzero	0.000	0.000	0.000	0.000	0.082	pg153_o3_native_lto.cx7a15_gcp_c2s30
99.928	0.070	0.002	nonzero	nonzero	0.000	0.000	0.000	0.000	0.000	0.040	pg153_o3_native_lto.cx7a16_gcp_c2s30
99.858	0.138	0.004	nonzero	nonzero	0.000	0.000	0.000	0.000	0.000	0.024	pg153_o3_native_lto.cx7a21_gcp_c2s30
99.925	0.073	0.002	nonzero	nonzero	0.000	0.000	0.000	0.000	0.000	0.025	pg153_o3_native_lto.cx7a22_gcp_c2s30
Insert response time histogram
256us	1ms	4ms	16ms	64ms	256ms	1s	4s	16s	gt	max	tag
0.000	0.000	0.000	28.537	71.452	0.010	0.000	0.000	0.000	0.000	0.106	pg153_o3_native_lto.cx7a_gcp_c2s30
0.000	0.000	0.000	14.172	85.819	0.009	0.000	0.000	0.000	0.000	0.092	pg153_o3_native_lto.cx7a1_gcp_c2s30
0.000	0.000	0.000	19.164	80.830	0.007	0.000	0.000	0.000	0.000	0.101	pg153_o3_native_lto.cx7a4_gcp_c2s30
0.000	0.000	0.000	15.943	84.050	0.007	0.000	0.000	0.000	0.000	0.094	pg153_o3_native_lto.cx7a7_gcp_c2s30
0.000	0.000	0.000	16.150	83.847	0.003	0.000	0.000	0.000	0.000	0.092	pg153_o3_native_lto.cx7a10_gcp_c2s30
0.000	0.000	0.000	19.960	80.037	0.002	0.000	0.000	0.000	0.000	0.094	pg153_o3_native_lto.cx7a12_gcp_c2s30
0.000	0.000	0.000	14.134	85.817	0.048	0.000	0.000	0.000	0.000	0.113	pg153_o3_native_lto.cx7a15_gcp_c2s30
0.000	0.000	0.000	13.792	86.202	0.006	0.000	0.000	0.000	0.000	0.079	pg153_o3_native_lto.cx7a16_gcp_c2s30
0.000	0.000	0.000	12.695	87.301	0.004	0.000	0.000	0.000	0.000	0.136	pg153_o3_native_lto.cx7a21_gcp_c2s30
0.000	0.000	0.000	29.830	70.165	0.005	0.000	0.000	0.000	0.000	0.089	pg153_o3_native_lto.cx7a22_gcp_c2s30
Delete response time histogram
256us	1ms	4ms	16ms	64ms	256ms	1s	4s	16s	gt	max	tag
83.318	4.017	3.196	9.466	0.003	0.000	0.000	0.000	0.000	0.000	0.043	pg153_o3_native_lto.cx7a_gcp_c2s30
82.148	5.214	3.254	9.384	0.001	0.000	0.000	0.000	0.000	0.000	0.020	pg153_o3_native_lto.cx7a1_gcp_c2s30
94.761	5.042	0.189	0.007	0.000	0.000	0.000	0.000	0.000	0.000	0.015	pg153_o3_native_lto.cx7a4_gcp_c2s30
83.757	3.578	3.241	9.422	0.001	0.000	0.000	0.000	0.000	0.000	0.028	pg153_o3_native_lto.cx7a7_gcp_c2s30
94.670	5.151	0.170	0.009	0.000	0.000	0.000	0.000	0.000	0.000	0.015	pg153_o3_native_lto.cx7a10_gcp_c2s30
83.275	5.794	1.182	9.748	0.001	0.000	0.000	0.000	0.000	0.000	0.025	pg153_o3_native_lto.cx7a12_gcp_c2s30
71.183	3.678	5.804	19.323	0.013	0.000	0.000	0.000	0.000	0.000	0.056	pg153_o3_native_lto.cx7a15_gcp_c2s30
82.297	5.081	3.216	9.405	0.001	0.000	0.000	0.000	0.000	0.000	0.024	pg153_o3_native_lto.cx7a16_gcp_c2s30
42.552	6.845	8.195	42.070	0.338	0.000	0.000	0.000	0.000	0.000	0.037	pg153_o3_native_lto.cx7a21_gcp_c2s30
80.996	4.947	3.163	9.476	1.418	0.000	0.000	0.000	0.000	0.000	0.031	pg153_o3_native_lto.cx7a22_gcp_c2s30
q1000.1
- q1000.1: range queries with 1000 insert/s per client
- Legend for results is here.
- Each entry lists the percentage of responses that fit in that bucket (slower than max time for previous bucket, faster than min time for next bucket).
Query response time histogram
256us	1ms	4ms	16ms	64ms	256ms	1s	4s	16s	gt	max	tag
99.756	0.239	0.004	0.001	nonzero	0.000	0.000	0.000	0.000	0.000	0.048	pg153_o3_native_lto.cx7a_gcp_c2s30
99.804	0.191	0.005	0.001	nonzero	nonzero	0.000	0.000	0.000	0.000	0.074	pg153_o3_native_lto.cx7a1_gcp_c2s30
99.775	0.221	0.003	nonzero	nonzero	0.000	0.000	0.000	0.000	0.000	0.064	pg153_o3_native_lto.cx7a4_gcp_c2s30
99.805	0.193	0.001	nonzero	nonzero	nonzero	0.000	0.000	0.000	0.000	0.066	pg153_o3_native_lto.cx7a7_gcp_c2s30
99.787	0.209	0.003	0.001	nonzero	nonzero	0.000	0.000	0.000	0.000	0.072	pg153_o3_native_lto.cx7a10_gcp_c2s30
99.789	0.204	0.005	0.001	nonzero	0.000	0.000	0.000	0.000	0.000	0.064	pg153_o3_native_lto.cx7a12_gcp_c2s30
99.661	0.333	0.005	0.001	nonzero	nonzero	0.000	0.000	0.000	0.000	0.090	pg153_o3_native_lto.cx7a15_gcp_c2s30
99.705	0.287	0.007	0.001	nonzero	0.000	0.000	0.000	0.000	0.000	0.053	pg153_o3_native_lto.cx7a16_gcp_c2s30
99.706	0.284	0.008	0.001	nonzero	0.000	0.000	0.000	0.000	0.000	0.050	pg153_o3_native_lto.cx7a21_gcp_c2s30
99.816	0.179	0.004	0.001	nonzero	nonzero	0.000	0.000	0.000	0.000	0.087	pg153_o3_native_lto.cx7a22_gcp_c2s30
Insert response time histogram
256us	1ms	4ms	16ms	64ms	256ms	1s	4s	16s	gt	max	tag
0.000	0.000	0.000	24.313	75.674	0.013	0.000	0.000	0.000	0.000	0.120	pg153_o3_native_lto.cx7a_gcp_c2s30
0.000	0.000	0.000	20.803	78.928	0.268	0.001	0.000	0.000	0.000	0.465	pg153_o3_native_lto.cx7a1_gcp_c2s30
0.000	0.000	0.000	13.840	86.148	0.013	0.000	0.000	0.000	0.000	0.178	pg153_o3_native_lto.cx7a4_gcp_c2s30
0.000	0.000	0.000	13.596	86.315	0.089	0.000	0.000	0.000	0.000	0.216	pg153_o3_native_lto.cx7a7_gcp_c2s30
0.000	0.000	0.000	9.973	89.992	0.035	0.000	0.000	0.000	0.000	0.116	pg153_o3_native_lto.cx7a10_gcp_c2s30
0.000	0.000	0.000	41.337	58.523	0.139	0.001	0.000	0.000	0.000	0.328	pg153_o3_native_lto.cx7a12_gcp_c2s30
0.000	0.000	0.000	10.365	89.565	0.070	0.000	0.000	0.000	0.000	0.199	pg153_o3_native_lto.cx7a15_gcp_c2s30
0.000	0.000	0.000	24.514	75.341	0.145	nonzero	0.000	0.000	0.000	0.260	pg153_o3_native_lto.cx7a16_gcp_c2s30
0.000	0.000	0.000	16.615	83.283	0.101	0.000	0.000	0.000	0.000	0.245	pg153_o3_native_lto.cx7a21_gcp_c2s30
0.000	0.000	0.000	42.934	56.915	0.150	0.001	0.000	0.000	0.000	0.262	pg153_o3_native_lto.cx7a22_gcp_c2s30
Delete response time histogram
256us	1ms	4ms	16ms	64ms	256ms	1s	4s	16s	gt	max	tag
83.005	7.974	0.139	1.796	7.085	0.000	0.000	0.000	0.000	0.000	0.063	pg153_o3_native_lto.cx7a_gcp_c2s30
83.548	12.228	0.166	1.236	2.822	0.000	0.000	0.000	0.000	0.000	0.057	pg153_o3_native_lto.cx7a1_gcp_c2s30
86.660	10.516	0.150	0.022	2.653	nonzero	0.000	0.000	0.000	0.000	0.082	pg153_o3_native_lto.cx7a4_gcp_c2s30
89.976	9.461	0.151	0.411	0.002	0.000	0.000	0.000	0.000	0.000	0.022	pg153_o3_native_lto.cx7a7_gcp_c2s30
86.886	12.935	0.151	0.025	0.002	0.000	0.000	0.000	0.000	0.000	0.064	pg153_o3_native_lto.cx7a10_gcp_c2s30
79.431	8.722	0.132	1.559	10.156	0.000	0.000	0.000	0.000	0.000	0.060	pg153_o3_native_lto.cx7a12_gcp_c2s30
59.510	14.273	0.162	3.068	22.985	0.002	0.000	0.000	0.000	0.000	0.099	pg153_o3_native_lto.cx7a15_gcp_c2s30
59.636	9.691	0.123	1.856	28.694	0.000	0.000	0.000	0.000	0.000	0.055	pg153_o3_native_lto.cx7a16_gcp_c2s30
38.143	14.567	0.118	4.581	42.590	0.001	0.000	0.000	0.000	0.000	0.073	pg153_o3_native_lto.cx7a21_gcp_c2s30
80.173	8.534	0.125	1.638	9.530	0.000	0.000	0.000	0.000	0.000	0.058	pg153_o3_native_lto.cx7a22_gcp_c2s30