Introduction
This is a report for the insert benchmark with 160M docs and 8 client(s). It is generated by scripts (bash, awk, sed) and Tufte might not be impressed. An overview of the insert benchmark is here and a short update is here. Below, by DBMS, I mean DBMS+version.config. An example is my8020.c10b40 where my means MySQL, 8020 is version 8.0.20 and c10b40 is the name for the configuration file.
The test server is a c2-standard-30 with 15 cores, hyperthreads disabled, 120G RAM and XFS with SW RAID 0 across 4 NVMe SSD. The benchmark was run with 8 clients and there were 1 or 3 connections per client (1 for queries or inserts without rate limits, 1+1 for rate limited inserts+deletes). It uses 8 tables, 1 per client. It loads 20M rows per table without secondary indexes, creates secondary indexes, then inserts 100M rows per table with a delete per insert to avoid growing the table. It then does 3 read+write tests for 3600s each that do queries as fast as possible with 100, 500 and then 1000 inserts/second/client concurrent with the queries. There are also deletes to match the inserts and avoid growing the table. The database is cached by the OS but not by Postgres. Clients and the DBMS share one server. The per-database configs are in the per-database subdirectories here.
The tested DBMS are:
- pg153_o3_native_lto.cx7a_4g_gcp_c2s30 - Postgres 15.3, the cx7a_4g_gcp_c2s30 config and the build used: -O3 -march=native -mtune=native -flto
- pg153_o3_native_lto.cx7a1_4g_gcp_c2s30 - Postgres 15.3, the cx7a1_4g_gcp_c2s30 config and the build used: -O3 -march=native -mtune=native -flto, adds wal_compression=lz4
- pg153_o3_native_lto.cx7a4_4g_gcp_c2s30 - Postgres 15.3, the cx7a4_4g_gcp_c2s30 config and the build used: -O3 -march=native -mtune=native -flto, adds checkpoint_timeout=1800s
- pg153_o3_native_lto.cx7a7_4g_gcp_c2s30 - Postgres 15.3, the cx7a7_4g_gcp_c2s30 config and the build used: -O3 -march=native -mtune=native -flto, adds max_wal_size=16GB
- pg153_o3_native_lto.cx7a9_4g_gcp_c2s30 - Postgres 15.3, the cx7a8_4g_gcp_c2s30 config and the build used: -O3 -march=native -mtune=native -flto, adds checkpoint_timeout=900s
- pg153_o3_native_lto.cx7a10_4g_gcp_c2s30 - Postgres 15.3, the cx7a10_4g_gcp_c2s30 config, compiled with -O3 -march=native -mtune=native -flto, adds autovacuum_work_mem=256MB
- pg153_o3_native_lto.cx7a12_4g_gcp_c2s30 - Postgres 15.3, the cx7a12_4g_gcp_c2s30 config, compiled with -O3 -march=native -mtune=native -flto, adds wal_buffers=64MB
- pg153_o3_native_lto.cx7a15_4g_gcp_c2s30 - Postgres 15.3, the cx7a15_4g_gcp_c2s30 config, compiled with -O3 -march=native -mtune=native -flto, adds max_wal_size=32GB
- pg153_o3_native_lto.cx7a16_4g_gcp_c2s30 - Postgres 15.3, the cx7a16_4g_gcp_c2s30 config, compiled with -O3 -march=native -mtune=native -flto, adds autovacuum_vacuum_scale_factor=0.05 autovacuum_vacuum_insert_scale_factor=0.05
- pg153_o3_native_lto.cx7a21_4g_gcp_c2s30 - Postgres 15.3, the cx7a21_4g_gcp_c2s30 config, compiled with -O3 -march=native -mtune=native -flto, combines a1, a4, a10 and a16
- pg153_o3_native_lto.cx7a22_4g_gcp_c2s30 - Postgres 15.3, the cx7a22_4g_gcp_c2s30 config, compiled with -O3 -march=native -mtune=native -flto, combines a4, a10 and a16
Contents
- Summary
- l.i0: load without secondary indexes
- l.x: create secondary indexes
- l.i1: continue load after secondary indexes created
- q100.1: range queries with 100 insert/s per client
- q500.1: range queries with 500 insert/s per client
- q1000.1: range queries with 1000 insert/s per client
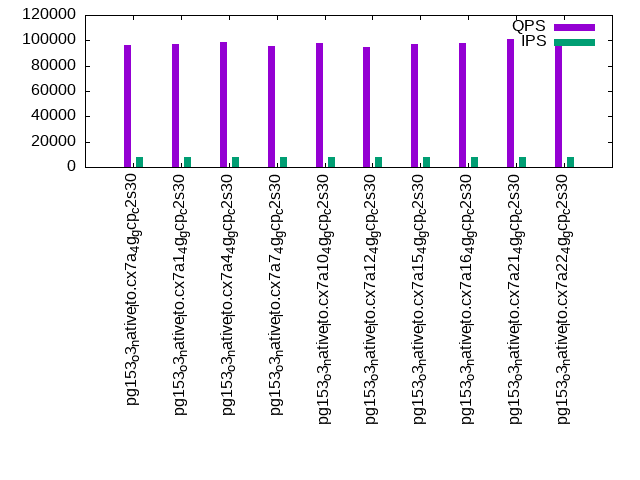
Summary
The numbers are inserts/s for l.i0 and l.i1, indexed docs (or rows) /s for l.x and queries/s for q*.2. The values are the average rate over the entire test for inserts (IPS) and queries (QPS). The range of values for IPS and QPS is split into 3 parts: bottom 25%, middle 50%, top 25%. Values in the bottom 25% have a red background, values in the top 25% have a green background and values in the middle have no color. A gray background is used for values that can be ignored because the DBMS did not sustain the target insert rate. Red backgrounds are not used when the minimum value is within 80% of the max value.
| dbms | l.i0 | l.x | l.i1 | q100.1 | q500.1 | q1000.1 |
|---|---|---|---|---|---|---|
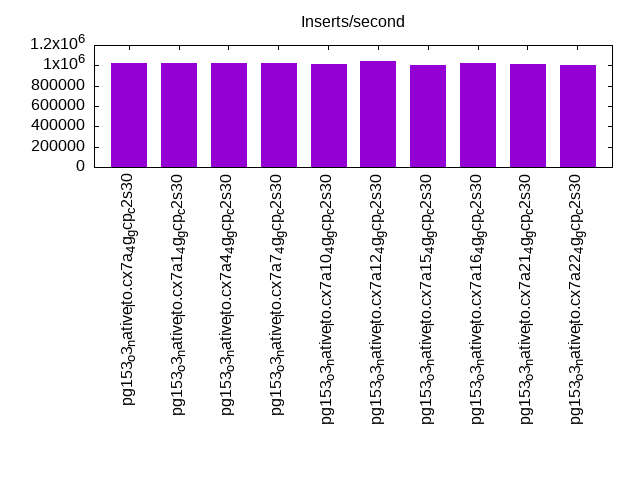
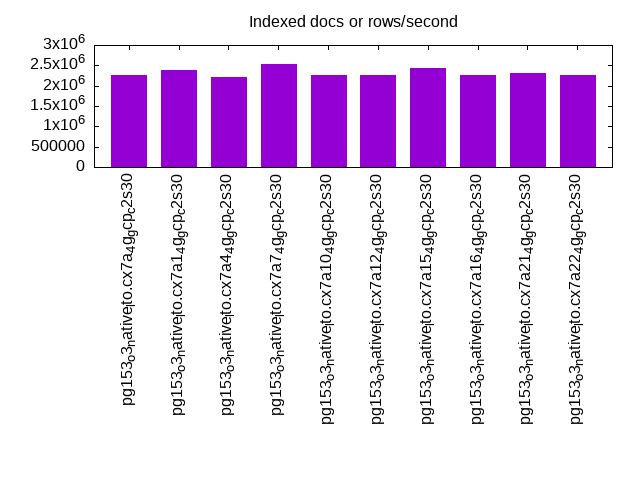
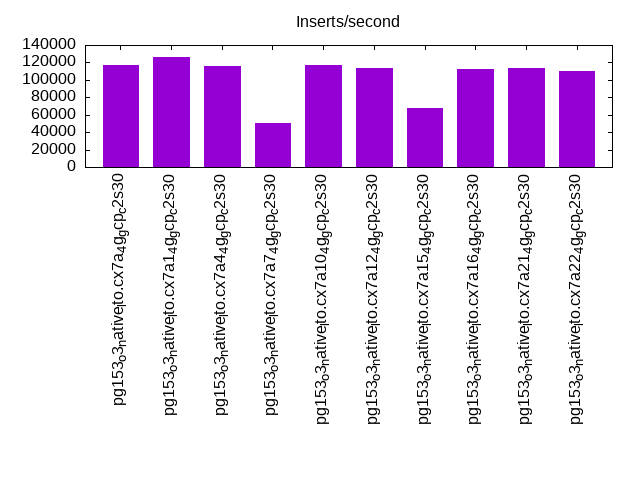
| pg153_o3_native_lto.cx7a_4g_gcp_c2s30 | 1025641 | 2254930 | 116788 | 110022 | 102118 | 96333 |
| pg153_o3_native_lto.cx7a1_4g_gcp_c2s30 | 1019108 | 2389552 | 126223 | 110812 | 103166 | 97462 |
| pg153_o3_native_lto.cx7a4_4g_gcp_c2s30 | 1019108 | 2223611 | 116195 | 111242 | 105146 | 98928 |
| pg153_o3_native_lto.cx7a7_4g_gcp_c2s30 | 1019108 | 2541270 | 50913 | 111155 | 103205 | 95899 |
| pg153_o3_native_lto.cx7a10_4g_gcp_c2s30 | 1012658 | 2254930 | 117543 | 110805 | 103338 | 97585 |
| pg153_o3_native_lto.cx7a12_4g_gcp_c2s30 | 1038961 | 2254930 | 114058 | 109561 | 101304 | 94993 |
| pg153_o3_native_lto.cx7a15_4g_gcp_c2s30 | 1000000 | 2425758 | 67232 | 110604 | 103253 | 96857 |
| pg153_o3_native_lto.cx7a16_4g_gcp_c2s30 | 1025641 | 2254930 | 112202 | 110158 | 103515 | 97862 |
| pg153_o3_native_lto.cx7a21_4g_gcp_c2s30 | 1012658 | 2320290 | 113572 | 110292 | 105614 | 100960 |
| pg153_o3_native_lto.cx7a22_4g_gcp_c2s30 | 1006289 | 2254930 | 109890 | 110903 | 105440 | 100668 |
This table has relative throughput, throughput for the DBMS relative to the DBMS in the first line, using the absolute throughput from the previous table. Values less than 0.95 have a yellow background. Values greater than 1.05 have a blue background.
| dbms | l.i0 | l.x | l.i1 | q100.1 | q500.1 | q1000.1 |
|---|---|---|---|---|---|---|
| pg153_o3_native_lto.cx7a_4g_gcp_c2s30 | 1.00 | 1.00 | 1.00 | 1.00 | 1.00 | 1.00 |
| pg153_o3_native_lto.cx7a1_4g_gcp_c2s30 | 0.99 | 1.06 | 1.08 | 1.01 | 1.01 | 1.01 |
| pg153_o3_native_lto.cx7a4_4g_gcp_c2s30 | 0.99 | 0.99 | 0.99 | 1.01 | 1.03 | 1.03 |
| pg153_o3_native_lto.cx7a7_4g_gcp_c2s30 | 0.99 | 1.13 | 0.44 | 1.01 | 1.01 | 1.00 |
| pg153_o3_native_lto.cx7a10_4g_gcp_c2s30 | 0.99 | 1.00 | 1.01 | 1.01 | 1.01 | 1.01 |
| pg153_o3_native_lto.cx7a12_4g_gcp_c2s30 | 1.01 | 1.00 | 0.98 | 1.00 | 0.99 | 0.99 |
| pg153_o3_native_lto.cx7a15_4g_gcp_c2s30 | 0.98 | 1.08 | 0.58 | 1.01 | 1.01 | 1.01 |
| pg153_o3_native_lto.cx7a16_4g_gcp_c2s30 | 1.00 | 1.00 | 0.96 | 1.00 | 1.01 | 1.02 |
| pg153_o3_native_lto.cx7a21_4g_gcp_c2s30 | 0.99 | 1.03 | 0.97 | 1.00 | 1.03 | 1.05 |
| pg153_o3_native_lto.cx7a22_4g_gcp_c2s30 | 0.98 | 1.00 | 0.94 | 1.01 | 1.03 | 1.05 |
This lists the average rate of inserts/s for the tests that do inserts concurrent with queries. For such tests the query rate is listed in the table above. The read+write tests are setup so that the insert rate should match the target rate every second. Cells that are not at least 95% of the target have a red background to indicate a failure to satisfy the target.
| dbms | q100.1 | q500.1 | q1000.1 |
|---|---|---|---|
| pg153_o3_native_lto.cx7a_4g_gcp_c2s30 | 797 | 3988 | 7967 |
| pg153_o3_native_lto.cx7a1_4g_gcp_c2s30 | 798 | 3987 | 7976 |
| pg153_o3_native_lto.cx7a4_4g_gcp_c2s30 | 798 | 3987 | 7973 |
| pg153_o3_native_lto.cx7a7_4g_gcp_c2s30 | 797 | 3988 | 7976 |
| pg153_o3_native_lto.cx7a10_4g_gcp_c2s30 | 797 | 3988 | 7976 |
| pg153_o3_native_lto.cx7a12_4g_gcp_c2s30 | 797 | 3987 | 7976 |
| pg153_o3_native_lto.cx7a15_4g_gcp_c2s30 | 798 | 3987 | 7978 |
| pg153_o3_native_lto.cx7a16_4g_gcp_c2s30 | 797 | 3988 | 7969 |
| pg153_o3_native_lto.cx7a21_4g_gcp_c2s30 | 797 | 3988 | 7976 |
| pg153_o3_native_lto.cx7a22_4g_gcp_c2s30 | 797 | 3988 | 7976 |
| target | 800 | 4000 | 8000 |
l.i0
l.i0: load without secondary indexes. Graphs for performance per 1-second interval are here.
Average throughput:
Insert response time histogram: each cell has the percentage of responses that take <= the time in the header and max is the max response time in seconds. For the max column values in the top 25% of the range have a red background and in the bottom 25% of the range have a green background. The red background is not used when the min value is within 80% of the max value.
| dbms | 256us | 1ms | 4ms | 16ms | 64ms | 256ms | 1s | 4s | 16s | gt | max |
|---|---|---|---|---|---|---|---|---|---|---|---|
| pg153_o3_native_lto.cx7a_4g_gcp_c2s30 | 98.174 | 1.750 | 0.056 | 0.007 | 0.011 | 0.003 | 0.377 | ||||
| pg153_o3_native_lto.cx7a1_4g_gcp_c2s30 | 98.238 | 1.681 | 0.060 | 0.007 | 0.012 | 0.002 | 0.570 | ||||
| pg153_o3_native_lto.cx7a4_4g_gcp_c2s30 | 97.837 | 2.087 | 0.053 | 0.009 | 0.013 | 0.002 | 0.418 | ||||
| pg153_o3_native_lto.cx7a7_4g_gcp_c2s30 | 97.598 | 2.309 | 0.062 | 0.020 | 0.009 | 0.002 | 0.391 | ||||
| pg153_o3_native_lto.cx7a10_4g_gcp_c2s30 | 97.958 | 1.967 | 0.052 | 0.009 | 0.012 | 0.002 | 0.637 | ||||
| pg153_o3_native_lto.cx7a12_4g_gcp_c2s30 | 97.860 | 2.081 | 0.051 | 0.004 | 0.002 | 0.002 | 0.639 | ||||
| pg153_o3_native_lto.cx7a15_4g_gcp_c2s30 | 97.698 | 2.154 | 0.116 | 0.019 | 0.012 | 0.001 | 0.650 | ||||
| pg153_o3_native_lto.cx7a16_4g_gcp_c2s30 | 97.985 | 1.941 | 0.050 | 0.009 | 0.013 | 0.002 | 0.788 | ||||
| pg153_o3_native_lto.cx7a21_4g_gcp_c2s30 | 97.874 | 2.047 | 0.056 | 0.010 | 0.012 | 0.001 | 0.488 | ||||
| pg153_o3_native_lto.cx7a22_4g_gcp_c2s30 | 97.828 | 2.099 | 0.053 | 0.010 | 0.007 | 0.003 | 0.695 |
Performance metrics for the DBMS listed above. Some are normalized by throughput, others are not. Legend for results is here.
ips	qps	rps	rmbps	wps	wmbps	rpq	rkbpq	wpi	wkbpi	csps	cpups	cspq	cpupq	dbgb1	dbgb2	rss	maxop	p50	p99	tag
1025641	0	0	0.0	5111.7	407.8	0.000	0.000	0.005	0.407	83607	75.6	0.082	11	15.3	41.4	0.0	0.377	147938	52643	160m.pg153_o3_native_lto.cx7a_4g_gcp_c2s30
1019108	0	0	0.0	4985.0	409.0	0.000	0.000	0.005	0.411	83806	76.1	0.082	11	15.3	41.4	0.0	0.570	145936	36560	160m.pg153_o3_native_lto.cx7a1_4g_gcp_c2s30
1019108	0	0	0.0	5054.3	408.0	0.000	0.000	0.005	0.410	83815	75.8	0.082	11	15.3	41.4	0.0	0.418	146337	63830	160m.pg153_o3_native_lto.cx7a4_4g_gcp_c2s30
1019108	0	0	0.0	3363.2	332.5	0.000	0.000	0.003	0.334	86388	75.7	0.085	11	15.3	31.4	0.0	0.391	146693	66453	160m.pg153_o3_native_lto.cx7a7_4g_gcp_c2s30
1012658	0	0	0.0	4965.3	406.6	0.000	0.000	0.005	0.411	83853	75.7	0.083	11	15.3	41.4	0.0	0.637	147039	35261	160m.pg153_o3_native_lto.cx7a10_4g_gcp_c2s30
1038961	0	0	0.0	5098.9	422.1	0.000	0.000	0.005	0.416	84301	77.7	0.081	11	15.3	41.4	0.0	0.639	146740	44269	160m.pg153_o3_native_lto.cx7a12_4g_gcp_c2s30
1000000	0	0	0.0	4573.0	417.5	0.000	0.000	0.005	0.428	83464	75.4	0.083	11	15.3	42.6	0.0	0.650	147340	61932	160m.pg153_o3_native_lto.cx7a15_4g_gcp_c2s30
1025641	0	0	0.0	5141.9	410.1	0.000	0.000	0.005	0.409	83770	75.5	0.082	11	15.3	41.4	0.0	0.788	147539	41654	160m.pg153_o3_native_lto.cx7a16_4g_gcp_c2s30
1012658	0	0	0.0	5084.4	408.3	0.000	0.000	0.005	0.413	81889	77.4	0.081	11	15.3	41.4	0.0	0.488	145819	51943	160m.pg153_o3_native_lto.cx7a21_4g_gcp_c2s30
1006289	0	0	0.0	5096.5	402.2	0.000	0.000	0.005	0.409	81815	77.2	0.081	12	15.3	41.4	0.0	0.695	145941	27369	160m.pg153_o3_native_lto.cx7a22_4g_gcp_c2s30
l.x
l.x: create secondary indexes.
Average throughput:
Performance metrics for the DBMS listed above. Some are normalized by throughput, others are not. Legend for results is here.
ips	qps	rps	rmbps	wps	wmbps	rpq	rkbpq	wpi	wkbpi	csps	cpups	cspq	cpupq	dbgb1	dbgb2	rss	maxop	p50	p99	tag
2254930	0	0	0.0	1548.2	559.1	0.000	0.000	0.001	0.254	12912	37.5	0.006	2	29.4	68.3	0.1	0.001	NA	NA	160m.pg153_o3_native_lto.cx7a_4g_gcp_c2s30
2389552	0	0	0.0	1249.1	430.0	0.000	0.000	0.001	0.184	7252	41.1	0.003	3	29.4	63.3	0.1	0.001	NA	NA	160m.pg153_o3_native_lto.cx7a1_4g_gcp_c2s30
2223611	0	0	0.0	1583.8	562.3	0.000	0.000	0.001	0.259	13015	37.5	0.006	3	29.4	68.3	0.1	0.001	NA	NA	160m.pg153_o3_native_lto.cx7a4_4g_gcp_c2s30
2541270	0	0	0.0	1452.4	456.5	0.000	0.000	0.001	0.184	12868	42.7	0.005	3	29.4	45.5	0.1	0.001	NA	NA	160m.pg153_o3_native_lto.cx7a7_4g_gcp_c2s30
2254930	0	0	0.0	1540.3	558.6	0.000	0.000	0.001	0.254	13383	37.6	0.006	3	29.4	68.3	0.1	0.001	NA	NA	160m.pg153_o3_native_lto.cx7a10_4g_gcp_c2s30
2254930	0	0	0.0	1557.0	579.2	0.000	0.000	0.001	0.263	12178	37.6	0.005	3	29.4	68.3	0.1	0.001	NA	NA	160m.pg153_o3_native_lto.cx7a12_4g_gcp_c2s30
2425758	0	0	0.0	1543.9	511.6	0.000	0.000	0.001	0.216	15079	40.1	0.006	2	29.4	61.5	0.1	0.001	NA	NA	160m.pg153_o3_native_lto.cx7a15_4g_gcp_c2s30
2254930	0	0	0.0	1558.9	561.0	0.000	0.000	0.001	0.255	14376	37.5	0.006	2	29.4	68.3	0.1	0.001	NA	NA	160m.pg153_o3_native_lto.cx7a16_4g_gcp_c2s30
2320290	0	0	0.0	1268.0	413.6	0.000	0.000	0.001	0.183	6151	41.4	0.003	3	29.4	63.3	0.1	0.001	NA	NA	160m.pg153_o3_native_lto.cx7a21_4g_gcp_c2s30
2254930	0	0	0.0	1554.1	561.3	0.000	0.000	0.001	0.255	11697	38.1	0.005	3	29.4	68.3	0.1	0.001	NA	NA	160m.pg153_o3_native_lto.cx7a22_4g_gcp_c2s30
l.i1
l.i1: continue load after secondary indexes created. Graphs for performance per 1-second interval are here.
Average throughput:
Insert response time histogram: each cell has the percentage of responses that take <= the time in the header and max is the max response time in seconds. For the max column values in the top 25% of the range have a red background and in the bottom 25% of the range have a green background. The red background is not used when the min value is within 80% of the max value.
| dbms | 256us | 1ms | 4ms | 16ms | 64ms | 256ms | 1s | 4s | 16s | gt | max |
|---|---|---|---|---|---|---|---|---|---|---|---|
| pg153_o3_native_lto.cx7a_4g_gcp_c2s30 | 0.009 | 95.526 | 3.304 | 1.123 | 0.038 | nonzero | 0.001 | nonzero | 6.035 | ||
| pg153_o3_native_lto.cx7a1_4g_gcp_c2s30 | 0.001 | 96.982 | 2.381 | 0.609 | 0.025 | nonzero | 0.001 | nonzero | 4.839 | ||
| pg153_o3_native_lto.cx7a4_4g_gcp_c2s30 | 0.342 | 95.520 | 3.104 | 1.001 | 0.031 | nonzero | nonzero | nonzero | 5.243 | ||
| pg153_o3_native_lto.cx7a7_4g_gcp_c2s30 | 0.109 | 79.838 | 10.753 | 7.730 | 1.567 | 0.001 | 0.001 | 0.001 | 6.355 | ||
| pg153_o3_native_lto.cx7a10_4g_gcp_c2s30 | 0.007 | 95.477 | 3.355 | 1.126 | 0.034 | nonzero | 0.001 | nonzero | 11.293 | ||
| pg153_o3_native_lto.cx7a12_4g_gcp_c2s30 | 0.004 | 94.489 | 4.411 | 0.916 | 0.179 | 0.001 | 0.001 | nonzero | 8.311 | ||
| pg153_o3_native_lto.cx7a15_4g_gcp_c2s30 | 85.884 | 6.562 | 6.975 | 0.574 | 0.001 | 0.003 | 0.002 | 10.818 | |||
| pg153_o3_native_lto.cx7a16_4g_gcp_c2s30 | 0.059 | 94.361 | 4.145 | 1.387 | 0.046 | nonzero | 0.002 | 0.001 | 9.119 | ||
| pg153_o3_native_lto.cx7a21_4g_gcp_c2s30 | 0.037 | 99.142 | 0.536 | 0.251 | 0.020 | 0.001 | 0.007 | 0.006 | 12.625 | ||
| pg153_o3_native_lto.cx7a22_4g_gcp_c2s30 | 0.271 | 97.126 | 1.715 | 0.839 | 0.036 | 0.003 | 0.005 | 0.004 | 15.233 |
Delete response time histogram: each cell has the percentage of responses that take <= the time in the header and max is the max response time in seconds. For the max column values in the top 25% of the range have a red background and in the bottom 25% of the range have a green background. The red background is not used when the min value is within 80% of the max value.
| dbms | 256us | 1ms | 4ms | 16ms | 64ms | 256ms | 1s | 4s | 16s | gt | max |
|---|---|---|---|---|---|---|---|---|---|---|---|
| pg153_o3_native_lto.cx7a_4g_gcp_c2s30 | 89.554 | 8.048 | 0.691 | 0.338 | 1.317 | 0.052 | nonzero | nonzero | nonzero | 6.048 | |
| pg153_o3_native_lto.cx7a1_4g_gcp_c2s30 | 84.772 | 13.350 | 0.642 | 0.345 | 0.777 | 0.114 | nonzero | nonzero | nonzero | 4.858 | |
| pg153_o3_native_lto.cx7a4_4g_gcp_c2s30 | 89.069 | 7.972 | 0.741 | 0.567 | 1.592 | 0.058 | nonzero | nonzero | nonzero | 5.296 | |
| pg153_o3_native_lto.cx7a7_4g_gcp_c2s30 | 73.306 | 17.430 | 1.238 | 2.821 | 4.481 | 0.723 | nonzero | nonzero | nonzero | 6.353 | |
| pg153_o3_native_lto.cx7a10_4g_gcp_c2s30 | 89.440 | 7.923 | 0.646 | 0.590 | 1.390 | 0.012 | nonzero | nonzero | nonzero | 11.291 | |
| pg153_o3_native_lto.cx7a12_4g_gcp_c2s30 | 87.461 | 11.029 | 0.678 | 0.297 | 0.380 | 0.155 | nonzero | nonzero | 3.543 | ||
| pg153_o3_native_lto.cx7a15_4g_gcp_c2s30 | 73.743 | 21.638 | 0.831 | 1.444 | 2.042 | 0.300 | nonzero | 0.001 | 0.001 | 10.863 | |
| pg153_o3_native_lto.cx7a16_4g_gcp_c2s30 | 88.141 | 10.087 | 0.609 | 0.360 | 0.706 | 0.096 | nonzero | nonzero | nonzero | 9.116 | |
| pg153_o3_native_lto.cx7a21_4g_gcp_c2s30 | 85.183 | 11.859 | 0.844 | 0.238 | 1.862 | 0.008 | 0.001 | 0.003 | 0.002 | 12.648 | |
| pg153_o3_native_lto.cx7a22_4g_gcp_c2s30 | 88.432 | 8.806 | 0.779 | 0.353 | 1.612 | 0.012 | 0.001 | 0.002 | 0.001 | 15.245 |
Performance metrics for the DBMS listed above. Some are normalized by throughput, others are not. Legend for results is here.
ips	qps	rps	rmbps	wps	wmbps	rpq	rkbpq	wpi	wkbpi	csps	cpups	cspq	cpupq	dbgb1	dbgb2	rss	maxop	p50	p99	tag
116788	0	1497	17.8	56480.9	1296.4	0.013	0.156	0.484	11.367	77835	57.5	0.666	74	77.4	147.5	0.0	6.035	16844	699	160m.pg153_o3_native_lto.cx7a_4g_gcp_c2s30
126223	0	1338	15.8	56812.7	1315.6	0.011	0.128	0.450	10.673	82157	61.7	0.651	73	86.2	155.6	0.1	4.839	18430	599	160m.pg153_o3_native_lto.cx7a1_4g_gcp_c2s30
116195	0	1426	16.9	57880.7	1290.2	0.012	0.149	0.498	11.371	76955	58.8	0.662	76	76.3	146.4	0.0	5.243	17538	899	160m.pg153_o3_native_lto.cx7a4_4g_gcp_c2s30
50913	0	0	0.0	63806.0	1220.3	0.000	0.000	1.253	24.544	44739	31.3	0.879	92	58.1	74.1	0.1	6.355	5394	649	160m.pg153_o3_native_lto.cx7a7_4g_gcp_c2s30
117543	0	1584	18.4	56805.1	1306.2	0.013	0.160	0.483	11.379	77812	58.3	0.662	74	70.8	140.9	0.1	11.293	17431	0	160m.pg153_o3_native_lto.cx7a10_4g_gcp_c2s30
114058	0	1982	29.0	57411.8	1326.8	0.017	0.260	0.503	11.912	76061	55.1	0.667	72	112.8	182.9	0.1	8.311	15733	350	160m.pg153_o3_native_lto.cx7a12_4g_gcp_c2s30
67232	0	676	9.8	68803.6	1275.6	0.010	0.150	1.023	19.428	51609	36.2	0.768	81	112.8	144.8	0.1	10.818	7542	0	160m.pg153_o3_native_lto.cx7a15_4g_gcp_c2s30
112202	0	1740	22.4	56704.2	1297.6	0.016	0.204	0.505	11.842	74995	54.3	0.668	73	96.8	166.9	0.1	9.119	16782	0	160m.pg153_o3_native_lto.cx7a16_4g_gcp_c2s30
113572	0	420	4.2	50346.5	1113.5	0.004	0.038	0.443	10.039	74118	56.1	0.653	74	56.9	126.9	0.1	12.625	19978	0	160m.pg153_o3_native_lto.cx7a21_4g_gcp_c2s30
109890	0	843	9.3	50424.9	1161.4	0.008	0.087	0.459	10.822	74028	53.9	0.674	74	59.3	129.3	0.0	15.233	18330	0	160m.pg153_o3_native_lto.cx7a22_4g_gcp_c2s30
q100.1
q100.1: range queries with 100 insert/s per client. Graphs for performance per 1-second interval are here.
Average throughput:
Query response time histogram: each cell has the percentage of responses that take <= the time in the header and max is the max response time in seconds. For max values in the top 25% of the range have a red background and in the bottom 25% of the range have a green background. The red background is not used when the min value is within 80% of the max value.
| dbms | 256us | 1ms | 4ms | 16ms | 64ms | 256ms | 1s | 4s | 16s | gt | max |
|---|---|---|---|---|---|---|---|---|---|---|---|
| pg153_o3_native_lto.cx7a_4g_gcp_c2s30 | 99.994 | 0.005 | 0.001 | nonzero | nonzero | 0.042 | |||||
| pg153_o3_native_lto.cx7a1_4g_gcp_c2s30 | 99.995 | 0.004 | 0.001 | nonzero | 0.010 | ||||||
| pg153_o3_native_lto.cx7a4_4g_gcp_c2s30 | 99.996 | 0.004 | 0.001 | nonzero | 0.012 | ||||||
| pg153_o3_native_lto.cx7a7_4g_gcp_c2s30 | 99.995 | 0.005 | 0.001 | nonzero | 0.005 | ||||||
| pg153_o3_native_lto.cx7a10_4g_gcp_c2s30 | 99.994 | 0.005 | 0.001 | nonzero | 0.006 | ||||||
| pg153_o3_native_lto.cx7a12_4g_gcp_c2s30 | 99.977 | 0.021 | 0.001 | nonzero | nonzero | nonzero | 0.173 | ||||
| pg153_o3_native_lto.cx7a15_4g_gcp_c2s30 | 99.981 | 0.018 | 0.001 | nonzero | nonzero | nonzero | 0.107 | ||||
| pg153_o3_native_lto.cx7a16_4g_gcp_c2s30 | 99.986 | 0.013 | 0.001 | nonzero | nonzero | nonzero | 0.157 | ||||
| pg153_o3_native_lto.cx7a21_4g_gcp_c2s30 | 99.996 | 0.004 | 0.001 | nonzero | nonzero | 10.977 | |||||
| pg153_o3_native_lto.cx7a22_4g_gcp_c2s30 | 99.995 | 0.004 | 0.001 | nonzero | nonzero | 0.067 |
Insert response time histogram: each cell has the percentage of responses that take <= the time in the header and max is the max response time in seconds. For max values in the top 25% of the range have a red background and in the bottom 25% of the range have a green background. The red background is not used when the min value is within 80% of the max value.
| dbms | 256us | 1ms | 4ms | 16ms | 64ms | 256ms | 1s | 4s | 16s | gt | max |
|---|---|---|---|---|---|---|---|---|---|---|---|
| pg153_o3_native_lto.cx7a_4g_gcp_c2s30 | 99.988 | 0.012 | 0.014 | ||||||||
| pg153_o3_native_lto.cx7a1_4g_gcp_c2s30 | 99.720 | 0.280 | 0.007 | ||||||||
| pg153_o3_native_lto.cx7a4_4g_gcp_c2s30 | 99.993 | 0.007 | 0.011 | ||||||||
| pg153_o3_native_lto.cx7a7_4g_gcp_c2s30 | 99.998 | 0.002 | 0.005 | ||||||||
| pg153_o3_native_lto.cx7a10_4g_gcp_c2s30 | 99.979 | 0.019 | 0.002 | 0.020 | |||||||
| pg153_o3_native_lto.cx7a12_4g_gcp_c2s30 | 93.361 | 6.535 | 0.083 | 0.019 | 0.002 | 0.354 | |||||
| pg153_o3_native_lto.cx7a15_4g_gcp_c2s30 | 87.057 | 12.884 | 0.052 | 0.007 | 0.126 | ||||||
| pg153_o3_native_lto.cx7a16_4g_gcp_c2s30 | 93.465 | 6.476 | 0.056 | 0.003 | 0.133 | ||||||
| pg153_o3_native_lto.cx7a21_4g_gcp_c2s30 | 99.885 | 0.099 | 0.002 | 0.014 | 9.902 | ||||||
| pg153_o3_native_lto.cx7a22_4g_gcp_c2s30 | 99.986 | 0.014 | 0.015 |
Delete response time histogram: each cell has the percentage of responses that take <= the time in the header and max is the max response time in seconds. For max values in the top 25% of the range have a red background and in the bottom 25% of the range have a green background. The red background is not used when the min value is within 80% of the max value.
| dbms | 256us | 1ms | 4ms | 16ms | 64ms | 256ms | 1s | 4s | 16s | gt | max |
|---|---|---|---|---|---|---|---|---|---|---|---|
| pg153_o3_native_lto.cx7a_4g_gcp_c2s30 | 44.292 | 46.783 | 8.922 | 0.003 | 0.014 | ||||||
| pg153_o3_native_lto.cx7a1_4g_gcp_c2s30 | 36.358 | 53.005 | 10.635 | 0.002 | 0.005 | ||||||
| pg153_o3_native_lto.cx7a4_4g_gcp_c2s30 | 39.729 | 50.340 | 9.931 | 0.004 | |||||||
| pg153_o3_native_lto.cx7a7_4g_gcp_c2s30 | 42.082 | 47.858 | 10.061 | 0.004 | |||||||
| pg153_o3_native_lto.cx7a10_4g_gcp_c2s30 | 41.278 | 49.113 | 9.604 | 0.005 | 0.013 | ||||||
| pg153_o3_native_lto.cx7a12_4g_gcp_c2s30 | 37.234 | 50.753 | 12.007 | 0.003 | 0.002 | 0.029 | |||||
| pg153_o3_native_lto.cx7a15_4g_gcp_c2s30 | 41.694 | 49.809 | 8.497 | 0.004 | |||||||
| pg153_o3_native_lto.cx7a16_4g_gcp_c2s30 | 38.891 | 51.148 | 9.957 | 0.005 | 0.014 | ||||||
| pg153_o3_native_lto.cx7a21_4g_gcp_c2s30 | 45.370 | 39.927 | 14.686 | 0.003 | 0.014 | 7.852 | |||||
| pg153_o3_native_lto.cx7a22_4g_gcp_c2s30 | 63.288 | 30.304 | 4.017 | 2.391 | 0.013 |
Performance metrics for the DBMS listed above. Some are normalized by throughput, others are not. Legend for results is here.
ips	qps	rps	rmbps	wps	wmbps	rpq	rkbpq	wpi	wkbpi	csps	cpups	cspq	cpupq	dbgb1	dbgb2	rss	maxop	p50	p99	tag
797	110022	2	0.1	3390.4	42.3	0.000	0.001	4.252	54.316	420015	53.1	3.818	72	77.4	116.1	0.0	0.042	13846	13601	160m.pg153_o3_native_lto.cx7a_4g_gcp_c2s30
798	110812	2	0.0	3382.1	40.3	0.000	0.000	4.241	51.695	422806	53.0	3.816	72	85.3	130.9	0.0	0.010	14000	13745	160m.pg153_o3_native_lto.cx7a1_4g_gcp_c2s30
798	111242	2	0.0	3385.5	43.3	0.000	0.000	4.245	55.584	423610	52.8	3.808	71	76.0	146.1	0.0	0.012	13735	13463	160m.pg153_o3_native_lto.cx7a4_4g_gcp_c2s30
797	111155	0	0.0	3377.6	33.5	0.000	0.000	4.236	43.016	424302	52.8	3.817	71	56.7	68.2	0.0	0.005	13985	13782	160m.pg153_o3_native_lto.cx7a7_4g_gcp_c2s30
797	110805	4	0.1	3394.0	42.9	0.000	0.000	4.257	55.050	422992	53.1	3.817	72	66.2	105.1	0.0	0.006	13879	13639	160m.pg153_o3_native_lto.cx7a10_4g_gcp_c2s30
797	109561	263	1.4	3360.0	42.8	0.002	0.013	4.214	54.930	418394	53.1	3.819	73	109.5	152.4	0.0	0.173	13735	13505	160m.pg153_o3_native_lto.cx7a12_4g_gcp_c2s30
798	110604	408	2.0	3405.0	51.7	0.004	0.018	4.270	66.394	422253	53.1	3.818	72	106.6	122.7	0.0	0.107	13793	13409	160m.pg153_o3_native_lto.cx7a15_4g_gcp_c2s30
797	110158	102	0.9	3386.2	44.8	0.001	0.009	4.247	57.492	420628	53.0	3.818	72	94.4	135.9	0.0	0.157	13751	11603	160m.pg153_o3_native_lto.cx7a16_4g_gcp_c2s30
797	110292	2	0.0	3409.7	28.9	0.000	0.000	4.280	37.147	419840	52.6	3.807	72	56.9	126.9	0.0	10.977	13857	13585	160m.pg153_o3_native_lto.cx7a21_4g_gcp_c2s30
797	110903	4	0.0	3421.7	31.3	0.000	0.000	4.292	40.230	422443	52.9	3.809	72	59.3	129.3	0.0	0.067	13937	13649	160m.pg153_o3_native_lto.cx7a22_4g_gcp_c2s30
q500.1
q500.1: range queries with 500 insert/s per client. Graphs for performance per 1-second interval are here.
Average throughput:

Query response time histogram: each cell has the percentage of responses that take <= the time in the header and max is the max response time in seconds. For max values in the top 25% of the range have a red background and in the bottom 25% of the range have a green background. The red background is not used when the min value is within 80% of the max value.
| dbms | 256us | 1ms | 4ms | 16ms | 64ms | 256ms | 1s | 4s | 16s | gt | max |
|---|---|---|---|---|---|---|---|---|---|---|---|
| pg153_o3_native_lto.cx7a_4g_gcp_c2s30 | 99.960 | 0.031 | 0.009 | 0.001 | nonzero | 0.021 | |||||
| pg153_o3_native_lto.cx7a1_4g_gcp_c2s30 | 99.962 | 0.029 | 0.008 | 0.001 | nonzero | 0.033 | |||||
| pg153_o3_native_lto.cx7a4_4g_gcp_c2s30 | 99.973 | 0.020 | 0.007 | nonzero | nonzero | 0.023 | |||||
| pg153_o3_native_lto.cx7a7_4g_gcp_c2s30 | 99.957 | 0.031 | 0.010 | 0.001 | nonzero | 0.032 | |||||
| pg153_o3_native_lto.cx7a10_4g_gcp_c2s30 | 99.959 | 0.031 | 0.010 | 0.001 | nonzero | 0.023 | |||||
| pg153_o3_native_lto.cx7a12_4g_gcp_c2s30 | 99.952 | 0.038 | 0.009 | 0.001 | nonzero | 0.026 | |||||
| pg153_o3_native_lto.cx7a15_4g_gcp_c2s30 | 99.959 | 0.030 | 0.009 | 0.001 | nonzero | 0.025 | |||||
| pg153_o3_native_lto.cx7a16_4g_gcp_c2s30 | 99.958 | 0.033 | 0.009 | nonzero | nonzero | nonzero | 0.144 | ||||
| pg153_o3_native_lto.cx7a21_4g_gcp_c2s30 | 99.977 | 0.018 | 0.005 | nonzero | nonzero | 0.044 | |||||
| pg153_o3_native_lto.cx7a22_4g_gcp_c2s30 | 99.977 | 0.017 | 0.006 | nonzero | nonzero | 0.054 |
Insert response time histogram: each cell has the percentage of responses that take <= the time in the header and max is the max response time in seconds. For max values in the top 25% of the range have a red background and in the bottom 25% of the range have a green background. The red background is not used when the min value is within 80% of the max value.
| dbms | 256us | 1ms | 4ms | 16ms | 64ms | 256ms | 1s | 4s | 16s | gt | max |
|---|---|---|---|---|---|---|---|---|---|---|---|
| pg153_o3_native_lto.cx7a_4g_gcp_c2s30 | 98.678 | 1.286 | 0.035 | 0.039 | |||||||
| pg153_o3_native_lto.cx7a1_4g_gcp_c2s30 | 97.027 | 2.872 | 0.102 | 0.039 | |||||||
| pg153_o3_native_lto.cx7a4_4g_gcp_c2s30 | 98.985 | 0.991 | 0.024 | 0.037 | |||||||
| pg153_o3_native_lto.cx7a7_4g_gcp_c2s30 | 97.505 | 2.305 | 0.190 | 0.040 | |||||||
| pg153_o3_native_lto.cx7a10_4g_gcp_c2s30 | 97.514 | 2.393 | 0.093 | 0.040 | |||||||
| pg153_o3_native_lto.cx7a12_4g_gcp_c2s30 | 99.122 | 0.867 | 0.011 | 0.026 | |||||||
| pg153_o3_native_lto.cx7a15_4g_gcp_c2s30 | 97.895 | 2.046 | 0.059 | 0.039 | |||||||
| pg153_o3_native_lto.cx7a16_4g_gcp_c2s30 | 98.771 | 1.168 | 0.053 | 0.008 | 0.147 | ||||||
| pg153_o3_native_lto.cx7a21_4g_gcp_c2s30 | 99.677 | 0.316 | 0.007 | 0.047 | |||||||
| pg153_o3_native_lto.cx7a22_4g_gcp_c2s30 | 99.796 | 0.194 | 0.010 | 0.056 |
Delete response time histogram: each cell has the percentage of responses that take <= the time in the header and max is the max response time in seconds. For max values in the top 25% of the range have a red background and in the bottom 25% of the range have a green background. The red background is not used when the min value is within 80% of the max value.
| dbms | 256us | 1ms | 4ms | 16ms | 64ms | 256ms | 1s | 4s | 16s | gt | max |
|---|---|---|---|---|---|---|---|---|---|---|---|
| pg153_o3_native_lto.cx7a_4g_gcp_c2s30 | 78.688 | 2.782 | 0.435 | 17.773 | 0.323 | 0.044 | |||||
| pg153_o3_native_lto.cx7a1_4g_gcp_c2s30 | 76.802 | 4.210 | 0.425 | 17.729 | 0.834 | 0.047 | |||||
| pg153_o3_native_lto.cx7a4_4g_gcp_c2s30 | 78.926 | 2.792 | 0.466 | 17.593 | 0.223 | 0.041 | |||||
| pg153_o3_native_lto.cx7a7_4g_gcp_c2s30 | 77.191 | 2.413 | 0.364 | 18.900 | 1.134 | 0.052 | |||||
| pg153_o3_native_lto.cx7a10_4g_gcp_c2s30 | 77.192 | 2.701 | 0.457 | 18.508 | 1.142 | 0.052 | |||||
| pg153_o3_native_lto.cx7a12_4g_gcp_c2s30 | 78.563 | 3.120 | 0.407 | 17.577 | 0.333 | 0.051 | |||||
| pg153_o3_native_lto.cx7a15_4g_gcp_c2s30 | 77.405 | 2.772 | 0.399 | 18.422 | 1.002 | 0.060 | |||||
| pg153_o3_native_lto.cx7a16_4g_gcp_c2s30 | 78.336 | 13.071 | 1.000 | 7.551 | 0.032 | 0.010 | 0.150 | ||||
| pg153_o3_native_lto.cx7a21_4g_gcp_c2s30 | 76.644 | 13.925 | 5.824 | 3.601 | 0.005 | 0.053 | |||||
| pg153_o3_native_lto.cx7a22_4g_gcp_c2s30 | 77.484 | 9.389 | 5.208 | 7.915 | 0.004 | 0.054 |
Performance metrics for the DBMS listed above. Some are normalized by throughput, others are not. Legend for results is here.
ips	qps	rps	rmbps	wps	wmbps	rpq	rkbpq	wpi	wkbpi	csps	cpups	cspq	cpupq	dbgb1	dbgb2	rss	maxop	p50	p99	tag
3988	102118	33	0.4	15835.3	224.9	0.000	0.004	3.971	57.751	390281	55.1	3.822	81	77.4	100.6	0.0	0.021	12839	12054	160m.pg153_o3_native_lto.cx7a_4g_gcp_c2s30
3987	103166	38	0.4	15820.4	214.6	0.000	0.004	3.968	55.124	392768	55.2	3.807	80	85.3	101.5	0.0	0.033	12856	12116	160m.pg153_o3_native_lto.cx7a1_4g_gcp_c2s30
3987	105146	49	0.5	15789.8	223.6	0.000	0.004	3.961	57.429	398881	55.0	3.794	78	76.0	143.7	0.0	0.023	13106	12215	160m.pg153_o3_native_lto.cx7a4_4g_gcp_c2s30
3988	103205	0	0.0	15746.1	150.4	0.000	0.000	3.949	38.625	394526	55.1	3.823	80	56.8	72.9	0.0	0.032	12882	12008	160m.pg153_o3_native_lto.cx7a7_4g_gcp_c2s30
3988	103338	37	0.4	15826.3	209.7	0.000	0.004	3.969	53.840	394140	55.2	3.814	80	66.2	90.1	0.0	0.023	12855	11955	160m.pg153_o3_native_lto.cx7a10_4g_gcp_c2s30
3987	101304	131	1.2	15833.3	183.8	0.001	0.012	3.972	47.212	387723	55.1	3.827	82	109.5	130.8	0.0	0.026	12706	11859	160m.pg153_o3_native_lto.cx7a12_4g_gcp_c2s30
3987	103253	102	1.0	15897.1	213.7	0.001	0.010	3.988	54.881	393864	55.3	3.815	80	106.6	125.0	0.0	0.025	12951	12151	160m.pg153_o3_native_lto.cx7a15_4g_gcp_c2s30
3988	103515	112	1.4	16263.0	241.4	0.001	0.014	4.078	61.995	397359	55.0	3.839	80	93.7	117.2	0.0	0.144	12978	11172	160m.pg153_o3_native_lto.cx7a16_4g_gcp_c2s30
3988	105614	26	0.3	16155.9	138.9	0.000	0.003	4.051	35.671	402826	54.7	3.814	78	56.8	119.0	0.0	0.044	13282	11555	160m.pg153_o3_native_lto.cx7a21_4g_gcp_c2s30
3988	105440	51	0.5	16151.8	144.9	0.000	0.005	4.050	37.196	402197	54.8	3.814	78	58.8	126.8	0.0	0.054	13345	11539	160m.pg153_o3_native_lto.cx7a22_4g_gcp_c2s30
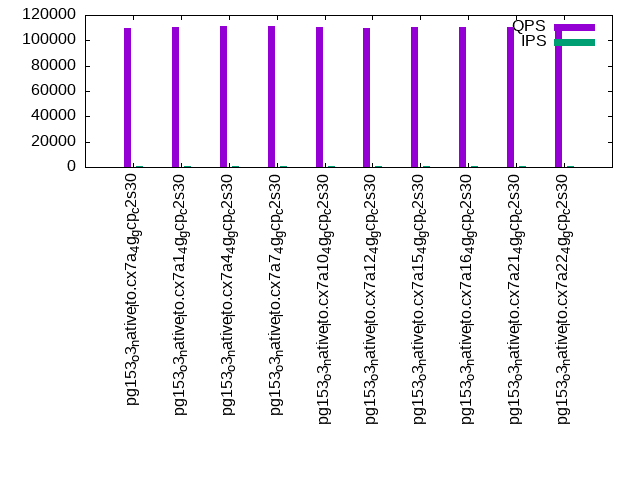
q1000.1
q1000.1: range queries with 1000 insert/s per client. Graphs for performance per 1-second interval are here.
Average throughput:
Query response time histogram: each cell has the percentage of responses that take <= the time in the header and max is the max response time in seconds. For max values in the top 25% of the range have a red background and in the bottom 25% of the range have a green background. The red background is not used when the min value is within 80% of the max value.
| dbms | 256us | 1ms | 4ms | 16ms | 64ms | 256ms | 1s | 4s | 16s | gt | max |
|---|---|---|---|---|---|---|---|---|---|---|---|
| pg153_o3_native_lto.cx7a_4g_gcp_c2s30 | 99.865 | 0.111 | 0.021 | 0.003 | nonzero | nonzero | nonzero | 5.856 | |||
| pg153_o3_native_lto.cx7a1_4g_gcp_c2s30 | 99.864 | 0.116 | 0.019 | 0.002 | nonzero | nonzero | 0.126 | ||||
| pg153_o3_native_lto.cx7a4_4g_gcp_c2s30 | 99.913 | 0.071 | 0.014 | 0.001 | nonzero | nonzero | nonzero | 1.773 | |||
| pg153_o3_native_lto.cx7a7_4g_gcp_c2s30 | 99.806 | 0.141 | 0.040 | 0.013 | nonzero | nonzero | nonzero | 0.390 | |||
| pg153_o3_native_lto.cx7a10_4g_gcp_c2s30 | 99.845 | 0.123 | 0.026 | 0.005 | nonzero | nonzero | 0.219 | ||||
| pg153_o3_native_lto.cx7a12_4g_gcp_c2s30 | 99.856 | 0.123 | 0.019 | 0.001 | nonzero | 0.043 | |||||
| pg153_o3_native_lto.cx7a15_4g_gcp_c2s30 | 99.846 | 0.130 | 0.022 | 0.002 | nonzero | nonzero | nonzero | 0.267 | |||
| pg153_o3_native_lto.cx7a16_4g_gcp_c2s30 | 99.885 | 0.097 | 0.016 | 0.002 | nonzero | nonzero | nonzero | 3.053 | |||
| pg153_o3_native_lto.cx7a21_4g_gcp_c2s30 | 99.933 | 0.056 | 0.010 | 0.001 | nonzero | 0.027 | |||||
| pg153_o3_native_lto.cx7a22_4g_gcp_c2s30 | 99.930 | 0.058 | 0.012 | 0.001 | nonzero | 0.031 |
Insert response time histogram: each cell has the percentage of responses that take <= the time in the header and max is the max response time in seconds. For max values in the top 25% of the range have a red background and in the bottom 25% of the range have a green background. The red background is not used when the min value is within 80% of the max value.
| dbms | 256us | 1ms | 4ms | 16ms | 64ms | 256ms | 1s | 4s | 16s | gt | max |
|---|---|---|---|---|---|---|---|---|---|---|---|
| pg153_o3_native_lto.cx7a_4g_gcp_c2s30 | 95.586 | 4.135 | 0.252 | 0.026 | 0.001 | 5.861 | |||||
| pg153_o3_native_lto.cx7a1_4g_gcp_c2s30 | 96.048 | 3.862 | 0.085 | 0.006 | 0.129 | ||||||
| pg153_o3_native_lto.cx7a4_4g_gcp_c2s30 | 97.408 | 2.503 | 0.086 | 0.002 | 0.001 | 1.564 | |||||
| pg153_o3_native_lto.cx7a7_4g_gcp_c2s30 | 84.791 | 14.549 | 0.634 | 0.025 | 0.001 | 0.439 | |||||
| pg153_o3_native_lto.cx7a10_4g_gcp_c2s30 | 93.539 | 6.053 | 0.396 | 0.012 | 0.231 | ||||||
| pg153_o3_native_lto.cx7a12_4g_gcp_c2s30 | 97.704 | 2.261 | 0.035 | 0.041 | |||||||
| pg153_o3_native_lto.cx7a15_4g_gcp_c2s30 | 96.826 | 2.964 | 0.191 | 0.018 | 0.001 | 0.276 | |||||
| pg153_o3_native_lto.cx7a16_4g_gcp_c2s30 | 97.409 | 2.428 | 0.157 | 0.005 | 0.001 | 3.061 | |||||
| pg153_o3_native_lto.cx7a21_4g_gcp_c2s30 | 98.600 | 1.377 | 0.023 | 0.042 | |||||||
| pg153_o3_native_lto.cx7a22_4g_gcp_c2s30 | 98.611 | 1.359 | 0.029 | nonzero | 0.087 |
Delete response time histogram: each cell has the percentage of responses that take <= the time in the header and max is the max response time in seconds. For max values in the top 25% of the range have a red background and in the bottom 25% of the range have a green background. The red background is not used when the min value is within 80% of the max value.
| dbms | 256us | 1ms | 4ms | 16ms | 64ms | 256ms | 1s | 4s | 16s | gt | max |
|---|---|---|---|---|---|---|---|---|---|---|---|
| pg153_o3_native_lto.cx7a_4g_gcp_c2s30 | 75.951 | 6.047 | 1.208 | 12.029 | 4.762 | 0.002 | 0.001 | 5.857 | |||
| pg153_o3_native_lto.cx7a1_4g_gcp_c2s30 | 75.691 | 7.205 | 0.903 | 10.586 | 5.615 | nonzero | 0.092 | ||||
| pg153_o3_native_lto.cx7a4_4g_gcp_c2s30 | 76.744 | 5.360 | 1.089 | 12.261 | 4.544 | 0.001 | 0.001 | 1.557 | |||
| pg153_o3_native_lto.cx7a7_4g_gcp_c2s30 | 73.013 | 7.345 | 2.110 | 12.241 | 5.287 | 0.004 | 0.001 | 0.391 | |||
| pg153_o3_native_lto.cx7a10_4g_gcp_c2s30 | 75.528 | 6.545 | 1.324 | 11.416 | 5.186 | 0.002 | 0.190 | ||||
| pg153_o3_native_lto.cx7a12_4g_gcp_c2s30 | 76.897 | 5.298 | 0.949 | 11.832 | 5.024 | 0.060 | |||||
| pg153_o3_native_lto.cx7a15_4g_gcp_c2s30 | 77.256 | 4.864 | 0.869 | 11.873 | 5.136 | 0.001 | nonzero | 0.271 | |||
| pg153_o3_native_lto.cx7a16_4g_gcp_c2s30 | 78.837 | 11.955 | 1.565 | 7.550 | 0.087 | 0.004 | 0.001 | 3.060 | |||
| pg153_o3_native_lto.cx7a21_4g_gcp_c2s30 | 78.173 | 10.513 | 4.406 | 6.888 | 0.021 | 0.045 | |||||
| pg153_o3_native_lto.cx7a22_4g_gcp_c2s30 | 77.822 | 7.570 | 6.137 | 8.459 | 0.011 | nonzero | 0.091 |
Performance metrics for the DBMS listed above. Some are normalized by throughput, others are not. Legend for results is here.
ips	qps	rps	rmbps	wps	wmbps	rpq	rkbpq	wpi	wkbpi	csps	cpups	cspq	cpupq	dbgb1	dbgb2	rss	maxop	p50	p99	tag
7967	96333	51	0.5	30532.7	399.9	0.001	0.006	3.832	51.399	362830	57.8	3.766	90	77.3	105.6	0.1	5.856	12147	10261	160m.pg153_o3_native_lto.cx7a_4g_gcp_c2s30
7976	97462	50	0.4	30581.1	383.7	0.001	0.005	3.834	49.270	365303	58.2	3.748	90	85.3	103.5	0.1	0.126	12306	10740	160m.pg153_o3_native_lto.cx7a1_4g_gcp_c2s30
7973	98928	268	2.2	30514.8	408.1	0.003	0.023	3.827	52.417	368239	58.0	3.722	88	76.0	138.7	0.1	1.773	12498	10708	160m.pg153_o3_native_lto.cx7a4_4g_gcp_c2s30
7976	95899	0	0.0	30472.3	308.4	0.000	0.000	3.821	39.599	366797	57.3	3.825	90	56.2	72.3	0.1	0.390	12099	10181	160m.pg153_o3_native_lto.cx7a7_4g_gcp_c2s30
7976	97585	59	0.5	30537.7	395.3	0.001	0.006	3.829	50.753	368063	57.6	3.772	89	64.9	94.0	0.1	0.219	12216	10212	160m.pg153_o3_native_lto.cx7a10_4g_gcp_c2s30
7976	94993	404	4.8	30648.6	351.0	0.004	0.051	3.843	45.061	358695	58.1	3.776	92	109.5	136.9	0.1	0.043	11955	10260	160m.pg153_o3_native_lto.cx7a12_4g_gcp_c2s30
7978	96857	315	3.1	30751.4	371.0	0.003	0.033	3.855	47.617	365526	58.0	3.774	90	106.6	134.0	0.1	0.267	12099	9893	160m.pg153_o3_native_lto.cx7a15_4g_gcp_c2s30
7969	97862	116	1.3	31071.4	447.7	0.001	0.014	3.899	57.527	374559	57.0	3.827	87	93.7	121.2	0.0	3.053	12359	10516	160m.pg153_o3_native_lto.cx7a16_4g_gcp_c2s30
7976	100960	47	0.4	30793.5	262.0	0.000	0.004	3.861	33.644	382877	56.8	3.792	84	56.8	112.6	0.0	0.027	12786	11288	160m.pg153_o3_native_lto.cx7a21_4g_gcp_c2s30
7976	100668	105	0.9	30770.8	276.1	0.001	0.009	3.858	35.453	381708	56.8	3.792	85	57.9	120.4	0.0	0.031	12695	11364	160m.pg153_o3_native_lto.cx7a22_4g_gcp_c2s30
l.i0
l.i0: load without secondary indexes
Performance metrics for all DBMS, not just the ones listed above. Some are normalized by throughput, others are not. Legend for results is here.
ips	qps	rps	rmbps	wps	wmbps	rpq	rkbpq	wpi	wkbpi	csps	cpups	cspq	cpupq	dbgb1	dbgb2	rss	maxop	p50	p99	tag
1025641	0	0	0.0	5111.7	407.8	0.000	0.000	0.005	0.407	83607	75.6	0.082	11	15.3	41.4	0.0	0.377	147938	52643	160m.pg153_o3_native_lto.cx7a_4g_gcp_c2s30
1019108	0	0	0.0	4985.0	409.0	0.000	0.000	0.005	0.411	83806	76.1	0.082	11	15.3	41.4	0.0	0.570	145936	36560	160m.pg153_o3_native_lto.cx7a1_4g_gcp_c2s30
1019108	0	0	0.0	5054.3	408.0	0.000	0.000	0.005	0.410	83815	75.8	0.082	11	15.3	41.4	0.0	0.418	146337	63830	160m.pg153_o3_native_lto.cx7a4_4g_gcp_c2s30
1019108	0	0	0.0	3363.2	332.5	0.000	0.000	0.003	0.334	86388	75.7	0.085	11	15.3	31.4	0.0	0.391	146693	66453	160m.pg153_o3_native_lto.cx7a7_4g_gcp_c2s30
1012658	0	0	0.0	4965.3	406.6	0.000	0.000	0.005	0.411	83853	75.7	0.083	11	15.3	41.4	0.0	0.637	147039	35261	160m.pg153_o3_native_lto.cx7a10_4g_gcp_c2s30
1038961	0	0	0.0	5098.9	422.1	0.000	0.000	0.005	0.416	84301	77.7	0.081	11	15.3	41.4	0.0	0.639	146740	44269	160m.pg153_o3_native_lto.cx7a12_4g_gcp_c2s30
1000000	0	0	0.0	4573.0	417.5	0.000	0.000	0.005	0.428	83464	75.4	0.083	11	15.3	42.6	0.0	0.650	147340	61932	160m.pg153_o3_native_lto.cx7a15_4g_gcp_c2s30
1025641	0	0	0.0	5141.9	410.1	0.000	0.000	0.005	0.409	83770	75.5	0.082	11	15.3	41.4	0.0	0.788	147539	41654	160m.pg153_o3_native_lto.cx7a16_4g_gcp_c2s30
1012658	0	0	0.0	5084.4	408.3	0.000	0.000	0.005	0.413	81889	77.4	0.081	11	15.3	41.4	0.0	0.488	145819	51943	160m.pg153_o3_native_lto.cx7a21_4g_gcp_c2s30
1006289	0	0	0.0	5096.5	402.2	0.000	0.000	0.005	0.409	81815	77.2	0.081	12	15.3	41.4	0.0	0.695	145941	27369	160m.pg153_o3_native_lto.cx7a22_4g_gcp_c2s30
l.x
l.x: create secondary indexes
Performance metrics for all DBMS, not just the ones listed above. Some are normalized by throughput, others are not. Legend for results is here.
ips	qps	rps	rmbps	wps	wmbps	rpq	rkbpq	wpi	wkbpi	csps	cpups	cspq	cpupq	dbgb1	dbgb2	rss	maxop	p50	p99	tag
2254930	0	0	0.0	1548.2	559.1	0.000	0.000	0.001	0.254	12912	37.5	0.006	2	29.4	68.3	0.1	0.001	NA	NA	160m.pg153_o3_native_lto.cx7a_4g_gcp_c2s30
2389552	0	0	0.0	1249.1	430.0	0.000	0.000	0.001	0.184	7252	41.1	0.003	3	29.4	63.3	0.1	0.001	NA	NA	160m.pg153_o3_native_lto.cx7a1_4g_gcp_c2s30
2223611	0	0	0.0	1583.8	562.3	0.000	0.000	0.001	0.259	13015	37.5	0.006	3	29.4	68.3	0.1	0.001	NA	NA	160m.pg153_o3_native_lto.cx7a4_4g_gcp_c2s30
2541270	0	0	0.0	1452.4	456.5	0.000	0.000	0.001	0.184	12868	42.7	0.005	3	29.4	45.5	0.1	0.001	NA	NA	160m.pg153_o3_native_lto.cx7a7_4g_gcp_c2s30
2254930	0	0	0.0	1540.3	558.6	0.000	0.000	0.001	0.254	13383	37.6	0.006	3	29.4	68.3	0.1	0.001	NA	NA	160m.pg153_o3_native_lto.cx7a10_4g_gcp_c2s30
2254930	0	0	0.0	1557.0	579.2	0.000	0.000	0.001	0.263	12178	37.6	0.005	3	29.4	68.3	0.1	0.001	NA	NA	160m.pg153_o3_native_lto.cx7a12_4g_gcp_c2s30
2425758	0	0	0.0	1543.9	511.6	0.000	0.000	0.001	0.216	15079	40.1	0.006	2	29.4	61.5	0.1	0.001	NA	NA	160m.pg153_o3_native_lto.cx7a15_4g_gcp_c2s30
2254930	0	0	0.0	1558.9	561.0	0.000	0.000	0.001	0.255	14376	37.5	0.006	2	29.4	68.3	0.1	0.001	NA	NA	160m.pg153_o3_native_lto.cx7a16_4g_gcp_c2s30
2320290	0	0	0.0	1268.0	413.6	0.000	0.000	0.001	0.183	6151	41.4	0.003	3	29.4	63.3	0.1	0.001	NA	NA	160m.pg153_o3_native_lto.cx7a21_4g_gcp_c2s30
2254930	0	0	0.0	1554.1	561.3	0.000	0.000	0.001	0.255	11697	38.1	0.005	3	29.4	68.3	0.1	0.001	NA	NA	160m.pg153_o3_native_lto.cx7a22_4g_gcp_c2s30
l.i1
l.i1: continue load after secondary indexes created
Performance metrics for all DBMS, not just the ones listed above. Some are normalized by throughput, others are not. Legend for results is here.
ips	qps	rps	rmbps	wps	wmbps	rpq	rkbpq	wpi	wkbpi	csps	cpups	cspq	cpupq	dbgb1	dbgb2	rss	maxop	p50	p99	tag
116788	0	1497	17.8	56480.9	1296.4	0.013	0.156	0.484	11.367	77835	57.5	0.666	74	77.4	147.5	0.0	6.035	16844	699	160m.pg153_o3_native_lto.cx7a_4g_gcp_c2s30
126223	0	1338	15.8	56812.7	1315.6	0.011	0.128	0.450	10.673	82157	61.7	0.651	73	86.2	155.6	0.1	4.839	18430	599	160m.pg153_o3_native_lto.cx7a1_4g_gcp_c2s30
116195	0	1426	16.9	57880.7	1290.2	0.012	0.149	0.498	11.371	76955	58.8	0.662	76	76.3	146.4	0.0	5.243	17538	899	160m.pg153_o3_native_lto.cx7a4_4g_gcp_c2s30
50913	0	0	0.0	63806.0	1220.3	0.000	0.000	1.253	24.544	44739	31.3	0.879	92	58.1	74.1	0.1	6.355	5394	649	160m.pg153_o3_native_lto.cx7a7_4g_gcp_c2s30
117543	0	1584	18.4	56805.1	1306.2	0.013	0.160	0.483	11.379	77812	58.3	0.662	74	70.8	140.9	0.1	11.293	17431	0	160m.pg153_o3_native_lto.cx7a10_4g_gcp_c2s30
114058	0	1982	29.0	57411.8	1326.8	0.017	0.260	0.503	11.912	76061	55.1	0.667	72	112.8	182.9	0.1	8.311	15733	350	160m.pg153_o3_native_lto.cx7a12_4g_gcp_c2s30
67232	0	676	9.8	68803.6	1275.6	0.010	0.150	1.023	19.428	51609	36.2	0.768	81	112.8	144.8	0.1	10.818	7542	0	160m.pg153_o3_native_lto.cx7a15_4g_gcp_c2s30
112202	0	1740	22.4	56704.2	1297.6	0.016	0.204	0.505	11.842	74995	54.3	0.668	73	96.8	166.9	0.1	9.119	16782	0	160m.pg153_o3_native_lto.cx7a16_4g_gcp_c2s30
113572	0	420	4.2	50346.5	1113.5	0.004	0.038	0.443	10.039	74118	56.1	0.653	74	56.9	126.9	0.1	12.625	19978	0	160m.pg153_o3_native_lto.cx7a21_4g_gcp_c2s30
109890	0	843	9.3	50424.9	1161.4	0.008	0.087	0.459	10.822	74028	53.9	0.674	74	59.3	129.3	0.0	15.233	18330	0	160m.pg153_o3_native_lto.cx7a22_4g_gcp_c2s30
q100.1
q100.1: range queries with 100 insert/s per client
Performance metrics for all DBMS, not just the ones listed above. Some are normalized by throughput, others are not. Legend for results is here.
ips	qps	rps	rmbps	wps	wmbps	rpq	rkbpq	wpi	wkbpi	csps	cpups	cspq	cpupq	dbgb1	dbgb2	rss	maxop	p50	p99	tag
797	110022	2	0.1	3390.4	42.3	0.000	0.001	4.252	54.316	420015	53.1	3.818	72	77.4	116.1	0.0	0.042	13846	13601	160m.pg153_o3_native_lto.cx7a_4g_gcp_c2s30
798	110812	2	0.0	3382.1	40.3	0.000	0.000	4.241	51.695	422806	53.0	3.816	72	85.3	130.9	0.0	0.010	14000	13745	160m.pg153_o3_native_lto.cx7a1_4g_gcp_c2s30
798	111242	2	0.0	3385.5	43.3	0.000	0.000	4.245	55.584	423610	52.8	3.808	71	76.0	146.1	0.0	0.012	13735	13463	160m.pg153_o3_native_lto.cx7a4_4g_gcp_c2s30
797	111155	0	0.0	3377.6	33.5	0.000	0.000	4.236	43.016	424302	52.8	3.817	71	56.7	68.2	0.0	0.005	13985	13782	160m.pg153_o3_native_lto.cx7a7_4g_gcp_c2s30
797	110805	4	0.1	3394.0	42.9	0.000	0.000	4.257	55.050	422992	53.1	3.817	72	66.2	105.1	0.0	0.006	13879	13639	160m.pg153_o3_native_lto.cx7a10_4g_gcp_c2s30
797	109561	263	1.4	3360.0	42.8	0.002	0.013	4.214	54.930	418394	53.1	3.819	73	109.5	152.4	0.0	0.173	13735	13505	160m.pg153_o3_native_lto.cx7a12_4g_gcp_c2s30
798	110604	408	2.0	3405.0	51.7	0.004	0.018	4.270	66.394	422253	53.1	3.818	72	106.6	122.7	0.0	0.107	13793	13409	160m.pg153_o3_native_lto.cx7a15_4g_gcp_c2s30
797	110158	102	0.9	3386.2	44.8	0.001	0.009	4.247	57.492	420628	53.0	3.818	72	94.4	135.9	0.0	0.157	13751	11603	160m.pg153_o3_native_lto.cx7a16_4g_gcp_c2s30
797	110292	2	0.0	3409.7	28.9	0.000	0.000	4.280	37.147	419840	52.6	3.807	72	56.9	126.9	0.0	10.977	13857	13585	160m.pg153_o3_native_lto.cx7a21_4g_gcp_c2s30
797	110903	4	0.0	3421.7	31.3	0.000	0.000	4.292	40.230	422443	52.9	3.809	72	59.3	129.3	0.0	0.067	13937	13649	160m.pg153_o3_native_lto.cx7a22_4g_gcp_c2s30
q500.1
q500.1: range queries with 500 insert/s per client
Performance metrics for all DBMS, not just the ones listed above. Some are normalized by throughput, others are not. Legend for results is here.
ips	qps	rps	rmbps	wps	wmbps	rpq	rkbpq	wpi	wkbpi	csps	cpups	cspq	cpupq	dbgb1	dbgb2	rss	maxop	p50	p99	tag
3988	102118	33	0.4	15835.3	224.9	0.000	0.004	3.971	57.751	390281	55.1	3.822	81	77.4	100.6	0.0	0.021	12839	12054	160m.pg153_o3_native_lto.cx7a_4g_gcp_c2s30
3987	103166	38	0.4	15820.4	214.6	0.000	0.004	3.968	55.124	392768	55.2	3.807	80	85.3	101.5	0.0	0.033	12856	12116	160m.pg153_o3_native_lto.cx7a1_4g_gcp_c2s30
3987	105146	49	0.5	15789.8	223.6	0.000	0.004	3.961	57.429	398881	55.0	3.794	78	76.0	143.7	0.0	0.023	13106	12215	160m.pg153_o3_native_lto.cx7a4_4g_gcp_c2s30
3988	103205	0	0.0	15746.1	150.4	0.000	0.000	3.949	38.625	394526	55.1	3.823	80	56.8	72.9	0.0	0.032	12882	12008	160m.pg153_o3_native_lto.cx7a7_4g_gcp_c2s30
3988	103338	37	0.4	15826.3	209.7	0.000	0.004	3.969	53.840	394140	55.2	3.814	80	66.2	90.1	0.0	0.023	12855	11955	160m.pg153_o3_native_lto.cx7a10_4g_gcp_c2s30
3987	101304	131	1.2	15833.3	183.8	0.001	0.012	3.972	47.212	387723	55.1	3.827	82	109.5	130.8	0.0	0.026	12706	11859	160m.pg153_o3_native_lto.cx7a12_4g_gcp_c2s30
3987	103253	102	1.0	15897.1	213.7	0.001	0.010	3.988	54.881	393864	55.3	3.815	80	106.6	125.0	0.0	0.025	12951	12151	160m.pg153_o3_native_lto.cx7a15_4g_gcp_c2s30
3988	103515	112	1.4	16263.0	241.4	0.001	0.014	4.078	61.995	397359	55.0	3.839	80	93.7	117.2	0.0	0.144	12978	11172	160m.pg153_o3_native_lto.cx7a16_4g_gcp_c2s30
3988	105614	26	0.3	16155.9	138.9	0.000	0.003	4.051	35.671	402826	54.7	3.814	78	56.8	119.0	0.0	0.044	13282	11555	160m.pg153_o3_native_lto.cx7a21_4g_gcp_c2s30
3988	105440	51	0.5	16151.8	144.9	0.000	0.005	4.050	37.196	402197	54.8	3.814	78	58.8	126.8	0.0	0.054	13345	11539	160m.pg153_o3_native_lto.cx7a22_4g_gcp_c2s30
q1000.1
q1000.1: range queries with 1000 insert/s per client
Performance metrics for all DBMS, not just the ones listed above. Some are normalized by throughput, others are not. Legend for results is here.
ips	qps	rps	rmbps	wps	wmbps	rpq	rkbpq	wpi	wkbpi	csps	cpups	cspq	cpupq	dbgb1	dbgb2	rss	maxop	p50	p99	tag
7967	96333	51	0.5	30532.7	399.9	0.001	0.006	3.832	51.399	362830	57.8	3.766	90	77.3	105.6	0.1	5.856	12147	10261	160m.pg153_o3_native_lto.cx7a_4g_gcp_c2s30
7976	97462	50	0.4	30581.1	383.7	0.001	0.005	3.834	49.270	365303	58.2	3.748	90	85.3	103.5	0.1	0.126	12306	10740	160m.pg153_o3_native_lto.cx7a1_4g_gcp_c2s30
7973	98928	268	2.2	30514.8	408.1	0.003	0.023	3.827	52.417	368239	58.0	3.722	88	76.0	138.7	0.1	1.773	12498	10708	160m.pg153_o3_native_lto.cx7a4_4g_gcp_c2s30
7976	95899	0	0.0	30472.3	308.4	0.000	0.000	3.821	39.599	366797	57.3	3.825	90	56.2	72.3	0.1	0.390	12099	10181	160m.pg153_o3_native_lto.cx7a7_4g_gcp_c2s30
7976	97585	59	0.5	30537.7	395.3	0.001	0.006	3.829	50.753	368063	57.6	3.772	89	64.9	94.0	0.1	0.219	12216	10212	160m.pg153_o3_native_lto.cx7a10_4g_gcp_c2s30
7976	94993	404	4.8	30648.6	351.0	0.004	0.051	3.843	45.061	358695	58.1	3.776	92	109.5	136.9	0.1	0.043	11955	10260	160m.pg153_o3_native_lto.cx7a12_4g_gcp_c2s30
7978	96857	315	3.1	30751.4	371.0	0.003	0.033	3.855	47.617	365526	58.0	3.774	90	106.6	134.0	0.1	0.267	12099	9893	160m.pg153_o3_native_lto.cx7a15_4g_gcp_c2s30
7969	97862	116	1.3	31071.4	447.7	0.001	0.014	3.899	57.527	374559	57.0	3.827	87	93.7	121.2	0.0	3.053	12359	10516	160m.pg153_o3_native_lto.cx7a16_4g_gcp_c2s30
7976	100960	47	0.4	30793.5	262.0	0.000	0.004	3.861	33.644	382877	56.8	3.792	84	56.8	112.6	0.0	0.027	12786	11288	160m.pg153_o3_native_lto.cx7a21_4g_gcp_c2s30
7976	100668	105	0.9	30770.8	276.1	0.001	0.009	3.858	35.453	381708	56.8	3.792	85	57.9	120.4	0.0	0.031	12695	11364	160m.pg153_o3_native_lto.cx7a22_4g_gcp_c2s30
l.i0
- l.i0: load without secondary indexes
- Legend for results is here.
- Each entry lists the percentage of responses that fit in that bucket (slower than max time for previous bucket, faster than min time for next bucket).
Insert response time histogram
256us	1ms	4ms	16ms	64ms	256ms	1s	4s	16s	gt	max	tag
0.000	98.174	1.750	0.056	0.007	0.011	0.003	0.000	0.000	0.000	0.377	pg153_o3_native_lto.cx7a_4g_gcp_c2s30
0.000	98.238	1.681	0.060	0.007	0.012	0.002	0.000	0.000	0.000	0.570	pg153_o3_native_lto.cx7a1_4g_gcp_c2s30
0.000	97.837	2.087	0.053	0.009	0.013	0.002	0.000	0.000	0.000	0.418	pg153_o3_native_lto.cx7a4_4g_gcp_c2s30
0.000	97.598	2.309	0.062	0.020	0.009	0.002	0.000	0.000	0.000	0.391	pg153_o3_native_lto.cx7a7_4g_gcp_c2s30
0.000	97.958	1.967	0.052	0.009	0.012	0.002	0.000	0.000	0.000	0.637	pg153_o3_native_lto.cx7a10_4g_gcp_c2s30
0.000	97.860	2.081	0.051	0.004	0.002	0.002	0.000	0.000	0.000	0.639	pg153_o3_native_lto.cx7a12_4g_gcp_c2s30
0.000	97.698	2.154	0.116	0.019	0.012	0.001	0.000	0.000	0.000	0.650	pg153_o3_native_lto.cx7a15_4g_gcp_c2s30
0.000	97.985	1.941	0.050	0.009	0.013	0.002	0.000	0.000	0.000	0.788	pg153_o3_native_lto.cx7a16_4g_gcp_c2s30
0.000	97.874	2.047	0.056	0.010	0.012	0.001	0.000	0.000	0.000	0.488	pg153_o3_native_lto.cx7a21_4g_gcp_c2s30
0.000	97.828	2.099	0.053	0.010	0.007	0.003	0.000	0.000	0.000	0.695	pg153_o3_native_lto.cx7a22_4g_gcp_c2s30
l.x
- l.x: create secondary indexes
- Legend for results is here.
- Each entry lists the percentage of responses that fit in that bucket (slower than max time for previous bucket, faster than min time for next bucket).
TODO - determine whether there is data for create index response time
l.i1
- l.i1: continue load after secondary indexes created
- Legend for results is here.
- Each entry lists the percentage of responses that fit in that bucket (slower than max time for previous bucket, faster than min time for next bucket).
Insert response time histogram
256us	1ms	4ms	16ms	64ms	256ms	1s	4s	16s	gt	max	tag
0.000	0.009	95.526	3.304	1.123	0.038	nonzero	0.001	nonzero	0.000	6.035	pg153_o3_native_lto.cx7a_4g_gcp_c2s30
0.000	0.001	96.982	2.381	0.609	0.025	nonzero	0.001	nonzero	0.000	4.839	pg153_o3_native_lto.cx7a1_4g_gcp_c2s30
0.000	0.342	95.520	3.104	1.001	0.031	nonzero	nonzero	nonzero	0.000	5.243	pg153_o3_native_lto.cx7a4_4g_gcp_c2s30
0.000	0.109	79.838	10.753	7.730	1.567	0.001	0.001	0.001	0.000	6.355	pg153_o3_native_lto.cx7a7_4g_gcp_c2s30
0.000	0.007	95.477	3.355	1.126	0.034	nonzero	0.001	nonzero	0.000	11.293	pg153_o3_native_lto.cx7a10_4g_gcp_c2s30
0.000	0.004	94.489	4.411	0.916	0.179	0.001	0.001	nonzero	0.000	8.311	pg153_o3_native_lto.cx7a12_4g_gcp_c2s30
0.000	0.000	85.884	6.562	6.975	0.574	0.001	0.003	0.002	0.000	10.818	pg153_o3_native_lto.cx7a15_4g_gcp_c2s30
0.000	0.059	94.361	4.145	1.387	0.046	nonzero	0.002	0.001	0.000	9.119	pg153_o3_native_lto.cx7a16_4g_gcp_c2s30
0.000	0.037	99.142	0.536	0.251	0.020	0.001	0.007	0.006	0.000	12.625	pg153_o3_native_lto.cx7a21_4g_gcp_c2s30
0.000	0.271	97.126	1.715	0.839	0.036	0.003	0.005	0.004	0.000	15.233	pg153_o3_native_lto.cx7a22_4g_gcp_c2s30
Delete response time histogram
256us	1ms	4ms	16ms	64ms	256ms	1s	4s	16s	gt	max	tag
89.554	8.048	0.691	0.338	1.317	0.052	nonzero	nonzero	nonzero	0.000	6.048	pg153_o3_native_lto.cx7a_4g_gcp_c2s30
84.772	13.350	0.642	0.345	0.777	0.114	nonzero	nonzero	nonzero	0.000	4.858	pg153_o3_native_lto.cx7a1_4g_gcp_c2s30
89.069	7.972	0.741	0.567	1.592	0.058	nonzero	nonzero	nonzero	0.000	5.296	pg153_o3_native_lto.cx7a4_4g_gcp_c2s30
73.306	17.430	1.238	2.821	4.481	0.723	nonzero	nonzero	nonzero	0.000	6.353	pg153_o3_native_lto.cx7a7_4g_gcp_c2s30
89.440	7.923	0.646	0.590	1.390	0.012	nonzero	nonzero	nonzero	0.000	11.291	pg153_o3_native_lto.cx7a10_4g_gcp_c2s30
87.461	11.029	0.678	0.297	0.380	0.155	nonzero	nonzero	0.000	0.000	3.543	pg153_o3_native_lto.cx7a12_4g_gcp_c2s30
73.743	21.638	0.831	1.444	2.042	0.300	nonzero	0.001	0.001	0.000	10.863	pg153_o3_native_lto.cx7a15_4g_gcp_c2s30
88.141	10.087	0.609	0.360	0.706	0.096	nonzero	nonzero	nonzero	0.000	9.116	pg153_o3_native_lto.cx7a16_4g_gcp_c2s30
85.183	11.859	0.844	0.238	1.862	0.008	0.001	0.003	0.002	0.000	12.648	pg153_o3_native_lto.cx7a21_4g_gcp_c2s30
88.432	8.806	0.779	0.353	1.612	0.012	0.001	0.002	0.001	0.000	15.245	pg153_o3_native_lto.cx7a22_4g_gcp_c2s30
q100.1
- q100.1: range queries with 100 insert/s per client
- Legend for results is here.
- Each entry lists the percentage of responses that fit in that bucket (slower than max time for previous bucket, faster than min time for next bucket).
Query response time histogram
256us	1ms	4ms	16ms	64ms	256ms	1s	4s	16s	gt	max	tag
99.994	0.005	0.001	nonzero	nonzero	0.000	0.000	0.000	0.000	0.000	0.042	pg153_o3_native_lto.cx7a_4g_gcp_c2s30
99.995	0.004	0.001	nonzero	0.000	0.000	0.000	0.000	0.000	0.000	0.010	pg153_o3_native_lto.cx7a1_4g_gcp_c2s30
99.996	0.004	0.001	nonzero	0.000	0.000	0.000	0.000	0.000	0.000	0.012	pg153_o3_native_lto.cx7a4_4g_gcp_c2s30
99.995	0.005	0.001	nonzero	0.000	0.000	0.000	0.000	0.000	0.000	0.005	pg153_o3_native_lto.cx7a7_4g_gcp_c2s30
99.994	0.005	0.001	nonzero	0.000	0.000	0.000	0.000	0.000	0.000	0.006	pg153_o3_native_lto.cx7a10_4g_gcp_c2s30
99.977	0.021	0.001	nonzero	nonzero	nonzero	0.000	0.000	0.000	0.000	0.173	pg153_o3_native_lto.cx7a12_4g_gcp_c2s30
99.981	0.018	0.001	nonzero	nonzero	nonzero	0.000	0.000	0.000	0.000	0.107	pg153_o3_native_lto.cx7a15_4g_gcp_c2s30
99.986	0.013	0.001	nonzero	nonzero	nonzero	0.000	0.000	0.000	0.000	0.157	pg153_o3_native_lto.cx7a16_4g_gcp_c2s30
99.996	0.004	0.001	nonzero	0.000	0.000	0.000	0.000	nonzero	0.000	10.977	pg153_o3_native_lto.cx7a21_4g_gcp_c2s30
99.995	0.004	0.001	nonzero	0.000	nonzero	0.000	0.000	0.000	0.000	0.067	pg153_o3_native_lto.cx7a22_4g_gcp_c2s30
Insert response time histogram
256us	1ms	4ms	16ms	64ms	256ms	1s	4s	16s	gt	max	tag
0.000	0.000	99.988	0.012	0.000	0.000	0.000	0.000	0.000	0.000	0.014	pg153_o3_native_lto.cx7a_4g_gcp_c2s30
0.000	0.000	99.720	0.280	0.000	0.000	0.000	0.000	0.000	0.000	0.007	pg153_o3_native_lto.cx7a1_4g_gcp_c2s30
0.000	0.000	99.993	0.007	0.000	0.000	0.000	0.000	0.000	0.000	0.011	pg153_o3_native_lto.cx7a4_4g_gcp_c2s30
0.000	0.000	99.998	0.002	0.000	0.000	0.000	0.000	0.000	0.000	0.005	pg153_o3_native_lto.cx7a7_4g_gcp_c2s30
0.000	0.000	99.979	0.019	0.002	0.000	0.000	0.000	0.000	0.000	0.020	pg153_o3_native_lto.cx7a10_4g_gcp_c2s30
0.000	0.000	93.361	6.535	0.083	0.019	0.002	0.000	0.000	0.000	0.354	pg153_o3_native_lto.cx7a12_4g_gcp_c2s30
0.000	0.000	87.057	12.884	0.052	0.007	0.000	0.000	0.000	0.000	0.126	pg153_o3_native_lto.cx7a15_4g_gcp_c2s30
0.000	0.000	93.465	6.476	0.056	0.003	0.000	0.000	0.000	0.000	0.133	pg153_o3_native_lto.cx7a16_4g_gcp_c2s30
0.000	0.000	99.885	0.099	0.002	0.000	0.000	0.000	0.014	0.000	9.902	pg153_o3_native_lto.cx7a21_4g_gcp_c2s30
0.000	0.000	99.986	0.014	0.000	0.000	0.000	0.000	0.000	0.000	0.015	pg153_o3_native_lto.cx7a22_4g_gcp_c2s30
Delete response time histogram
256us	1ms	4ms	16ms	64ms	256ms	1s	4s	16s	gt	max	tag
44.292	46.783	8.922	0.003	0.000	0.000	0.000	0.000	0.000	0.000	0.014	pg153_o3_native_lto.cx7a_4g_gcp_c2s30
36.358	53.005	10.635	0.002	0.000	0.000	0.000	0.000	0.000	0.000	0.005	pg153_o3_native_lto.cx7a1_4g_gcp_c2s30
39.729	50.340	9.931	0.000	0.000	0.000	0.000	0.000	0.000	0.000	0.004	pg153_o3_native_lto.cx7a4_4g_gcp_c2s30
42.082	47.858	10.061	0.000	0.000	0.000	0.000	0.000	0.000	0.000	0.004	pg153_o3_native_lto.cx7a7_4g_gcp_c2s30
41.278	49.113	9.604	0.005	0.000	0.000	0.000	0.000	0.000	0.000	0.013	pg153_o3_native_lto.cx7a10_4g_gcp_c2s30
37.234	50.753	12.007	0.003	0.002	0.000	0.000	0.000	0.000	0.000	0.029	pg153_o3_native_lto.cx7a12_4g_gcp_c2s30
41.694	49.809	8.497	0.000	0.000	0.000	0.000	0.000	0.000	0.000	0.004	pg153_o3_native_lto.cx7a15_4g_gcp_c2s30
38.891	51.148	9.957	0.005	0.000	0.000	0.000	0.000	0.000	0.000	0.014	pg153_o3_native_lto.cx7a16_4g_gcp_c2s30
45.370	39.927	14.686	0.003	0.000	0.000	0.000	0.000	0.014	0.000	7.852	pg153_o3_native_lto.cx7a21_4g_gcp_c2s30
63.288	30.304	4.017	2.391	0.000	0.000	0.000	0.000	0.000	0.000	0.013	pg153_o3_native_lto.cx7a22_4g_gcp_c2s30
q500.1
- q500.1: range queries with 500 insert/s per client
- Legend for results is here.
- Each entry lists the percentage of responses that fit in that bucket (slower than max time for previous bucket, faster than min time for next bucket).
Query response time histogram
256us	1ms	4ms	16ms	64ms	256ms	1s	4s	16s	gt	max	tag
99.960	0.031	0.009	0.001	nonzero	0.000	0.000	0.000	0.000	0.000	0.021	pg153_o3_native_lto.cx7a_4g_gcp_c2s30
99.962	0.029	0.008	0.001	nonzero	0.000	0.000	0.000	0.000	0.000	0.033	pg153_o3_native_lto.cx7a1_4g_gcp_c2s30
99.973	0.020	0.007	nonzero	nonzero	0.000	0.000	0.000	0.000	0.000	0.023	pg153_o3_native_lto.cx7a4_4g_gcp_c2s30
99.957	0.031	0.010	0.001	nonzero	0.000	0.000	0.000	0.000	0.000	0.032	pg153_o3_native_lto.cx7a7_4g_gcp_c2s30
99.959	0.031	0.010	0.001	nonzero	0.000	0.000	0.000	0.000	0.000	0.023	pg153_o3_native_lto.cx7a10_4g_gcp_c2s30
99.952	0.038	0.009	0.001	nonzero	0.000	0.000	0.000	0.000	0.000	0.026	pg153_o3_native_lto.cx7a12_4g_gcp_c2s30
99.959	0.030	0.009	0.001	nonzero	0.000	0.000	0.000	0.000	0.000	0.025	pg153_o3_native_lto.cx7a15_4g_gcp_c2s30
99.958	0.033	0.009	nonzero	nonzero	nonzero	0.000	0.000	0.000	0.000	0.144	pg153_o3_native_lto.cx7a16_4g_gcp_c2s30
99.977	0.018	0.005	nonzero	nonzero	0.000	0.000	0.000	0.000	0.000	0.044	pg153_o3_native_lto.cx7a21_4g_gcp_c2s30
99.977	0.017	0.006	nonzero	nonzero	0.000	0.000	0.000	0.000	0.000	0.054	pg153_o3_native_lto.cx7a22_4g_gcp_c2s30
Insert response time histogram
256us	1ms	4ms	16ms	64ms	256ms	1s	4s	16s	gt	max	tag
0.000	0.000	98.678	1.286	0.035	0.000	0.000	0.000	0.000	0.000	0.039	pg153_o3_native_lto.cx7a_4g_gcp_c2s30
0.000	0.000	97.027	2.872	0.102	0.000	0.000	0.000	0.000	0.000	0.039	pg153_o3_native_lto.cx7a1_4g_gcp_c2s30
0.000	0.000	98.985	0.991	0.024	0.000	0.000	0.000	0.000	0.000	0.037	pg153_o3_native_lto.cx7a4_4g_gcp_c2s30
0.000	0.000	97.505	2.305	0.190	0.000	0.000	0.000	0.000	0.000	0.040	pg153_o3_native_lto.cx7a7_4g_gcp_c2s30
0.000	0.000	97.514	2.393	0.093	0.000	0.000	0.000	0.000	0.000	0.040	pg153_o3_native_lto.cx7a10_4g_gcp_c2s30
0.000	0.000	99.122	0.867	0.011	0.000	0.000	0.000	0.000	0.000	0.026	pg153_o3_native_lto.cx7a12_4g_gcp_c2s30
0.000	0.000	97.895	2.046	0.059	0.000	0.000	0.000	0.000	0.000	0.039	pg153_o3_native_lto.cx7a15_4g_gcp_c2s30
0.000	0.000	98.771	1.168	0.053	0.008	0.000	0.000	0.000	0.000	0.147	pg153_o3_native_lto.cx7a16_4g_gcp_c2s30
0.000	0.000	99.677	0.316	0.007	0.000	0.000	0.000	0.000	0.000	0.047	pg153_o3_native_lto.cx7a21_4g_gcp_c2s30
0.000	0.000	99.796	0.194	0.010	0.000	0.000	0.000	0.000	0.000	0.056	pg153_o3_native_lto.cx7a22_4g_gcp_c2s30
Delete response time histogram
256us	1ms	4ms	16ms	64ms	256ms	1s	4s	16s	gt	max	tag
78.688	2.782	0.435	17.773	0.323	0.000	0.000	0.000	0.000	0.000	0.044	pg153_o3_native_lto.cx7a_4g_gcp_c2s30
76.802	4.210	0.425	17.729	0.834	0.000	0.000	0.000	0.000	0.000	0.047	pg153_o3_native_lto.cx7a1_4g_gcp_c2s30
78.926	2.792	0.466	17.593	0.223	0.000	0.000	0.000	0.000	0.000	0.041	pg153_o3_native_lto.cx7a4_4g_gcp_c2s30
77.191	2.413	0.364	18.900	1.134	0.000	0.000	0.000	0.000	0.000	0.052	pg153_o3_native_lto.cx7a7_4g_gcp_c2s30
77.192	2.701	0.457	18.508	1.142	0.000	0.000	0.000	0.000	0.000	0.052	pg153_o3_native_lto.cx7a10_4g_gcp_c2s30
78.563	3.120	0.407	17.577	0.333	0.000	0.000	0.000	0.000	0.000	0.051	pg153_o3_native_lto.cx7a12_4g_gcp_c2s30
77.405	2.772	0.399	18.422	1.002	0.000	0.000	0.000	0.000	0.000	0.060	pg153_o3_native_lto.cx7a15_4g_gcp_c2s30
78.336	13.071	1.000	7.551	0.032	0.010	0.000	0.000	0.000	0.000	0.150	pg153_o3_native_lto.cx7a16_4g_gcp_c2s30
76.644	13.925	5.824	3.601	0.005	0.000	0.000	0.000	0.000	0.000	0.053	pg153_o3_native_lto.cx7a21_4g_gcp_c2s30
77.484	9.389	5.208	7.915	0.004	0.000	0.000	0.000	0.000	0.000	0.054	pg153_o3_native_lto.cx7a22_4g_gcp_c2s30
q1000.1
- q1000.1: range queries with 1000 insert/s per client
- Legend for results is here.
- Each entry lists the percentage of responses that fit in that bucket (slower than max time for previous bucket, faster than min time for next bucket).
Query response time histogram
256us	1ms	4ms	16ms	64ms	256ms	1s	4s	16s	gt	max	tag
99.865	0.111	0.021	0.003	nonzero	nonzero	0.000	0.000	nonzero	0.000	5.856	pg153_o3_native_lto.cx7a_4g_gcp_c2s30
99.864	0.116	0.019	0.002	nonzero	nonzero	0.000	0.000	0.000	0.000	0.126	pg153_o3_native_lto.cx7a1_4g_gcp_c2s30
99.913	0.071	0.014	0.001	nonzero	nonzero	0.000	nonzero	0.000	0.000	1.773	pg153_o3_native_lto.cx7a4_4g_gcp_c2s30
99.806	0.141	0.040	0.013	nonzero	nonzero	nonzero	0.000	0.000	0.000	0.390	pg153_o3_native_lto.cx7a7_4g_gcp_c2s30
99.845	0.123	0.026	0.005	nonzero	nonzero	0.000	0.000	0.000	0.000	0.219	pg153_o3_native_lto.cx7a10_4g_gcp_c2s30
99.856	0.123	0.019	0.001	nonzero	0.000	0.000	0.000	0.000	0.000	0.043	pg153_o3_native_lto.cx7a12_4g_gcp_c2s30
99.846	0.130	0.022	0.002	nonzero	nonzero	nonzero	0.000	0.000	0.000	0.267	pg153_o3_native_lto.cx7a15_4g_gcp_c2s30
99.885	0.097	0.016	0.002	nonzero	nonzero	0.000	nonzero	0.000	0.000	3.053	pg153_o3_native_lto.cx7a16_4g_gcp_c2s30
99.933	0.056	0.010	0.001	nonzero	0.000	0.000	0.000	0.000	0.000	0.027	pg153_o3_native_lto.cx7a21_4g_gcp_c2s30
99.930	0.058	0.012	0.001	nonzero	0.000	0.000	0.000	0.000	0.000	0.031	pg153_o3_native_lto.cx7a22_4g_gcp_c2s30
Insert response time histogram
256us	1ms	4ms	16ms	64ms	256ms	1s	4s	16s	gt	max	tag
0.000	0.000	95.586	4.135	0.252	0.026	0.000	0.000	0.001	0.000	5.861	pg153_o3_native_lto.cx7a_4g_gcp_c2s30
0.000	0.000	96.048	3.862	0.085	0.006	0.000	0.000	0.000	0.000	0.129	pg153_o3_native_lto.cx7a1_4g_gcp_c2s30
0.000	0.000	97.408	2.503	0.086	0.002	0.000	0.001	0.000	0.000	1.564	pg153_o3_native_lto.cx7a4_4g_gcp_c2s30
0.000	0.000	84.791	14.549	0.634	0.025	0.001	0.000	0.000	0.000	0.439	pg153_o3_native_lto.cx7a7_4g_gcp_c2s30
0.000	0.000	93.539	6.053	0.396	0.012	0.000	0.000	0.000	0.000	0.231	pg153_o3_native_lto.cx7a10_4g_gcp_c2s30
0.000	0.000	97.704	2.261	0.035	0.000	0.000	0.000	0.000	0.000	0.041	pg153_o3_native_lto.cx7a12_4g_gcp_c2s30
0.000	0.000	96.826	2.964	0.191	0.018	0.001	0.000	0.000	0.000	0.276	pg153_o3_native_lto.cx7a15_4g_gcp_c2s30
0.000	0.000	97.409	2.428	0.157	0.005	0.000	0.001	0.000	0.000	3.061	pg153_o3_native_lto.cx7a16_4g_gcp_c2s30
0.000	0.000	98.600	1.377	0.023	0.000	0.000	0.000	0.000	0.000	0.042	pg153_o3_native_lto.cx7a21_4g_gcp_c2s30
0.000	0.000	98.611	1.359	0.029	nonzero	0.000	0.000	0.000	0.000	0.087	pg153_o3_native_lto.cx7a22_4g_gcp_c2s30
Delete response time histogram
256us	1ms	4ms	16ms	64ms	256ms	1s	4s	16s	gt	max	tag
75.951	6.047	1.208	12.029	4.762	0.002	0.000	0.000	0.001	0.000	5.857	pg153_o3_native_lto.cx7a_4g_gcp_c2s30
75.691	7.205	0.903	10.586	5.615	nonzero	0.000	0.000	0.000	0.000	0.092	pg153_o3_native_lto.cx7a1_4g_gcp_c2s30
76.744	5.360	1.089	12.261	4.544	0.001	0.000	0.001	0.000	0.000	1.557	pg153_o3_native_lto.cx7a4_4g_gcp_c2s30
73.013	7.345	2.110	12.241	5.287	0.004	0.001	0.000	0.000	0.000	0.391	pg153_o3_native_lto.cx7a7_4g_gcp_c2s30
75.528	6.545	1.324	11.416	5.186	0.002	0.000	0.000	0.000	0.000	0.190	pg153_o3_native_lto.cx7a10_4g_gcp_c2s30
76.897	5.298	0.949	11.832	5.024	0.000	0.000	0.000	0.000	0.000	0.060	pg153_o3_native_lto.cx7a12_4g_gcp_c2s30
77.256	4.864	0.869	11.873	5.136	0.001	nonzero	0.000	0.000	0.000	0.271	pg153_o3_native_lto.cx7a15_4g_gcp_c2s30
78.837	11.955	1.565	7.550	0.087	0.004	0.000	0.001	0.000	0.000	3.060	pg153_o3_native_lto.cx7a16_4g_gcp_c2s30
78.173	10.513	4.406	6.888	0.021	0.000	0.000	0.000	0.000	0.000	0.045	pg153_o3_native_lto.cx7a21_4g_gcp_c2s30
77.822	7.570	6.137	8.459	0.011	nonzero	0.000	0.000	0.000	0.000	0.091	pg153_o3_native_lto.cx7a22_4g_gcp_c2s30