Introduction
This is a report for the insert benchmark with 4000M docs and 8 client(s). It is generated by scripts (bash, awk, sed) and Tufte might not be impressed. An overview of the insert benchmark is here and a short update is here. Below, by DBMS, I mean DBMS+version.config. An example is my8020.c10b40 where my means MySQL, 8020 is version 8.0.20 and c10b40 is the name for the configuration file.
The test server is a c2-standard-30 from GCP with 15 cores, hyperthreads disabled, 120G RAM, XFS + SW RAID 0 on 4 NVMe devices (1.5TB). The benchmark was run with 8 client and there were 1 or 3 connections per client (1 for queries or inserts without rate limits, 1+1 for rate limited inserts+deletes). There are 8 tables, client per table. It loads 500M rows per table without secondary indexes, creates secondary indexes, then inserts 50M rows with a delete per insert to avoid growing the table. It then does 3 read+write tests for 3600s each that do queries as fast as possible with 100, 500 and then 1000 inserts/second/client concurrent with the queries and 1000 deletes/second to avoid growing the table. The database is larger than memory.
The tested DBMS are:
- fbmy5635_rel.cy9c_gcp_c2s30 - MyRocks and FB MySQL 5.6.35, rel build, cy9c_gcp_c2s30 config
- fbmy8028_rel_lto.cy9c_gcp_c2s30 - MyRocks and FB MySQL 8.0.28, rel build, cy9c_gcp_c2s30 config
Contents
- Summary
- l.i0: load without secondary indexes
- l.x: create secondary indexes
- l.i1: continue load after secondary indexes created
- q100.1: range queries with 100 insert/s per client
- q500.1: range queries with 500 insert/s per client
- q1000.1: range queries with 1000 insert/s per client
Summary
The numbers are inserts/s for l.i0 and l.i1, indexed docs (or rows) /s for l.x and queries/s for q*.2. The values are the average rate over the entire test for inserts (IPS) and queries (QPS). The range of values for IPS and QPS is split into 3 parts: bottom 25%, middle 50%, top 25%. Values in the bottom 25% have a red background, values in the top 25% have a green background and values in the middle have no color. A gray background is used for values that can be ignored because the DBMS did not sustain the target insert rate. Red backgrounds are not used when the minimum value is within 80% of the max value.
| dbms | l.i0 | l.x | l.i1 | q100.1 | q500.1 | q1000.1 |
|---|---|---|---|---|---|---|
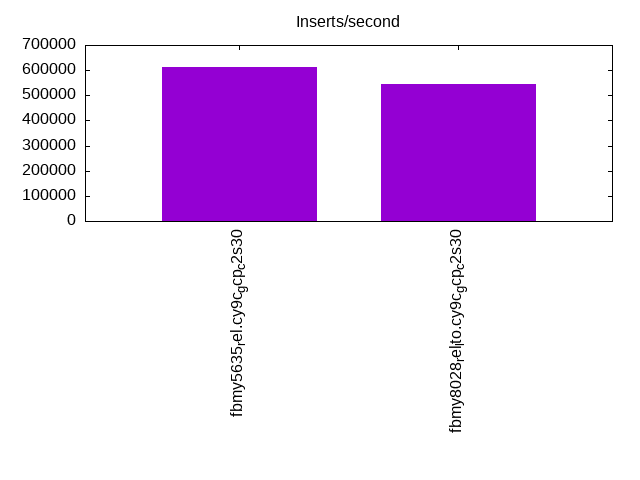
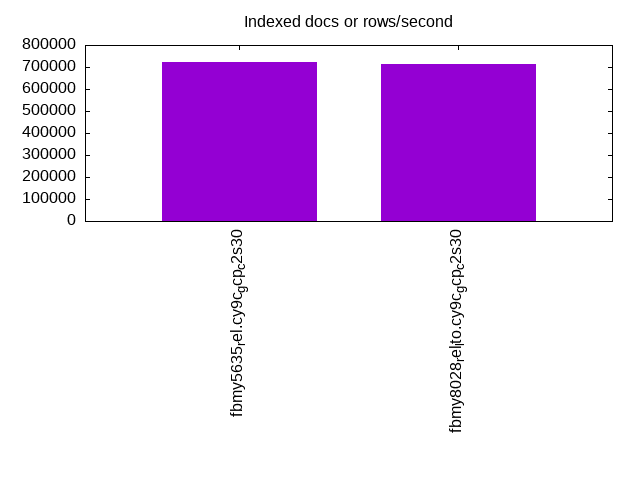
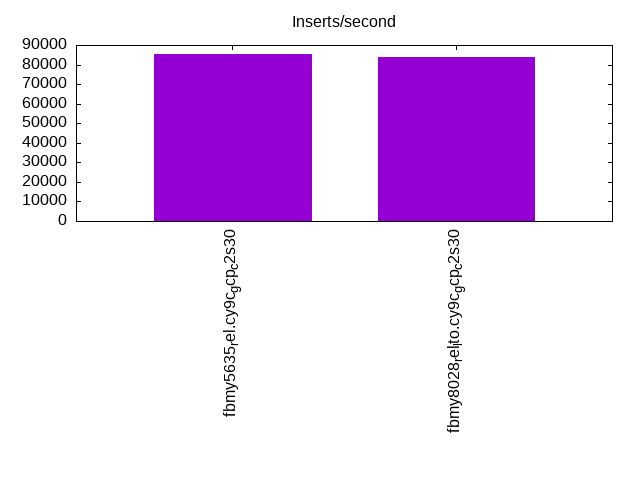
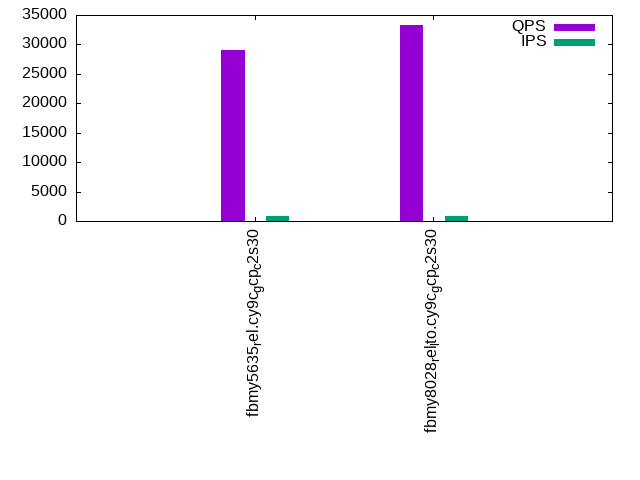
| fbmy5635_rel.cy9c_gcp_c2s30 | 613215 | 721389 | 85561 | 28975 | 28827 | 27895 |
| fbmy8028_rel_lto.cy9c_gcp_c2s30 | 544811 | 712395 | 83647 | 33322 | 33199 | 31966 |
This table has relative throughput, throughput for the DBMS relative to the DBMS in the first line, using the absolute throughput from the previous table. Values less than 0.95 have a yellow background. Values greater than 1.05 have a blue background.
| dbms | l.i0 | l.x | l.i1 | q100.1 | q500.1 | q1000.1 |
|---|---|---|---|---|---|---|
| fbmy5635_rel.cy9c_gcp_c2s30 | 1.00 | 1.00 | 1.00 | 1.00 | 1.00 | 1.00 |
| fbmy8028_rel_lto.cy9c_gcp_c2s30 | 0.89 | 0.99 | 0.98 | 1.15 | 1.15 | 1.15 |
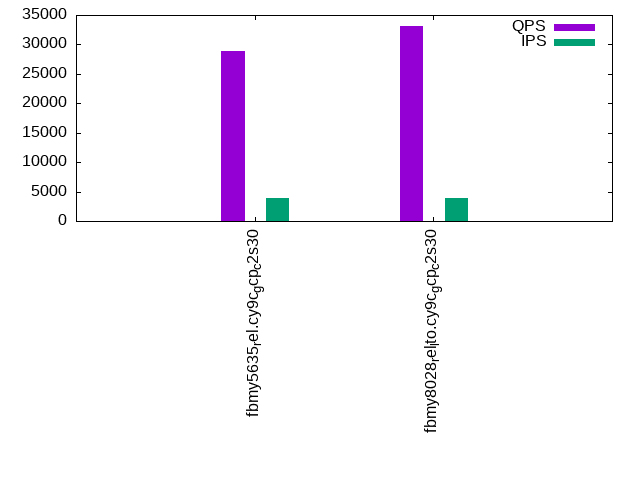
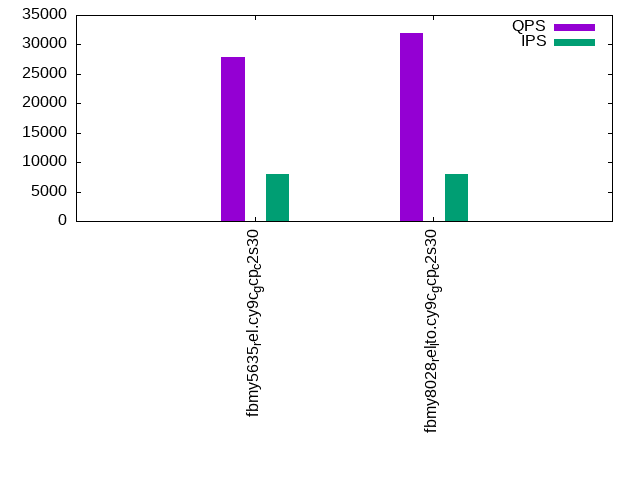
This lists the average rate of inserts/s for the tests that do inserts concurrent with queries. For such tests the query rate is listed in the table above. The read+write tests are setup so that the insert rate should match the target rate every second. Cells that are not at least 95% of the target have a red background to indicate a failure to satisfy the target.
| dbms | q100.1 | q500.1 | q1000.1 |
|---|---|---|---|
| fbmy5635_rel.cy9c_gcp_c2s30 | 797 | 3987 | 7973 |
| fbmy8028_rel_lto.cy9c_gcp_c2s30 | 797 | 3987 | 7976 |
| target | 800 | 4000 | 8000 |
l.i0
l.i0: load without secondary indexes. Graphs for performance per 1-second interval are here.
Average throughput:
Insert response time histogram: each cell has the percentage of responses that take <= the time in the header and max is the max response time in seconds. For the max column values in the top 25% of the range have a red background and in the bottom 25% of the range have a green background. The red background is not used when the min value is within 80% of the max value.
| dbms | 256us | 1ms | 4ms | 16ms | 64ms | 256ms | 1s | 4s | 16s | gt | max |
|---|---|---|---|---|---|---|---|---|---|---|---|
| fbmy5635_rel.cy9c_gcp_c2s30 | 20.350 | 79.623 | 0.012 | 0.001 | 0.013 | 0.001 | 0.568 | ||||
| fbmy8028_rel_lto.cy9c_gcp_c2s30 | 10.198 | 89.627 | 0.155 | 0.006 | 0.014 | nonzero | 0.326 |
Performance metrics for the DBMS listed above. Some are normalized by throughput, others are not. Legend for results is here.
ips	qps	rps	rmbps	wps	wmbps	rpq	rkbpq	wpi	wkbpi	csps	cpups	cspq	cpupq	dbgb1	dbgb2	rss	maxop	p50	p99	tag
613215	0	0	0.0	582.6	130.1	0.000	0.000	0.001	0.217	86188	73.1	0.141	18	125.0	126.6	25.4	0.568	76517	55640	4000m.fbmy5635_rel.cy9c_gcp_c2s30
544811	0	1	0.1	542.4	116.6	0.000	0.000	0.001	0.219	70962	71.5	0.130	20	123.4	123.6	25.5	0.326	68626	51445	4000m.fbmy8028_rel_lto.cy9c_gcp_c2s30
l.x
l.x: create secondary indexes.
Average throughput:
Performance metrics for the DBMS listed above. Some are normalized by throughput, others are not. Legend for results is here.
ips	qps	rps	rmbps	wps	wmbps	rpq	rkbpq	wpi	wkbpi	csps	cpups	cspq	cpupq	dbgb1	dbgb2	rss	maxop	p50	p99	tag
721389	0	489	115.0	283.3	79.2	0.001	0.163	0.000	0.112	2197	50.1	0.003	10	257.4	258.9	81.0	0.002	NA	NA	4000m.fbmy5635_rel.cy9c_gcp_c2s30
712395	0	508	108.1	279.8	74.9	0.001	0.155	0.000	0.108	2313	50.0	0.003	11	255.7	256.0	93.9	0.002	NA	NA	4000m.fbmy8028_rel_lto.cy9c_gcp_c2s30
l.i1
l.i1: continue load after secondary indexes created. Graphs for performance per 1-second interval are here.
Average throughput:
Insert response time histogram: each cell has the percentage of responses that take <= the time in the header and max is the max response time in seconds. For the max column values in the top 25% of the range have a red background and in the bottom 25% of the range have a green background. The red background is not used when the min value is within 80% of the max value.
| dbms | 256us | 1ms | 4ms | 16ms | 64ms | 256ms | 1s | 4s | 16s | gt | max |
|---|---|---|---|---|---|---|---|---|---|---|---|
| fbmy5635_rel.cy9c_gcp_c2s30 | 0.034 | 38.737 | 60.826 | 0.367 | 0.035 | 0.001 | 0.429 | ||||
| fbmy8028_rel_lto.cy9c_gcp_c2s30 | 0.016 | 50.902 | 48.018 | 0.883 | 0.179 | 0.002 | nonzero | 1.066 |
Delete response time histogram: each cell has the percentage of responses that take <= the time in the header and max is the max response time in seconds. For the max column values in the top 25% of the range have a red background and in the bottom 25% of the range have a green background. The red background is not used when the min value is within 80% of the max value.
| dbms | 256us | 1ms | 4ms | 16ms | 64ms | 256ms | 1s | 4s | 16s | gt | max |
|---|---|---|---|---|---|---|---|---|---|---|---|
| fbmy5635_rel.cy9c_gcp_c2s30 | 0.025 | 34.104 | 65.299 | 0.517 | 0.053 | 0.002 | 0.466 | ||||
| fbmy8028_rel_lto.cy9c_gcp_c2s30 | 0.021 | 44.172 | 54.553 | 1.051 | 0.200 | 0.003 | nonzero | 1.066 |
Performance metrics for the DBMS listed above. Some are normalized by throughput, others are not. Legend for results is here.
ips	qps	rps	rmbps	wps	wmbps	rpq	rkbpq	wpi	wkbpi	csps	cpups	cspq	cpupq	dbgb1	dbgb2	rss	maxop	p50	p99	tag
85561	0	543	40.4	614.0	131.0	0.006	0.483	0.007	1.568	73437	62.3	0.858	109	284.7	286.1	80.9	0.429	10589	1249	4000m.fbmy5635_rel.cy9c_gcp_c2s30
83647	0	548	38.5	600.0	118.4	0.007	0.471	0.007	1.450	65981	62.8	0.789	113	286.1	287.9	81.7	1.066	11238	350	4000m.fbmy8028_rel_lto.cy9c_gcp_c2s30
q100.1
q100.1: range queries with 100 insert/s per client. Graphs for performance per 1-second interval are here.
Average throughput:
Query response time histogram: each cell has the percentage of responses that take <= the time in the header and max is the max response time in seconds. For max values in the top 25% of the range have a red background and in the bottom 25% of the range have a green background. The red background is not used when the min value is within 80% of the max value.
| dbms | 256us | 1ms | 4ms | 16ms | 64ms | 256ms | 1s | 4s | 16s | gt | max |
|---|---|---|---|---|---|---|---|---|---|---|---|
| fbmy5635_rel.cy9c_gcp_c2s30 | 66.943 | 32.582 | 0.474 | 0.001 | nonzero | 0.064 | |||||
| fbmy8028_rel_lto.cy9c_gcp_c2s30 | 74.107 | 25.468 | 0.423 | 0.002 | nonzero | nonzero | 0.094 |
Insert response time histogram: each cell has the percentage of responses that take <= the time in the header and max is the max response time in seconds. For max values in the top 25% of the range have a red background and in the bottom 25% of the range have a green background. The red background is not used when the min value is within 80% of the max value.
| dbms | 256us | 1ms | 4ms | 16ms | 64ms | 256ms | 1s | 4s | 16s | gt | max |
|---|---|---|---|---|---|---|---|---|---|---|---|
| fbmy5635_rel.cy9c_gcp_c2s30 | 7.174 | 92.686 | 0.128 | 0.009 | 0.003 | 0.077 | |||||
| fbmy8028_rel_lto.cy9c_gcp_c2s30 | 4.646 | 95.344 | 0.005 | 0.005 | 0.047 |
Delete response time histogram: each cell has the percentage of responses that take <= the time in the header and max is the max response time in seconds. For max values in the top 25% of the range have a red background and in the bottom 25% of the range have a green background. The red background is not used when the min value is within 80% of the max value.
| dbms | 256us | 1ms | 4ms | 16ms | 64ms | 256ms | 1s | 4s | 16s | gt | max |
|---|---|---|---|---|---|---|---|---|---|---|---|
| fbmy5635_rel.cy9c_gcp_c2s30 | 6.377 | 93.406 | 0.203 | 0.010 | 0.003 | 0.077 | |||||
| fbmy8028_rel_lto.cy9c_gcp_c2s30 | 12.247 | 87.726 | 0.023 | 0.005 | 0.049 |
Performance metrics for the DBMS listed above. Some are normalized by throughput, others are not. Legend for results is here.
ips	qps	rps	rmbps	wps	wmbps	rpq	rkbpq	wpi	wkbpi	csps	cpups	cspq	cpupq	dbgb1	dbgb2	rss	maxop	p50	p99	tag
797	28975	1218	11.6	17.3	2.7	0.042	0.412	0.022	3.415	115852	52.1	3.998	270	281.1	281.2	82.3	0.064	3645	1566	4000m.fbmy5635_rel.cy9c_gcp_c2s30
797	33322	1272	13.8	29.2	4.7	0.038	0.425	0.037	6.030	132268	53.5	3.969	241	281.0	281.4	82.7	0.094	4155	1406	4000m.fbmy8028_rel_lto.cy9c_gcp_c2s30
q500.1
q500.1: range queries with 500 insert/s per client. Graphs for performance per 1-second interval are here.
Average throughput:
Query response time histogram: each cell has the percentage of responses that take <= the time in the header and max is the max response time in seconds. For max values in the top 25% of the range have a red background and in the bottom 25% of the range have a green background. The red background is not used when the min value is within 80% of the max value.
| dbms | 256us | 1ms | 4ms | 16ms | 64ms | 256ms | 1s | 4s | 16s | gt | max |
|---|---|---|---|---|---|---|---|---|---|---|---|
| fbmy5635_rel.cy9c_gcp_c2s30 | 60.515 | 39.474 | 0.010 | nonzero | 0.001 | 0.035 | |||||
| fbmy8028_rel_lto.cy9c_gcp_c2s30 | 74.477 | 25.513 | 0.009 | nonzero | nonzero | 0.035 |
Insert response time histogram: each cell has the percentage of responses that take <= the time in the header and max is the max response time in seconds. For max values in the top 25% of the range have a red background and in the bottom 25% of the range have a green background. The red background is not used when the min value is within 80% of the max value.
| dbms | 256us | 1ms | 4ms | 16ms | 64ms | 256ms | 1s | 4s | 16s | gt | max |
|---|---|---|---|---|---|---|---|---|---|---|---|
| fbmy5635_rel.cy9c_gcp_c2s30 | 8.052 | 91.188 | 0.758 | 0.002 | 0.055 | ||||||
| fbmy8028_rel_lto.cy9c_gcp_c2s30 | 10.027 | 89.757 | 0.215 | 0.001 | 0.031 |
Delete response time histogram: each cell has the percentage of responses that take <= the time in the header and max is the max response time in seconds. For max values in the top 25% of the range have a red background and in the bottom 25% of the range have a green background. The red background is not used when the min value is within 80% of the max value.
| dbms | 256us | 1ms | 4ms | 16ms | 64ms | 256ms | 1s | 4s | 16s | gt | max |
|---|---|---|---|---|---|---|---|---|---|---|---|
| fbmy5635_rel.cy9c_gcp_c2s30 | 10.657 | 88.523 | 0.812 | 0.008 | 0.054 | ||||||
| fbmy8028_rel_lto.cy9c_gcp_c2s30 | 23.253 | 76.543 | 0.197 | 0.007 | 0.038 |
Performance metrics for the DBMS listed above. Some are normalized by throughput, others are not. Legend for results is here.
ips	qps	rps	rmbps	wps	wmbps	rpq	rkbpq	wpi	wkbpi	csps	cpups	cspq	cpupq	dbgb1	dbgb2	rss	maxop	p50	p99	tag
3987	28827	201	4.0	47.1	8.2	0.007	0.143	0.012	2.102	114845	55.5	3.984	289	281.1	282.2	83.4	0.035	3532	3181	4000m.fbmy5635_rel.cy9c_gcp_c2s30
3987	33199	185	4.0	46.6	7.5	0.006	0.122	0.012	1.933	131328	56.1	3.956	253	281.1	282.6	84.1	0.035	4044	3644	4000m.fbmy8028_rel_lto.cy9c_gcp_c2s30
q1000.1
q1000.1: range queries with 1000 insert/s per client. Graphs for performance per 1-second interval are here.
Average throughput:
Query response time histogram: each cell has the percentage of responses that take <= the time in the header and max is the max response time in seconds. For max values in the top 25% of the range have a red background and in the bottom 25% of the range have a green background. The red background is not used when the min value is within 80% of the max value.
| dbms | 256us | 1ms | 4ms | 16ms | 64ms | 256ms | 1s | 4s | 16s | gt | max |
|---|---|---|---|---|---|---|---|---|---|---|---|
| fbmy5635_rel.cy9c_gcp_c2s30 | 49.298 | 50.682 | 0.019 | 0.001 | nonzero | nonzero | 0.088 | ||||
| fbmy8028_rel_lto.cy9c_gcp_c2s30 | 72.738 | 27.239 | 0.023 | nonzero | nonzero | 0.042 |
Insert response time histogram: each cell has the percentage of responses that take <= the time in the header and max is the max response time in seconds. For max values in the top 25% of the range have a red background and in the bottom 25% of the range have a green background. The red background is not used when the min value is within 80% of the max value.
| dbms | 256us | 1ms | 4ms | 16ms | 64ms | 256ms | 1s | 4s | 16s | gt | max |
|---|---|---|---|---|---|---|---|---|---|---|---|
| fbmy5635_rel.cy9c_gcp_c2s30 | 7.225 | 92.156 | 0.616 | 0.003 | 0.033 | ||||||
| fbmy8028_rel_lto.cy9c_gcp_c2s30 | 6.177 | 87.053 | 6.758 | 0.012 | 0.030 |
Delete response time histogram: each cell has the percentage of responses that take <= the time in the header and max is the max response time in seconds. For max values in the top 25% of the range have a red background and in the bottom 25% of the range have a green background. The red background is not used when the min value is within 80% of the max value.
| dbms | 256us | 1ms | 4ms | 16ms | 64ms | 256ms | 1s | 4s | 16s | gt | max |
|---|---|---|---|---|---|---|---|---|---|---|---|
| fbmy5635_rel.cy9c_gcp_c2s30 | 7.695 | 91.496 | 0.797 | 0.012 | 0.055 | ||||||
| fbmy8028_rel_lto.cy9c_gcp_c2s30 | 13.888 | 79.763 | 6.333 | 0.017 | 0.051 |
Performance metrics for the DBMS listed above. Some are normalized by throughput, others are not. Legend for results is here.
ips	qps	rps	rmbps	wps	wmbps	rpq	rkbpq	wpi	wkbpi	csps	cpups	cspq	cpupq	dbgb1	dbgb2	rss	maxop	p50	p99	tag
7973	27895	278	6.4	92.6	15.5	0.010	0.233	0.012	1.995	112583	58.9	4.036	317	281.2	282.5	83.6	0.088	3484	3165	4000m.fbmy5635_rel.cy9c_gcp_c2s30
7976	31966	289	6.5	96.2	14.8	0.009	0.209	0.012	1.904	127648	59.4	3.993	279	281.1	282.8	83.7	0.042	3900	3548	4000m.fbmy8028_rel_lto.cy9c_gcp_c2s30
l.i0
l.i0: load without secondary indexes
Performance metrics for all DBMS, not just the ones listed above. Some are normalized by throughput, others are not. Legend for results is here.
ips	qps	rps	rmbps	wps	wmbps	rpq	rkbpq	wpi	wkbpi	csps	cpups	cspq	cpupq	dbgb1	dbgb2	rss	maxop	p50	p99	tag
613215	0	0	0.0	582.6	130.1	0.000	0.000	0.001	0.217	86188	73.1	0.141	18	125.0	126.6	25.4	0.568	76517	55640	4000m.fbmy5635_rel.cy9c_gcp_c2s30
544811	0	1	0.1	542.4	116.6	0.000	0.000	0.001	0.219	70962	71.5	0.130	20	123.4	123.6	25.5	0.326	68626	51445	4000m.fbmy8028_rel_lto.cy9c_gcp_c2s30
l.x
l.x: create secondary indexes
Performance metrics for all DBMS, not just the ones listed above. Some are normalized by throughput, others are not. Legend for results is here.
ips	qps	rps	rmbps	wps	wmbps	rpq	rkbpq	wpi	wkbpi	csps	cpups	cspq	cpupq	dbgb1	dbgb2	rss	maxop	p50	p99	tag
721389	0	489	115.0	283.3	79.2	0.001	0.163	0.000	0.112	2197	50.1	0.003	10	257.4	258.9	81.0	0.002	NA	NA	4000m.fbmy5635_rel.cy9c_gcp_c2s30
712395	0	508	108.1	279.8	74.9	0.001	0.155	0.000	0.108	2313	50.0	0.003	11	255.7	256.0	93.9	0.002	NA	NA	4000m.fbmy8028_rel_lto.cy9c_gcp_c2s30
l.i1
l.i1: continue load after secondary indexes created
Performance metrics for all DBMS, not just the ones listed above. Some are normalized by throughput, others are not. Legend for results is here.
ips	qps	rps	rmbps	wps	wmbps	rpq	rkbpq	wpi	wkbpi	csps	cpups	cspq	cpupq	dbgb1	dbgb2	rss	maxop	p50	p99	tag
85561	0	543	40.4	614.0	131.0	0.006	0.483	0.007	1.568	73437	62.3	0.858	109	284.7	286.1	80.9	0.429	10589	1249	4000m.fbmy5635_rel.cy9c_gcp_c2s30
83647	0	548	38.5	600.0	118.4	0.007	0.471	0.007	1.450	65981	62.8	0.789	113	286.1	287.9	81.7	1.066	11238	350	4000m.fbmy8028_rel_lto.cy9c_gcp_c2s30
q100.1
q100.1: range queries with 100 insert/s per client
Performance metrics for all DBMS, not just the ones listed above. Some are normalized by throughput, others are not. Legend for results is here.
ips	qps	rps	rmbps	wps	wmbps	rpq	rkbpq	wpi	wkbpi	csps	cpups	cspq	cpupq	dbgb1	dbgb2	rss	maxop	p50	p99	tag
797	28975	1218	11.6	17.3	2.7	0.042	0.412	0.022	3.415	115852	52.1	3.998	270	281.1	281.2	82.3	0.064	3645	1566	4000m.fbmy5635_rel.cy9c_gcp_c2s30
797	33322	1272	13.8	29.2	4.7	0.038	0.425	0.037	6.030	132268	53.5	3.969	241	281.0	281.4	82.7	0.094	4155	1406	4000m.fbmy8028_rel_lto.cy9c_gcp_c2s30
q500.1
q500.1: range queries with 500 insert/s per client
Performance metrics for all DBMS, not just the ones listed above. Some are normalized by throughput, others are not. Legend for results is here.
ips	qps	rps	rmbps	wps	wmbps	rpq	rkbpq	wpi	wkbpi	csps	cpups	cspq	cpupq	dbgb1	dbgb2	rss	maxop	p50	p99	tag
3987	28827	201	4.0	47.1	8.2	0.007	0.143	0.012	2.102	114845	55.5	3.984	289	281.1	282.2	83.4	0.035	3532	3181	4000m.fbmy5635_rel.cy9c_gcp_c2s30
3987	33199	185	4.0	46.6	7.5	0.006	0.122	0.012	1.933	131328	56.1	3.956	253	281.1	282.6	84.1	0.035	4044	3644	4000m.fbmy8028_rel_lto.cy9c_gcp_c2s30
q1000.1
q1000.1: range queries with 1000 insert/s per client
Performance metrics for all DBMS, not just the ones listed above. Some are normalized by throughput, others are not. Legend for results is here.
ips	qps	rps	rmbps	wps	wmbps	rpq	rkbpq	wpi	wkbpi	csps	cpups	cspq	cpupq	dbgb1	dbgb2	rss	maxop	p50	p99	tag
7973	27895	278	6.4	92.6	15.5	0.010	0.233	0.012	1.995	112583	58.9	4.036	317	281.2	282.5	83.6	0.088	3484	3165	4000m.fbmy5635_rel.cy9c_gcp_c2s30
7976	31966	289	6.5	96.2	14.8	0.009	0.209	0.012	1.904	127648	59.4	3.993	279	281.1	282.8	83.7	0.042	3900	3548	4000m.fbmy8028_rel_lto.cy9c_gcp_c2s30
l.i0
- l.i0: load without secondary indexes
- Legend for results is here.
- Each entry lists the percentage of responses that fit in that bucket (slower than max time for previous bucket, faster than min time for next bucket).
Insert response time histogram
256us	1ms	4ms	16ms	64ms	256ms	1s	4s	16s	gt	max	tag
0.000	20.350	79.623	0.012	0.001	0.013	0.001	0.000	0.000	0.000	0.568	fbmy5635_rel.cy9c_gcp_c2s30
0.000	10.198	89.627	0.155	0.006	0.014	nonzero	0.000	0.000	0.000	0.326	fbmy8028_rel_lto.cy9c_gcp_c2s30
l.x
- l.x: create secondary indexes
- Legend for results is here.
- Each entry lists the percentage of responses that fit in that bucket (slower than max time for previous bucket, faster than min time for next bucket).
TODO - determine whether there is data for create index response time
l.i1
- l.i1: continue load after secondary indexes created
- Legend for results is here.
- Each entry lists the percentage of responses that fit in that bucket (slower than max time for previous bucket, faster than min time for next bucket).
Insert response time histogram
256us	1ms	4ms	16ms	64ms	256ms	1s	4s	16s	gt	max	tag
0.000	0.034	38.737	60.826	0.367	0.035	0.001	0.000	0.000	0.000	0.429	fbmy5635_rel.cy9c_gcp_c2s30
0.000	0.016	50.902	48.018	0.883	0.179	0.002	nonzero	0.000	0.000	1.066	fbmy8028_rel_lto.cy9c_gcp_c2s30
Delete response time histogram
256us	1ms	4ms	16ms	64ms	256ms	1s	4s	16s	gt	max	tag
0.000	0.025	34.104	65.299	0.517	0.053	0.002	0.000	0.000	0.000	0.466	fbmy5635_rel.cy9c_gcp_c2s30
0.000	0.021	44.172	54.553	1.051	0.200	0.003	nonzero	0.000	0.000	1.066	fbmy8028_rel_lto.cy9c_gcp_c2s30
q100.1
- q100.1: range queries with 100 insert/s per client
- Legend for results is here.
- Each entry lists the percentage of responses that fit in that bucket (slower than max time for previous bucket, faster than min time for next bucket).
Query response time histogram
256us	1ms	4ms	16ms	64ms	256ms	1s	4s	16s	gt	max	tag
66.943	32.582	0.474	0.001	nonzero	0.000	0.000	0.000	0.000	0.000	0.064	fbmy5635_rel.cy9c_gcp_c2s30
74.107	25.468	0.423	0.002	nonzero	nonzero	0.000	0.000	0.000	0.000	0.094	fbmy8028_rel_lto.cy9c_gcp_c2s30
Insert response time histogram
256us	1ms	4ms	16ms	64ms	256ms	1s	4s	16s	gt	max	tag
0.000	7.174	92.686	0.128	0.009	0.003	0.000	0.000	0.000	0.000	0.077	fbmy5635_rel.cy9c_gcp_c2s30
0.000	4.646	95.344	0.005	0.005	0.000	0.000	0.000	0.000	0.000	0.047	fbmy8028_rel_lto.cy9c_gcp_c2s30
Delete response time histogram
256us	1ms	4ms	16ms	64ms	256ms	1s	4s	16s	gt	max	tag
0.000	6.377	93.406	0.203	0.010	0.003	0.000	0.000	0.000	0.000	0.077	fbmy5635_rel.cy9c_gcp_c2s30
0.000	12.247	87.726	0.023	0.005	0.000	0.000	0.000	0.000	0.000	0.049	fbmy8028_rel_lto.cy9c_gcp_c2s30
q500.1
- q500.1: range queries with 500 insert/s per client
- Legend for results is here.
- Each entry lists the percentage of responses that fit in that bucket (slower than max time for previous bucket, faster than min time for next bucket).
Query response time histogram
256us	1ms	4ms	16ms	64ms	256ms	1s	4s	16s	gt	max	tag
60.515	39.474	0.010	nonzero	0.001	0.000	0.000	0.000	0.000	0.000	0.035	fbmy5635_rel.cy9c_gcp_c2s30
74.477	25.513	0.009	nonzero	nonzero	0.000	0.000	0.000	0.000	0.000	0.035	fbmy8028_rel_lto.cy9c_gcp_c2s30
Insert response time histogram
256us	1ms	4ms	16ms	64ms	256ms	1s	4s	16s	gt	max	tag
0.000	8.052	91.188	0.758	0.002	0.000	0.000	0.000	0.000	0.000	0.055	fbmy5635_rel.cy9c_gcp_c2s30
0.000	10.027	89.757	0.215	0.001	0.000	0.000	0.000	0.000	0.000	0.031	fbmy8028_rel_lto.cy9c_gcp_c2s30
Delete response time histogram
256us	1ms	4ms	16ms	64ms	256ms	1s	4s	16s	gt	max	tag
0.000	10.657	88.523	0.812	0.008	0.000	0.000	0.000	0.000	0.000	0.054	fbmy5635_rel.cy9c_gcp_c2s30
0.000	23.253	76.543	0.197	0.007	0.000	0.000	0.000	0.000	0.000	0.038	fbmy8028_rel_lto.cy9c_gcp_c2s30
q1000.1
- q1000.1: range queries with 1000 insert/s per client
- Legend for results is here.
- Each entry lists the percentage of responses that fit in that bucket (slower than max time for previous bucket, faster than min time for next bucket).
Query response time histogram
256us	1ms	4ms	16ms	64ms	256ms	1s	4s	16s	gt	max	tag
49.298	50.682	0.019	0.001	nonzero	nonzero	0.000	0.000	0.000	0.000	0.088	fbmy5635_rel.cy9c_gcp_c2s30
72.738	27.239	0.023	nonzero	nonzero	0.000	0.000	0.000	0.000	0.000	0.042	fbmy8028_rel_lto.cy9c_gcp_c2s30
Insert response time histogram
256us	1ms	4ms	16ms	64ms	256ms	1s	4s	16s	gt	max	tag
0.000	7.225	92.156	0.616	0.003	0.000	0.000	0.000	0.000	0.000	0.033	fbmy5635_rel.cy9c_gcp_c2s30
0.000	6.177	87.053	6.758	0.012	0.000	0.000	0.000	0.000	0.000	0.030	fbmy8028_rel_lto.cy9c_gcp_c2s30
Delete response time histogram
256us	1ms	4ms	16ms	64ms	256ms	1s	4s	16s	gt	max	tag
0.000	7.695	91.496	0.797	0.012	0.000	0.000	0.000	0.000	0.000	0.055	fbmy5635_rel.cy9c_gcp_c2s30
0.000	13.888	79.763	6.333	0.017	0.000	0.000	0.000	0.000	0.000	0.051	fbmy8028_rel_lto.cy9c_gcp_c2s30