Introduction
This is a report for the insert benchmark with 160M docs and 8 client(s). It is generated by scripts (bash, awk, sed) and Tufte might not be impressed. An overview of the insert benchmark is here and a short update is here. Below, by DBMS, I mean DBMS+version.config. An example is my8020.c10b40 where my means MySQL, 8020 is version 8.0.20 and c10b40 is the name for the configuration file.
The test server is a c2-standard-30 from GCP with 15 cores, hyperthreads disabled, 120G RAM, XFS + SW RAID 0 on 4 NVMe devices (1.5TB). The benchmark was run with 8 client and there were 1 or 3 connections per client (1 for queries or inserts without rate limits, 1+1 for rate limited inserts+deletes). There are 8 tables, client per table. It loads 20M rows per table without secondary indexes, creates secondary indexes, then inserts 50M rows with a delete per insert to avoid growing the table. It then does 3 read+write tests for 3600s each that do queries as fast as possible with 100, 500 and then 1000 inserts/second/client concurrent with the queries and 1000 deletes/second to avoid growing the table. The database is cached by MyRocks and the only IO is for writes.
The tested DBMS are:
- fbmy5635_rel.cy9c_gcp_c2s30_old - MyRocks and FB MySQL 5.6.35, rel build, cy9c_gcp_c2s30 config, old build from Mar 2023
- fbmy5635_rel.cy9c_gcp_c2s30_new - MyRocks and FB MySQL 5.6.35, rel build, cy9c_gcp_c2s30 config, new build from Jun 2023 with RocksDB 8.2.1
- fbmy8028_rel_lto.cy9c_gcp_c2s30_old - MyRocks and FB MySQL 8.0.28, rel build, cy9c_gcp_c2s30 config, old build from Mar 2023
- fbmy8028_rel_lto.cy9c_gcp_c2s30_new - MyRocks and FB MySQL 8.0.28, rel build, cy9c_gcp_c2s30 config, new build from Jun 2023 with RocksDB 8.3.1
Contents
- Summary
- l.i0: load without secondary indexes
- l.x: create secondary indexes
- l.i1: continue load after secondary indexes created
- q100.1: range queries with 100 insert/s per client
- q500.1: range queries with 500 insert/s per client
- q1000.1: range queries with 1000 insert/s per client
Summary
The numbers are inserts/s for l.i0 and l.i1, indexed docs (or rows) /s for l.x and queries/s for q*.2. The values are the average rate over the entire test for inserts (IPS) and queries (QPS). The range of values for IPS and QPS is split into 3 parts: bottom 25%, middle 50%, top 25%. Values in the bottom 25% have a red background, values in the top 25% have a green background and values in the middle have no color. A gray background is used for values that can be ignored because the DBMS did not sustain the target insert rate. Red backgrounds are not used when the minimum value is within 80% of the max value.
| dbms | l.i0 | l.x | l.i1 | q100.1 | q500.1 | q1000.1 |
|---|---|---|---|---|---|---|
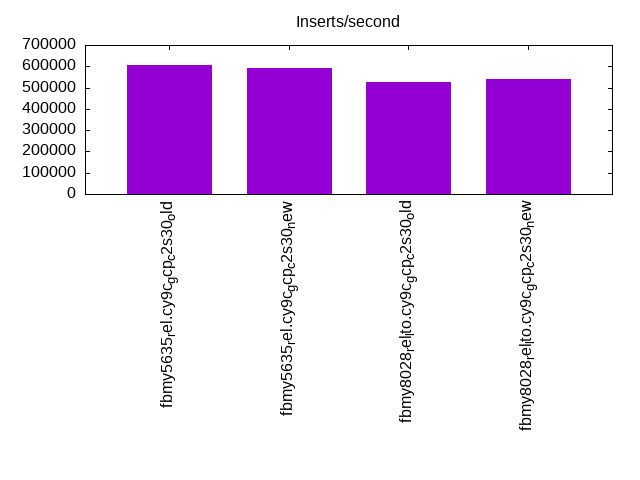
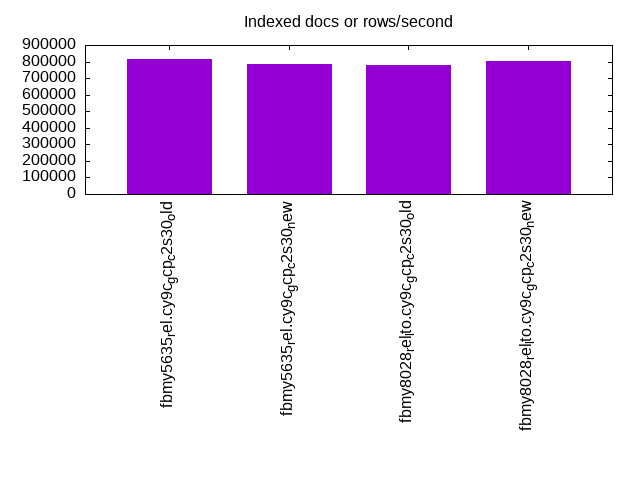
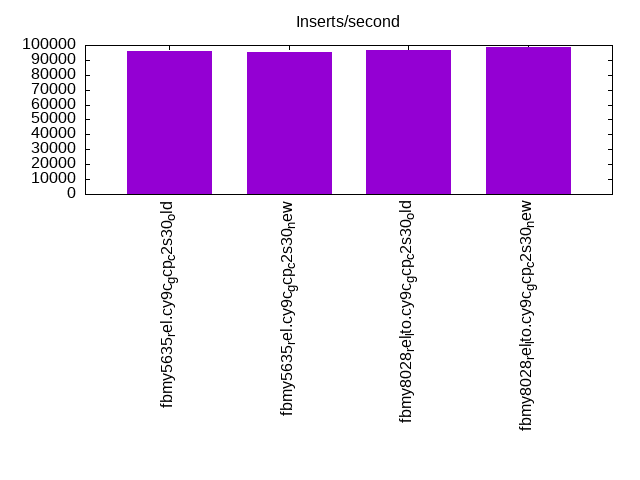
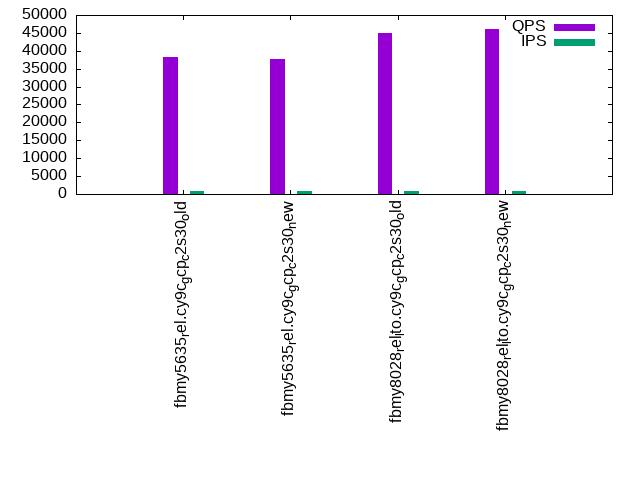
| fbmy5635_rel.cy9c_gcp_c2s30_old | 606061 | 812690 | 96223 | 38202 | 37164 | 35696 |
| fbmy5635_rel.cy9c_gcp_c2s30_new | 590406 | 784804 | 95488 | 37743 | 36443 | 34891 |
| fbmy8028_rel_lto.cy9c_gcp_c2s30_old | 524590 | 780976 | 96595 | 45026 | 43489 | 41868 |
| fbmy8028_rel_lto.cy9c_gcp_c2s30_new | 538720 | 804523 | 98595 | 46193 | 44950 | 43168 |
This table has relative throughput, throughput for the DBMS relative to the DBMS in the first line, using the absolute throughput from the previous table. Values less than 0.95 have a yellow background. Values greater than 1.05 have a blue background.
| dbms | l.i0 | l.x | l.i1 | q100.1 | q500.1 | q1000.1 |
|---|---|---|---|---|---|---|
| fbmy5635_rel.cy9c_gcp_c2s30_old | 1.00 | 1.00 | 1.00 | 1.00 | 1.00 | 1.00 |
| fbmy5635_rel.cy9c_gcp_c2s30_new | 0.97 | 0.97 | 0.99 | 0.99 | 0.98 | 0.98 |
| fbmy8028_rel_lto.cy9c_gcp_c2s30_old | 0.87 | 0.96 | 1.00 | 1.18 | 1.17 | 1.17 |
| fbmy8028_rel_lto.cy9c_gcp_c2s30_new | 0.89 | 0.99 | 1.02 | 1.21 | 1.21 | 1.21 |
This lists the average rate of inserts/s for the tests that do inserts concurrent with queries. For such tests the query rate is listed in the table above. The read+write tests are setup so that the insert rate should match the target rate every second. Cells that are not at least 95% of the target have a red background to indicate a failure to satisfy the target.
| dbms | q100.1 | q500.1 | q1000.1 |
|---|---|---|---|
| fbmy5635_rel.cy9c_gcp_c2s30_old | 797 | 3987 | 7973 |
| fbmy5635_rel.cy9c_gcp_c2s30_new | 797 | 3987 | 7971 |
| fbmy8028_rel_lto.cy9c_gcp_c2s30_old | 797 | 3987 | 7973 |
| fbmy8028_rel_lto.cy9c_gcp_c2s30_new | 797 | 3987 | 7973 |
| target | 800 | 4000 | 8000 |
l.i0
l.i0: load without secondary indexes. Graphs for performance per 1-second interval are here.
Average throughput:
Insert response time histogram: each cell has the percentage of responses that take <= the time in the header and max is the max response time in seconds. For the max column values in the top 25% of the range have a red background and in the bottom 25% of the range have a green background. The red background is not used when the min value is within 80% of the max value.
| dbms | 256us | 1ms | 4ms | 16ms | 64ms | 256ms | 1s | 4s | 16s | gt | max |
|---|---|---|---|---|---|---|---|---|---|---|---|
| fbmy5635_rel.cy9c_gcp_c2s30_old | 22.690 | 77.286 | 0.009 | 0.001 | 0.012 | 0.001 | 0.296 | ||||
| fbmy5635_rel.cy9c_gcp_c2s30_new | 21.011 | 78.964 | 0.009 | 0.002 | 0.013 | nonzero | 0.408 | ||||
| fbmy8028_rel_lto.cy9c_gcp_c2s30_old | 12.788 | 87.044 | 0.145 | 0.009 | 0.013 | 0.001 | 0.261 | ||||
| fbmy8028_rel_lto.cy9c_gcp_c2s30_new | 13.474 | 86.355 | 0.151 | 0.006 | 0.015 | nonzero | 0.257 |
Performance metrics for the DBMS listed above. Some are normalized by throughput, others are not. Legend for results is here.
ips	qps	rps	rmbps	wps	wmbps	rpq	rkbpq	wpi	wkbpi	csps	cpups	cspq	cpupq	dbgb1	dbgb2	rss	maxop	p50	p99	tag
606061	0	0	0.0	520.9	147.6	0.000	0.000	0.001	0.249	81739	70.9	0.135	18	5.2	6.6	1.4	0.296	80207	55739	160m.fbmy5635_rel.cy9c_gcp_c2s30_old
590406	0	0	0.0	499.4	158.3	0.000	0.000	0.001	0.275	80086	70.1	0.136	18	5.4	6.9	1.5	0.408	77117	54241	160m.fbmy5635_rel.cy9c_gcp_c2s30_new
524590	0	0	0.0	474.9	130.4	0.000	0.000	0.001	0.254	67660	70.5	0.129	20	5.2	6.9	1.8	0.261	67927	52261	160m.fbmy8028_rel_lto.cy9c_gcp_c2s30_old
538720	0	0	0.0	454.5	141.1	0.000	0.000	0.001	0.268	69666	69.0	0.129	19	5.2	6.9	1.8	0.257	70825	47749	160m.fbmy8028_rel_lto.cy9c_gcp_c2s30_new
l.x
l.x: create secondary indexes.
Average throughput:
Performance metrics for the DBMS listed above. Some are normalized by throughput, others are not. Legend for results is here.
ips	qps	rps	rmbps	wps	wmbps	rpq	rkbpq	wpi	wkbpi	csps	cpups	cspq	cpupq	dbgb1	dbgb2	rss	maxop	p50	p99	tag
812690	0	1	0.1	302.8	106.7	0.000	0.000	0.000	0.134	1052	50.0	0.001	9	10.8	12.3	9.7	0.002	NA	NA	160m.fbmy5635_rel.cy9c_gcp_c2s30_old
784804	0	1	0.1	302.3	105.0	0.000	0.000	0.000	0.137	1224	50.1	0.002	10	10.8	12.3	10.2	0.036	NA	NA	160m.fbmy5635_rel.cy9c_gcp_c2s30_new
780976	0	1	0.1	282.0	106.6	0.000	0.000	0.000	0.140	1465	49.9	0.002	10	10.8	12.5	12.0	0.002	NA	NA	160m.fbmy8028_rel_lto.cy9c_gcp_c2s30_old
804523	0	1	0.1	291.3	107.4	0.000	0.000	0.000	0.137	1508	49.7	0.002	9	10.8	12.5	12.0	0.002	NA	NA	160m.fbmy8028_rel_lto.cy9c_gcp_c2s30_new
l.i1
l.i1: continue load after secondary indexes created. Graphs for performance per 1-second interval are here.
Average throughput:
Insert response time histogram: each cell has the percentage of responses that take <= the time in the header and max is the max response time in seconds. For the max column values in the top 25% of the range have a red background and in the bottom 25% of the range have a green background. The red background is not used when the min value is within 80% of the max value.
| dbms | 256us | 1ms | 4ms | 16ms | 64ms | 256ms | 1s | 4s | 16s | gt | max |
|---|---|---|---|---|---|---|---|---|---|---|---|
| fbmy5635_rel.cy9c_gcp_c2s30_old | 0.028 | 49.089 | 50.801 | 0.069 | 0.013 | 0.001 | 0.379 | ||||
| fbmy5635_rel.cy9c_gcp_c2s30_new | 0.028 | 49.121 | 50.703 | 0.135 | 0.013 | 0.001 | 0.656 | ||||
| fbmy8028_rel_lto.cy9c_gcp_c2s30_old | 0.018 | 55.805 | 43.930 | 0.225 | 0.019 | 0.002 | nonzero | 1.171 | |||
| fbmy8028_rel_lto.cy9c_gcp_c2s30_new | 0.032 | 62.070 | 37.626 | 0.253 | 0.018 | 0.002 | 0.628 |
Delete response time histogram: each cell has the percentage of responses that take <= the time in the header and max is the max response time in seconds. For the max column values in the top 25% of the range have a red background and in the bottom 25% of the range have a green background. The red background is not used when the min value is within 80% of the max value.
| dbms | 256us | 1ms | 4ms | 16ms | 64ms | 256ms | 1s | 4s | 16s | gt | max |
|---|---|---|---|---|---|---|---|---|---|---|---|
| fbmy5635_rel.cy9c_gcp_c2s30_old | 0.027 | 43.902 | 55.982 | 0.072 | 0.015 | 0.001 | 0.379 | ||||
| fbmy5635_rel.cy9c_gcp_c2s30_new | 0.027 | 43.585 | 56.231 | 0.141 | 0.015 | 0.001 | 0.657 | ||||
| fbmy8028_rel_lto.cy9c_gcp_c2s30_old | 0.021 | 51.830 | 47.894 | 0.233 | 0.020 | 0.002 | nonzero | 1.171 | |||
| fbmy8028_rel_lto.cy9c_gcp_c2s30_new | 0.034 | 59.639 | 40.048 | 0.259 | 0.018 | 0.002 | 0.627 |
Performance metrics for the DBMS listed above. Some are normalized by throughput, others are not. Legend for results is here.
ips	qps	rps	rmbps	wps	wmbps	rpq	rkbpq	wpi	wkbpi	csps	cpups	cspq	cpupq	dbgb1	dbgb2	rss	maxop	p50	p99	tag
96223	0	3	1.3	472.7	131.0	0.000	0.014	0.005	1.394	86361	60.9	0.898	95	16.6	17.9	51.9	0.379	12236	8889	160m.fbmy5635_rel.cy9c_gcp_c2s30_old
95488	0	3	1.3	463.0	131.3	0.000	0.014	0.005	1.408	88110	61.6	0.923	97	20.1	21.4	50.7	0.656	12186	7442	160m.fbmy5635_rel.cy9c_gcp_c2s30_new
96595	0	3	1.3	495.6	129.4	0.000	0.014	0.005	1.372	73352	64.8	0.759	101	16.8	18.3	50.4	1.171	12586	3996	160m.fbmy8028_rel_lto.cy9c_gcp_c2s30_old
98595	0	3	1.4	501.0	132.1	0.000	0.014	0.005	1.372	75551	64.3	0.766	98	21.6	23.1	50.4	0.628	12936	3947	160m.fbmy8028_rel_lto.cy9c_gcp_c2s30_new
q100.1
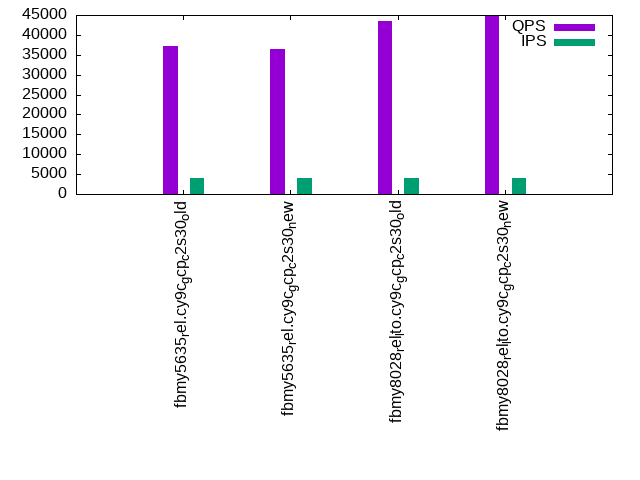
q100.1: range queries with 100 insert/s per client. Graphs for performance per 1-second interval are here.
Average throughput:
Query response time histogram: each cell has the percentage of responses that take <= the time in the header and max is the max response time in seconds. For max values in the top 25% of the range have a red background and in the bottom 25% of the range have a green background. The red background is not used when the min value is within 80% of the max value.
| dbms | 256us | 1ms | 4ms | 16ms | 64ms | 256ms | 1s | 4s | 16s | gt | max |
|---|---|---|---|---|---|---|---|---|---|---|---|
| fbmy5635_rel.cy9c_gcp_c2s30_old | 98.183 | 1.815 | 0.001 | nonzero | nonzero | 0.016 | |||||
| fbmy5635_rel.cy9c_gcp_c2s30_new | 98.185 | 1.814 | 0.001 | nonzero | nonzero | 0.020 | |||||
| fbmy8028_rel_lto.cy9c_gcp_c2s30_old | 99.239 | 0.760 | 0.001 | nonzero | 0.014 | ||||||
| fbmy8028_rel_lto.cy9c_gcp_c2s30_new | 99.133 | 0.866 | 0.001 | nonzero | nonzero | 0.017 |
Insert response time histogram: each cell has the percentage of responses that take <= the time in the header and max is the max response time in seconds. For max values in the top 25% of the range have a red background and in the bottom 25% of the range have a green background. The red background is not used when the min value is within 80% of the max value.
| dbms | 256us | 1ms | 4ms | 16ms | 64ms | 256ms | 1s | 4s | 16s | gt | max |
|---|---|---|---|---|---|---|---|---|---|---|---|
| fbmy5635_rel.cy9c_gcp_c2s30_old | 19.321 | 80.677 | 0.002 | 0.005 | |||||||
| fbmy5635_rel.cy9c_gcp_c2s30_new | 24.672 | 75.321 | 0.005 | 0.002 | 0.020 | ||||||
| fbmy8028_rel_lto.cy9c_gcp_c2s30_old | 15.568 | 84.411 | 0.017 | 0.003 | 0.020 | ||||||
| fbmy8028_rel_lto.cy9c_gcp_c2s30_new | 25.299 | 74.691 | 0.009 | 0.002 | 0.019 |
Delete response time histogram: each cell has the percentage of responses that take <= the time in the header and max is the max response time in seconds. For max values in the top 25% of the range have a red background and in the bottom 25% of the range have a green background. The red background is not used when the min value is within 80% of the max value.
| dbms | 256us | 1ms | 4ms | 16ms | 64ms | 256ms | 1s | 4s | 16s | gt | max |
|---|---|---|---|---|---|---|---|---|---|---|---|
| fbmy5635_rel.cy9c_gcp_c2s30_old | 13.590 | 86.408 | 0.002 | 0.015 | |||||||
| fbmy5635_rel.cy9c_gcp_c2s30_new | 13.436 | 86.557 | 0.005 | 0.002 | 0.020 | ||||||
| fbmy8028_rel_lto.cy9c_gcp_c2s30_old | 29.552 | 70.425 | 0.023 | 0.013 | |||||||
| fbmy8028_rel_lto.cy9c_gcp_c2s30_new | 31.283 | 68.710 | 0.005 | 0.002 | 0.018 |
Performance metrics for the DBMS listed above. Some are normalized by throughput, others are not. Legend for results is here.
ips	qps	rps	rmbps	wps	wmbps	rpq	rkbpq	wpi	wkbpi	csps	cpups	cspq	cpupq	dbgb1	dbgb2	rss	maxop	p50	p99	tag
797	38202	0	0.0	13.6	2.1	0.000	0.000	0.017	2.745	147767	53.5	3.868	210	12.0	13.9	70.2	0.016	4747	3820	160m.fbmy5635_rel.cy9c_gcp_c2s30_old
797	37743	0	0.0	13.0	2.1	0.000	0.000	0.016	2.707	146016	53.4	3.869	212	12.0	13.9	69.7	0.020	4731	3900	160m.fbmy5635_rel.cy9c_gcp_c2s30_new
797	45026	0	0.0	15.7	2.5	0.000	0.000	0.020	3.272	173448	54.9	3.852	183	11.9	14.0	69.3	0.014	5658	3820	160m.fbmy8028_rel_lto.cy9c_gcp_c2s30_old
797	46193	0	0.0	18.1	2.6	0.000	0.000	0.023	3.303	177824	54.7	3.850	178	11.9	14.1	70.8	0.017	5770	3676	160m.fbmy8028_rel_lto.cy9c_gcp_c2s30_new
q500.1
q500.1: range queries with 500 insert/s per client. Graphs for performance per 1-second interval are here.
Average throughput:
Query response time histogram: each cell has the percentage of responses that take <= the time in the header and max is the max response time in seconds. For max values in the top 25% of the range have a red background and in the bottom 25% of the range have a green background. The red background is not used when the min value is within 80% of the max value.
| dbms | 256us | 1ms | 4ms | 16ms | 64ms | 256ms | 1s | 4s | 16s | gt | max |
|---|---|---|---|---|---|---|---|---|---|---|---|
| fbmy5635_rel.cy9c_gcp_c2s30_old | 96.649 | 3.346 | 0.004 | nonzero | nonzero | 0.024 | |||||
| fbmy5635_rel.cy9c_gcp_c2s30_new | 96.211 | 3.785 | 0.004 | nonzero | nonzero | 0.021 | |||||
| fbmy8028_rel_lto.cy9c_gcp_c2s30_old | 98.878 | 1.117 | 0.005 | nonzero | 0.012 | ||||||
| fbmy8028_rel_lto.cy9c_gcp_c2s30_new | 99.431 | 0.565 | 0.003 | nonzero | 0.014 |
Insert response time histogram: each cell has the percentage of responses that take <= the time in the header and max is the max response time in seconds. For max values in the top 25% of the range have a red background and in the bottom 25% of the range have a green background. The red background is not used when the min value is within 80% of the max value.
| dbms | 256us | 1ms | 4ms | 16ms | 64ms | 256ms | 1s | 4s | 16s | gt | max |
|---|---|---|---|---|---|---|---|---|---|---|---|
| fbmy5635_rel.cy9c_gcp_c2s30_old | 16.354 | 83.557 | 0.088 | 0.001 | 0.025 | ||||||
| fbmy5635_rel.cy9c_gcp_c2s30_new | 29.507 | 70.474 | 0.018 | nonzero | 0.031 | ||||||
| fbmy8028_rel_lto.cy9c_gcp_c2s30_old | 15.913 | 83.618 | 0.466 | 0.004 | 0.053 | ||||||
| fbmy8028_rel_lto.cy9c_gcp_c2s30_new | 42.442 | 57.550 | 0.006 | 0.001 | 0.057 |
Delete response time histogram: each cell has the percentage of responses that take <= the time in the header and max is the max response time in seconds. For max values in the top 25% of the range have a red background and in the bottom 25% of the range have a green background. The red background is not used when the min value is within 80% of the max value.
| dbms | 256us | 1ms | 4ms | 16ms | 64ms | 256ms | 1s | 4s | 16s | gt | max |
|---|---|---|---|---|---|---|---|---|---|---|---|
| fbmy5635_rel.cy9c_gcp_c2s30_old | 22.442 | 77.457 | 0.098 | 0.002 | 0.025 | ||||||
| fbmy5635_rel.cy9c_gcp_c2s30_new | 29.112 | 70.856 | 0.031 | 0.001 | 0.031 | ||||||
| fbmy8028_rel_lto.cy9c_gcp_c2s30_old | 29.337 | 70.272 | 0.387 | 0.004 | 0.053 | ||||||
| fbmy8028_rel_lto.cy9c_gcp_c2s30_new | 57.892 | 42.099 | 0.007 | 0.003 | 0.054 |
Performance metrics for the DBMS listed above. Some are normalized by throughput, others are not. Legend for results is here.
ips	qps	rps	rmbps	wps	wmbps	rpq	rkbpq	wpi	wkbpi	csps	cpups	cspq	cpupq	dbgb1	dbgb2	rss	maxop	p50	p99	tag
3987	37164	0	0.0	28.2	7.3	0.000	0.000	0.007	1.884	145017	55.1	3.902	222	12.2	13.2	81.1	0.024	4683	4251	160m.fbmy5635_rel.cy9c_gcp_c2s30_old
3987	36443	0	0.0	27.9	7.5	0.000	0.000	0.007	1.934	142449	55.2	3.909	227	12.1	13.1	81.0	0.021	4571	4140	160m.fbmy5635_rel.cy9c_gcp_c2s30_new
3987	43489	0	0.0	29.3	8.1	0.000	0.000	0.007	2.084	168771	56.5	3.881	195	12.0	13.3	81.6	0.012	5466	4987	160m.fbmy8028_rel_lto.cy9c_gcp_c2s30_old
3987	44950	0	0.0	29.1	7.7	0.000	0.000	0.007	1.985	174484	56.0	3.882	187	12.1	13.3	81.5	0.014	5642	5114	160m.fbmy8028_rel_lto.cy9c_gcp_c2s30_new
q1000.1
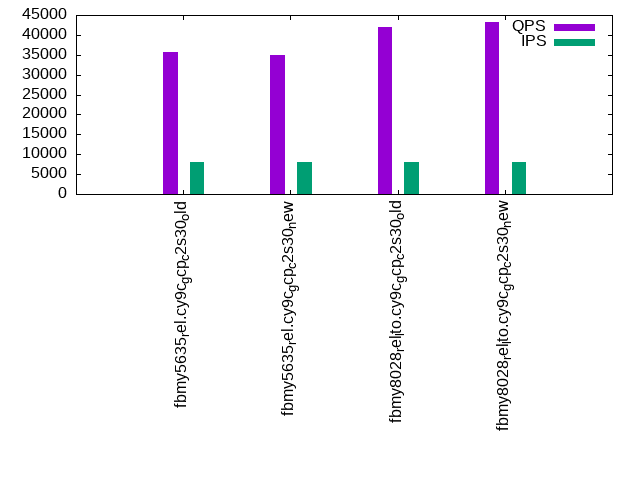
q1000.1: range queries with 1000 insert/s per client. Graphs for performance per 1-second interval are here.
Average throughput:
Query response time histogram: each cell has the percentage of responses that take <= the time in the header and max is the max response time in seconds. For max values in the top 25% of the range have a red background and in the bottom 25% of the range have a green background. The red background is not used when the min value is within 80% of the max value.
| dbms | 256us | 1ms | 4ms | 16ms | 64ms | 256ms | 1s | 4s | 16s | gt | max |
|---|---|---|---|---|---|---|---|---|---|---|---|
| fbmy5635_rel.cy9c_gcp_c2s30_old | 91.599 | 8.393 | 0.008 | nonzero | nonzero | 0.031 | |||||
| fbmy5635_rel.cy9c_gcp_c2s30_new | 89.891 | 10.100 | 0.008 | nonzero | nonzero | 0.033 | |||||
| fbmy8028_rel_lto.cy9c_gcp_c2s30_old | 97.454 | 2.538 | 0.007 | nonzero | nonzero | 0.032 | |||||
| fbmy8028_rel_lto.cy9c_gcp_c2s30_new | 98.299 | 1.694 | 0.007 | nonzero | nonzero | 0.031 |
Insert response time histogram: each cell has the percentage of responses that take <= the time in the header and max is the max response time in seconds. For max values in the top 25% of the range have a red background and in the bottom 25% of the range have a green background. The red background is not used when the min value is within 80% of the max value.
| dbms | 256us | 1ms | 4ms | 16ms | 64ms | 256ms | 1s | 4s | 16s | gt | max |
|---|---|---|---|---|---|---|---|---|---|---|---|
| fbmy5635_rel.cy9c_gcp_c2s30_old | 13.357 | 85.453 | 1.183 | 0.006 | 0.029 | ||||||
| fbmy5635_rel.cy9c_gcp_c2s30_new | 15.914 | 83.791 | 0.291 | 0.003 | 0.033 | ||||||
| fbmy8028_rel_lto.cy9c_gcp_c2s30_old | 20.654 | 79.097 | 0.247 | 0.002 | 0.031 | ||||||
| fbmy8028_rel_lto.cy9c_gcp_c2s30_new | 32.449 | 67.348 | 0.198 | 0.004 | 0.031 |
Delete response time histogram: each cell has the percentage of responses that take <= the time in the header and max is the max response time in seconds. For max values in the top 25% of the range have a red background and in the bottom 25% of the range have a green background. The red background is not used when the min value is within 80% of the max value.
| dbms | 256us | 1ms | 4ms | 16ms | 64ms | 256ms | 1s | 4s | 16s | gt | max |
|---|---|---|---|---|---|---|---|---|---|---|---|
| fbmy5635_rel.cy9c_gcp_c2s30_old | 17.378 | 81.486 | 1.129 | 0.007 | 0.029 | ||||||
| fbmy5635_rel.cy9c_gcp_c2s30_new | 18.415 | 81.322 | 0.258 | 0.005 | 0.040 | ||||||
| fbmy8028_rel_lto.cy9c_gcp_c2s30_old | 31.907 | 67.869 | 0.219 | 0.004 | 0.031 | ||||||
| fbmy8028_rel_lto.cy9c_gcp_c2s30_new | 39.889 | 59.922 | 0.184 | 0.005 | 0.032 |
Performance metrics for the DBMS listed above. Some are normalized by throughput, others are not. Legend for results is here.
ips	qps	rps	rmbps	wps	wmbps	rpq	rkbpq	wpi	wkbpi	csps	cpups	cspq	cpupq	dbgb1	dbgb2	rss	maxop	p50	p99	tag
7973	35696	0	0.0	56.0	15.0	0.000	0.000	0.007	1.931	140059	57.8	3.924	243	12.2	13.4	82.2	0.031	4491	4077	160m.fbmy5635_rel.cy9c_gcp_c2s30_old
7971	34891	0	0.0	55.8	14.5	0.000	0.000	0.007	1.868	137654	57.8	3.945	248	12.3	13.5	82.2	0.033	4427	3964	160m.fbmy5635_rel.cy9c_gcp_c2s30_new
7973	41868	0	0.0	58.4	15.1	0.000	0.000	0.007	1.937	163515	58.8	3.906	211	12.2	13.6	82.6	0.032	5242	4747	160m.fbmy8028_rel_lto.cy9c_gcp_c2s30_old
7973	43168	0	0.0	58.5	14.9	0.000	0.000	0.007	1.909	168636	58.7	3.907	204	12.3	13.7	82.7	0.031	5402	4891	160m.fbmy8028_rel_lto.cy9c_gcp_c2s30_new
l.i0
l.i0: load without secondary indexes
Performance metrics for all DBMS, not just the ones listed above. Some are normalized by throughput, others are not. Legend for results is here.
ips	qps	rps	rmbps	wps	wmbps	rpq	rkbpq	wpi	wkbpi	csps	cpups	cspq	cpupq	dbgb1	dbgb2	rss	maxop	p50	p99	tag
606061	0	0	0.0	520.9	147.6	0.000	0.000	0.001	0.249	81739	70.9	0.135	18	5.2	6.6	1.4	0.296	80207	55739	160m.fbmy5635_rel.cy9c_gcp_c2s30_old
590406	0	0	0.0	499.4	158.3	0.000	0.000	0.001	0.275	80086	70.1	0.136	18	5.4	6.9	1.5	0.408	77117	54241	160m.fbmy5635_rel.cy9c_gcp_c2s30_new
524590	0	0	0.0	474.9	130.4	0.000	0.000	0.001	0.254	67660	70.5	0.129	20	5.2	6.9	1.8	0.261	67927	52261	160m.fbmy8028_rel_lto.cy9c_gcp_c2s30_old
538720	0	0	0.0	454.5	141.1	0.000	0.000	0.001	0.268	69666	69.0	0.129	19	5.2	6.9	1.8	0.257	70825	47749	160m.fbmy8028_rel_lto.cy9c_gcp_c2s30_new
l.x
l.x: create secondary indexes
Performance metrics for all DBMS, not just the ones listed above. Some are normalized by throughput, others are not. Legend for results is here.
ips	qps	rps	rmbps	wps	wmbps	rpq	rkbpq	wpi	wkbpi	csps	cpups	cspq	cpupq	dbgb1	dbgb2	rss	maxop	p50	p99	tag
812690	0	1	0.1	302.8	106.7	0.000	0.000	0.000	0.134	1052	50.0	0.001	9	10.8	12.3	9.7	0.002	NA	NA	160m.fbmy5635_rel.cy9c_gcp_c2s30_old
784804	0	1	0.1	302.3	105.0	0.000	0.000	0.000	0.137	1224	50.1	0.002	10	10.8	12.3	10.2	0.036	NA	NA	160m.fbmy5635_rel.cy9c_gcp_c2s30_new
780976	0	1	0.1	282.0	106.6	0.000	0.000	0.000	0.140	1465	49.9	0.002	10	10.8	12.5	12.0	0.002	NA	NA	160m.fbmy8028_rel_lto.cy9c_gcp_c2s30_old
804523	0	1	0.1	291.3	107.4	0.000	0.000	0.000	0.137	1508	49.7	0.002	9	10.8	12.5	12.0	0.002	NA	NA	160m.fbmy8028_rel_lto.cy9c_gcp_c2s30_new
l.i1
l.i1: continue load after secondary indexes created
Performance metrics for all DBMS, not just the ones listed above. Some are normalized by throughput, others are not. Legend for results is here.
ips	qps	rps	rmbps	wps	wmbps	rpq	rkbpq	wpi	wkbpi	csps	cpups	cspq	cpupq	dbgb1	dbgb2	rss	maxop	p50	p99	tag
96223	0	3	1.3	472.7	131.0	0.000	0.014	0.005	1.394	86361	60.9	0.898	95	16.6	17.9	51.9	0.379	12236	8889	160m.fbmy5635_rel.cy9c_gcp_c2s30_old
95488	0	3	1.3	463.0	131.3	0.000	0.014	0.005	1.408	88110	61.6	0.923	97	20.1	21.4	50.7	0.656	12186	7442	160m.fbmy5635_rel.cy9c_gcp_c2s30_new
96595	0	3	1.3	495.6	129.4	0.000	0.014	0.005	1.372	73352	64.8	0.759	101	16.8	18.3	50.4	1.171	12586	3996	160m.fbmy8028_rel_lto.cy9c_gcp_c2s30_old
98595	0	3	1.4	501.0	132.1	0.000	0.014	0.005	1.372	75551	64.3	0.766	98	21.6	23.1	50.4	0.628	12936	3947	160m.fbmy8028_rel_lto.cy9c_gcp_c2s30_new
q100.1
q100.1: range queries with 100 insert/s per client
Performance metrics for all DBMS, not just the ones listed above. Some are normalized by throughput, others are not. Legend for results is here.
ips	qps	rps	rmbps	wps	wmbps	rpq	rkbpq	wpi	wkbpi	csps	cpups	cspq	cpupq	dbgb1	dbgb2	rss	maxop	p50	p99	tag
797	38202	0	0.0	13.6	2.1	0.000	0.000	0.017	2.745	147767	53.5	3.868	210	12.0	13.9	70.2	0.016	4747	3820	160m.fbmy5635_rel.cy9c_gcp_c2s30_old
797	37743	0	0.0	13.0	2.1	0.000	0.000	0.016	2.707	146016	53.4	3.869	212	12.0	13.9	69.7	0.020	4731	3900	160m.fbmy5635_rel.cy9c_gcp_c2s30_new
797	45026	0	0.0	15.7	2.5	0.000	0.000	0.020	3.272	173448	54.9	3.852	183	11.9	14.0	69.3	0.014	5658	3820	160m.fbmy8028_rel_lto.cy9c_gcp_c2s30_old
797	46193	0	0.0	18.1	2.6	0.000	0.000	0.023	3.303	177824	54.7	3.850	178	11.9	14.1	70.8	0.017	5770	3676	160m.fbmy8028_rel_lto.cy9c_gcp_c2s30_new
q500.1
q500.1: range queries with 500 insert/s per client
Performance metrics for all DBMS, not just the ones listed above. Some are normalized by throughput, others are not. Legend for results is here.
ips	qps	rps	rmbps	wps	wmbps	rpq	rkbpq	wpi	wkbpi	csps	cpups	cspq	cpupq	dbgb1	dbgb2	rss	maxop	p50	p99	tag
3987	37164	0	0.0	28.2	7.3	0.000	0.000	0.007	1.884	145017	55.1	3.902	222	12.2	13.2	81.1	0.024	4683	4251	160m.fbmy5635_rel.cy9c_gcp_c2s30_old
3987	36443	0	0.0	27.9	7.5	0.000	0.000	0.007	1.934	142449	55.2	3.909	227	12.1	13.1	81.0	0.021	4571	4140	160m.fbmy5635_rel.cy9c_gcp_c2s30_new
3987	43489	0	0.0	29.3	8.1	0.000	0.000	0.007	2.084	168771	56.5	3.881	195	12.0	13.3	81.6	0.012	5466	4987	160m.fbmy8028_rel_lto.cy9c_gcp_c2s30_old
3987	44950	0	0.0	29.1	7.7	0.000	0.000	0.007	1.985	174484	56.0	3.882	187	12.1	13.3	81.5	0.014	5642	5114	160m.fbmy8028_rel_lto.cy9c_gcp_c2s30_new
q1000.1
q1000.1: range queries with 1000 insert/s per client
Performance metrics for all DBMS, not just the ones listed above. Some are normalized by throughput, others are not. Legend for results is here.
ips	qps	rps	rmbps	wps	wmbps	rpq	rkbpq	wpi	wkbpi	csps	cpups	cspq	cpupq	dbgb1	dbgb2	rss	maxop	p50	p99	tag
7973	35696	0	0.0	56.0	15.0	0.000	0.000	0.007	1.931	140059	57.8	3.924	243	12.2	13.4	82.2	0.031	4491	4077	160m.fbmy5635_rel.cy9c_gcp_c2s30_old
7971	34891	0	0.0	55.8	14.5	0.000	0.000	0.007	1.868	137654	57.8	3.945	248	12.3	13.5	82.2	0.033	4427	3964	160m.fbmy5635_rel.cy9c_gcp_c2s30_new
7973	41868	0	0.0	58.4	15.1	0.000	0.000	0.007	1.937	163515	58.8	3.906	211	12.2	13.6	82.6	0.032	5242	4747	160m.fbmy8028_rel_lto.cy9c_gcp_c2s30_old
7973	43168	0	0.0	58.5	14.9	0.000	0.000	0.007	1.909	168636	58.7	3.907	204	12.3	13.7	82.7	0.031	5402	4891	160m.fbmy8028_rel_lto.cy9c_gcp_c2s30_new
l.i0
- l.i0: load without secondary indexes
- Legend for results is here.
- Each entry lists the percentage of responses that fit in that bucket (slower than max time for previous bucket, faster than min time for next bucket).
Insert response time histogram
256us	1ms	4ms	16ms	64ms	256ms	1s	4s	16s	gt	max	tag
0.000	22.690	77.286	0.009	0.001	0.012	0.001	0.000	0.000	0.000	0.296	fbmy5635_rel.cy9c_gcp_c2s30_old
0.000	21.011	78.964	0.009	0.002	0.013	nonzero	0.000	0.000	0.000	0.408	fbmy5635_rel.cy9c_gcp_c2s30_new
0.000	12.788	87.044	0.145	0.009	0.013	0.001	0.000	0.000	0.000	0.261	fbmy8028_rel_lto.cy9c_gcp_c2s30_old
0.000	13.474	86.355	0.151	0.006	0.015	nonzero	0.000	0.000	0.000	0.257	fbmy8028_rel_lto.cy9c_gcp_c2s30_new
l.x
- l.x: create secondary indexes
- Legend for results is here.
- Each entry lists the percentage of responses that fit in that bucket (slower than max time for previous bucket, faster than min time for next bucket).
TODO - determine whether there is data for create index response time
l.i1
- l.i1: continue load after secondary indexes created
- Legend for results is here.
- Each entry lists the percentage of responses that fit in that bucket (slower than max time for previous bucket, faster than min time for next bucket).
Insert response time histogram
256us	1ms	4ms	16ms	64ms	256ms	1s	4s	16s	gt	max	tag
0.000	0.028	49.089	50.801	0.069	0.013	0.001	0.000	0.000	0.000	0.379	fbmy5635_rel.cy9c_gcp_c2s30_old
0.000	0.028	49.121	50.703	0.135	0.013	0.001	0.000	0.000	0.000	0.656	fbmy5635_rel.cy9c_gcp_c2s30_new
0.000	0.018	55.805	43.930	0.225	0.019	0.002	nonzero	0.000	0.000	1.171	fbmy8028_rel_lto.cy9c_gcp_c2s30_old
0.000	0.032	62.070	37.626	0.253	0.018	0.002	0.000	0.000	0.000	0.628	fbmy8028_rel_lto.cy9c_gcp_c2s30_new
Delete response time histogram
256us	1ms	4ms	16ms	64ms	256ms	1s	4s	16s	gt	max	tag
0.000	0.027	43.902	55.982	0.072	0.015	0.001	0.000	0.000	0.000	0.379	fbmy5635_rel.cy9c_gcp_c2s30_old
0.000	0.027	43.585	56.231	0.141	0.015	0.001	0.000	0.000	0.000	0.657	fbmy5635_rel.cy9c_gcp_c2s30_new
0.000	0.021	51.830	47.894	0.233	0.020	0.002	nonzero	0.000	0.000	1.171	fbmy8028_rel_lto.cy9c_gcp_c2s30_old
0.000	0.034	59.639	40.048	0.259	0.018	0.002	0.000	0.000	0.000	0.627	fbmy8028_rel_lto.cy9c_gcp_c2s30_new
q100.1
- q100.1: range queries with 100 insert/s per client
- Legend for results is here.
- Each entry lists the percentage of responses that fit in that bucket (slower than max time for previous bucket, faster than min time for next bucket).
Query response time histogram
256us	1ms	4ms	16ms	64ms	256ms	1s	4s	16s	gt	max	tag
98.183	1.815	0.001	nonzero	nonzero	0.000	0.000	0.000	0.000	0.000	0.016	fbmy5635_rel.cy9c_gcp_c2s30_old
98.185	1.814	0.001	nonzero	nonzero	0.000	0.000	0.000	0.000	0.000	0.020	fbmy5635_rel.cy9c_gcp_c2s30_new
99.239	0.760	0.001	nonzero	0.000	0.000	0.000	0.000	0.000	0.000	0.014	fbmy8028_rel_lto.cy9c_gcp_c2s30_old
99.133	0.866	0.001	nonzero	nonzero	0.000	0.000	0.000	0.000	0.000	0.017	fbmy8028_rel_lto.cy9c_gcp_c2s30_new
Insert response time histogram
256us	1ms	4ms	16ms	64ms	256ms	1s	4s	16s	gt	max	tag
0.000	19.321	80.677	0.002	0.000	0.000	0.000	0.000	0.000	0.000	0.005	fbmy5635_rel.cy9c_gcp_c2s30_old
0.000	24.672	75.321	0.005	0.002	0.000	0.000	0.000	0.000	0.000	0.020	fbmy5635_rel.cy9c_gcp_c2s30_new
0.000	15.568	84.411	0.017	0.003	0.000	0.000	0.000	0.000	0.000	0.020	fbmy8028_rel_lto.cy9c_gcp_c2s30_old
0.000	25.299	74.691	0.009	0.002	0.000	0.000	0.000	0.000	0.000	0.019	fbmy8028_rel_lto.cy9c_gcp_c2s30_new
Delete response time histogram
256us	1ms	4ms	16ms	64ms	256ms	1s	4s	16s	gt	max	tag
0.000	13.590	86.408	0.002	0.000	0.000	0.000	0.000	0.000	0.000	0.015	fbmy5635_rel.cy9c_gcp_c2s30_old
0.000	13.436	86.557	0.005	0.002	0.000	0.000	0.000	0.000	0.000	0.020	fbmy5635_rel.cy9c_gcp_c2s30_new
0.000	29.552	70.425	0.023	0.000	0.000	0.000	0.000	0.000	0.000	0.013	fbmy8028_rel_lto.cy9c_gcp_c2s30_old
0.000	31.283	68.710	0.005	0.002	0.000	0.000	0.000	0.000	0.000	0.018	fbmy8028_rel_lto.cy9c_gcp_c2s30_new
q500.1
- q500.1: range queries with 500 insert/s per client
- Legend for results is here.
- Each entry lists the percentage of responses that fit in that bucket (slower than max time for previous bucket, faster than min time for next bucket).
Query response time histogram
256us	1ms	4ms	16ms	64ms	256ms	1s	4s	16s	gt	max	tag
96.649	3.346	0.004	nonzero	nonzero	0.000	0.000	0.000	0.000	0.000	0.024	fbmy5635_rel.cy9c_gcp_c2s30_old
96.211	3.785	0.004	nonzero	nonzero	0.000	0.000	0.000	0.000	0.000	0.021	fbmy5635_rel.cy9c_gcp_c2s30_new
98.878	1.117	0.005	nonzero	0.000	0.000	0.000	0.000	0.000	0.000	0.012	fbmy8028_rel_lto.cy9c_gcp_c2s30_old
99.431	0.565	0.003	nonzero	0.000	0.000	0.000	0.000	0.000	0.000	0.014	fbmy8028_rel_lto.cy9c_gcp_c2s30_new
Insert response time histogram
256us	1ms	4ms	16ms	64ms	256ms	1s	4s	16s	gt	max	tag
0.000	16.354	83.557	0.088	0.001	0.000	0.000	0.000	0.000	0.000	0.025	fbmy5635_rel.cy9c_gcp_c2s30_old
0.000	29.507	70.474	0.018	nonzero	0.000	0.000	0.000	0.000	0.000	0.031	fbmy5635_rel.cy9c_gcp_c2s30_new
0.000	15.913	83.618	0.466	0.004	0.000	0.000	0.000	0.000	0.000	0.053	fbmy8028_rel_lto.cy9c_gcp_c2s30_old
0.000	42.442	57.550	0.006	0.001	0.000	0.000	0.000	0.000	0.000	0.057	fbmy8028_rel_lto.cy9c_gcp_c2s30_new
Delete response time histogram
256us	1ms	4ms	16ms	64ms	256ms	1s	4s	16s	gt	max	tag
0.000	22.442	77.457	0.098	0.002	0.000	0.000	0.000	0.000	0.000	0.025	fbmy5635_rel.cy9c_gcp_c2s30_old
0.000	29.112	70.856	0.031	0.001	0.000	0.000	0.000	0.000	0.000	0.031	fbmy5635_rel.cy9c_gcp_c2s30_new
0.000	29.337	70.272	0.387	0.004	0.000	0.000	0.000	0.000	0.000	0.053	fbmy8028_rel_lto.cy9c_gcp_c2s30_old
0.000	57.892	42.099	0.007	0.003	0.000	0.000	0.000	0.000	0.000	0.054	fbmy8028_rel_lto.cy9c_gcp_c2s30_new
q1000.1
- q1000.1: range queries with 1000 insert/s per client
- Legend for results is here.
- Each entry lists the percentage of responses that fit in that bucket (slower than max time for previous bucket, faster than min time for next bucket).
Query response time histogram
256us	1ms	4ms	16ms	64ms	256ms	1s	4s	16s	gt	max	tag
91.599	8.393	0.008	nonzero	nonzero	0.000	0.000	0.000	0.000	0.000	0.031	fbmy5635_rel.cy9c_gcp_c2s30_old
89.891	10.100	0.008	nonzero	nonzero	0.000	0.000	0.000	0.000	0.000	0.033	fbmy5635_rel.cy9c_gcp_c2s30_new
97.454	2.538	0.007	nonzero	nonzero	0.000	0.000	0.000	0.000	0.000	0.032	fbmy8028_rel_lto.cy9c_gcp_c2s30_old
98.299	1.694	0.007	nonzero	nonzero	0.000	0.000	0.000	0.000	0.000	0.031	fbmy8028_rel_lto.cy9c_gcp_c2s30_new
Insert response time histogram
256us	1ms	4ms	16ms	64ms	256ms	1s	4s	16s	gt	max	tag
0.000	13.357	85.453	1.183	0.006	0.000	0.000	0.000	0.000	0.000	0.029	fbmy5635_rel.cy9c_gcp_c2s30_old
0.000	15.914	83.791	0.291	0.003	0.000	0.000	0.000	0.000	0.000	0.033	fbmy5635_rel.cy9c_gcp_c2s30_new
0.000	20.654	79.097	0.247	0.002	0.000	0.000	0.000	0.000	0.000	0.031	fbmy8028_rel_lto.cy9c_gcp_c2s30_old
0.000	32.449	67.348	0.198	0.004	0.000	0.000	0.000	0.000	0.000	0.031	fbmy8028_rel_lto.cy9c_gcp_c2s30_new
Delete response time histogram
256us	1ms	4ms	16ms	64ms	256ms	1s	4s	16s	gt	max	tag
0.000	17.378	81.486	1.129	0.007	0.000	0.000	0.000	0.000	0.000	0.029	fbmy5635_rel.cy9c_gcp_c2s30_old
0.000	18.415	81.322	0.258	0.005	0.000	0.000	0.000	0.000	0.000	0.040	fbmy5635_rel.cy9c_gcp_c2s30_new
0.000	31.907	67.869	0.219	0.004	0.000	0.000	0.000	0.000	0.000	0.031	fbmy8028_rel_lto.cy9c_gcp_c2s30_old
0.000	39.889	59.922	0.184	0.005	0.000	0.000	0.000	0.000	0.000	0.032	fbmy8028_rel_lto.cy9c_gcp_c2s30_new