Introduction
This is a report for the insert benchmark with 160M docs and 8 client(s). It is generated by scripts (bash, awk, sed) and Tufte might not be impressed. An overview of the insert benchmark is here and a short update is here. Below, by DBMS, I mean DBMS+version.config. An example is my8020.c10b40 where my means MySQL, 8020 is version 8.0.20 and c10b40 is the name for the configuration file.
The test server is a c2-standard-30 from GCP with 15 cores, hyperthreads disabled, 120G RAM, XFS + SW RAID 0 on 4 NVMe devices (1.5TB). The benchmark was run with 8 client and there were 1 or 3 connections per client (1 for queries or inserts without rate limits, 1+1 for rate limited inserts+deletes). There are 8 tables, client per table. It loads 20M rows per table without secondary indexes, creates secondary indexes, then inserts 50M rows with a delete per insert to avoid growing the table. It then does 3 read+write tests for 3600s each that do queries as fast as possible with 100, 500 and then 1000 inserts/second/client concurrent with the queries and 1000 deletes/second to avoid growing the table. The database is cached by the OS but not by MyRocks.
The tested DBMS are:
- fbmy5635_rel.cy9c_4g_gcp_c2s30_old - MyRocks and FB MySQL 5.6.35, rel build, cy9c_4g_gcp_c2s30 config, old build from Mar 2023
- fbmy5635_rel.cy9c_4g_gcp_c2s30_new - MyRocks and FB MySQL 5.6.35, rel build, cy9c_4g_gcp_c2s30 config, new build from Jun 2023 with RocksDB 8.2.1
- fbmy8028_rel_lto.cy9c_4g_gcp_c2s30_old - MyRocks and FB MySQL 8.0.28, rel build, cy9c_4g_gcp_c2s30 config, old build from Mar 2023
- fbmy8028_rel_lto.cy9c_4g_gcp_c2s30_new - MyRocks and FB MySQL 8.0.28, rel build, cy9c_4g_gcp_c2s30 config, new build from Jun 2023 with RocksDB 8.3.1
Contents
- Summary
- l.i0: load without secondary indexes
- l.x: create secondary indexes
- l.i1: continue load after secondary indexes created
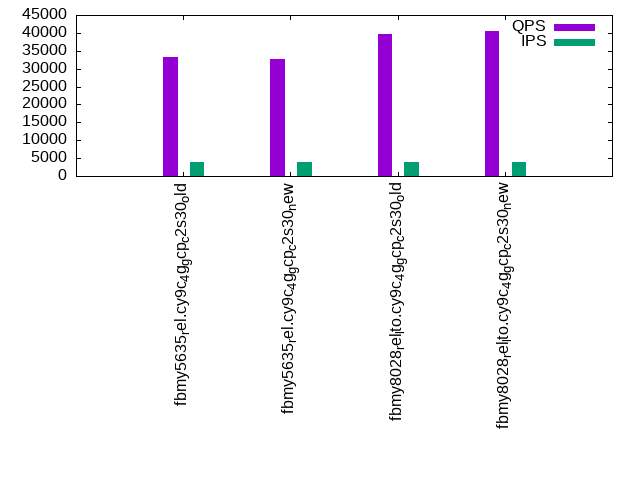
- q100.1: range queries with 100 insert/s per client
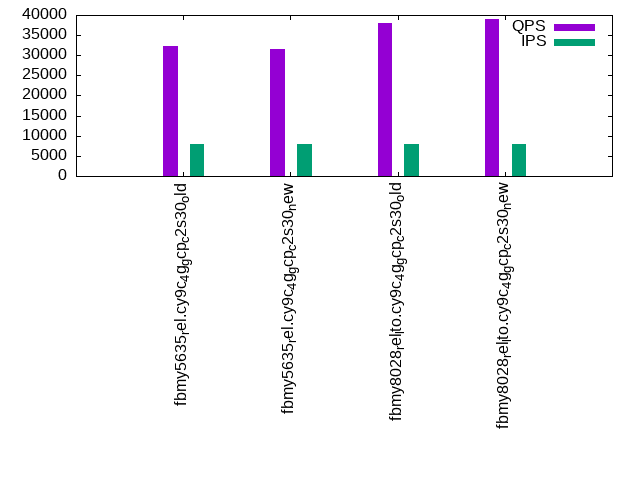
- q500.1: range queries with 500 insert/s per client
- q1000.1: range queries with 1000 insert/s per client
Summary
The numbers are inserts/s for l.i0 and l.i1, indexed docs (or rows) /s for l.x and queries/s for q*.2. The values are the average rate over the entire test for inserts (IPS) and queries (QPS). The range of values for IPS and QPS is split into 3 parts: bottom 25%, middle 50%, top 25%. Values in the bottom 25% have a red background, values in the top 25% have a green background and values in the middle have no color. A gray background is used for values that can be ignored because the DBMS did not sustain the target insert rate. Red backgrounds are not used when the minimum value is within 80% of the max value.
| dbms | l.i0 | l.x | l.i1 | q100.1 | q500.1 | q1000.1 |
|---|---|---|---|---|---|---|
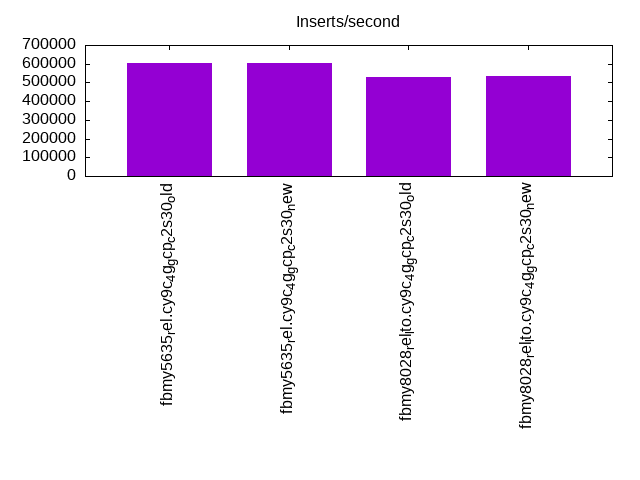
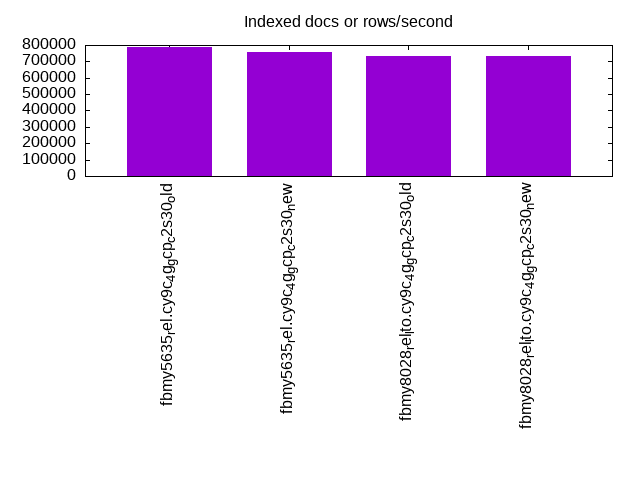
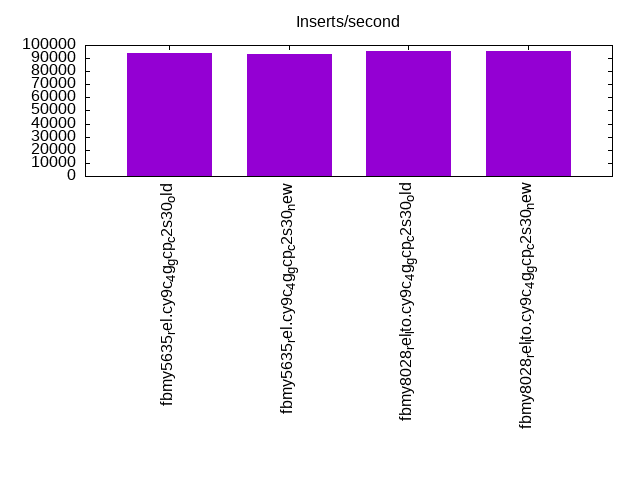
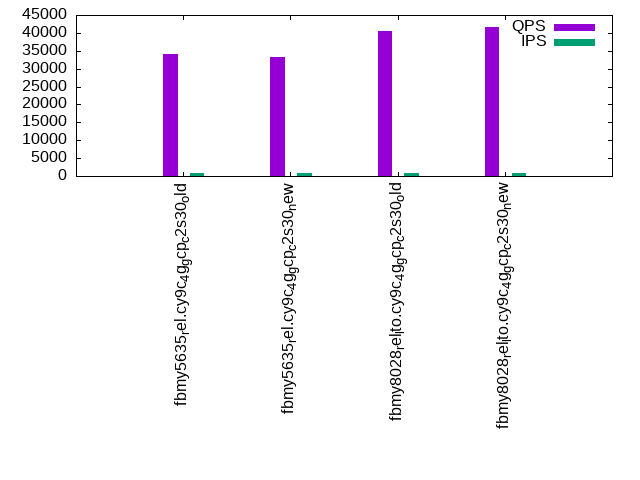
| fbmy5635_rel.cy9c_4g_gcp_c2s30_old | 606061 | 784804 | 93809 | 34172 | 33190 | 32190 |
| fbmy5635_rel.cy9c_4g_gcp_c2s30_new | 606061 | 755189 | 92958 | 33371 | 32576 | 31532 |
| fbmy8028_rel_lto.cy9c_4g_gcp_c2s30_old | 529801 | 734404 | 95579 | 40462 | 39563 | 38103 |
| fbmy8028_rel_lto.cy9c_4g_gcp_c2s30_new | 536913 | 734404 | 95147 | 41559 | 40452 | 39116 |
This table has relative throughput, throughput for the DBMS relative to the DBMS in the first line, using the absolute throughput from the previous table. Values less than 0.95 have a yellow background. Values greater than 1.05 have a blue background.
| dbms | l.i0 | l.x | l.i1 | q100.1 | q500.1 | q1000.1 |
|---|---|---|---|---|---|---|
| fbmy5635_rel.cy9c_4g_gcp_c2s30_old | 1.00 | 1.00 | 1.00 | 1.00 | 1.00 | 1.00 |
| fbmy5635_rel.cy9c_4g_gcp_c2s30_new | 1.00 | 0.96 | 0.99 | 0.98 | 0.98 | 0.98 |
| fbmy8028_rel_lto.cy9c_4g_gcp_c2s30_old | 0.87 | 0.94 | 1.02 | 1.18 | 1.19 | 1.18 |
| fbmy8028_rel_lto.cy9c_4g_gcp_c2s30_new | 0.89 | 0.94 | 1.01 | 1.22 | 1.22 | 1.22 |
This lists the average rate of inserts/s for the tests that do inserts concurrent with queries. For such tests the query rate is listed in the table above. The read+write tests are setup so that the insert rate should match the target rate every second. Cells that are not at least 95% of the target have a red background to indicate a failure to satisfy the target.
| dbms | q100.1 | q500.1 | q1000.1 |
|---|---|---|---|
| fbmy5635_rel.cy9c_4g_gcp_c2s30_old | 797 | 3987 | 7976 |
| fbmy5635_rel.cy9c_4g_gcp_c2s30_new | 798 | 3988 | 7978 |
| fbmy8028_rel_lto.cy9c_4g_gcp_c2s30_old | 797 | 3987 | 7971 |
| fbmy8028_rel_lto.cy9c_4g_gcp_c2s30_new | 798 | 3988 | 7976 |
| target | 800 | 4000 | 8000 |
l.i0
l.i0: load without secondary indexes. Graphs for performance per 1-second interval are here.
Average throughput:
Insert response time histogram: each cell has the percentage of responses that take <= the time in the header and max is the max response time in seconds. For the max column values in the top 25% of the range have a red background and in the bottom 25% of the range have a green background. The red background is not used when the min value is within 80% of the max value.
| dbms | 256us | 1ms | 4ms | 16ms | 64ms | 256ms | 1s | 4s | 16s | gt | max |
|---|---|---|---|---|---|---|---|---|---|---|---|
| fbmy5635_rel.cy9c_4g_gcp_c2s30_old | 23.026 | 76.949 | 0.011 | 0.001 | 0.013 | 0.001 | 0.267 | ||||
| fbmy5635_rel.cy9c_4g_gcp_c2s30_new | 23.299 | 76.678 | 0.006 | 0.002 | 0.013 | 0.001 | 0.277 | ||||
| fbmy8028_rel_lto.cy9c_4g_gcp_c2s30_old | 12.820 | 87.026 | 0.133 | 0.007 | 0.013 | 0.001 | 0.333 | ||||
| fbmy8028_rel_lto.cy9c_4g_gcp_c2s30_new | 12.950 | 86.865 | 0.161 | 0.010 | 0.014 | 0.250 |
Performance metrics for the DBMS listed above. Some are normalized by throughput, others are not. Legend for results is here.
ips	qps	rps	rmbps	wps	wmbps	rpq	rkbpq	wpi	wkbpi	csps	cpups	cspq	cpupq	dbgb1	dbgb2	rss	maxop	p50	p99	tag
606061	0	0	0.0	509.9	143.2	0.000	0.000	0.001	0.242	82174	70.4	0.136	17	5.4	6.9	1.4	0.267	80912	56738	160m.fbmy5635_rel.cy9c_4g_gcp_c2s30_old
606061	0	0	0.0	506.5	157.9	0.000	0.000	0.001	0.267	82877	70.6	0.137	17	5.4	6.9	1.4	0.277	80114	56857	160m.fbmy5635_rel.cy9c_4g_gcp_c2s30_new
529801	0	0	0.0	459.7	126.2	0.000	0.000	0.001	0.244	67486	69.6	0.127	20	5.1	6.8	1.8	0.333	69724	52360	160m.fbmy8028_rel_lto.cy9c_4g_gcp_c2s30_old
536913	0	0	0.0	450.5	138.0	0.000	0.000	0.001	0.263	68877	69.7	0.128	19	5.1	6.8	1.8	0.250	70522	53060	160m.fbmy8028_rel_lto.cy9c_4g_gcp_c2s30_new
l.x
l.x: create secondary indexes.
Average throughput:
Performance metrics for the DBMS listed above. Some are normalized by throughput, others are not. Legend for results is here.
ips	qps	rps	rmbps	wps	wmbps	rpq	rkbpq	wpi	wkbpi	csps	cpups	cspq	cpupq	dbgb1	dbgb2	rss	maxop	p50	p99	tag
784804	0	1	0.1	292.2	104.0	0.000	0.000	0.000	0.136	1136	50.4	0.001	10	10.8	12.3	4.8	0.002	NA	NA	160m.fbmy5635_rel.cy9c_4g_gcp_c2s30_old
755189	0	1	0.1	278.6	97.9	0.000	0.000	0.000	0.133	1060	48.7	0.001	10	10.9	12.4	4.8	0.001	NA	NA	160m.fbmy5635_rel.cy9c_4g_gcp_c2s30_new
734404	0	1	0.1	269.4	99.8	0.000	0.000	0.000	0.139	1388	49.4	0.002	10	10.9	12.5	6.1	0.002	NA	NA	160m.fbmy8028_rel_lto.cy9c_4g_gcp_c2s30_old
734404	0	1	0.1	274.7	97.2	0.000	0.000	0.000	0.135	1395	48.7	0.002	10	10.8	12.5	6.1	0.002	NA	NA	160m.fbmy8028_rel_lto.cy9c_4g_gcp_c2s30_new
l.i1
l.i1: continue load after secondary indexes created. Graphs for performance per 1-second interval are here.
Average throughput:
Insert response time histogram: each cell has the percentage of responses that take <= the time in the header and max is the max response time in seconds. For the max column values in the top 25% of the range have a red background and in the bottom 25% of the range have a green background. The red background is not used when the min value is within 80% of the max value.
| dbms | 256us | 1ms | 4ms | 16ms | 64ms | 256ms | 1s | 4s | 16s | gt | max |
|---|---|---|---|---|---|---|---|---|---|---|---|
| fbmy5635_rel.cy9c_4g_gcp_c2s30_old | 0.024 | 47.316 | 52.571 | 0.072 | 0.012 | 0.002 | 0.002 | nonzero | 5.311 | ||
| fbmy5635_rel.cy9c_4g_gcp_c2s30_new | 0.021 | 46.224 | 53.670 | 0.070 | 0.012 | 0.001 | 0.001 | 0.001 | 5.881 | ||
| fbmy8028_rel_lto.cy9c_4g_gcp_c2s30_old | 0.011 | 51.726 | 48.173 | 0.070 | 0.016 | 0.002 | 0.002 | nonzero | 5.539 | ||
| fbmy8028_rel_lto.cy9c_4g_gcp_c2s30_new | 0.026 | 59.094 | 40.677 | 0.174 | 0.023 | 0.002 | 0.003 | 0.001 | 5.654 |
Delete response time histogram: each cell has the percentage of responses that take <= the time in the header and max is the max response time in seconds. For the max column values in the top 25% of the range have a red background and in the bottom 25% of the range have a green background. The red background is not used when the min value is within 80% of the max value.
| dbms | 256us | 1ms | 4ms | 16ms | 64ms | 256ms | 1s | 4s | 16s | gt | max |
|---|---|---|---|---|---|---|---|---|---|---|---|
| fbmy5635_rel.cy9c_4g_gcp_c2s30_old | 0.024 | 42.107 | 57.775 | 0.076 | 0.014 | 0.002 | 0.002 | 0.001 | 5.475 | ||
| fbmy5635_rel.cy9c_4g_gcp_c2s30_new | 0.021 | 40.991 | 58.898 | 0.073 | 0.014 | 0.002 | 0.001 | 0.001 | 6.134 | ||
| fbmy8028_rel_lto.cy9c_4g_gcp_c2s30_old | 0.012 | 48.595 | 51.299 | 0.073 | 0.017 | 0.002 | 0.002 | nonzero | 4.988 | ||
| fbmy8028_rel_lto.cy9c_4g_gcp_c2s30_new | 0.028 | 56.304 | 43.460 | 0.178 | 0.024 | 0.002 | 0.004 | nonzero | 5.608 |
Performance metrics for the DBMS listed above. Some are normalized by throughput, others are not. Legend for results is here.
ips	qps	rps	rmbps	wps	wmbps	rpq	rkbpq	wpi	wkbpi	csps	cpups	cspq	cpupq	dbgb1	dbgb2	rss	maxop	p50	p99	tag
93809	0	3	1.3	468.7	121.9	0.000	0.014	0.005	1.330	84429	60.4	0.900	97	14.0	15.3	4.7	5.311	12087	0	160m.fbmy5635_rel.cy9c_4g_gcp_c2s30_old
92958	0	3	1.3	461.0	120.9	0.000	0.014	0.005	1.332	83696	60.5	0.900	98	13.9	15.2	4.7	5.881	11937	0	160m.fbmy5635_rel.cy9c_4g_gcp_c2s30_new
95579	0	3	1.3	502.2	117.7	0.000	0.014	0.005	1.261	71979	64.5	0.753	101	17.4	19.0	5.1	5.539	12437	0	160m.fbmy8028_rel_lto.cy9c_4g_gcp_c2s30_old
95147	0	3	1.3	499.1	118.0	0.000	0.014	0.005	1.270	73350	65.5	0.771	103	20.7	22.2	5.3	5.654	12740	0	160m.fbmy8028_rel_lto.cy9c_4g_gcp_c2s30_new
q100.1
q100.1: range queries with 100 insert/s per client. Graphs for performance per 1-second interval are here.
Average throughput:
Query response time histogram: each cell has the percentage of responses that take <= the time in the header and max is the max response time in seconds. For max values in the top 25% of the range have a red background and in the bottom 25% of the range have a green background. The red background is not used when the min value is within 80% of the max value.
| dbms | 256us | 1ms | 4ms | 16ms | 64ms | 256ms | 1s | 4s | 16s | gt | max |
|---|---|---|---|---|---|---|---|---|---|---|---|
| fbmy5635_rel.cy9c_4g_gcp_c2s30_old | 85.228 | 14.771 | 0.001 | nonzero | nonzero | 0.020 | |||||
| fbmy5635_rel.cy9c_4g_gcp_c2s30_new | 79.963 | 20.035 | 0.002 | nonzero | nonzero | 0.021 | |||||
| fbmy8028_rel_lto.cy9c_4g_gcp_c2s30_old | 98.621 | 1.377 | 0.002 | nonzero | 0.006 | ||||||
| fbmy8028_rel_lto.cy9c_4g_gcp_c2s30_new | 98.999 | 0.999 | 0.002 | nonzero | 0.016 |
Insert response time histogram: each cell has the percentage of responses that take <= the time in the header and max is the max response time in seconds. For max values in the top 25% of the range have a red background and in the bottom 25% of the range have a green background. The red background is not used when the min value is within 80% of the max value.
| dbms | 256us | 1ms | 4ms | 16ms | 64ms | 256ms | 1s | 4s | 16s | gt | max |
|---|---|---|---|---|---|---|---|---|---|---|---|
| fbmy5635_rel.cy9c_4g_gcp_c2s30_old | 27.092 | 72.891 | 0.017 | 0.011 | |||||||
| fbmy5635_rel.cy9c_4g_gcp_c2s30_new | 17.804 | 82.174 | 0.023 | 0.013 | |||||||
| fbmy8028_rel_lto.cy9c_4g_gcp_c2s30_old | 19.155 | 80.839 | 0.007 | 0.008 | |||||||
| fbmy8028_rel_lto.cy9c_4g_gcp_c2s30_new | 16.705 | 83.280 | 0.016 | 0.012 |
Delete response time histogram: each cell has the percentage of responses that take <= the time in the header and max is the max response time in seconds. For max values in the top 25% of the range have a red background and in the bottom 25% of the range have a green background. The red background is not used when the min value is within 80% of the max value.
| dbms | 256us | 1ms | 4ms | 16ms | 64ms | 256ms | 1s | 4s | 16s | gt | max |
|---|---|---|---|---|---|---|---|---|---|---|---|
| fbmy5635_rel.cy9c_4g_gcp_c2s30_old | 12.181 | 87.785 | 0.035 | 0.011 | |||||||
| fbmy5635_rel.cy9c_4g_gcp_c2s30_new | 8.168 | 91.757 | 0.073 | 0.002 | 0.018 | ||||||
| fbmy8028_rel_lto.cy9c_4g_gcp_c2s30_old | 17.849 | 82.144 | 0.007 | 0.008 | |||||||
| fbmy8028_rel_lto.cy9c_4g_gcp_c2s30_new | 27.502 | 72.481 | 0.017 | 0.014 |
Performance metrics for the DBMS listed above. Some are normalized by throughput, others are not. Legend for results is here.
ips	qps	rps	rmbps	wps	wmbps	rpq	rkbpq	wpi	wkbpi	csps	cpups	cspq	cpupq	dbgb1	dbgb2	rss	maxop	p50	p99	tag
797	34172	0	0.0	14.1	2.0	0.000	0.000	0.018	2.591	132412	53.3	3.875	234	12.0	14.0	4.8	0.020	4203	3740	160m.fbmy5635_rel.cy9c_4g_gcp_c2s30_old
798	33371	0	0.0	15.0	2.3	0.000	0.000	0.019	2.977	129145	53.3	3.870	240	12.0	13.9	4.7	0.021	4203	3500	160m.fbmy5635_rel.cy9c_4g_gcp_c2s30_new
797	40462	0	0.0	14.4	1.9	0.000	0.000	0.018	2.476	155665	54.6	3.847	202	12.0	14.2	5.1	0.006	5052	4541	160m.fbmy8028_rel_lto.cy9c_4g_gcp_c2s30_old
798	41559	0	0.0	17.6	2.6	0.000	0.000	0.022	3.396	159825	54.8	3.846	198	12.0	14.2	5.2	0.016	5210	4619	160m.fbmy8028_rel_lto.cy9c_4g_gcp_c2s30_new
q500.1
q500.1: range queries with 500 insert/s per client. Graphs for performance per 1-second interval are here.
Average throughput:
Query response time histogram: each cell has the percentage of responses that take <= the time in the header and max is the max response time in seconds. For max values in the top 25% of the range have a red background and in the bottom 25% of the range have a green background. The red background is not used when the min value is within 80% of the max value.
| dbms | 256us | 1ms | 4ms | 16ms | 64ms | 256ms | 1s | 4s | 16s | gt | max |
|---|---|---|---|---|---|---|---|---|---|---|---|
| fbmy5635_rel.cy9c_4g_gcp_c2s30_old | 78.918 | 21.078 | 0.004 | nonzero | nonzero | 0.035 | |||||
| fbmy5635_rel.cy9c_4g_gcp_c2s30_new | 74.397 | 25.597 | 0.005 | nonzero | nonzero | 0.032 | |||||
| fbmy8028_rel_lto.cy9c_4g_gcp_c2s30_old | 97.325 | 2.670 | 0.005 | nonzero | nonzero | 0.027 | |||||
| fbmy8028_rel_lto.cy9c_4g_gcp_c2s30_new | 97.945 | 2.050 | 0.005 | nonzero | 0.015 |
Insert response time histogram: each cell has the percentage of responses that take <= the time in the header and max is the max response time in seconds. For max values in the top 25% of the range have a red background and in the bottom 25% of the range have a green background. The red background is not used when the min value is within 80% of the max value.
| dbms | 256us | 1ms | 4ms | 16ms | 64ms | 256ms | 1s | 4s | 16s | gt | max |
|---|---|---|---|---|---|---|---|---|---|---|---|
| fbmy5635_rel.cy9c_4g_gcp_c2s30_old | 29.008 | 70.966 | 0.025 | nonzero | nonzero | 0.094 | |||||
| fbmy5635_rel.cy9c_4g_gcp_c2s30_new | 27.804 | 72.165 | 0.031 | 0.013 | |||||||
| fbmy8028_rel_lto.cy9c_4g_gcp_c2s30_old | 23.189 | 76.745 | 0.065 | 0.014 | |||||||
| fbmy8028_rel_lto.cy9c_4g_gcp_c2s30_new | 35.588 | 64.363 | 0.049 | nonzero | 0.028 |
Delete response time histogram: each cell has the percentage of responses that take <= the time in the header and max is the max response time in seconds. For max values in the top 25% of the range have a red background and in the bottom 25% of the range have a green background. The red background is not used when the min value is within 80% of the max value.
| dbms | 256us | 1ms | 4ms | 16ms | 64ms | 256ms | 1s | 4s | 16s | gt | max |
|---|---|---|---|---|---|---|---|---|---|---|---|
| fbmy5635_rel.cy9c_4g_gcp_c2s30_old | 31.540 | 68.432 | 0.027 | 0.001 | nonzero | 0.094 | |||||
| fbmy5635_rel.cy9c_4g_gcp_c2s30_new | 23.930 | 76.006 | 0.062 | 0.002 | 0.027 | ||||||
| fbmy8028_rel_lto.cy9c_4g_gcp_c2s30_old | 32.561 | 67.365 | 0.073 | 0.001 | 0.027 | ||||||
| fbmy8028_rel_lto.cy9c_4g_gcp_c2s30_new | 45.258 | 54.690 | 0.048 | 0.004 | 0.029 |
Performance metrics for the DBMS listed above. Some are normalized by throughput, others are not. Legend for results is here.
ips	qps	rps	rmbps	wps	wmbps	rpq	rkbpq	wpi	wkbpi	csps	cpups	cspq	cpupq	dbgb1	dbgb2	rss	maxop	p50	p99	tag
3987	33190	0	0.0	32.3	6.6	0.000	0.000	0.008	1.697	129666	55.0	3.907	249	12.2	13.3	4.7	0.035	4156	3900	160m.fbmy5635_rel.cy9c_4g_gcp_c2s30_old
3988	32576	0	0.0	32.0	6.3	0.000	0.000	0.008	1.629	127173	55.0	3.904	253	12.4	13.4	4.8	0.032	4079	3820	160m.fbmy5635_rel.cy9c_4g_gcp_c2s30_new
3987	39563	0	0.0	34.8	6.5	0.000	0.000	0.009	1.661	153244	56.2	3.873	213	12.4	13.7	5.2	0.027	4957	4587	160m.fbmy8028_rel_lto.cy9c_4g_gcp_c2s30_old
3988	40452	0	0.0	33.6	6.1	0.000	0.000	0.008	1.576	156605	56.3	3.871	209	12.3	13.5	5.2	0.015	5082	4699	160m.fbmy8028_rel_lto.cy9c_4g_gcp_c2s30_new
q1000.1
q1000.1: range queries with 1000 insert/s per client. Graphs for performance per 1-second interval are here.
Average throughput:
Query response time histogram: each cell has the percentage of responses that take <= the time in the header and max is the max response time in seconds. For max values in the top 25% of the range have a red background and in the bottom 25% of the range have a green background. The red background is not used when the min value is within 80% of the max value.
| dbms | 256us | 1ms | 4ms | 16ms | 64ms | 256ms | 1s | 4s | 16s | gt | max |
|---|---|---|---|---|---|---|---|---|---|---|---|
| fbmy5635_rel.cy9c_4g_gcp_c2s30_old | 72.049 | 27.935 | 0.016 | nonzero | nonzero | 0.031 | |||||
| fbmy5635_rel.cy9c_4g_gcp_c2s30_new | 66.282 | 33.708 | 0.010 | nonzero | nonzero | 0.029 | |||||
| fbmy8028_rel_lto.cy9c_4g_gcp_c2s30_old | 94.229 | 5.763 | 0.008 | nonzero | nonzero | 0.026 | |||||
| fbmy8028_rel_lto.cy9c_4g_gcp_c2s30_new | 95.686 | 4.307 | 0.007 | nonzero | nonzero | 0.024 |
Insert response time histogram: each cell has the percentage of responses that take <= the time in the header and max is the max response time in seconds. For max values in the top 25% of the range have a red background and in the bottom 25% of the range have a green background. The red background is not used when the min value is within 80% of the max value.
| dbms | 256us | 1ms | 4ms | 16ms | 64ms | 256ms | 1s | 4s | 16s | gt | max |
|---|---|---|---|---|---|---|---|---|---|---|---|
| fbmy5635_rel.cy9c_4g_gcp_c2s30_old | 8.696 | 73.319 | 17.971 | 0.014 | 0.023 | ||||||
| fbmy5635_rel.cy9c_4g_gcp_c2s30_new | 19.747 | 80.219 | 0.034 | nonzero | 0.020 | ||||||
| fbmy8028_rel_lto.cy9c_4g_gcp_c2s30_old | 23.716 | 76.272 | 0.011 | nonzero | 0.023 | ||||||
| fbmy8028_rel_lto.cy9c_4g_gcp_c2s30_new | 33.587 | 66.405 | 0.008 | 0.014 |
Delete response time histogram: each cell has the percentage of responses that take <= the time in the header and max is the max response time in seconds. For max values in the top 25% of the range have a red background and in the bottom 25% of the range have a green background. The red background is not used when the min value is within 80% of the max value.
| dbms | 256us | 1ms | 4ms | 16ms | 64ms | 256ms | 1s | 4s | 16s | gt | max |
|---|---|---|---|---|---|---|---|---|---|---|---|
| fbmy5635_rel.cy9c_4g_gcp_c2s30_old | 9.987 | 73.013 | 16.982 | 0.017 | 0.033 | ||||||
| fbmy5635_rel.cy9c_4g_gcp_c2s30_new | 16.643 | 83.290 | 0.064 | 0.004 | 0.033 | ||||||
| fbmy8028_rel_lto.cy9c_4g_gcp_c2s30_old | 29.324 | 70.660 | 0.013 | 0.003 | 0.037 | ||||||
| fbmy8028_rel_lto.cy9c_4g_gcp_c2s30_new | 42.637 | 57.352 | 0.009 | 0.002 | 0.033 |
Performance metrics for the DBMS listed above. Some are normalized by throughput, others are not. Legend for results is here.
ips	qps	rps	rmbps	wps	wmbps	rpq	rkbpq	wpi	wkbpi	csps	cpups	cspq	cpupq	dbgb1	dbgb2	rss	maxop	p50	p99	tag
7976	32190	0	0.0	62.5	12.9	0.000	0.000	0.008	1.658	126583	57.7	3.932	269	12.2	13.4	4.7	0.031	4044	3806	160m.fbmy5635_rel.cy9c_4g_gcp_c2s30_old
7978	31532	0	0.0	63.0	12.9	0.000	0.000	0.008	1.662	124300	57.7	3.942	274	12.6	13.8	4.7	0.029	3933	3724	160m.fbmy5635_rel.cy9c_4g_gcp_c2s30_new
7971	38103	0	0.0	64.8	12.7	0.000	0.000	0.008	1.628	149012	58.8	3.911	231	12.5	13.9	5.2	0.026	4795	4475	160m.fbmy8028_rel_lto.cy9c_4g_gcp_c2s30_old
7976	39116	0	0.0	65.1	12.8	0.000	0.000	0.008	1.648	152979	58.8	3.911	225	12.4	13.8	5.1	0.024	4906	4571	160m.fbmy8028_rel_lto.cy9c_4g_gcp_c2s30_new
l.i0
l.i0: load without secondary indexes
Performance metrics for all DBMS, not just the ones listed above. Some are normalized by throughput, others are not. Legend for results is here.
ips	qps	rps	rmbps	wps	wmbps	rpq	rkbpq	wpi	wkbpi	csps	cpups	cspq	cpupq	dbgb1	dbgb2	rss	maxop	p50	p99	tag
606061	0	0	0.0	509.9	143.2	0.000	0.000	0.001	0.242	82174	70.4	0.136	17	5.4	6.9	1.4	0.267	80912	56738	160m.fbmy5635_rel.cy9c_4g_gcp_c2s30_old
606061	0	0	0.0	506.5	157.9	0.000	0.000	0.001	0.267	82877	70.6	0.137	17	5.4	6.9	1.4	0.277	80114	56857	160m.fbmy5635_rel.cy9c_4g_gcp_c2s30_new
529801	0	0	0.0	459.7	126.2	0.000	0.000	0.001	0.244	67486	69.6	0.127	20	5.1	6.8	1.8	0.333	69724	52360	160m.fbmy8028_rel_lto.cy9c_4g_gcp_c2s30_old
536913	0	0	0.0	450.5	138.0	0.000	0.000	0.001	0.263	68877	69.7	0.128	19	5.1	6.8	1.8	0.250	70522	53060	160m.fbmy8028_rel_lto.cy9c_4g_gcp_c2s30_new
l.x
l.x: create secondary indexes
Performance metrics for all DBMS, not just the ones listed above. Some are normalized by throughput, others are not. Legend for results is here.
ips	qps	rps	rmbps	wps	wmbps	rpq	rkbpq	wpi	wkbpi	csps	cpups	cspq	cpupq	dbgb1	dbgb2	rss	maxop	p50	p99	tag
784804	0	1	0.1	292.2	104.0	0.000	0.000	0.000	0.136	1136	50.4	0.001	10	10.8	12.3	4.8	0.002	NA	NA	160m.fbmy5635_rel.cy9c_4g_gcp_c2s30_old
755189	0	1	0.1	278.6	97.9	0.000	0.000	0.000	0.133	1060	48.7	0.001	10	10.9	12.4	4.8	0.001	NA	NA	160m.fbmy5635_rel.cy9c_4g_gcp_c2s30_new
734404	0	1	0.1	269.4	99.8	0.000	0.000	0.000	0.139	1388	49.4	0.002	10	10.9	12.5	6.1	0.002	NA	NA	160m.fbmy8028_rel_lto.cy9c_4g_gcp_c2s30_old
734404	0	1	0.1	274.7	97.2	0.000	0.000	0.000	0.135	1395	48.7	0.002	10	10.8	12.5	6.1	0.002	NA	NA	160m.fbmy8028_rel_lto.cy9c_4g_gcp_c2s30_new
l.i1
l.i1: continue load after secondary indexes created
Performance metrics for all DBMS, not just the ones listed above. Some are normalized by throughput, others are not. Legend for results is here.
ips	qps	rps	rmbps	wps	wmbps	rpq	rkbpq	wpi	wkbpi	csps	cpups	cspq	cpupq	dbgb1	dbgb2	rss	maxop	p50	p99	tag
93809	0	3	1.3	468.7	121.9	0.000	0.014	0.005	1.330	84429	60.4	0.900	97	14.0	15.3	4.7	5.311	12087	0	160m.fbmy5635_rel.cy9c_4g_gcp_c2s30_old
92958	0	3	1.3	461.0	120.9	0.000	0.014	0.005	1.332	83696	60.5	0.900	98	13.9	15.2	4.7	5.881	11937	0	160m.fbmy5635_rel.cy9c_4g_gcp_c2s30_new
95579	0	3	1.3	502.2	117.7	0.000	0.014	0.005	1.261	71979	64.5	0.753	101	17.4	19.0	5.1	5.539	12437	0	160m.fbmy8028_rel_lto.cy9c_4g_gcp_c2s30_old
95147	0	3	1.3	499.1	118.0	0.000	0.014	0.005	1.270	73350	65.5	0.771	103	20.7	22.2	5.3	5.654	12740	0	160m.fbmy8028_rel_lto.cy9c_4g_gcp_c2s30_new
q100.1
q100.1: range queries with 100 insert/s per client
Performance metrics for all DBMS, not just the ones listed above. Some are normalized by throughput, others are not. Legend for results is here.
ips	qps	rps	rmbps	wps	wmbps	rpq	rkbpq	wpi	wkbpi	csps	cpups	cspq	cpupq	dbgb1	dbgb2	rss	maxop	p50	p99	tag
797	34172	0	0.0	14.1	2.0	0.000	0.000	0.018	2.591	132412	53.3	3.875	234	12.0	14.0	4.8	0.020	4203	3740	160m.fbmy5635_rel.cy9c_4g_gcp_c2s30_old
798	33371	0	0.0	15.0	2.3	0.000	0.000	0.019	2.977	129145	53.3	3.870	240	12.0	13.9	4.7	0.021	4203	3500	160m.fbmy5635_rel.cy9c_4g_gcp_c2s30_new
797	40462	0	0.0	14.4	1.9	0.000	0.000	0.018	2.476	155665	54.6	3.847	202	12.0	14.2	5.1	0.006	5052	4541	160m.fbmy8028_rel_lto.cy9c_4g_gcp_c2s30_old
798	41559	0	0.0	17.6	2.6	0.000	0.000	0.022	3.396	159825	54.8	3.846	198	12.0	14.2	5.2	0.016	5210	4619	160m.fbmy8028_rel_lto.cy9c_4g_gcp_c2s30_new
q500.1
q500.1: range queries with 500 insert/s per client
Performance metrics for all DBMS, not just the ones listed above. Some are normalized by throughput, others are not. Legend for results is here.
ips	qps	rps	rmbps	wps	wmbps	rpq	rkbpq	wpi	wkbpi	csps	cpups	cspq	cpupq	dbgb1	dbgb2	rss	maxop	p50	p99	tag
3987	33190	0	0.0	32.3	6.6	0.000	0.000	0.008	1.697	129666	55.0	3.907	249	12.2	13.3	4.7	0.035	4156	3900	160m.fbmy5635_rel.cy9c_4g_gcp_c2s30_old
3988	32576	0	0.0	32.0	6.3	0.000	0.000	0.008	1.629	127173	55.0	3.904	253	12.4	13.4	4.8	0.032	4079	3820	160m.fbmy5635_rel.cy9c_4g_gcp_c2s30_new
3987	39563	0	0.0	34.8	6.5	0.000	0.000	0.009	1.661	153244	56.2	3.873	213	12.4	13.7	5.2	0.027	4957	4587	160m.fbmy8028_rel_lto.cy9c_4g_gcp_c2s30_old
3988	40452	0	0.0	33.6	6.1	0.000	0.000	0.008	1.576	156605	56.3	3.871	209	12.3	13.5	5.2	0.015	5082	4699	160m.fbmy8028_rel_lto.cy9c_4g_gcp_c2s30_new
q1000.1
q1000.1: range queries with 1000 insert/s per client
Performance metrics for all DBMS, not just the ones listed above. Some are normalized by throughput, others are not. Legend for results is here.
ips	qps	rps	rmbps	wps	wmbps	rpq	rkbpq	wpi	wkbpi	csps	cpups	cspq	cpupq	dbgb1	dbgb2	rss	maxop	p50	p99	tag
7976	32190	0	0.0	62.5	12.9	0.000	0.000	0.008	1.658	126583	57.7	3.932	269	12.2	13.4	4.7	0.031	4044	3806	160m.fbmy5635_rel.cy9c_4g_gcp_c2s30_old
7978	31532	0	0.0	63.0	12.9	0.000	0.000	0.008	1.662	124300	57.7	3.942	274	12.6	13.8	4.7	0.029	3933	3724	160m.fbmy5635_rel.cy9c_4g_gcp_c2s30_new
7971	38103	0	0.0	64.8	12.7	0.000	0.000	0.008	1.628	149012	58.8	3.911	231	12.5	13.9	5.2	0.026	4795	4475	160m.fbmy8028_rel_lto.cy9c_4g_gcp_c2s30_old
7976	39116	0	0.0	65.1	12.8	0.000	0.000	0.008	1.648	152979	58.8	3.911	225	12.4	13.8	5.1	0.024	4906	4571	160m.fbmy8028_rel_lto.cy9c_4g_gcp_c2s30_new
l.i0
- l.i0: load without secondary indexes
- Legend for results is here.
- Each entry lists the percentage of responses that fit in that bucket (slower than max time for previous bucket, faster than min time for next bucket).
Insert response time histogram
256us	1ms	4ms	16ms	64ms	256ms	1s	4s	16s	gt	max	tag
0.000	23.026	76.949	0.011	0.001	0.013	0.001	0.000	0.000	0.000	0.267	fbmy5635_rel.cy9c_4g_gcp_c2s30_old
0.000	23.299	76.678	0.006	0.002	0.013	0.001	0.000	0.000	0.000	0.277	fbmy5635_rel.cy9c_4g_gcp_c2s30_new
0.000	12.820	87.026	0.133	0.007	0.013	0.001	0.000	0.000	0.000	0.333	fbmy8028_rel_lto.cy9c_4g_gcp_c2s30_old
0.000	12.950	86.865	0.161	0.010	0.014	0.000	0.000	0.000	0.000	0.250	fbmy8028_rel_lto.cy9c_4g_gcp_c2s30_new
l.x
- l.x: create secondary indexes
- Legend for results is here.
- Each entry lists the percentage of responses that fit in that bucket (slower than max time for previous bucket, faster than min time for next bucket).
TODO - determine whether there is data for create index response time
l.i1
- l.i1: continue load after secondary indexes created
- Legend for results is here.
- Each entry lists the percentage of responses that fit in that bucket (slower than max time for previous bucket, faster than min time for next bucket).
Insert response time histogram
256us	1ms	4ms	16ms	64ms	256ms	1s	4s	16s	gt	max	tag
0.000	0.024	47.316	52.571	0.072	0.012	0.002	0.002	nonzero	0.000	5.311	fbmy5635_rel.cy9c_4g_gcp_c2s30_old
0.000	0.021	46.224	53.670	0.070	0.012	0.001	0.001	0.001	0.000	5.881	fbmy5635_rel.cy9c_4g_gcp_c2s30_new
0.000	0.011	51.726	48.173	0.070	0.016	0.002	0.002	nonzero	0.000	5.539	fbmy8028_rel_lto.cy9c_4g_gcp_c2s30_old
0.000	0.026	59.094	40.677	0.174	0.023	0.002	0.003	0.001	0.000	5.654	fbmy8028_rel_lto.cy9c_4g_gcp_c2s30_new
Delete response time histogram
256us	1ms	4ms	16ms	64ms	256ms	1s	4s	16s	gt	max	tag
0.000	0.024	42.107	57.775	0.076	0.014	0.002	0.002	0.001	0.000	5.475	fbmy5635_rel.cy9c_4g_gcp_c2s30_old
0.000	0.021	40.991	58.898	0.073	0.014	0.002	0.001	0.001	0.000	6.134	fbmy5635_rel.cy9c_4g_gcp_c2s30_new
0.000	0.012	48.595	51.299	0.073	0.017	0.002	0.002	nonzero	0.000	4.988	fbmy8028_rel_lto.cy9c_4g_gcp_c2s30_old
0.000	0.028	56.304	43.460	0.178	0.024	0.002	0.004	nonzero	0.000	5.608	fbmy8028_rel_lto.cy9c_4g_gcp_c2s30_new
q100.1
- q100.1: range queries with 100 insert/s per client
- Legend for results is here.
- Each entry lists the percentage of responses that fit in that bucket (slower than max time for previous bucket, faster than min time for next bucket).
Query response time histogram
256us	1ms	4ms	16ms	64ms	256ms	1s	4s	16s	gt	max	tag
85.228	14.771	0.001	nonzero	nonzero	0.000	0.000	0.000	0.000	0.000	0.020	fbmy5635_rel.cy9c_4g_gcp_c2s30_old
79.963	20.035	0.002	nonzero	nonzero	0.000	0.000	0.000	0.000	0.000	0.021	fbmy5635_rel.cy9c_4g_gcp_c2s30_new
98.621	1.377	0.002	nonzero	0.000	0.000	0.000	0.000	0.000	0.000	0.006	fbmy8028_rel_lto.cy9c_4g_gcp_c2s30_old
98.999	0.999	0.002	nonzero	0.000	0.000	0.000	0.000	0.000	0.000	0.016	fbmy8028_rel_lto.cy9c_4g_gcp_c2s30_new
Insert response time histogram
256us	1ms	4ms	16ms	64ms	256ms	1s	4s	16s	gt	max	tag
0.000	27.092	72.891	0.017	0.000	0.000	0.000	0.000	0.000	0.000	0.011	fbmy5635_rel.cy9c_4g_gcp_c2s30_old
0.000	17.804	82.174	0.023	0.000	0.000	0.000	0.000	0.000	0.000	0.013	fbmy5635_rel.cy9c_4g_gcp_c2s30_new
0.000	19.155	80.839	0.007	0.000	0.000	0.000	0.000	0.000	0.000	0.008	fbmy8028_rel_lto.cy9c_4g_gcp_c2s30_old
0.000	16.705	83.280	0.016	0.000	0.000	0.000	0.000	0.000	0.000	0.012	fbmy8028_rel_lto.cy9c_4g_gcp_c2s30_new
Delete response time histogram
256us	1ms	4ms	16ms	64ms	256ms	1s	4s	16s	gt	max	tag
0.000	12.181	87.785	0.035	0.000	0.000	0.000	0.000	0.000	0.000	0.011	fbmy5635_rel.cy9c_4g_gcp_c2s30_old
0.000	8.168	91.757	0.073	0.002	0.000	0.000	0.000	0.000	0.000	0.018	fbmy5635_rel.cy9c_4g_gcp_c2s30_new
0.000	17.849	82.144	0.007	0.000	0.000	0.000	0.000	0.000	0.000	0.008	fbmy8028_rel_lto.cy9c_4g_gcp_c2s30_old
0.000	27.502	72.481	0.017	0.000	0.000	0.000	0.000	0.000	0.000	0.014	fbmy8028_rel_lto.cy9c_4g_gcp_c2s30_new
q500.1
- q500.1: range queries with 500 insert/s per client
- Legend for results is here.
- Each entry lists the percentage of responses that fit in that bucket (slower than max time for previous bucket, faster than min time for next bucket).
Query response time histogram
256us	1ms	4ms	16ms	64ms	256ms	1s	4s	16s	gt	max	tag
78.918	21.078	0.004	nonzero	nonzero	0.000	0.000	0.000	0.000	0.000	0.035	fbmy5635_rel.cy9c_4g_gcp_c2s30_old
74.397	25.597	0.005	nonzero	nonzero	0.000	0.000	0.000	0.000	0.000	0.032	fbmy5635_rel.cy9c_4g_gcp_c2s30_new
97.325	2.670	0.005	nonzero	nonzero	0.000	0.000	0.000	0.000	0.000	0.027	fbmy8028_rel_lto.cy9c_4g_gcp_c2s30_old
97.945	2.050	0.005	nonzero	0.000	0.000	0.000	0.000	0.000	0.000	0.015	fbmy8028_rel_lto.cy9c_4g_gcp_c2s30_new
Insert response time histogram
256us	1ms	4ms	16ms	64ms	256ms	1s	4s	16s	gt	max	tag
0.000	29.008	70.966	0.025	nonzero	nonzero	0.000	0.000	0.000	0.000	0.094	fbmy5635_rel.cy9c_4g_gcp_c2s30_old
0.000	27.804	72.165	0.031	0.000	0.000	0.000	0.000	0.000	0.000	0.013	fbmy5635_rel.cy9c_4g_gcp_c2s30_new
0.000	23.189	76.745	0.065	0.000	0.000	0.000	0.000	0.000	0.000	0.014	fbmy8028_rel_lto.cy9c_4g_gcp_c2s30_old
0.000	35.588	64.363	0.049	nonzero	0.000	0.000	0.000	0.000	0.000	0.028	fbmy8028_rel_lto.cy9c_4g_gcp_c2s30_new
Delete response time histogram
256us	1ms	4ms	16ms	64ms	256ms	1s	4s	16s	gt	max	tag
0.000	31.540	68.432	0.027	0.001	nonzero	0.000	0.000	0.000	0.000	0.094	fbmy5635_rel.cy9c_4g_gcp_c2s30_old
0.000	23.930	76.006	0.062	0.002	0.000	0.000	0.000	0.000	0.000	0.027	fbmy5635_rel.cy9c_4g_gcp_c2s30_new
0.000	32.561	67.365	0.073	0.001	0.000	0.000	0.000	0.000	0.000	0.027	fbmy8028_rel_lto.cy9c_4g_gcp_c2s30_old
0.000	45.258	54.690	0.048	0.004	0.000	0.000	0.000	0.000	0.000	0.029	fbmy8028_rel_lto.cy9c_4g_gcp_c2s30_new
q1000.1
- q1000.1: range queries with 1000 insert/s per client
- Legend for results is here.
- Each entry lists the percentage of responses that fit in that bucket (slower than max time for previous bucket, faster than min time for next bucket).
Query response time histogram
256us	1ms	4ms	16ms	64ms	256ms	1s	4s	16s	gt	max	tag
72.049	27.935	0.016	nonzero	nonzero	0.000	0.000	0.000	0.000	0.000	0.031	fbmy5635_rel.cy9c_4g_gcp_c2s30_old
66.282	33.708	0.010	nonzero	nonzero	0.000	0.000	0.000	0.000	0.000	0.029	fbmy5635_rel.cy9c_4g_gcp_c2s30_new
94.229	5.763	0.008	nonzero	nonzero	0.000	0.000	0.000	0.000	0.000	0.026	fbmy8028_rel_lto.cy9c_4g_gcp_c2s30_old
95.686	4.307	0.007	nonzero	nonzero	0.000	0.000	0.000	0.000	0.000	0.024	fbmy8028_rel_lto.cy9c_4g_gcp_c2s30_new
Insert response time histogram
256us	1ms	4ms	16ms	64ms	256ms	1s	4s	16s	gt	max	tag
0.000	8.696	73.319	17.971	0.014	0.000	0.000	0.000	0.000	0.000	0.023	fbmy5635_rel.cy9c_4g_gcp_c2s30_old
0.000	19.747	80.219	0.034	nonzero	0.000	0.000	0.000	0.000	0.000	0.020	fbmy5635_rel.cy9c_4g_gcp_c2s30_new
0.000	23.716	76.272	0.011	nonzero	0.000	0.000	0.000	0.000	0.000	0.023	fbmy8028_rel_lto.cy9c_4g_gcp_c2s30_old
0.000	33.587	66.405	0.008	0.000	0.000	0.000	0.000	0.000	0.000	0.014	fbmy8028_rel_lto.cy9c_4g_gcp_c2s30_new
Delete response time histogram
256us	1ms	4ms	16ms	64ms	256ms	1s	4s	16s	gt	max	tag
0.000	9.987	73.013	16.982	0.017	0.000	0.000	0.000	0.000	0.000	0.033	fbmy5635_rel.cy9c_4g_gcp_c2s30_old
0.000	16.643	83.290	0.064	0.004	0.000	0.000	0.000	0.000	0.000	0.033	fbmy5635_rel.cy9c_4g_gcp_c2s30_new
0.000	29.324	70.660	0.013	0.003	0.000	0.000	0.000	0.000	0.000	0.037	fbmy8028_rel_lto.cy9c_4g_gcp_c2s30_old
0.000	42.637	57.352	0.009	0.002	0.000	0.000	0.000	0.000	0.000	0.033	fbmy8028_rel_lto.cy9c_4g_gcp_c2s30_new