Introduction
This is a report for the insert benchmark with 20M docs and 4 client(s). It is generated by scripts (bash, awk, sed) and Tufte might not be impressed. An overview of the insert benchmark is here and a short update is here. Below, by DBMS, I mean DBMS+version.config. An example is my8020.c10b40 where my means MySQL, 8020 is version 8.0.20 and c10b40 is the name for the configuration file.
The test server has 8 AMD cores, 16G RAM and an NVMe SSD. It is described here as the Beelink. The benchmark was run with 4 clients and there were 1 or 3 connections per client (1 for queries or inserts without rate limits, 1+1 for rate limited inserts+deletes). It uses 4 tables, one per client. It loads 20M rows per table without secondary indexes, creates secondary indexes, then inserts 50M rows per table with a delete per insert to avoid growing the table. It then does 3 read+write tests for 1800s each that do queries as fast as possible with 100, 500 and then 1000 inserts/second/client concurrent with the queries and 1000 deletes/second to avoid growing the table. The database is cached by Postgres. Clients and the DBMS share one server. The per-database configs are in the per-database subdirectories here.
The tested DBMS are:
- pg152_o2_nofp.cx8_bee - Postgres 15.2, cx8_bee config, o2_nofp build that used: -O2 -no-omit-frame-pointer
- pg152_o2_nofp.cx8a1_bee - Postgres 15.2, cx8a1_bee config, o2_nofp build that used: -O2 -no-omit-frame-pointer, adds wal_compression=lz4
- pg152_o2_nofp.cx8a2_bee - Postgres 15.2, cx8a2_bee config, o2_nofp build that used: -O2 -no-omit-frame-pointer, adds backend_flush_after=256kb
- pg152_o2_nofp.cx8a3_bee - Postgres 15.2, cx8a3_bee config, o2_nofp build that used: -O2 -no-omit-frame-pointer, adds full_page_writes=off
- pg152_o2_nofp.cx8a4_bee - Postgres 15.2, cx8a4_bee config, o2_nofp build that used: -O2 -no-omit-frame-pointer, adds checkpoint_timeout=1800s which already set in the cx8_bee config
- pg152_o2_nofp.cx8a9_bee - Postgres 15.2, cx8a9_bee config, o2_nofp build that used: -O2 -no-omit-frame-pointer, adds checkpoint_timeout=900s
- pg152_o2_nofp.cx8a10_bee - Postgres 15.2, cx8a10_bee config, o2_nofp build that used: -O2 -no-omit-frame-pointer, adds autovacuum_work_mem=256MB
- pg152_o2_nofp.cx8a12_bee - Postgres 15.2, cx8a12_bee config, o2_nofp build that used: -O2 -no-omit-frame-pointer, adds wal_buffers=64MB
- pg152_o2_nofp.cx8a14_bee - Postgres 15.2, cx8a14_bee config, o2_nofp build that used: -O2 -no-omit-frame-pointer, adds backend_flush_after=1MB
- pg152_o2_nofp.cx8a15_bee - Postgres 15.2, cx8a15_bee config, o2_nofp build that used: -O2 -no-omit-frame-pointer, adds max_wal_size=10G
- pg152_o2_nofp.cx8a16_bee - Postgres 15.2, cx8a16_bee config, o2_nofp build that used: -O2 -no-omit-frame-pointer, adds autovacuum_vacuum_scale_factor=0.05 autovacuum_vacuum_insert_scale_factor=0.05
- pg152_o2_nofp.cx8a17_bee - Postgres 15.2, cx8a17_bee config, o2_nofp build that used: -O2 -no-omit-frame-pointer, reduces bgwriter_lru_maxpages from 2000 to 500
- pg152_o2_nofp.cx8a18_bee - Postgres 15.2, cx8a18_bee config, o2_nofp build that used: -O2 -no-omit-frame-pointer, combines a1, a10, a12, a16
Contents
- Summary
- l.i0: load without secondary indexes
- l.x: create secondary indexes
- l.i1: continue load after secondary indexes created
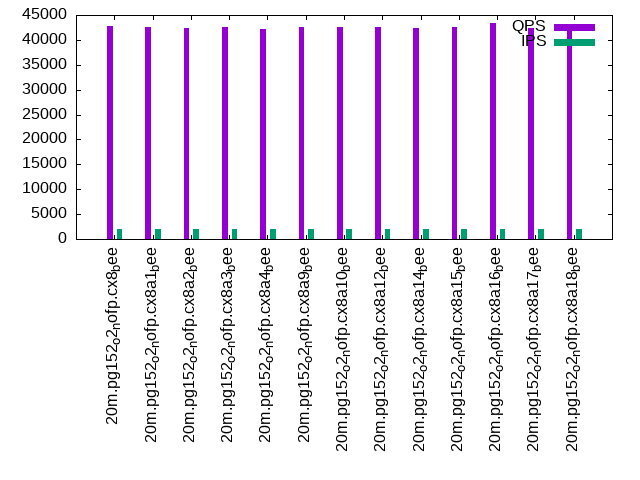
- q100.1: range queries with 100 insert/s per client
- q500.1: range queries with 500 insert/s per client
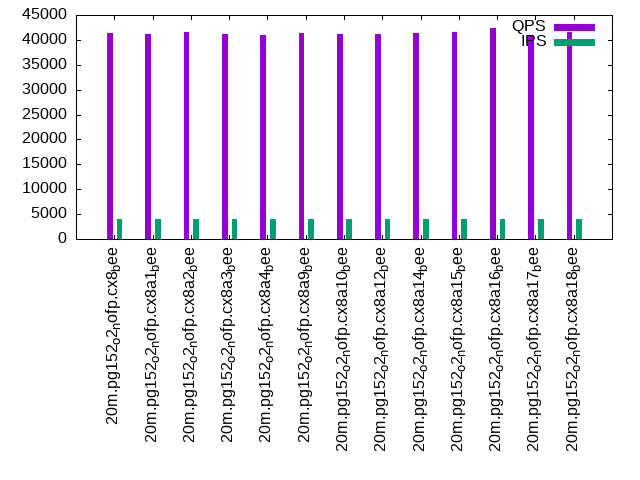
- q1000.1: range queries with 1000 insert/s per client
Summary
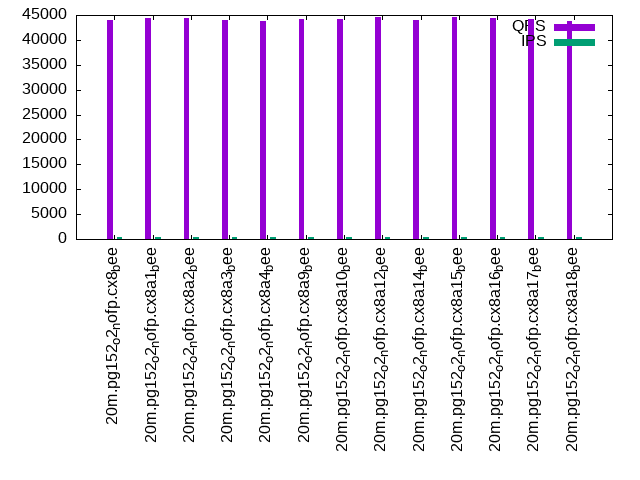
The numbers are inserts/s for l.i0 and l.i1, indexed docs (or rows) /s for l.x and queries/s for q*.2. The values are the average rate over the entire test for inserts (IPS) and queries (QPS). The range of values for IPS and QPS is split into 3 parts: bottom 25%, middle 50%, top 25%. Values in the bottom 25% have a red background, values in the top 25% have a green background and values in the middle have no color. A gray background is used for values that can be ignored because the DBMS did not sustain the target insert rate. Red backgrounds are not used when the minimum value is within 80% of the max value.
| dbms | l.i0 | l.x | l.i1 | q100.1 | q500.1 | q1000.1 |
|---|---|---|---|---|---|---|
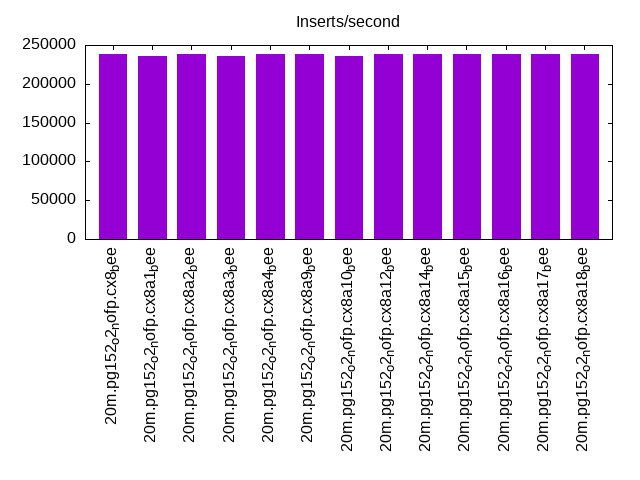
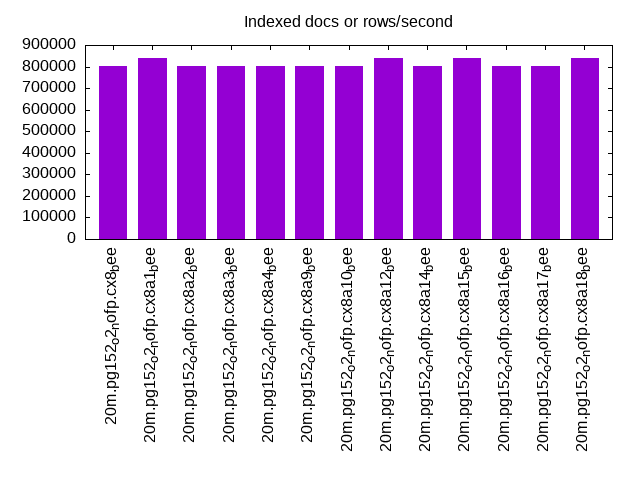
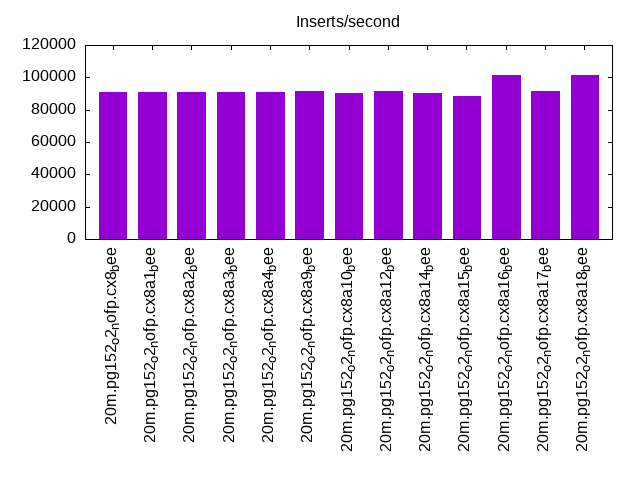
| 20m.pg152_o2_nofp.cx8_bee | 238095 | 804000 | 91012 | 44054 | 42814 | 41304 |
| 20m.pg152_o2_nofp.cx8a1_bee | 235294 | 837500 | 90971 | 44315 | 42512 | 41208 |
| 20m.pg152_o2_nofp.cx8a2_bee | 238095 | 804000 | 90744 | 44471 | 42470 | 41594 |
| 20m.pg152_o2_nofp.cx8a3_bee | 235294 | 804000 | 90662 | 43944 | 42608 | 41207 |
| 20m.pg152_o2_nofp.cx8a4_bee | 238095 | 804000 | 91116 | 43783 | 42254 | 40883 |
| 20m.pg152_o2_nofp.cx8a9_bee | 238095 | 804000 | 91303 | 44293 | 42555 | 41307 |
| 20m.pg152_o2_nofp.cx8a10_bee | 235294 | 804000 | 90539 | 44124 | 42593 | 41118 |
| 20m.pg152_o2_nofp.cx8a12_bee | 238095 | 837500 | 91408 | 44589 | 42680 | 41191 |
| 20m.pg152_o2_nofp.cx8a14_bee | 238095 | 804000 | 90600 | 44045 | 42481 | 41374 |
| 20m.pg152_o2_nofp.cx8a15_bee | 238095 | 837500 | 88613 | 44576 | 42505 | 41608 |
| 20m.pg152_o2_nofp.cx8a16_bee | 238095 | 804000 | 101343 | 44347 | 43347 | 42374 |
| 20m.pg152_o2_nofp.cx8a17_bee | 238095 | 804000 | 91303 | 44241 | 42438 | 41026 |
| 20m.pg152_o2_nofp.cx8a18_bee | 238095 | 837500 | 101471 | 43833 | 42915 | 41598 |
This table has relative throughput, throughput for the DBMS relative to the DBMS in the first line, using the absolute throughput from the previous table.
| dbms | l.i0 | l.x | l.i1 | q100.1 | q500.1 | q1000.1 |
|---|---|---|---|---|---|---|
| 20m.pg152_o2_nofp.cx8_bee | 1.00 | 1.00 | 1.00 | 1.00 | 1.00 | 1.00 |
| 20m.pg152_o2_nofp.cx8a1_bee | 0.99 | 1.04 | 1.00 | 1.01 | 0.99 | 1.00 |
| 20m.pg152_o2_nofp.cx8a2_bee | 1.00 | 1.00 | 1.00 | 1.01 | 0.99 | 1.01 |
| 20m.pg152_o2_nofp.cx8a3_bee | 0.99 | 1.00 | 1.00 | 1.00 | 1.00 | 1.00 |
| 20m.pg152_o2_nofp.cx8a4_bee | 1.00 | 1.00 | 1.00 | 0.99 | 0.99 | 0.99 |
| 20m.pg152_o2_nofp.cx8a9_bee | 1.00 | 1.00 | 1.00 | 1.01 | 0.99 | 1.00 |
| 20m.pg152_o2_nofp.cx8a10_bee | 0.99 | 1.00 | 0.99 | 1.00 | 0.99 | 1.00 |
| 20m.pg152_o2_nofp.cx8a12_bee | 1.00 | 1.04 | 1.00 | 1.01 | 1.00 | 1.00 |
| 20m.pg152_o2_nofp.cx8a14_bee | 1.00 | 1.00 | 1.00 | 1.00 | 0.99 | 1.00 |
| 20m.pg152_o2_nofp.cx8a15_bee | 1.00 | 1.04 | 0.97 | 1.01 | 0.99 | 1.01 |
| 20m.pg152_o2_nofp.cx8a16_bee | 1.00 | 1.00 | 1.11 | 1.01 | 1.01 | 1.03 |
| 20m.pg152_o2_nofp.cx8a17_bee | 1.00 | 1.00 | 1.00 | 1.00 | 0.99 | 0.99 |
| 20m.pg152_o2_nofp.cx8a18_bee | 1.00 | 1.04 | 1.11 | 0.99 | 1.00 | 1.01 |
This lists the average rate of inserts/s for the tests that do inserts concurrent with queries. For such tests the query rate is listed in the table above. The read+write tests are setup so that the insert rate should match the target rate every second. Cells that are not at least 95% of the target have a red background to indicate a failure to satisfy the target.
| dbms | q100.1 | q500.1 | q1000.1 |
|---|---|---|---|
| pg152_o2_nofp.cx8_bee | 399 | 1994 | 3989 |
| pg152_o2_nofp.cx8a1_bee | 399 | 1993 | 3989 |
| pg152_o2_nofp.cx8a2_bee | 399 | 1993 | 3987 |
| pg152_o2_nofp.cx8a3_bee | 399 | 1993 | 3989 |
| pg152_o2_nofp.cx8a4_bee | 399 | 1994 | 3989 |
| pg152_o2_nofp.cx8a9_bee | 399 | 1994 | 3989 |
| pg152_o2_nofp.cx8a10_bee | 399 | 1994 | 3989 |
| pg152_o2_nofp.cx8a12_bee | 399 | 1993 | 3989 |
| pg152_o2_nofp.cx8a14_bee | 399 | 1994 | 3987 |
| pg152_o2_nofp.cx8a15_bee | 399 | 1993 | 3989 |
| pg152_o2_nofp.cx8a16_bee | 399 | 1994 | 3989 |
| pg152_o2_nofp.cx8a17_bee | 399 | 1994 | 3989 |
| pg152_o2_nofp.cx8a18_bee | 399 | 1994 | 3989 |
| target | 400 | 2000 | 4000 |
l.i0
l.i0: load without secondary indexes. Graphs for performance per 1-second interval are here.
Average throughput:
Insert response time histogram: each cell has the percentage of responses that take <= the time in the header and max is the max response time in seconds. For the max column values in the top 25% of the range have a red background and in the bottom 25% of the range have a green background. The red background is not used when the min value is within 80% of the max value.
| dbms | 256us | 1ms | 4ms | 16ms | 64ms | 256ms | 1s | 4s | 16s | gt | max |
|---|---|---|---|---|---|---|---|---|---|---|---|
| pg152_o2_nofp.cx8_bee | 99.949 | 0.051 | 0.016 | ||||||||
| pg152_o2_nofp.cx8a1_bee | 99.945 | 0.055 | 0.012 | ||||||||
| pg152_o2_nofp.cx8a2_bee | 99.957 | 0.043 | 0.011 | ||||||||
| pg152_o2_nofp.cx8a3_bee | 99.944 | 0.056 | 0.001 | 0.017 | |||||||
| pg152_o2_nofp.cx8a4_bee | 99.951 | 0.049 | 0.015 | ||||||||
| pg152_o2_nofp.cx8a9_bee | 99.945 | 0.054 | 0.001 | 0.020 | |||||||
| pg152_o2_nofp.cx8a10_bee | 99.939 | 0.060 | 0.001 | 0.018 | |||||||
| pg152_o2_nofp.cx8a12_bee | 99.955 | 0.045 | 0.011 | ||||||||
| pg152_o2_nofp.cx8a14_bee | 99.950 | 0.051 | 0.012 | ||||||||
| pg152_o2_nofp.cx8a15_bee | 99.939 | 0.060 | 0.001 | 0.022 | |||||||
| pg152_o2_nofp.cx8a16_bee | 99.946 | 0.054 | 0.011 | ||||||||
| pg152_o2_nofp.cx8a17_bee | 99.945 | 0.055 | 0.001 | 0.022 | |||||||
| pg152_o2_nofp.cx8a18_bee | 99.945 | 0.055 | 0.001 | 0.017 |
Performance metrics for the DBMS listed above. Some are normalized by throughput, others are not. Legend for results is here.
ips	qps	rps	rmbps	wps	wmbps	rpq	rkbpq	wpi	wkbpi	csps	cpups	cspq	cpupq	dbgb1	dbgb2	rss	maxop	p50	p99	tag
238095	0	0	0.0	280.3	102.6	0.000	0.000	0.001	0.441	23627	71.8	0.099	24	1.9	5.2	0.0	0.016	70224	44851	20m.pg152_o2_nofp.cx8_bee
235294	0	0	0.0	283.5	103.3	0.000	0.000	0.001	0.450	23675	72.2	0.101	25	1.9	5.2	1.9	0.012	70723	21976	20m.pg152_o2_nofp.cx8a1_bee
238095	0	0	0.0	281.8	102.6	0.000	0.000	0.001	0.441	23637	72.2	0.099	24	1.9	5.2	0.0	0.011	69625	1999	20m.pg152_o2_nofp.cx8a2_bee
235294	0	0	0.0	272.7	99.0	0.000	0.000	0.001	0.431	23104	70.7	0.098	24	1.9	5.2	0.0	0.017	70124	45051	20m.pg152_o2_nofp.cx8a3_bee
238095	0	0	0.0	283.0	102.6	0.000	0.000	0.001	0.441	23518	72.1	0.099	24	1.9	5.2	0.0	0.015	70423	21177	20m.pg152_o2_nofp.cx8a4_bee
238095	0	0	0.0	280.2	102.3	0.000	0.000	0.001	0.440	23345	72.1	0.098	24	1.9	5.2	0.0	0.020	70224	35874	20m.pg152_o2_nofp.cx8a9_bee
235294	0	0	0.0	271.5	98.8	0.000	0.000	0.001	0.430	23379	70.8	0.099	24	1.9	5.2	0.0	0.018	70220	59036	20m.pg152_o2_nofp.cx8a10_bee
238095	0	0	0.0	281.3	102.3	0.000	0.000	0.001	0.440	23517	72.1	0.099	24	1.9	5.2	0.0	0.011	70024	60955	20m.pg152_o2_nofp.cx8a12_bee
238095	0	0	0.0	282.3	102.7	0.000	0.000	0.001	0.442	23766	72.1	0.100	24	1.9	5.2	0.0	0.012	69724	57659	20m.pg152_o2_nofp.cx8a14_bee
238095	0	0	0.0	283.0	102.7	0.000	0.000	0.001	0.442	23579	72.1	0.099	24	1.9	5.2	0.0	0.022	69924	61832	20m.pg152_o2_nofp.cx8a15_bee
238095	0	0	0.0	279.3	102.6	0.000	0.000	0.001	0.441	23661	72.5	0.099	24	1.9	5.2	0.0	0.011	70308	31078	20m.pg152_o2_nofp.cx8a16_bee
238095	0	0	0.0	283.1	102.8	0.000	0.000	0.001	0.442	23613	71.9	0.099	24	1.9	5.2	0.0	0.022	70749	16788	20m.pg152_o2_nofp.cx8a17_bee
238095	0	0	0.0	281.1	102.9	0.000	0.000	0.001	0.442	23228	72.1	0.098	24	1.9	5.2	0.0	0.017	70448	15988	20m.pg152_o2_nofp.cx8a18_bee
l.x
l.x: create secondary indexes.
Average throughput:
Performance metrics for the DBMS listed above. Some are normalized by throughput, others are not. Legend for results is here.
ips	qps	rps	rmbps	wps	wmbps	rpq	rkbpq	wpi	wkbpi	csps	cpups	cspq	cpupq	dbgb1	dbgb2	rss	maxop	p50	p99	tag
804000	0	0	0.0	461.6	214.3	0.000	0.000	0.001	0.273	2831	37.8	0.004	4	3.7	8.6	0.0	0.003	NA	NA	20m.pg152_o2_nofp.cx8_bee
837500	0	0	0.0	349.7	161.2	0.000	0.000	0.000	0.197	2399	38.2	0.003	4	3.7	8.0	0.0	0.004	NA	NA	20m.pg152_o2_nofp.cx8a1_bee
804000	0	0	0.0	462.3	214.0	0.000	0.000	0.001	0.273	2471	37.2	0.003	4	3.7	8.6	0.0	0.004	NA	NA	20m.pg152_o2_nofp.cx8a2_bee
804000	0	0	0.0	462.2	214.1	0.000	0.000	0.001	0.273	2260	36.8	0.003	4	3.7	8.6	0.0	0.004	NA	NA	20m.pg152_o2_nofp.cx8a3_bee
804000	0	0	0.0	464.4	214.2	0.000	0.000	0.001	0.273	2522	37.5	0.003	4	3.7	8.6	0.0	0.004	NA	NA	20m.pg152_o2_nofp.cx8a4_bee
804000	0	0	0.0	464.2	214.3	0.000	0.000	0.001	0.273	2542	37.5	0.003	4	3.7	8.6	0.0	0.004	NA	NA	20m.pg152_o2_nofp.cx8a9_bee
804000	0	0	0.0	464.7	214.7	0.000	0.000	0.001	0.273	2482	37.0	0.003	4	3.7	8.6	0.0	0.004	NA	NA	20m.pg152_o2_nofp.cx8a10_bee
837500	0	0	0.0	362.6	167.5	0.000	0.000	0.000	0.205	2023	40.0	0.002	4	3.7	8.6	0.0	0.004	NA	NA	20m.pg152_o2_nofp.cx8a12_bee
804000	0	0	0.0	463.4	214.0	0.000	0.000	0.001	0.273	2082	37.3	0.003	4	3.7	8.6	0.0	0.004	NA	NA	20m.pg152_o2_nofp.cx8a14_bee
837500	0	0	0.0	463.4	213.9	0.000	0.000	0.001	0.262	2111	37.3	0.003	4	3.7	8.6	0.0	0.004	NA	NA	20m.pg152_o2_nofp.cx8a15_bee
804000	0	0	0.0	464.0	214.3	0.000	0.000	0.001	0.273	2110	37.8	0.003	4	3.7	8.6	0.0	0.003	NA	NA	20m.pg152_o2_nofp.cx8a16_bee
804000	0	0	0.0	462.7	213.8	0.000	0.000	0.001	0.272	2319	37.5	0.003	4	3.7	8.6	0.0	0.004	NA	NA	20m.pg152_o2_nofp.cx8a17_bee
837500	0	0	0.0	268.6	121.9	0.000	0.000	0.000	0.149	1480	41.0	0.002	4	3.7	8.0	0.0	0.003	NA	NA	20m.pg152_o2_nofp.cx8a18_bee
l.i1
l.i1: continue load after secondary indexes created. Graphs for performance per 1-second interval are here.
Average throughput:
Insert response time histogram: each cell has the percentage of responses that take <= the time in the header and max is the max response time in seconds. For the max column values in the top 25% of the range have a red background and in the bottom 25% of the range have a green background. The red background is not used when the min value is within 80% of the max value.
| dbms | 256us | 1ms | 4ms | 16ms | 64ms | 256ms | 1s | 4s | 16s | gt | max |
|---|---|---|---|---|---|---|---|---|---|---|---|
| pg152_o2_nofp.cx8_bee | 99.508 | 0.487 | 0.005 | 0.059 | |||||||
| pg152_o2_nofp.cx8a1_bee | 99.456 | 0.542 | 0.001 | 0.029 | |||||||
| pg152_o2_nofp.cx8a2_bee | 99.488 | 0.507 | 0.005 | 0.052 | |||||||
| pg152_o2_nofp.cx8a3_bee | 99.564 | 0.435 | 0.001 | 0.050 | |||||||
| pg152_o2_nofp.cx8a4_bee | 99.494 | 0.499 | 0.007 | 0.048 | |||||||
| pg152_o2_nofp.cx8a9_bee | 99.487 | 0.509 | 0.004 | 0.056 | |||||||
| pg152_o2_nofp.cx8a10_bee | 99.503 | 0.493 | 0.004 | 0.055 | |||||||
| pg152_o2_nofp.cx8a12_bee | 99.472 | 0.525 | 0.003 | nonzero | 0.168 | ||||||
| pg152_o2_nofp.cx8a14_bee | 99.483 | 0.510 | 0.006 | nonzero | 0.100 | ||||||
| pg152_o2_nofp.cx8a15_bee | 99.074 | 0.871 | 0.055 | nonzero | 0.073 | ||||||
| pg152_o2_nofp.cx8a16_bee | 99.596 | 0.394 | 0.010 | 0.049 | |||||||
| pg152_o2_nofp.cx8a17_bee | 99.476 | 0.519 | 0.006 | nonzero | 0.090 | ||||||
| pg152_o2_nofp.cx8a18_bee | 99.631 | 0.367 | 0.002 | nonzero | 0.201 |
Delete response time histogram: each cell has the percentage of responses that take <= the time in the header and max is the max response time in seconds. For the max column values in the top 25% of the range have a red background and in the bottom 25% of the range have a green background. The red background is not used when the min value is within 80% of the max value.
| dbms | 256us | 1ms | 4ms | 16ms | 64ms | 256ms | 1s | 4s | 16s | gt | max |
|---|---|---|---|---|---|---|---|---|---|---|---|
| pg152_o2_nofp.cx8_bee | 3.468 | 88.035 | 4.303 | 4.185 | 0.009 | nonzero | 0.090 | ||||
| pg152_o2_nofp.cx8a1_bee | 3.360 | 87.793 | 4.559 | 4.273 | 0.014 | 0.034 | |||||
| pg152_o2_nofp.cx8a2_bee | 3.594 | 87.696 | 4.281 | 4.416 | 0.012 | 0.049 | |||||
| pg152_o2_nofp.cx8a3_bee | 3.341 | 88.250 | 4.296 | 4.107 | 0.005 | 0.048 | |||||
| pg152_o2_nofp.cx8a4_bee | 3.281 | 88.159 | 4.327 | 4.221 | 0.011 | 0.044 | |||||
| pg152_o2_nofp.cx8a9_bee | 3.630 | 87.735 | 4.425 | 4.201 | 0.009 | nonzero | 0.066 | ||||
| pg152_o2_nofp.cx8a10_bee | 3.226 | 88.261 | 4.431 | 4.075 | 0.007 | nonzero | 0.064 | ||||
| pg152_o2_nofp.cx8a12_bee | 3.601 | 87.701 | 4.425 | 4.261 | 0.012 | nonzero | 0.240 | ||||
| pg152_o2_nofp.cx8a14_bee | 3.457 | 87.928 | 4.421 | 4.183 | 0.011 | 0.045 | |||||
| pg152_o2_nofp.cx8a15_bee | 4.802 | 86.211 | 4.637 | 4.311 | 0.039 | nonzero | 0.071 | ||||
| pg152_o2_nofp.cx8a16_bee | 4.119 | 87.351 | 7.735 | 0.789 | 0.006 | nonzero | 0.074 | ||||
| pg152_o2_nofp.cx8a17_bee | 3.557 | 87.903 | 4.368 | 4.160 | 0.012 | 0.048 | |||||
| pg152_o2_nofp.cx8a18_bee | 3.548 | 87.889 | 7.812 | 0.750 | 0.001 | nonzero | 0.198 |
Performance metrics for the DBMS listed above. Some are normalized by throughput, others are not. Legend for results is here.
ips	qps	rps	rmbps	wps	wmbps	rpq	rkbpq	wpi	wkbpi	csps	cpups	cspq	cpupq	dbgb1	dbgb2	rss	maxop	p50	p99	tag
91012	0	0	0.0	262.3	71.0	0.000	0.000	0.003	0.799	34610	75.9	0.380	67	6.1	46.1	0.0	0.059	26817	4145	20m.pg152_o2_nofp.cx8_bee
90971	0	0	0.0	246.1	66.4	0.000	0.000	0.003	0.747	34551	77.0	0.380	68	6.1	46.1	0.0	0.029	26921	4047	20m.pg152_o2_nofp.cx8a1_bee
90744	0	0	0.0	261.9	71.0	0.000	0.000	0.003	0.801	34577	76.7	0.381	68	6.1	46.1	0.0	0.052	26920	4046	20m.pg152_o2_nofp.cx8a2_bee
90662	0	0	0.0	221.6	60.3	0.000	0.000	0.002	0.681	34571	75.4	0.381	67	6.1	46.1	0.0	0.050	26771	4096	20m.pg152_o2_nofp.cx8a3_bee
91116	0	0	0.0	262.0	71.1	0.000	0.000	0.003	0.799	34702	76.2	0.381	67	6.1	46.1	0.4	0.048	26921	4096	20m.pg152_o2_nofp.cx8a4_bee
91303	0	0	0.0	263.0	71.3	0.000	0.000	0.003	0.800	34746	76.4	0.381	67	6.1	46.1	1.6	0.056	26871	4097	20m.pg152_o2_nofp.cx8a9_bee
90539	0	0	0.0	261.5	70.7	0.000	0.000	0.003	0.799	34490	75.6	0.381	67	6.1	46.1	0.0	0.055	26582	4195	20m.pg152_o2_nofp.cx8a10_bee
91408	0	0	0.0	264.0	71.5	0.000	0.000	0.003	0.801	34729	77.2	0.380	68	6.1	46.1	0.0	0.168	27070	4096	20m.pg152_o2_nofp.cx8a12_bee
90600	0	0	0.0	261.4	70.7	0.000	0.000	0.003	0.799	34442	76.0	0.380	67	6.0	46.1	0.0	0.100	26783	4177	20m.pg152_o2_nofp.cx8a14_bee
88613	0	0	0.0	626.4	153.2	0.000	0.000	0.007	1.770	33149	76.1	0.374	69	6.1	16.1	0.0	0.073	26171	4046	20m.pg152_o2_nofp.cx8a15_bee
101343	0	0	0.0	287.7	78.6	0.000	0.000	0.003	0.794	38220	79.3	0.377	63	5.7	45.7	0.0	0.049	26871	10688	20m.pg152_o2_nofp.cx8a16_bee
91303	0	0	0.0	263.8	71.5	0.000	0.000	0.003	0.802	34641	76.4	0.379	67	6.1	46.1	0.0	0.090	27020	4096	20m.pg152_o2_nofp.cx8a17_bee
101471	0	0	0.0	270.4	73.5	0.000	0.000	0.003	0.741	38284	79.4	0.377	63	5.7	45.7	0.0	0.201	26871	11042	20m.pg152_o2_nofp.cx8a18_bee
q100.1
q100.1: range queries with 100 insert/s per client. Graphs for performance per 1-second interval are here.
Average throughput:
Query response time histogram: each cell has the percentage of responses that take <= the time in the header and max is the max response time in seconds. For max values in the top 25% of the range have a red background and in the bottom 25% of the range have a green background. The red background is not used when the min value is within 80% of the max value.
| dbms | 256us | 1ms | 4ms | 16ms | 64ms | 256ms | 1s | 4s | 16s | gt | max |
|---|---|---|---|---|---|---|---|---|---|---|---|
| pg152_o2_nofp.cx8_bee | 99.984 | 0.011 | 0.005 | nonzero | 0.008 | ||||||
| pg152_o2_nofp.cx8a1_bee | 99.983 | 0.012 | 0.005 | nonzero | 0.013 | ||||||
| pg152_o2_nofp.cx8a2_bee | 99.984 | 0.011 | 0.005 | nonzero | 0.006 | ||||||
| pg152_o2_nofp.cx8a3_bee | 99.988 | 0.008 | 0.004 | nonzero | 0.005 | ||||||
| pg152_o2_nofp.cx8a4_bee | 99.985 | 0.011 | 0.005 | nonzero | 0.008 | ||||||
| pg152_o2_nofp.cx8a9_bee | 99.973 | 0.019 | 0.007 | nonzero | 0.008 | ||||||
| pg152_o2_nofp.cx8a10_bee | 99.984 | 0.011 | 0.005 | nonzero | 0.007 | ||||||
| pg152_o2_nofp.cx8a12_bee | 99.985 | 0.010 | 0.005 | nonzero | 0.006 | ||||||
| pg152_o2_nofp.cx8a14_bee | 99.984 | 0.011 | 0.005 | nonzero | 0.010 | ||||||
| pg152_o2_nofp.cx8a15_bee | 99.989 | 0.006 | 0.004 | nonzero | 0.011 | ||||||
| pg152_o2_nofp.cx8a16_bee | 99.985 | 0.010 | 0.005 | nonzero | 0.009 | ||||||
| pg152_o2_nofp.cx8a17_bee | 99.985 | 0.010 | 0.005 | nonzero | 0.012 | ||||||
| pg152_o2_nofp.cx8a18_bee | 99.984 | 0.011 | 0.005 | nonzero | 0.015 |
Insert response time histogram: each cell has the percentage of responses that take <= the time in the header and max is the max response time in seconds. For max values in the top 25% of the range have a red background and in the bottom 25% of the range have a green background. The red background is not used when the min value is within 80% of the max value.
| dbms | 256us | 1ms | 4ms | 16ms | 64ms | 256ms | 1s | 4s | 16s | gt | max |
|---|---|---|---|---|---|---|---|---|---|---|---|
| pg152_o2_nofp.cx8_bee | 99.917 | 0.083 | 0.008 | ||||||||
| pg152_o2_nofp.cx8a1_bee | 99.625 | 0.375 | 0.007 | ||||||||
| pg152_o2_nofp.cx8a2_bee | 99.847 | 0.153 | 0.007 | ||||||||
| pg152_o2_nofp.cx8a3_bee | 99.951 | 0.049 | 0.007 | ||||||||
| pg152_o2_nofp.cx8a4_bee | 99.917 | 0.083 | 0.009 | ||||||||
| pg152_o2_nofp.cx8a9_bee | 99.896 | 0.104 | 0.009 | ||||||||
| pg152_o2_nofp.cx8a10_bee | 99.778 | 0.222 | 0.007 | ||||||||
| pg152_o2_nofp.cx8a12_bee | 99.868 | 0.132 | 0.008 | ||||||||
| pg152_o2_nofp.cx8a14_bee | 99.889 | 0.111 | 0.006 | ||||||||
| pg152_o2_nofp.cx8a15_bee | 99.875 | 0.125 | 0.007 | ||||||||
| pg152_o2_nofp.cx8a16_bee | 99.931 | 0.069 | 0.006 | ||||||||
| pg152_o2_nofp.cx8a17_bee | 99.951 | 0.049 | 0.006 | ||||||||
| pg152_o2_nofp.cx8a18_bee | 99.674 | 0.326 | 0.007 |
Delete response time histogram: each cell has the percentage of responses that take <= the time in the header and max is the max response time in seconds. For max values in the top 25% of the range have a red background and in the bottom 25% of the range have a green background. The red background is not used when the min value is within 80% of the max value.
| dbms | 256us | 1ms | 4ms | 16ms | 64ms | 256ms | 1s | 4s | 16s | gt | max |
|---|---|---|---|---|---|---|---|---|---|---|---|
| pg152_o2_nofp.cx8_bee | 15.549 | 69.431 | 15.014 | 0.007 | 0.005 | ||||||
| pg152_o2_nofp.cx8a1_bee | 11.653 | 76.514 | 11.660 | 0.174 | 0.006 | ||||||
| pg152_o2_nofp.cx8a2_bee | 15.486 | 73.222 | 11.208 | 0.083 | 0.006 | ||||||
| pg152_o2_nofp.cx8a3_bee | 14.278 | 70.465 | 15.250 | 0.007 | 0.005 | ||||||
| pg152_o2_nofp.cx8a4_bee | 13.431 | 71.500 | 15.035 | 0.035 | 0.006 | ||||||
| pg152_o2_nofp.cx8a9_bee | 20.757 | 70.736 | 8.486 | 0.021 | 0.007 | ||||||
| pg152_o2_nofp.cx8a10_bee | 16.625 | 66.910 | 16.375 | 0.090 | 0.007 | ||||||
| pg152_o2_nofp.cx8a12_bee | 15.319 | 68.854 | 15.674 | 0.153 | 0.008 | ||||||
| pg152_o2_nofp.cx8a14_bee | 14.826 | 65.076 | 20.042 | 0.056 | 0.005 | ||||||
| pg152_o2_nofp.cx8a15_bee | 18.924 | 68.646 | 12.396 | 0.035 | 0.008 | ||||||
| pg152_o2_nofp.cx8a16_bee | 17.181 | 67.653 | 15.062 | 0.104 | 0.006 | ||||||
| pg152_o2_nofp.cx8a17_bee | 17.382 | 73.986 | 8.611 | 0.021 | 0.006 | ||||||
| pg152_o2_nofp.cx8a18_bee | 13.493 | 63.521 | 22.792 | 0.194 | 0.007 |
Performance metrics for the DBMS listed above. Some are normalized by throughput, others are not. Legend for results is here.
ips	qps	rps	rmbps	wps	wmbps	rpq	rkbpq	wpi	wkbpi	csps	cpups	cspq	cpupq	dbgb1	dbgb2	rss	maxop	p50	p99	tag
399	44054	0	0.0	22.7	3.7	0.000	0.000	0.057	9.416	168015	50.2	3.814	91	6.1	46.1	0.0	0.008	11236	9493	20m.pg152_o2_nofp.cx8_bee
399	44315	0	0.0	19.2	2.8	0.000	0.000	0.048	7.090	169002	50.3	3.814	91	6.0	46.1	0.0	0.013	11256	9270	20m.pg152_o2_nofp.cx8a1_bee
399	44471	0	0.0	22.4	3.4	0.000	0.000	0.056	8.768	169605	50.3	3.814	90	6.1	46.1	0.0	0.006	11379	9513	20m.pg152_o2_nofp.cx8a2_bee
399	43944	0	0.0	18.0	2.3	0.000	0.000	0.045	5.885	167697	50.2	3.816	91	6.1	46.1	0.0	0.005	11188	9318	20m.pg152_o2_nofp.cx8a3_bee
399	43783	0	0.0	22.9	3.5	0.000	0.000	0.057	8.970	166998	50.2	3.814	92	6.1	46.1	0.0	0.008	11112	9529	20m.pg152_o2_nofp.cx8a4_bee
399	44293	0	0.0	90.5	6.5	0.000	0.000	0.227	16.787	168983	50.3	3.815	91	6.1	46.1	0.0	0.008	11284	9110	20m.pg152_o2_nofp.cx8a9_bee
399	44124	0	0.0	21.8	3.4	0.000	0.000	0.055	8.762	168257	50.3	3.813	91	6.1	46.1	0.0	0.007	11224	9350	20m.pg152_o2_nofp.cx8a10_bee
399	44589	0	0.0	22.2	3.5	0.000	0.000	0.056	9.027	170064	50.4	3.814	90	6.1	46.1	0.0	0.006	11252	9673	20m.pg152_o2_nofp.cx8a12_bee
399	44045	0	0.0	24.0	4.0	0.000	0.000	0.060	10.157	167994	50.4	3.814	92	6.0	46.1	0.0	0.010	11124	9238	20m.pg152_o2_nofp.cx8a14_bee
399	44576	0	0.0	10.7	1.1	0.000	0.000	0.027	2.812	170042	50.2	3.815	90	6.1	16.1	0.0	0.011	11236	9637	20m.pg152_o2_nofp.cx8a15_bee
399	44347	0	0.0	20.0	3.0	0.000	0.000	0.050	7.613	169113	50.2	3.813	91	5.7	45.7	0.0	0.009	11284	9286	20m.pg152_o2_nofp.cx8a16_bee
399	44241	0	0.0	21.5	3.3	0.000	0.000	0.054	8.510	168754	50.3	3.814	91	6.0	46.1	0.0	0.012	11140	9158	20m.pg152_o2_nofp.cx8a17_bee
399	43833	0	0.0	17.7	2.4	0.000	0.000	0.044	6.126	167082	50.3	3.812	92	5.7	45.7	0.0	0.015	11117	8934	20m.pg152_o2_nofp.cx8a18_bee
q500.1
q500.1: range queries with 500 insert/s per client. Graphs for performance per 1-second interval are here.
Average throughput:
Query response time histogram: each cell has the percentage of responses that take <= the time in the header and max is the max response time in seconds. For max values in the top 25% of the range have a red background and in the bottom 25% of the range have a green background. The red background is not used when the min value is within 80% of the max value.
| dbms | 256us | 1ms | 4ms | 16ms | 64ms | 256ms | 1s | 4s | 16s | gt | max |
|---|---|---|---|---|---|---|---|---|---|---|---|
| pg152_o2_nofp.cx8_bee | 99.946 | 0.033 | 0.019 | 0.002 | nonzero | 0.031 | |||||
| pg152_o2_nofp.cx8a1_bee | 99.946 | 0.033 | 0.019 | 0.002 | nonzero | 0.022 | |||||
| pg152_o2_nofp.cx8a2_bee | 99.946 | 0.034 | 0.019 | 0.002 | nonzero | 0.027 | |||||
| pg152_o2_nofp.cx8a3_bee | 99.952 | 0.028 | 0.018 | 0.002 | nonzero | 0.028 | |||||
| pg152_o2_nofp.cx8a4_bee | 99.948 | 0.032 | 0.018 | 0.002 | nonzero | 0.033 | |||||
| pg152_o2_nofp.cx8a9_bee | 99.932 | 0.047 | 0.019 | 0.002 | nonzero | 0.024 | |||||
| pg152_o2_nofp.cx8a10_bee | 99.947 | 0.032 | 0.019 | 0.002 | nonzero | 0.019 | |||||
| pg152_o2_nofp.cx8a12_bee | 99.947 | 0.032 | 0.020 | 0.002 | nonzero | 0.021 | |||||
| pg152_o2_nofp.cx8a14_bee | 99.947 | 0.033 | 0.018 | 0.002 | nonzero | 0.021 | |||||
| pg152_o2_nofp.cx8a15_bee | 99.937 | 0.043 | 0.019 | 0.002 | nonzero | 0.030 | |||||
| pg152_o2_nofp.cx8a16_bee | 99.955 | 0.026 | 0.018 | 0.001 | nonzero | 0.023 | |||||
| pg152_o2_nofp.cx8a17_bee | 99.948 | 0.031 | 0.019 | 0.002 | nonzero | 0.025 | |||||
| pg152_o2_nofp.cx8a18_bee | 99.953 | 0.027 | 0.019 | 0.001 | nonzero | 0.023 |
Insert response time histogram: each cell has the percentage of responses that take <= the time in the header and max is the max response time in seconds. For max values in the top 25% of the range have a red background and in the bottom 25% of the range have a green background. The red background is not used when the min value is within 80% of the max value.
| dbms | 256us | 1ms | 4ms | 16ms | 64ms | 256ms | 1s | 4s | 16s | gt | max |
|---|---|---|---|---|---|---|---|---|---|---|---|
| pg152_o2_nofp.cx8_bee | 97.247 | 2.682 | 0.071 | 0.038 | |||||||
| pg152_o2_nofp.cx8a1_bee | 97.425 | 2.536 | 0.039 | 0.030 | |||||||
| pg152_o2_nofp.cx8a2_bee | 97.756 | 2.200 | 0.044 | 0.029 | |||||||
| pg152_o2_nofp.cx8a3_bee | 96.978 | 2.968 | 0.054 | 0.036 | |||||||
| pg152_o2_nofp.cx8a4_bee | 97.374 | 2.557 | 0.069 | 0.038 | |||||||
| pg152_o2_nofp.cx8a9_bee | 98.053 | 1.899 | 0.049 | 0.034 | |||||||
| pg152_o2_nofp.cx8a10_bee | 98.217 | 1.768 | 0.015 | 0.020 | |||||||
| pg152_o2_nofp.cx8a12_bee | 97.911 | 2.068 | 0.021 | 0.023 | |||||||
| pg152_o2_nofp.cx8a14_bee | 97.435 | 2.539 | 0.026 | 0.025 | |||||||
| pg152_o2_nofp.cx8a15_bee | 98.083 | 1.871 | 0.046 | 0.035 | |||||||
| pg152_o2_nofp.cx8a16_bee | 98.393 | 1.599 | 0.008 | 0.022 | |||||||
| pg152_o2_nofp.cx8a17_bee | 97.856 | 2.103 | 0.042 | 0.032 | |||||||
| pg152_o2_nofp.cx8a18_bee | 97.771 | 2.196 | 0.033 | 0.028 |
Delete response time histogram: each cell has the percentage of responses that take <= the time in the header and max is the max response time in seconds. For max values in the top 25% of the range have a red background and in the bottom 25% of the range have a green background. The red background is not used when the min value is within 80% of the max value.
| dbms | 256us | 1ms | 4ms | 16ms | 64ms | 256ms | 1s | 4s | 16s | gt | max |
|---|---|---|---|---|---|---|---|---|---|---|---|
| pg152_o2_nofp.cx8_bee | 44.054 | 31.554 | 8.411 | 15.722 | 0.258 | 0.032 | |||||
| pg152_o2_nofp.cx8a1_bee | 37.512 | 40.050 | 8.203 | 14.175 | 0.060 | 0.026 | |||||
| pg152_o2_nofp.cx8a2_bee | 44.403 | 33.281 | 8.036 | 14.146 | 0.135 | 0.032 | |||||
| pg152_o2_nofp.cx8a3_bee | 46.368 | 30.003 | 8.312 | 15.004 | 0.312 | 0.034 | |||||
| pg152_o2_nofp.cx8a4_bee | 43.768 | 31.492 | 8.475 | 15.915 | 0.350 | 0.034 | |||||
| pg152_o2_nofp.cx8a9_bee | 45.469 | 30.471 | 7.799 | 15.990 | 0.271 | 0.036 | |||||
| pg152_o2_nofp.cx8a10_bee | 45.615 | 32.794 | 8.253 | 13.315 | 0.022 | 0.024 | |||||
| pg152_o2_nofp.cx8a12_bee | 43.488 | 33.985 | 8.340 | 14.131 | 0.057 | 0.026 | |||||
| pg152_o2_nofp.cx8a14_bee | 43.968 | 32.242 | 8.314 | 15.410 | 0.067 | 0.030 | |||||
| pg152_o2_nofp.cx8a15_bee | 45.100 | 30.285 | 8.603 | 15.882 | 0.131 | 0.032 | |||||
| pg152_o2_nofp.cx8a16_bee | 44.796 | 37.590 | 17.065 | 0.544 | 0.004 | 0.020 | |||||
| pg152_o2_nofp.cx8a17_bee | 43.465 | 33.537 | 8.833 | 14.093 | 0.071 | 0.028 | |||||
| pg152_o2_nofp.cx8a18_bee | 35.175 | 46.847 | 17.185 | 0.787 | 0.006 | 0.026 |
Performance metrics for the DBMS listed above. Some are normalized by throughput, others are not. Legend for results is here.
ips	qps	rps	rmbps	wps	wmbps	rpq	rkbpq	wpi	wkbpi	csps	cpups	cspq	cpupq	dbgb1	dbgb2	rss	maxop	p50	p99	tag
1994	42814	0	0.0	54.7	4.3	0.000	0.000	0.027	2.233	161971	51.4	3.783	96	6.1	46.1	0.0	0.031	10868	8711	20m.pg152_o2_nofp.cx8_bee
1993	42512	0	0.0	53.9	4.1	0.000	0.000	0.027	2.126	160926	51.4	3.785	97	6.0	46.1	0.0	0.022	10740	8666	20m.pg152_o2_nofp.cx8a1_bee
1993	42470	0	0.0	54.6	4.4	0.000	0.000	0.027	2.256	160821	51.4	3.787	97	6.1	46.1	0.0	0.027	10852	8439	20m.pg152_o2_nofp.cx8a2_bee
1993	42608	0	0.0	48.0	3.4	0.000	0.000	0.024	1.765	161325	51.4	3.786	97	6.1	46.1	0.0	0.028	10868	8360	20m.pg152_o2_nofp.cx8a3_bee
1994	42254	0	0.0	53.9	4.3	0.000	0.000	0.027	2.206	159802	51.4	3.782	97	6.1	46.1	0.0	0.033	10724	8554	20m.pg152_o2_nofp.cx8a4_bee
1994	42555	0	0.0	77.2	7.1	0.000	0.000	0.039	3.660	161042	51.4	3.784	97	6.1	42.0	0.0	0.024	10837	8394	20m.pg152_o2_nofp.cx8a9_bee
1994	42593	0	0.0	54.9	4.3	0.000	0.000	0.028	2.215	161218	51.3	3.785	96	6.1	46.1	0.0	0.019	10916	8822	20m.pg152_o2_nofp.cx8a10_bee
1993	42680	0	0.0	54.6	4.3	0.000	0.000	0.027	2.220	161611	51.5	3.787	97	6.1	46.1	0.0	0.021	10868	8567	20m.pg152_o2_nofp.cx8a12_bee
1994	42481	0	0.0	54.6	4.3	0.000	0.000	0.027	2.220	160736	51.5	3.784	97	6.0	46.1	0.0	0.021	10757	8647	20m.pg152_o2_nofp.cx8a14_bee
1993	42505	0	0.0	30.5	4.6	0.000	0.000	0.015	2.371	160938	51.3	3.786	97	6.1	16.1	0.0	0.030	10836	8107	20m.pg152_o2_nofp.cx8a15_bee
1994	43347	0	0.0	51.1	4.1	0.000	0.000	0.026	2.128	164467	51.2	3.794	94	5.7	45.7	0.0	0.023	11012	8793	20m.pg152_o2_nofp.cx8a16_bee
1994	42438	0	0.0	55.0	4.3	0.000	0.000	0.028	2.230	160603	51.4	3.784	97	6.0	46.1	0.0	0.025	10759	8554	20m.pg152_o2_nofp.cx8a17_bee
1994	42915	0	0.0	48.1	4.1	0.000	0.000	0.024	2.121	162717	51.2	3.792	95	5.7	45.7	0.0	0.023	10836	8423	20m.pg152_o2_nofp.cx8a18_bee
q1000.1
q1000.1: range queries with 1000 insert/s per client. Graphs for performance per 1-second interval are here.
Average throughput:
Query response time histogram: each cell has the percentage of responses that take <= the time in the header and max is the max response time in seconds. For max values in the top 25% of the range have a red background and in the bottom 25% of the range have a green background. The red background is not used when the min value is within 80% of the max value.
| dbms | 256us | 1ms | 4ms | 16ms | 64ms | 256ms | 1s | 4s | 16s | gt | max |
|---|---|---|---|---|---|---|---|---|---|---|---|
| pg152_o2_nofp.cx8_bee | 99.885 | 0.083 | 0.029 | 0.003 | nonzero | 0.036 | |||||
| pg152_o2_nofp.cx8a1_bee | 99.885 | 0.084 | 0.028 | 0.003 | nonzero | 0.037 | |||||
| pg152_o2_nofp.cx8a2_bee | 99.892 | 0.077 | 0.027 | 0.004 | nonzero | 0.028 | |||||
| pg152_o2_nofp.cx8a3_bee | 99.890 | 0.078 | 0.029 | 0.003 | nonzero | 0.029 | |||||
| pg152_o2_nofp.cx8a4_bee | 99.891 | 0.077 | 0.029 | 0.003 | nonzero | 0.036 | |||||
| pg152_o2_nofp.cx8a9_bee | 99.861 | 0.104 | 0.033 | 0.003 | nonzero | 0.034 | |||||
| pg152_o2_nofp.cx8a10_bee | 99.882 | 0.086 | 0.028 | 0.003 | nonzero | 0.030 | |||||
| pg152_o2_nofp.cx8a12_bee | 99.887 | 0.082 | 0.028 | 0.003 | nonzero | 0.035 | |||||
| pg152_o2_nofp.cx8a14_bee | 99.891 | 0.078 | 0.028 | 0.003 | nonzero | 0.035 | |||||
| pg152_o2_nofp.cx8a15_bee | 99.885 | 0.083 | 0.028 | 0.003 | nonzero | 0.040 | |||||
| pg152_o2_nofp.cx8a16_bee | 99.909 | 0.063 | 0.025 | 0.002 | nonzero | 0.025 | |||||
| pg152_o2_nofp.cx8a17_bee | 99.881 | 0.088 | 0.028 | 0.003 | nonzero | 0.030 | |||||
| pg152_o2_nofp.cx8a18_bee | 99.906 | 0.066 | 0.025 | 0.003 | nonzero | 0.037 |
Insert response time histogram: each cell has the percentage of responses that take <= the time in the header and max is the max response time in seconds. For max values in the top 25% of the range have a red background and in the bottom 25% of the range have a green background. The red background is not used when the min value is within 80% of the max value.
| dbms | 256us | 1ms | 4ms | 16ms | 64ms | 256ms | 1s | 4s | 16s | gt | max |
|---|---|---|---|---|---|---|---|---|---|---|---|
| pg152_o2_nofp.cx8_bee | 95.824 | 4.097 | 0.080 | 0.034 | |||||||
| pg152_o2_nofp.cx8a1_bee | 96.234 | 3.681 | 0.085 | 0.044 | |||||||
| pg152_o2_nofp.cx8a2_bee | 94.811 | 5.066 | 0.123 | 0.035 | |||||||
| pg152_o2_nofp.cx8a3_bee | 97.115 | 2.812 | 0.073 | 0.033 | |||||||
| pg152_o2_nofp.cx8a4_bee | 95.297 | 4.603 | 0.099 | 0.038 | |||||||
| pg152_o2_nofp.cx8a9_bee | 97.836 | 2.088 | 0.076 | 0.037 | |||||||
| pg152_o2_nofp.cx8a10_bee | 96.651 | 3.265 | 0.085 | 0.033 | |||||||
| pg152_o2_nofp.cx8a12_bee | 96.612 | 3.338 | 0.050 | 0.038 | |||||||
| pg152_o2_nofp.cx8a14_bee | 95.201 | 4.692 | 0.108 | 0.048 | |||||||
| pg152_o2_nofp.cx8a15_bee | 95.608 | 4.288 | 0.103 | 0.041 | |||||||
| pg152_o2_nofp.cx8a16_bee | 98.169 | 1.784 | 0.047 | 0.028 | |||||||
| pg152_o2_nofp.cx8a17_bee | 96.845 | 3.094 | 0.060 | 0.036 | |||||||
| pg152_o2_nofp.cx8a18_bee | 95.816 | 4.072 | 0.112 | 0.032 |
Delete response time histogram: each cell has the percentage of responses that take <= the time in the header and max is the max response time in seconds. For max values in the top 25% of the range have a red background and in the bottom 25% of the range have a green background. The red background is not used when the min value is within 80% of the max value.
| dbms | 256us | 1ms | 4ms | 16ms | 64ms | 256ms | 1s | 4s | 16s | gt | max |
|---|---|---|---|---|---|---|---|---|---|---|---|
| pg152_o2_nofp.cx8_bee | 25.457 | 52.401 | 7.255 | 14.716 | 0.172 | 0.042 | |||||
| pg152_o2_nofp.cx8a1_bee | 22.203 | 55.736 | 7.965 | 13.955 | 0.142 | 0.046 | |||||
| pg152_o2_nofp.cx8a2_bee | 26.133 | 51.753 | 7.424 | 14.530 | 0.160 | 0.035 | |||||
| pg152_o2_nofp.cx8a3_bee | 26.228 | 51.420 | 7.155 | 14.991 | 0.206 | 0.048 | |||||
| pg152_o2_nofp.cx8a4_bee | 25.395 | 52.998 | 6.917 | 14.381 | 0.309 | 0.049 | |||||
| pg152_o2_nofp.cx8a9_bee | 25.004 | 54.018 | 6.724 | 14.065 | 0.189 | 0.045 | |||||
| pg152_o2_nofp.cx8a10_bee | 25.510 | 52.660 | 7.557 | 14.203 | 0.069 | 0.033 | |||||
| pg152_o2_nofp.cx8a12_bee | 24.874 | 53.460 | 8.111 | 13.487 | 0.068 | 0.031 | |||||
| pg152_o2_nofp.cx8a14_bee | 25.346 | 52.822 | 6.913 | 14.682 | 0.237 | 0.041 | |||||
| pg152_o2_nofp.cx8a15_bee | 27.281 | 50.734 | 7.287 | 14.512 | 0.186 | 0.041 | |||||
| pg152_o2_nofp.cx8a16_bee | 24.640 | 59.774 | 14.835 | 0.740 | 0.011 | 0.026 | |||||
| pg152_o2_nofp.cx8a17_bee | 25.796 | 52.114 | 7.509 | 14.478 | 0.103 | 0.036 | |||||
| pg152_o2_nofp.cx8a18_bee | 21.076 | 58.558 | 18.700 | 1.630 | 0.036 | 0.030 |
Performance metrics for the DBMS listed above. Some are normalized by throughput, others are not. Legend for results is here.
ips	qps	rps	rmbps	wps	wmbps	rpq	rkbpq	wpi	wkbpi	csps	cpups	cspq	cpupq	dbgb1	dbgb2	rss	maxop	p50	p99	tag
3989	41304	0	0.0	29.6	5.6	0.000	0.000	0.007	1.448	154452	53.0	3.739	103	6.1	43.7	0.0	0.036	10552	8074	20m.pg152_o2_nofp.cx8_bee
3989	41208	0	0.0	27.3	5.1	0.000	0.000	0.007	1.303	154011	53.0	3.737	103	6.0	44.1	0.0	0.037	10564	7975	20m.pg152_o2_nofp.cx8a1_bee
3987	41594	0	0.0	29.7	5.6	0.000	0.000	0.007	1.444	155709	53.0	3.744	102	6.1	43.7	0.0	0.028	10612	7915	20m.pg152_o2_nofp.cx8a2_bee
3989	41207	0	0.0	24.5	4.3	0.000	0.000	0.006	1.097	154127	53.0	3.740	103	6.1	45.0	0.0	0.029	10501	8059	20m.pg152_o2_nofp.cx8a3_bee
3989	40883	0	0.0	29.8	5.6	0.000	0.000	0.007	1.450	153002	53.0	3.742	104	6.1	43.7	0.0	0.036	10468	8026	20m.pg152_o2_nofp.cx8a4_bee
3989	41307	0	0.0	48.6	9.2	0.000	0.000	0.012	2.371	154667	53.0	3.744	103	6.1	35.5	0.0	0.034	10501	7835	20m.pg152_o2_nofp.cx8a9_bee
3989	41118	0	0.0	29.8	5.6	0.000	0.000	0.007	1.450	153716	53.0	3.738	103	6.1	43.7	0.0	0.030	10453	8090	20m.pg152_o2_nofp.cx8a10_bee
3989	41191	0	0.0	29.6	5.6	0.000	0.000	0.007	1.445	153895	53.2	3.736	103	6.1	43.7	0.0	0.035	10612	8010	20m.pg152_o2_nofp.cx8a12_bee
3987	41374	0	0.0	29.5	5.6	0.000	0.000	0.007	1.449	154793	53.2	3.741	103	6.1	43.6	0.0	0.035	10568	7959	20m.pg152_o2_nofp.cx8a14_bee
3989	41608	0	0.0	31.6	5.9	0.000	0.000	0.008	1.521	155578	53.0	3.739	102	6.0	16.0	0.0	0.040	10692	7978	20m.pg152_o2_nofp.cx8a15_bee
3989	42374	0	0.0	27.9	5.5	0.000	0.000	0.007	1.405	159346	52.5	3.760	99	5.6	43.5	0.0	0.025	10708	8375	20m.pg152_o2_nofp.cx8a16_bee
3989	41026	0	0.0	29.4	5.6	0.000	0.000	0.007	1.441	153441	53.1	3.740	104	6.0	43.7	0.0	0.030	10485	7976	20m.pg152_o2_nofp.cx8a17_bee
3989	41598	0	0.0	26.3	4.9	0.000	0.000	0.007	1.268	156210	52.7	3.755	101	5.6	44.0	0.0	0.037	10612	8154	20m.pg152_o2_nofp.cx8a18_bee
l.i0
l.i0: load without secondary indexes
Performance metrics for all DBMS, not just the ones listed above. Some are normalized by throughput, others are not. Legend for results is here.
ips	qps	rps	rmbps	wps	wmbps	rpq	rkbpq	wpi	wkbpi	csps	cpups	cspq	cpupq	dbgb1	dbgb2	rss	maxop	p50	p99	tag
238095	0	0	0.0	280.3	102.6	0.000	0.000	0.001	0.441	23627	71.8	0.099	24	1.9	5.2	0.0	0.016	70224	44851	20m.pg152_o2_nofp.cx8_bee
235294	0	0	0.0	283.5	103.3	0.000	0.000	0.001	0.450	23675	72.2	0.101	25	1.9	5.2	1.9	0.012	70723	21976	20m.pg152_o2_nofp.cx8a1_bee
238095	0	0	0.0	281.8	102.6	0.000	0.000	0.001	0.441	23637	72.2	0.099	24	1.9	5.2	0.0	0.011	69625	1999	20m.pg152_o2_nofp.cx8a2_bee
235294	0	0	0.0	272.7	99.0	0.000	0.000	0.001	0.431	23104	70.7	0.098	24	1.9	5.2	0.0	0.017	70124	45051	20m.pg152_o2_nofp.cx8a3_bee
238095	0	0	0.0	283.0	102.6	0.000	0.000	0.001	0.441	23518	72.1	0.099	24	1.9	5.2	0.0	0.015	70423	21177	20m.pg152_o2_nofp.cx8a4_bee
238095	0	0	0.0	280.2	102.3	0.000	0.000	0.001	0.440	23345	72.1	0.098	24	1.9	5.2	0.0	0.020	70224	35874	20m.pg152_o2_nofp.cx8a9_bee
235294	0	0	0.0	271.5	98.8	0.000	0.000	0.001	0.430	23379	70.8	0.099	24	1.9	5.2	0.0	0.018	70220	59036	20m.pg152_o2_nofp.cx8a10_bee
238095	0	0	0.0	281.3	102.3	0.000	0.000	0.001	0.440	23517	72.1	0.099	24	1.9	5.2	0.0	0.011	70024	60955	20m.pg152_o2_nofp.cx8a12_bee
238095	0	0	0.0	282.3	102.7	0.000	0.000	0.001	0.442	23766	72.1	0.100	24	1.9	5.2	0.0	0.012	69724	57659	20m.pg152_o2_nofp.cx8a14_bee
238095	0	0	0.0	283.0	102.7	0.000	0.000	0.001	0.442	23579	72.1	0.099	24	1.9	5.2	0.0	0.022	69924	61832	20m.pg152_o2_nofp.cx8a15_bee
238095	0	0	0.0	279.3	102.6	0.000	0.000	0.001	0.441	23661	72.5	0.099	24	1.9	5.2	0.0	0.011	70308	31078	20m.pg152_o2_nofp.cx8a16_bee
238095	0	0	0.0	283.1	102.8	0.000	0.000	0.001	0.442	23613	71.9	0.099	24	1.9	5.2	0.0	0.022	70749	16788	20m.pg152_o2_nofp.cx8a17_bee
238095	0	0	0.0	281.1	102.9	0.000	0.000	0.001	0.442	23228	72.1	0.098	24	1.9	5.2	0.0	0.017	70448	15988	20m.pg152_o2_nofp.cx8a18_bee
l.x
l.x: create secondary indexes
Performance metrics for all DBMS, not just the ones listed above. Some are normalized by throughput, others are not. Legend for results is here.
ips	qps	rps	rmbps	wps	wmbps	rpq	rkbpq	wpi	wkbpi	csps	cpups	cspq	cpupq	dbgb1	dbgb2	rss	maxop	p50	p99	tag
804000	0	0	0.0	461.6	214.3	0.000	0.000	0.001	0.273	2831	37.8	0.004	4	3.7	8.6	0.0	0.003	NA	NA	20m.pg152_o2_nofp.cx8_bee
837500	0	0	0.0	349.7	161.2	0.000	0.000	0.000	0.197	2399	38.2	0.003	4	3.7	8.0	0.0	0.004	NA	NA	20m.pg152_o2_nofp.cx8a1_bee
804000	0	0	0.0	462.3	214.0	0.000	0.000	0.001	0.273	2471	37.2	0.003	4	3.7	8.6	0.0	0.004	NA	NA	20m.pg152_o2_nofp.cx8a2_bee
804000	0	0	0.0	462.2	214.1	0.000	0.000	0.001	0.273	2260	36.8	0.003	4	3.7	8.6	0.0	0.004	NA	NA	20m.pg152_o2_nofp.cx8a3_bee
804000	0	0	0.0	464.4	214.2	0.000	0.000	0.001	0.273	2522	37.5	0.003	4	3.7	8.6	0.0	0.004	NA	NA	20m.pg152_o2_nofp.cx8a4_bee
804000	0	0	0.0	464.2	214.3	0.000	0.000	0.001	0.273	2542	37.5	0.003	4	3.7	8.6	0.0	0.004	NA	NA	20m.pg152_o2_nofp.cx8a9_bee
804000	0	0	0.0	464.7	214.7	0.000	0.000	0.001	0.273	2482	37.0	0.003	4	3.7	8.6	0.0	0.004	NA	NA	20m.pg152_o2_nofp.cx8a10_bee
837500	0	0	0.0	362.6	167.5	0.000	0.000	0.000	0.205	2023	40.0	0.002	4	3.7	8.6	0.0	0.004	NA	NA	20m.pg152_o2_nofp.cx8a12_bee
804000	0	0	0.0	463.4	214.0	0.000	0.000	0.001	0.273	2082	37.3	0.003	4	3.7	8.6	0.0	0.004	NA	NA	20m.pg152_o2_nofp.cx8a14_bee
837500	0	0	0.0	463.4	213.9	0.000	0.000	0.001	0.262	2111	37.3	0.003	4	3.7	8.6	0.0	0.004	NA	NA	20m.pg152_o2_nofp.cx8a15_bee
804000	0	0	0.0	464.0	214.3	0.000	0.000	0.001	0.273	2110	37.8	0.003	4	3.7	8.6	0.0	0.003	NA	NA	20m.pg152_o2_nofp.cx8a16_bee
804000	0	0	0.0	462.7	213.8	0.000	0.000	0.001	0.272	2319	37.5	0.003	4	3.7	8.6	0.0	0.004	NA	NA	20m.pg152_o2_nofp.cx8a17_bee
837500	0	0	0.0	268.6	121.9	0.000	0.000	0.000	0.149	1480	41.0	0.002	4	3.7	8.0	0.0	0.003	NA	NA	20m.pg152_o2_nofp.cx8a18_bee
l.i1
l.i1: continue load after secondary indexes created
Performance metrics for all DBMS, not just the ones listed above. Some are normalized by throughput, others are not. Legend for results is here.
ips	qps	rps	rmbps	wps	wmbps	rpq	rkbpq	wpi	wkbpi	csps	cpups	cspq	cpupq	dbgb1	dbgb2	rss	maxop	p50	p99	tag
91012	0	0	0.0	262.3	71.0	0.000	0.000	0.003	0.799	34610	75.9	0.380	67	6.1	46.1	0.0	0.059	26817	4145	20m.pg152_o2_nofp.cx8_bee
90971	0	0	0.0	246.1	66.4	0.000	0.000	0.003	0.747	34551	77.0	0.380	68	6.1	46.1	0.0	0.029	26921	4047	20m.pg152_o2_nofp.cx8a1_bee
90744	0	0	0.0	261.9	71.0	0.000	0.000	0.003	0.801	34577	76.7	0.381	68	6.1	46.1	0.0	0.052	26920	4046	20m.pg152_o2_nofp.cx8a2_bee
90662	0	0	0.0	221.6	60.3	0.000	0.000	0.002	0.681	34571	75.4	0.381	67	6.1	46.1	0.0	0.050	26771	4096	20m.pg152_o2_nofp.cx8a3_bee
91116	0	0	0.0	262.0	71.1	0.000	0.000	0.003	0.799	34702	76.2	0.381	67	6.1	46.1	0.4	0.048	26921	4096	20m.pg152_o2_nofp.cx8a4_bee
91303	0	0	0.0	263.0	71.3	0.000	0.000	0.003	0.800	34746	76.4	0.381	67	6.1	46.1	1.6	0.056	26871	4097	20m.pg152_o2_nofp.cx8a9_bee
90539	0	0	0.0	261.5	70.7	0.000	0.000	0.003	0.799	34490	75.6	0.381	67	6.1	46.1	0.0	0.055	26582	4195	20m.pg152_o2_nofp.cx8a10_bee
91408	0	0	0.0	264.0	71.5	0.000	0.000	0.003	0.801	34729	77.2	0.380	68	6.1	46.1	0.0	0.168	27070	4096	20m.pg152_o2_nofp.cx8a12_bee
90600	0	0	0.0	261.4	70.7	0.000	0.000	0.003	0.799	34442	76.0	0.380	67	6.0	46.1	0.0	0.100	26783	4177	20m.pg152_o2_nofp.cx8a14_bee
88613	0	0	0.0	626.4	153.2	0.000	0.000	0.007	1.770	33149	76.1	0.374	69	6.1	16.1	0.0	0.073	26171	4046	20m.pg152_o2_nofp.cx8a15_bee
101343	0	0	0.0	287.7	78.6	0.000	0.000	0.003	0.794	38220	79.3	0.377	63	5.7	45.7	0.0	0.049	26871	10688	20m.pg152_o2_nofp.cx8a16_bee
91303	0	0	0.0	263.8	71.5	0.000	0.000	0.003	0.802	34641	76.4	0.379	67	6.1	46.1	0.0	0.090	27020	4096	20m.pg152_o2_nofp.cx8a17_bee
101471	0	0	0.0	270.4	73.5	0.000	0.000	0.003	0.741	38284	79.4	0.377	63	5.7	45.7	0.0	0.201	26871	11042	20m.pg152_o2_nofp.cx8a18_bee
q100.1
q100.1: range queries with 100 insert/s per client
Performance metrics for all DBMS, not just the ones listed above. Some are normalized by throughput, others are not. Legend for results is here.
ips	qps	rps	rmbps	wps	wmbps	rpq	rkbpq	wpi	wkbpi	csps	cpups	cspq	cpupq	dbgb1	dbgb2	rss	maxop	p50	p99	tag
399	44054	0	0.0	22.7	3.7	0.000	0.000	0.057	9.416	168015	50.2	3.814	91	6.1	46.1	0.0	0.008	11236	9493	20m.pg152_o2_nofp.cx8_bee
399	44315	0	0.0	19.2	2.8	0.000	0.000	0.048	7.090	169002	50.3	3.814	91	6.0	46.1	0.0	0.013	11256	9270	20m.pg152_o2_nofp.cx8a1_bee
399	44471	0	0.0	22.4	3.4	0.000	0.000	0.056	8.768	169605	50.3	3.814	90	6.1	46.1	0.0	0.006	11379	9513	20m.pg152_o2_nofp.cx8a2_bee
399	43944	0	0.0	18.0	2.3	0.000	0.000	0.045	5.885	167697	50.2	3.816	91	6.1	46.1	0.0	0.005	11188	9318	20m.pg152_o2_nofp.cx8a3_bee
399	43783	0	0.0	22.9	3.5	0.000	0.000	0.057	8.970	166998	50.2	3.814	92	6.1	46.1	0.0	0.008	11112	9529	20m.pg152_o2_nofp.cx8a4_bee
399	44293	0	0.0	90.5	6.5	0.000	0.000	0.227	16.787	168983	50.3	3.815	91	6.1	46.1	0.0	0.008	11284	9110	20m.pg152_o2_nofp.cx8a9_bee
399	44124	0	0.0	21.8	3.4	0.000	0.000	0.055	8.762	168257	50.3	3.813	91	6.1	46.1	0.0	0.007	11224	9350	20m.pg152_o2_nofp.cx8a10_bee
399	44589	0	0.0	22.2	3.5	0.000	0.000	0.056	9.027	170064	50.4	3.814	90	6.1	46.1	0.0	0.006	11252	9673	20m.pg152_o2_nofp.cx8a12_bee
399	44045	0	0.0	24.0	4.0	0.000	0.000	0.060	10.157	167994	50.4	3.814	92	6.0	46.1	0.0	0.010	11124	9238	20m.pg152_o2_nofp.cx8a14_bee
399	44576	0	0.0	10.7	1.1	0.000	0.000	0.027	2.812	170042	50.2	3.815	90	6.1	16.1	0.0	0.011	11236	9637	20m.pg152_o2_nofp.cx8a15_bee
399	44347	0	0.0	20.0	3.0	0.000	0.000	0.050	7.613	169113	50.2	3.813	91	5.7	45.7	0.0	0.009	11284	9286	20m.pg152_o2_nofp.cx8a16_bee
399	44241	0	0.0	21.5	3.3	0.000	0.000	0.054	8.510	168754	50.3	3.814	91	6.0	46.1	0.0	0.012	11140	9158	20m.pg152_o2_nofp.cx8a17_bee
399	43833	0	0.0	17.7	2.4	0.000	0.000	0.044	6.126	167082	50.3	3.812	92	5.7	45.7	0.0	0.015	11117	8934	20m.pg152_o2_nofp.cx8a18_bee
q500.1
q500.1: range queries with 500 insert/s per client
Performance metrics for all DBMS, not just the ones listed above. Some are normalized by throughput, others are not. Legend for results is here.
ips	qps	rps	rmbps	wps	wmbps	rpq	rkbpq	wpi	wkbpi	csps	cpups	cspq	cpupq	dbgb1	dbgb2	rss	maxop	p50	p99	tag
1994	42814	0	0.0	54.7	4.3	0.000	0.000	0.027	2.233	161971	51.4	3.783	96	6.1	46.1	0.0	0.031	10868	8711	20m.pg152_o2_nofp.cx8_bee
1993	42512	0	0.0	53.9	4.1	0.000	0.000	0.027	2.126	160926	51.4	3.785	97	6.0	46.1	0.0	0.022	10740	8666	20m.pg152_o2_nofp.cx8a1_bee
1993	42470	0	0.0	54.6	4.4	0.000	0.000	0.027	2.256	160821	51.4	3.787	97	6.1	46.1	0.0	0.027	10852	8439	20m.pg152_o2_nofp.cx8a2_bee
1993	42608	0	0.0	48.0	3.4	0.000	0.000	0.024	1.765	161325	51.4	3.786	97	6.1	46.1	0.0	0.028	10868	8360	20m.pg152_o2_nofp.cx8a3_bee
1994	42254	0	0.0	53.9	4.3	0.000	0.000	0.027	2.206	159802	51.4	3.782	97	6.1	46.1	0.0	0.033	10724	8554	20m.pg152_o2_nofp.cx8a4_bee
1994	42555	0	0.0	77.2	7.1	0.000	0.000	0.039	3.660	161042	51.4	3.784	97	6.1	42.0	0.0	0.024	10837	8394	20m.pg152_o2_nofp.cx8a9_bee
1994	42593	0	0.0	54.9	4.3	0.000	0.000	0.028	2.215	161218	51.3	3.785	96	6.1	46.1	0.0	0.019	10916	8822	20m.pg152_o2_nofp.cx8a10_bee
1993	42680	0	0.0	54.6	4.3	0.000	0.000	0.027	2.220	161611	51.5	3.787	97	6.1	46.1	0.0	0.021	10868	8567	20m.pg152_o2_nofp.cx8a12_bee
1994	42481	0	0.0	54.6	4.3	0.000	0.000	0.027	2.220	160736	51.5	3.784	97	6.0	46.1	0.0	0.021	10757	8647	20m.pg152_o2_nofp.cx8a14_bee
1993	42505	0	0.0	30.5	4.6	0.000	0.000	0.015	2.371	160938	51.3	3.786	97	6.1	16.1	0.0	0.030	10836	8107	20m.pg152_o2_nofp.cx8a15_bee
1994	43347	0	0.0	51.1	4.1	0.000	0.000	0.026	2.128	164467	51.2	3.794	94	5.7	45.7	0.0	0.023	11012	8793	20m.pg152_o2_nofp.cx8a16_bee
1994	42438	0	0.0	55.0	4.3	0.000	0.000	0.028	2.230	160603	51.4	3.784	97	6.0	46.1	0.0	0.025	10759	8554	20m.pg152_o2_nofp.cx8a17_bee
1994	42915	0	0.0	48.1	4.1	0.000	0.000	0.024	2.121	162717	51.2	3.792	95	5.7	45.7	0.0	0.023	10836	8423	20m.pg152_o2_nofp.cx8a18_bee
q1000.1
q1000.1: range queries with 1000 insert/s per client
Performance metrics for all DBMS, not just the ones listed above. Some are normalized by throughput, others are not. Legend for results is here.
ips	qps	rps	rmbps	wps	wmbps	rpq	rkbpq	wpi	wkbpi	csps	cpups	cspq	cpupq	dbgb1	dbgb2	rss	maxop	p50	p99	tag
3989	41304	0	0.0	29.6	5.6	0.000	0.000	0.007	1.448	154452	53.0	3.739	103	6.1	43.7	0.0	0.036	10552	8074	20m.pg152_o2_nofp.cx8_bee
3989	41208	0	0.0	27.3	5.1	0.000	0.000	0.007	1.303	154011	53.0	3.737	103	6.0	44.1	0.0	0.037	10564	7975	20m.pg152_o2_nofp.cx8a1_bee
3987	41594	0	0.0	29.7	5.6	0.000	0.000	0.007	1.444	155709	53.0	3.744	102	6.1	43.7	0.0	0.028	10612	7915	20m.pg152_o2_nofp.cx8a2_bee
3989	41207	0	0.0	24.5	4.3	0.000	0.000	0.006	1.097	154127	53.0	3.740	103	6.1	45.0	0.0	0.029	10501	8059	20m.pg152_o2_nofp.cx8a3_bee
3989	40883	0	0.0	29.8	5.6	0.000	0.000	0.007	1.450	153002	53.0	3.742	104	6.1	43.7	0.0	0.036	10468	8026	20m.pg152_o2_nofp.cx8a4_bee
3989	41307	0	0.0	48.6	9.2	0.000	0.000	0.012	2.371	154667	53.0	3.744	103	6.1	35.5	0.0	0.034	10501	7835	20m.pg152_o2_nofp.cx8a9_bee
3989	41118	0	0.0	29.8	5.6	0.000	0.000	0.007	1.450	153716	53.0	3.738	103	6.1	43.7	0.0	0.030	10453	8090	20m.pg152_o2_nofp.cx8a10_bee
3989	41191	0	0.0	29.6	5.6	0.000	0.000	0.007	1.445	153895	53.2	3.736	103	6.1	43.7	0.0	0.035	10612	8010	20m.pg152_o2_nofp.cx8a12_bee
3987	41374	0	0.0	29.5	5.6	0.000	0.000	0.007	1.449	154793	53.2	3.741	103	6.1	43.6	0.0	0.035	10568	7959	20m.pg152_o2_nofp.cx8a14_bee
3989	41608	0	0.0	31.6	5.9	0.000	0.000	0.008	1.521	155578	53.0	3.739	102	6.0	16.0	0.0	0.040	10692	7978	20m.pg152_o2_nofp.cx8a15_bee
3989	42374	0	0.0	27.9	5.5	0.000	0.000	0.007	1.405	159346	52.5	3.760	99	5.6	43.5	0.0	0.025	10708	8375	20m.pg152_o2_nofp.cx8a16_bee
3989	41026	0	0.0	29.4	5.6	0.000	0.000	0.007	1.441	153441	53.1	3.740	104	6.0	43.7	0.0	0.030	10485	7976	20m.pg152_o2_nofp.cx8a17_bee
3989	41598	0	0.0	26.3	4.9	0.000	0.000	0.007	1.268	156210	52.7	3.755	101	5.6	44.0	0.0	0.037	10612	8154	20m.pg152_o2_nofp.cx8a18_bee
l.i0
- l.i0: load without secondary indexes
- Legend for results is here.
- Each entry lists the percentage of responses that fit in that bucket (slower than max time for previous bucket, faster than min time for next bucket).
Insert response time histogram
256us	1ms	4ms	16ms	64ms	256ms	1s	4s	16s	gt	max	tag
0.000	0.000	99.949	0.051	0.000	0.000	0.000	0.000	0.000	0.000	0.016	pg152_o2_nofp.cx8_bee
0.000	0.000	99.945	0.055	0.000	0.000	0.000	0.000	0.000	0.000	0.012	pg152_o2_nofp.cx8a1_bee
0.000	0.000	99.957	0.043	0.000	0.000	0.000	0.000	0.000	0.000	0.011	pg152_o2_nofp.cx8a2_bee
0.000	0.000	99.944	0.056	0.001	0.000	0.000	0.000	0.000	0.000	0.017	pg152_o2_nofp.cx8a3_bee
0.000	0.000	99.951	0.049	0.000	0.000	0.000	0.000	0.000	0.000	0.015	pg152_o2_nofp.cx8a4_bee
0.000	0.000	99.945	0.054	0.001	0.000	0.000	0.000	0.000	0.000	0.020	pg152_o2_nofp.cx8a9_bee
0.000	0.000	99.939	0.060	0.001	0.000	0.000	0.000	0.000	0.000	0.018	pg152_o2_nofp.cx8a10_bee
0.000	0.000	99.955	0.045	0.000	0.000	0.000	0.000	0.000	0.000	0.011	pg152_o2_nofp.cx8a12_bee
0.000	0.000	99.950	0.051	0.000	0.000	0.000	0.000	0.000	0.000	0.012	pg152_o2_nofp.cx8a14_bee
0.000	0.000	99.939	0.060	0.001	0.000	0.000	0.000	0.000	0.000	0.022	pg152_o2_nofp.cx8a15_bee
0.000	0.000	99.946	0.054	0.000	0.000	0.000	0.000	0.000	0.000	0.011	pg152_o2_nofp.cx8a16_bee
0.000	0.000	99.945	0.055	0.001	0.000	0.000	0.000	0.000	0.000	0.022	pg152_o2_nofp.cx8a17_bee
0.000	0.000	99.945	0.055	0.001	0.000	0.000	0.000	0.000	0.000	0.017	pg152_o2_nofp.cx8a18_bee
l.x
- l.x: create secondary indexes
- Legend for results is here.
- Each entry lists the percentage of responses that fit in that bucket (slower than max time for previous bucket, faster than min time for next bucket).
TODO - determine whether there is data for create index response time
l.i1
- l.i1: continue load after secondary indexes created
- Legend for results is here.
- Each entry lists the percentage of responses that fit in that bucket (slower than max time for previous bucket, faster than min time for next bucket).
Insert response time histogram
256us	1ms	4ms	16ms	64ms	256ms	1s	4s	16s	gt	max	tag
0.000	0.000	99.508	0.487	0.005	0.000	0.000	0.000	0.000	0.000	0.059	pg152_o2_nofp.cx8_bee
0.000	0.000	99.456	0.542	0.001	0.000	0.000	0.000	0.000	0.000	0.029	pg152_o2_nofp.cx8a1_bee
0.000	0.000	99.488	0.507	0.005	0.000	0.000	0.000	0.000	0.000	0.052	pg152_o2_nofp.cx8a2_bee
0.000	0.000	99.564	0.435	0.001	0.000	0.000	0.000	0.000	0.000	0.050	pg152_o2_nofp.cx8a3_bee
0.000	0.000	99.494	0.499	0.007	0.000	0.000	0.000	0.000	0.000	0.048	pg152_o2_nofp.cx8a4_bee
0.000	0.000	99.487	0.509	0.004	0.000	0.000	0.000	0.000	0.000	0.056	pg152_o2_nofp.cx8a9_bee
0.000	0.000	99.503	0.493	0.004	0.000	0.000	0.000	0.000	0.000	0.055	pg152_o2_nofp.cx8a10_bee
0.000	0.000	99.472	0.525	0.003	nonzero	0.000	0.000	0.000	0.000	0.168	pg152_o2_nofp.cx8a12_bee
0.000	0.000	99.483	0.510	0.006	nonzero	0.000	0.000	0.000	0.000	0.100	pg152_o2_nofp.cx8a14_bee
0.000	0.000	99.074	0.871	0.055	nonzero	0.000	0.000	0.000	0.000	0.073	pg152_o2_nofp.cx8a15_bee
0.000	0.000	99.596	0.394	0.010	0.000	0.000	0.000	0.000	0.000	0.049	pg152_o2_nofp.cx8a16_bee
0.000	0.000	99.476	0.519	0.006	nonzero	0.000	0.000	0.000	0.000	0.090	pg152_o2_nofp.cx8a17_bee
0.000	0.000	99.631	0.367	0.002	nonzero	0.000	0.000	0.000	0.000	0.201	pg152_o2_nofp.cx8a18_bee
Delete response time histogram
256us	1ms	4ms	16ms	64ms	256ms	1s	4s	16s	gt	max	tag
3.468	88.035	4.303	4.185	0.009	nonzero	0.000	0.000	0.000	0.000	0.090	pg152_o2_nofp.cx8_bee
3.360	87.793	4.559	4.273	0.014	0.000	0.000	0.000	0.000	0.000	0.034	pg152_o2_nofp.cx8a1_bee
3.594	87.696	4.281	4.416	0.012	0.000	0.000	0.000	0.000	0.000	0.049	pg152_o2_nofp.cx8a2_bee
3.341	88.250	4.296	4.107	0.005	0.000	0.000	0.000	0.000	0.000	0.048	pg152_o2_nofp.cx8a3_bee
3.281	88.159	4.327	4.221	0.011	0.000	0.000	0.000	0.000	0.000	0.044	pg152_o2_nofp.cx8a4_bee
3.630	87.735	4.425	4.201	0.009	nonzero	0.000	0.000	0.000	0.000	0.066	pg152_o2_nofp.cx8a9_bee
3.226	88.261	4.431	4.075	0.007	nonzero	0.000	0.000	0.000	0.000	0.064	pg152_o2_nofp.cx8a10_bee
3.601	87.701	4.425	4.261	0.012	nonzero	0.000	0.000	0.000	0.000	0.240	pg152_o2_nofp.cx8a12_bee
3.457	87.928	4.421	4.183	0.011	0.000	0.000	0.000	0.000	0.000	0.045	pg152_o2_nofp.cx8a14_bee
4.802	86.211	4.637	4.311	0.039	nonzero	0.000	0.000	0.000	0.000	0.071	pg152_o2_nofp.cx8a15_bee
4.119	87.351	7.735	0.789	0.006	nonzero	0.000	0.000	0.000	0.000	0.074	pg152_o2_nofp.cx8a16_bee
3.557	87.903	4.368	4.160	0.012	0.000	0.000	0.000	0.000	0.000	0.048	pg152_o2_nofp.cx8a17_bee
3.548	87.889	7.812	0.750	0.001	nonzero	0.000	0.000	0.000	0.000	0.198	pg152_o2_nofp.cx8a18_bee
q100.1
- q100.1: range queries with 100 insert/s per client
- Legend for results is here.
- Each entry lists the percentage of responses that fit in that bucket (slower than max time for previous bucket, faster than min time for next bucket).
Query response time histogram
256us	1ms	4ms	16ms	64ms	256ms	1s	4s	16s	gt	max	tag
99.984	0.011	0.005	nonzero	0.000	0.000	0.000	0.000	0.000	0.000	0.008	pg152_o2_nofp.cx8_bee
99.983	0.012	0.005	nonzero	0.000	0.000	0.000	0.000	0.000	0.000	0.013	pg152_o2_nofp.cx8a1_bee
99.984	0.011	0.005	nonzero	0.000	0.000	0.000	0.000	0.000	0.000	0.006	pg152_o2_nofp.cx8a2_bee
99.988	0.008	0.004	nonzero	0.000	0.000	0.000	0.000	0.000	0.000	0.005	pg152_o2_nofp.cx8a3_bee
99.985	0.011	0.005	nonzero	0.000	0.000	0.000	0.000	0.000	0.000	0.008	pg152_o2_nofp.cx8a4_bee
99.973	0.019	0.007	nonzero	0.000	0.000	0.000	0.000	0.000	0.000	0.008	pg152_o2_nofp.cx8a9_bee
99.984	0.011	0.005	nonzero	0.000	0.000	0.000	0.000	0.000	0.000	0.007	pg152_o2_nofp.cx8a10_bee
99.985	0.010	0.005	nonzero	0.000	0.000	0.000	0.000	0.000	0.000	0.006	pg152_o2_nofp.cx8a12_bee
99.984	0.011	0.005	nonzero	0.000	0.000	0.000	0.000	0.000	0.000	0.010	pg152_o2_nofp.cx8a14_bee
99.989	0.006	0.004	nonzero	0.000	0.000	0.000	0.000	0.000	0.000	0.011	pg152_o2_nofp.cx8a15_bee
99.985	0.010	0.005	nonzero	0.000	0.000	0.000	0.000	0.000	0.000	0.009	pg152_o2_nofp.cx8a16_bee
99.985	0.010	0.005	nonzero	0.000	0.000	0.000	0.000	0.000	0.000	0.012	pg152_o2_nofp.cx8a17_bee
99.984	0.011	0.005	nonzero	0.000	0.000	0.000	0.000	0.000	0.000	0.015	pg152_o2_nofp.cx8a18_bee
Insert response time histogram
256us	1ms	4ms	16ms	64ms	256ms	1s	4s	16s	gt	max	tag
0.000	0.000	99.917	0.083	0.000	0.000	0.000	0.000	0.000	0.000	0.008	pg152_o2_nofp.cx8_bee
0.000	0.000	99.625	0.375	0.000	0.000	0.000	0.000	0.000	0.000	0.007	pg152_o2_nofp.cx8a1_bee
0.000	0.000	99.847	0.153	0.000	0.000	0.000	0.000	0.000	0.000	0.007	pg152_o2_nofp.cx8a2_bee
0.000	0.000	99.951	0.049	0.000	0.000	0.000	0.000	0.000	0.000	0.007	pg152_o2_nofp.cx8a3_bee
0.000	0.000	99.917	0.083	0.000	0.000	0.000	0.000	0.000	0.000	0.009	pg152_o2_nofp.cx8a4_bee
0.000	0.000	99.896	0.104	0.000	0.000	0.000	0.000	0.000	0.000	0.009	pg152_o2_nofp.cx8a9_bee
0.000	0.000	99.778	0.222	0.000	0.000	0.000	0.000	0.000	0.000	0.007	pg152_o2_nofp.cx8a10_bee
0.000	0.000	99.868	0.132	0.000	0.000	0.000	0.000	0.000	0.000	0.008	pg152_o2_nofp.cx8a12_bee
0.000	0.000	99.889	0.111	0.000	0.000	0.000	0.000	0.000	0.000	0.006	pg152_o2_nofp.cx8a14_bee
0.000	0.000	99.875	0.125	0.000	0.000	0.000	0.000	0.000	0.000	0.007	pg152_o2_nofp.cx8a15_bee
0.000	0.000	99.931	0.069	0.000	0.000	0.000	0.000	0.000	0.000	0.006	pg152_o2_nofp.cx8a16_bee
0.000	0.000	99.951	0.049	0.000	0.000	0.000	0.000	0.000	0.000	0.006	pg152_o2_nofp.cx8a17_bee
0.000	0.000	99.674	0.326	0.000	0.000	0.000	0.000	0.000	0.000	0.007	pg152_o2_nofp.cx8a18_bee
Delete response time histogram
256us	1ms	4ms	16ms	64ms	256ms	1s	4s	16s	gt	max	tag
15.549	69.431	15.014	0.007	0.000	0.000	0.000	0.000	0.000	0.000	0.005	pg152_o2_nofp.cx8_bee
11.653	76.514	11.660	0.174	0.000	0.000	0.000	0.000	0.000	0.000	0.006	pg152_o2_nofp.cx8a1_bee
15.486	73.222	11.208	0.083	0.000	0.000	0.000	0.000	0.000	0.000	0.006	pg152_o2_nofp.cx8a2_bee
14.278	70.465	15.250	0.007	0.000	0.000	0.000	0.000	0.000	0.000	0.005	pg152_o2_nofp.cx8a3_bee
13.431	71.500	15.035	0.035	0.000	0.000	0.000	0.000	0.000	0.000	0.006	pg152_o2_nofp.cx8a4_bee
20.757	70.736	8.486	0.021	0.000	0.000	0.000	0.000	0.000	0.000	0.007	pg152_o2_nofp.cx8a9_bee
16.625	66.910	16.375	0.090	0.000	0.000	0.000	0.000	0.000	0.000	0.007	pg152_o2_nofp.cx8a10_bee
15.319	68.854	15.674	0.153	0.000	0.000	0.000	0.000	0.000	0.000	0.008	pg152_o2_nofp.cx8a12_bee
14.826	65.076	20.042	0.056	0.000	0.000	0.000	0.000	0.000	0.000	0.005	pg152_o2_nofp.cx8a14_bee
18.924	68.646	12.396	0.035	0.000	0.000	0.000	0.000	0.000	0.000	0.008	pg152_o2_nofp.cx8a15_bee
17.181	67.653	15.062	0.104	0.000	0.000	0.000	0.000	0.000	0.000	0.006	pg152_o2_nofp.cx8a16_bee
17.382	73.986	8.611	0.021	0.000	0.000	0.000	0.000	0.000	0.000	0.006	pg152_o2_nofp.cx8a17_bee
13.493	63.521	22.792	0.194	0.000	0.000	0.000	0.000	0.000	0.000	0.007	pg152_o2_nofp.cx8a18_bee
q500.1
- q500.1: range queries with 500 insert/s per client
- Legend for results is here.
- Each entry lists the percentage of responses that fit in that bucket (slower than max time for previous bucket, faster than min time for next bucket).
Query response time histogram
256us	1ms	4ms	16ms	64ms	256ms	1s	4s	16s	gt	max	tag
99.946	0.033	0.019	0.002	nonzero	0.000	0.000	0.000	0.000	0.000	0.031	pg152_o2_nofp.cx8_bee
99.946	0.033	0.019	0.002	nonzero	0.000	0.000	0.000	0.000	0.000	0.022	pg152_o2_nofp.cx8a1_bee
99.946	0.034	0.019	0.002	nonzero	0.000	0.000	0.000	0.000	0.000	0.027	pg152_o2_nofp.cx8a2_bee
99.952	0.028	0.018	0.002	nonzero	0.000	0.000	0.000	0.000	0.000	0.028	pg152_o2_nofp.cx8a3_bee
99.948	0.032	0.018	0.002	nonzero	0.000	0.000	0.000	0.000	0.000	0.033	pg152_o2_nofp.cx8a4_bee
99.932	0.047	0.019	0.002	nonzero	0.000	0.000	0.000	0.000	0.000	0.024	pg152_o2_nofp.cx8a9_bee
99.947	0.032	0.019	0.002	nonzero	0.000	0.000	0.000	0.000	0.000	0.019	pg152_o2_nofp.cx8a10_bee
99.947	0.032	0.020	0.002	nonzero	0.000	0.000	0.000	0.000	0.000	0.021	pg152_o2_nofp.cx8a12_bee
99.947	0.033	0.018	0.002	nonzero	0.000	0.000	0.000	0.000	0.000	0.021	pg152_o2_nofp.cx8a14_bee
99.937	0.043	0.019	0.002	nonzero	0.000	0.000	0.000	0.000	0.000	0.030	pg152_o2_nofp.cx8a15_bee
99.955	0.026	0.018	0.001	nonzero	0.000	0.000	0.000	0.000	0.000	0.023	pg152_o2_nofp.cx8a16_bee
99.948	0.031	0.019	0.002	nonzero	0.000	0.000	0.000	0.000	0.000	0.025	pg152_o2_nofp.cx8a17_bee
99.953	0.027	0.019	0.001	nonzero	0.000	0.000	0.000	0.000	0.000	0.023	pg152_o2_nofp.cx8a18_bee
Insert response time histogram
256us	1ms	4ms	16ms	64ms	256ms	1s	4s	16s	gt	max	tag
0.000	0.000	97.247	2.682	0.071	0.000	0.000	0.000	0.000	0.000	0.038	pg152_o2_nofp.cx8_bee
0.000	0.000	97.425	2.536	0.039	0.000	0.000	0.000	0.000	0.000	0.030	pg152_o2_nofp.cx8a1_bee
0.000	0.000	97.756	2.200	0.044	0.000	0.000	0.000	0.000	0.000	0.029	pg152_o2_nofp.cx8a2_bee
0.000	0.000	96.978	2.968	0.054	0.000	0.000	0.000	0.000	0.000	0.036	pg152_o2_nofp.cx8a3_bee
0.000	0.000	97.374	2.557	0.069	0.000	0.000	0.000	0.000	0.000	0.038	pg152_o2_nofp.cx8a4_bee
0.000	0.000	98.053	1.899	0.049	0.000	0.000	0.000	0.000	0.000	0.034	pg152_o2_nofp.cx8a9_bee
0.000	0.000	98.217	1.768	0.015	0.000	0.000	0.000	0.000	0.000	0.020	pg152_o2_nofp.cx8a10_bee
0.000	0.000	97.911	2.068	0.021	0.000	0.000	0.000	0.000	0.000	0.023	pg152_o2_nofp.cx8a12_bee
0.000	0.000	97.435	2.539	0.026	0.000	0.000	0.000	0.000	0.000	0.025	pg152_o2_nofp.cx8a14_bee
0.000	0.000	98.083	1.871	0.046	0.000	0.000	0.000	0.000	0.000	0.035	pg152_o2_nofp.cx8a15_bee
0.000	0.000	98.393	1.599	0.008	0.000	0.000	0.000	0.000	0.000	0.022	pg152_o2_nofp.cx8a16_bee
0.000	0.000	97.856	2.103	0.042	0.000	0.000	0.000	0.000	0.000	0.032	pg152_o2_nofp.cx8a17_bee
0.000	0.000	97.771	2.196	0.033	0.000	0.000	0.000	0.000	0.000	0.028	pg152_o2_nofp.cx8a18_bee
Delete response time histogram
256us	1ms	4ms	16ms	64ms	256ms	1s	4s	16s	gt	max	tag
44.054	31.554	8.411	15.722	0.258	0.000	0.000	0.000	0.000	0.000	0.032	pg152_o2_nofp.cx8_bee
37.512	40.050	8.203	14.175	0.060	0.000	0.000	0.000	0.000	0.000	0.026	pg152_o2_nofp.cx8a1_bee
44.403	33.281	8.036	14.146	0.135	0.000	0.000	0.000	0.000	0.000	0.032	pg152_o2_nofp.cx8a2_bee
46.368	30.003	8.312	15.004	0.312	0.000	0.000	0.000	0.000	0.000	0.034	pg152_o2_nofp.cx8a3_bee
43.768	31.492	8.475	15.915	0.350	0.000	0.000	0.000	0.000	0.000	0.034	pg152_o2_nofp.cx8a4_bee
45.469	30.471	7.799	15.990	0.271	0.000	0.000	0.000	0.000	0.000	0.036	pg152_o2_nofp.cx8a9_bee
45.615	32.794	8.253	13.315	0.022	0.000	0.000	0.000	0.000	0.000	0.024	pg152_o2_nofp.cx8a10_bee
43.488	33.985	8.340	14.131	0.057	0.000	0.000	0.000	0.000	0.000	0.026	pg152_o2_nofp.cx8a12_bee
43.968	32.242	8.314	15.410	0.067	0.000	0.000	0.000	0.000	0.000	0.030	pg152_o2_nofp.cx8a14_bee
45.100	30.285	8.603	15.882	0.131	0.000	0.000	0.000	0.000	0.000	0.032	pg152_o2_nofp.cx8a15_bee
44.796	37.590	17.065	0.544	0.004	0.000	0.000	0.000	0.000	0.000	0.020	pg152_o2_nofp.cx8a16_bee
43.465	33.537	8.833	14.093	0.071	0.000	0.000	0.000	0.000	0.000	0.028	pg152_o2_nofp.cx8a17_bee
35.175	46.847	17.185	0.787	0.006	0.000	0.000	0.000	0.000	0.000	0.026	pg152_o2_nofp.cx8a18_bee
q1000.1
- q1000.1: range queries with 1000 insert/s per client
- Legend for results is here.
- Each entry lists the percentage of responses that fit in that bucket (slower than max time for previous bucket, faster than min time for next bucket).
Query response time histogram
256us	1ms	4ms	16ms	64ms	256ms	1s	4s	16s	gt	max	tag
99.885	0.083	0.029	0.003	nonzero	0.000	0.000	0.000	0.000	0.000	0.036	pg152_o2_nofp.cx8_bee
99.885	0.084	0.028	0.003	nonzero	0.000	0.000	0.000	0.000	0.000	0.037	pg152_o2_nofp.cx8a1_bee
99.892	0.077	0.027	0.004	nonzero	0.000	0.000	0.000	0.000	0.000	0.028	pg152_o2_nofp.cx8a2_bee
99.890	0.078	0.029	0.003	nonzero	0.000	0.000	0.000	0.000	0.000	0.029	pg152_o2_nofp.cx8a3_bee
99.891	0.077	0.029	0.003	nonzero	0.000	0.000	0.000	0.000	0.000	0.036	pg152_o2_nofp.cx8a4_bee
99.861	0.104	0.033	0.003	nonzero	0.000	0.000	0.000	0.000	0.000	0.034	pg152_o2_nofp.cx8a9_bee
99.882	0.086	0.028	0.003	nonzero	0.000	0.000	0.000	0.000	0.000	0.030	pg152_o2_nofp.cx8a10_bee
99.887	0.082	0.028	0.003	nonzero	0.000	0.000	0.000	0.000	0.000	0.035	pg152_o2_nofp.cx8a12_bee
99.891	0.078	0.028	0.003	nonzero	0.000	0.000	0.000	0.000	0.000	0.035	pg152_o2_nofp.cx8a14_bee
99.885	0.083	0.028	0.003	nonzero	0.000	0.000	0.000	0.000	0.000	0.040	pg152_o2_nofp.cx8a15_bee
99.909	0.063	0.025	0.002	nonzero	0.000	0.000	0.000	0.000	0.000	0.025	pg152_o2_nofp.cx8a16_bee
99.881	0.088	0.028	0.003	nonzero	0.000	0.000	0.000	0.000	0.000	0.030	pg152_o2_nofp.cx8a17_bee
99.906	0.066	0.025	0.003	nonzero	0.000	0.000	0.000	0.000	0.000	0.037	pg152_o2_nofp.cx8a18_bee
Insert response time histogram
256us	1ms	4ms	16ms	64ms	256ms	1s	4s	16s	gt	max	tag
0.000	0.000	95.824	4.097	0.080	0.000	0.000	0.000	0.000	0.000	0.034	pg152_o2_nofp.cx8_bee
0.000	0.000	96.234	3.681	0.085	0.000	0.000	0.000	0.000	0.000	0.044	pg152_o2_nofp.cx8a1_bee
0.000	0.000	94.811	5.066	0.123	0.000	0.000	0.000	0.000	0.000	0.035	pg152_o2_nofp.cx8a2_bee
0.000	0.000	97.115	2.812	0.073	0.000	0.000	0.000	0.000	0.000	0.033	pg152_o2_nofp.cx8a3_bee
0.000	0.000	95.297	4.603	0.099	0.000	0.000	0.000	0.000	0.000	0.038	pg152_o2_nofp.cx8a4_bee
0.000	0.000	97.836	2.088	0.076	0.000	0.000	0.000	0.000	0.000	0.037	pg152_o2_nofp.cx8a9_bee
0.000	0.000	96.651	3.265	0.085	0.000	0.000	0.000	0.000	0.000	0.033	pg152_o2_nofp.cx8a10_bee
0.000	0.000	96.612	3.338	0.050	0.000	0.000	0.000	0.000	0.000	0.038	pg152_o2_nofp.cx8a12_bee
0.000	0.000	95.201	4.692	0.108	0.000	0.000	0.000	0.000	0.000	0.048	pg152_o2_nofp.cx8a14_bee
0.000	0.000	95.608	4.288	0.103	0.000	0.000	0.000	0.000	0.000	0.041	pg152_o2_nofp.cx8a15_bee
0.000	0.000	98.169	1.784	0.047	0.000	0.000	0.000	0.000	0.000	0.028	pg152_o2_nofp.cx8a16_bee
0.000	0.000	96.845	3.094	0.060	0.000	0.000	0.000	0.000	0.000	0.036	pg152_o2_nofp.cx8a17_bee
0.000	0.000	95.816	4.072	0.112	0.000	0.000	0.000	0.000	0.000	0.032	pg152_o2_nofp.cx8a18_bee
Delete response time histogram
256us	1ms	4ms	16ms	64ms	256ms	1s	4s	16s	gt	max	tag
25.457	52.401	7.255	14.716	0.172	0.000	0.000	0.000	0.000	0.000	0.042	pg152_o2_nofp.cx8_bee
22.203	55.736	7.965	13.955	0.142	0.000	0.000	0.000	0.000	0.000	0.046	pg152_o2_nofp.cx8a1_bee
26.133	51.753	7.424	14.530	0.160	0.000	0.000	0.000	0.000	0.000	0.035	pg152_o2_nofp.cx8a2_bee
26.228	51.420	7.155	14.991	0.206	0.000	0.000	0.000	0.000	0.000	0.048	pg152_o2_nofp.cx8a3_bee
25.395	52.998	6.917	14.381	0.309	0.000	0.000	0.000	0.000	0.000	0.049	pg152_o2_nofp.cx8a4_bee
25.004	54.018	6.724	14.065	0.189	0.000	0.000	0.000	0.000	0.000	0.045	pg152_o2_nofp.cx8a9_bee
25.510	52.660	7.557	14.203	0.069	0.000	0.000	0.000	0.000	0.000	0.033	pg152_o2_nofp.cx8a10_bee
24.874	53.460	8.111	13.487	0.068	0.000	0.000	0.000	0.000	0.000	0.031	pg152_o2_nofp.cx8a12_bee
25.346	52.822	6.913	14.682	0.237	0.000	0.000	0.000	0.000	0.000	0.041	pg152_o2_nofp.cx8a14_bee
27.281	50.734	7.287	14.512	0.186	0.000	0.000	0.000	0.000	0.000	0.041	pg152_o2_nofp.cx8a15_bee
24.640	59.774	14.835	0.740	0.011	0.000	0.000	0.000	0.000	0.000	0.026	pg152_o2_nofp.cx8a16_bee
25.796	52.114	7.509	14.478	0.103	0.000	0.000	0.000	0.000	0.000	0.036	pg152_o2_nofp.cx8a17_bee
21.076	58.558	18.700	1.630	0.036	0.000	0.000	0.000	0.000	0.000	0.030	pg152_o2_nofp.cx8a18_bee