Introduction
This is a report for the insert benchmark with 20M docs and 4 client(s). It is generated by scripts (bash, awk, sed) and Tufte might not be impressed. An overview of the insert benchmark is here and a short update is here. Below, by DBMS, I mean DBMS+version.config. An example is my8020.c10b40 where my means MySQL, 8020 is version 8.0.20 and c10b40 is the name for the configuration file.
The test server has 8 AMD cores, 16G RAM and an NVMe SSD. It is described here as the Beelink. The benchmark was run with 4 clients and there were 1 or 3 connections per client (1 for queries or inserts without rate limits, 1+1 for rate limited inserts+deletes). It uses 4 tables, one per client. It loads 20M rows per table without secondary indexes, creates secondary indexes, then inserts 50M rows per table with a delete per insert to avoid growing the table. It then does 3 read+write tests for 1800s each that do queries as fast as possible with 100, 500 and then 1000 inserts/second/client concurrent with the queries and 1000 deletes/second to avoid growing the table. The database is cached by the OS page cache but not by the storage engine. Clients and the DBMS share one server. The per-database configs are in the per-database subdirectories here.
The tested DBMS are:
- pg152_o2_nofp.cx8_1g_bee - Postgres 15.2, cx8_1g_bee config, o2_nofp build that used: -O2 -no-omit-frame-pointer
- pg152_o2_nofp.cx8a1_1g_bee - Postgres 15.2, cx8a1_1g_bee config, o2_nofp build that used: -O2 -no-omit-frame-pointer, adds wal_compression=lz4
- pg152_o2_nofp.cx8a2_1g_bee - Postgres 15.2, cx8a2_1g_bee config, o2_nofp build that used: -O2 -no-omit-frame-pointer, adds backend_flush_after=256kb
- pg152_o2_nofp.cx8a3_1g_bee - Postgres 15.2, cx8a3_1g_bee config, o2_nofp build that used: -O2 -no-omit-frame-pointer, adds full_page_writes=off
- pg152_o2_nofp.cx8a4_1g_bee - Postgres 15.2, cx8a4_1g_bee config, o2_nofp build that used: -O2 -no-omit-frame-pointer, adds checkpoint_timeout=1800s which already set in the cx8_1g_bee config
- pg152_o2_nofp.cx8a9_1g_bee - Postgres 15.2, cx8a9_1g_bee config, o2_nofp build that used: -O2 -no-omit-frame-pointer, adds checkpoint_timeout=900s
- pg152_o2_nofp.cx8a10_1g_bee - Postgres 15.2, cx8a10_1g_bee config, o2_nofp build that used: -O2 -no-omit-frame-pointer, adds autovacuum_work_mem=256MB
- pg152_o2_nofp.cx8a12_1g_bee - Postgres 15.2, cx8a12_1g_bee config, o2_nofp build that used: -O2 -no-omit-frame-pointer, adds wal_buffers=64MB
- pg152_o2_nofp.cx8a14_1g_bee - Postgres 15.2, cx8a14_1g_bee config, o2_nofp build that used: -O2 -no-omit-frame-pointer, adds backend_flush_after=1MB
- pg152_o2_nofp.cx8a15_1g_bee - Postgres 15.2, cx8a15_1g_bee config, o2_nofp build that used: -O2 -no-omit-frame-pointer, adds max_wal_size=10G
- pg152_o2_nofp.cx8a16_1g_bee - Postgres 15.2, cx8a16_1g_bee config, o2_nofp build that used: -O2 -no-omit-frame-pointer, adds autovacuum_vacuum_scale_factor=0.05 autovacuum_vacuum_insert_scale_factor=0.05
- pg152_o2_nofp.cx8a17_1g_bee - Postgres 15.2, cx8a17_1g_bee config, o2_nofp build that used: -O2 -no-omit-frame-pointer, reduces bgwriter_lru_maxpages from 2000 to 500
- pg152_o2_nofp.cx8a18_1g_bee - Postgres 15.2, cx8a18_1g_bee config, o2_nofp build that used: -O2 -no-omit-frame-pointer, combines a1, a10, a12, a16
Contents
- Summary
- l.i0: load without secondary indexes
- l.x: create secondary indexes
- l.i1: continue load after secondary indexes created
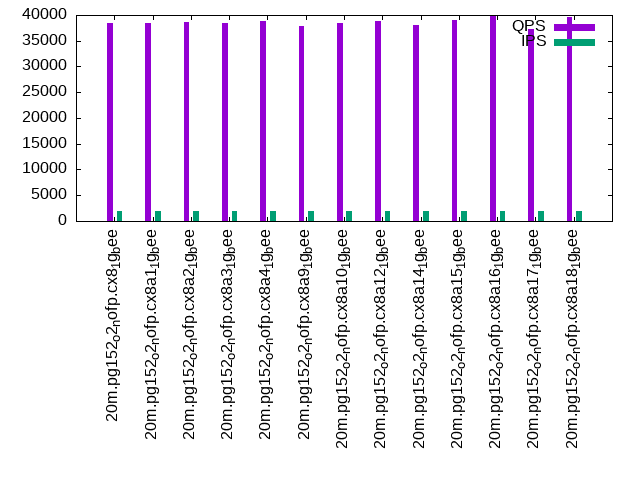
- q100.1: range queries with 100 insert/s per client
- q500.1: range queries with 500 insert/s per client
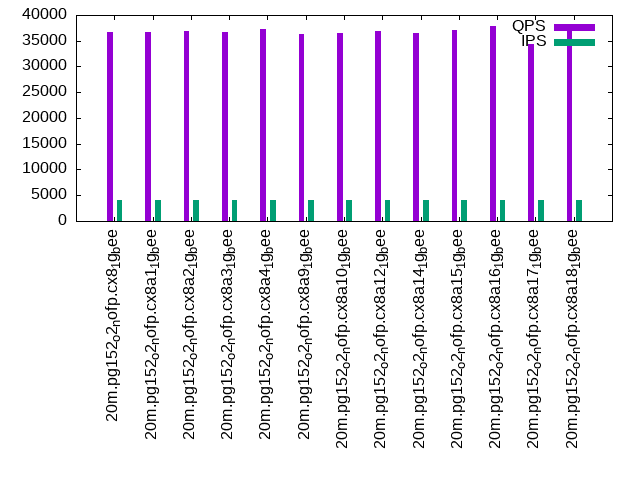
- q1000.1: range queries with 1000 insert/s per client
Summary
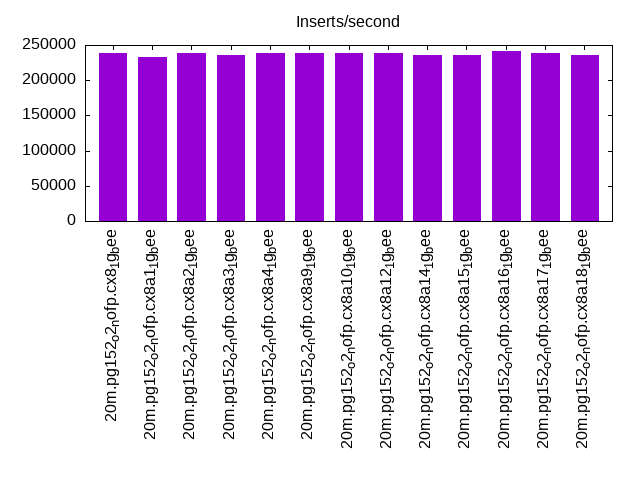
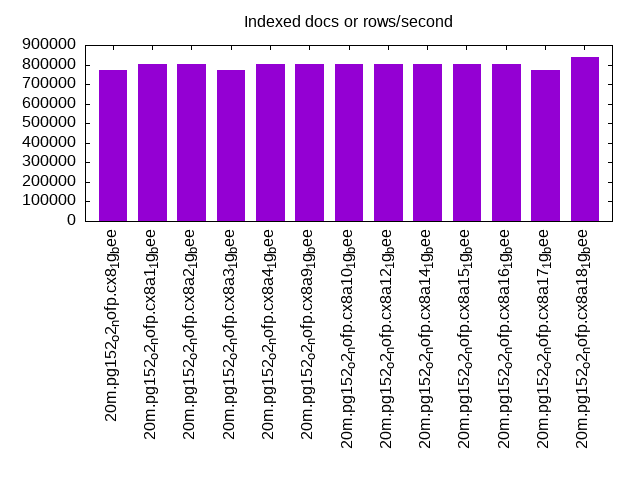
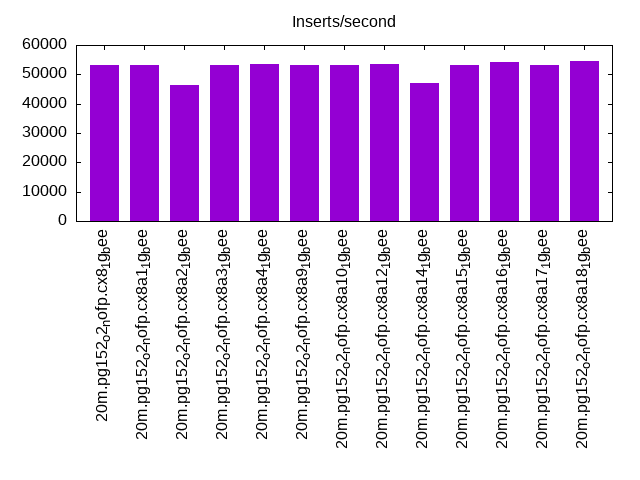
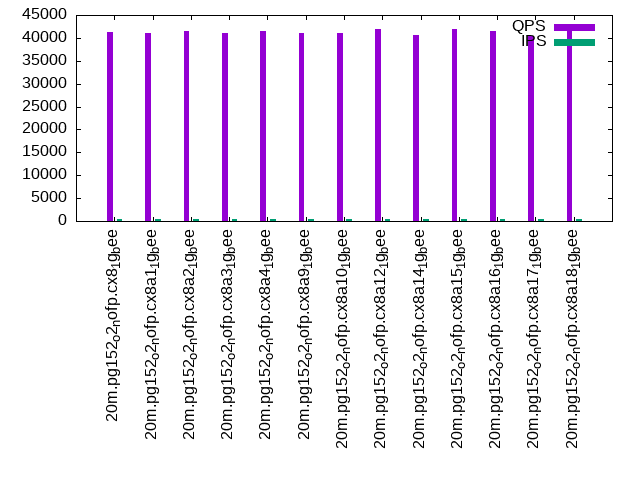
The numbers are inserts/s for l.i0 and l.i1, indexed docs (or rows) /s for l.x and queries/s for q*.2. The values are the average rate over the entire test for inserts (IPS) and queries (QPS). The range of values for IPS and QPS is split into 3 parts: bottom 25%, middle 50%, top 25%. Values in the bottom 25% have a red background, values in the top 25% have a green background and values in the middle have no color. A gray background is used for values that can be ignored because the DBMS did not sustain the target insert rate. Red backgrounds are not used when the minimum value is within 80% of the max value.
| dbms | l.i0 | l.x | l.i1 | q100.1 | q500.1 | q1000.1 |
|---|---|---|---|---|---|---|
| 20m.pg152_o2_nofp.cx8_1g_bee | 238095 | 773077 | 53333 | 41226 | 38511 | 36659 |
| 20m.pg152_o2_nofp.cx8a1_1g_bee | 232558 | 804000 | 53348 | 41096 | 38393 | 36793 |
| 20m.pg152_o2_nofp.cx8a2_1g_bee | 238095 | 804000 | 46458 | 41418 | 38689 | 36950 |
| 20m.pg152_o2_nofp.cx8a3_1g_bee | 235294 | 773077 | 53255 | 40997 | 38476 | 36719 |
| 20m.pg152_o2_nofp.cx8a4_1g_bee | 238095 | 804000 | 53576 | 41596 | 38777 | 37214 |
| 20m.pg152_o2_nofp.cx8a9_1g_bee | 238095 | 804000 | 53050 | 40998 | 37920 | 36231 |
| 20m.pg152_o2_nofp.cx8a10_1g_bee | 238095 | 804000 | 53213 | 41040 | 38478 | 36560 |
| 20m.pg152_o2_nofp.cx8a12_1g_bee | 238095 | 804000 | 53569 | 41898 | 38830 | 36878 |
| 20m.pg152_o2_nofp.cx8a14_1g_bee | 235294 | 804000 | 47192 | 40604 | 38144 | 36506 |
| 20m.pg152_o2_nofp.cx8a15_1g_bee | 235294 | 804000 | 53086 | 41874 | 39039 | 37126 |
| 20m.pg152_o2_nofp.cx8a16_1g_bee | 240964 | 804000 | 54281 | 41526 | 39801 | 37947 |
| 20m.pg152_o2_nofp.cx8a17_1g_bee | 238095 | 773077 | 53213 | 40496 | 37264 | 34392 |
| 20m.pg152_o2_nofp.cx8a18_1g_bee | 235294 | 837500 | 54533 | 41699 | 39658 | 37786 |
This table has relative throughput, throughput for the DBMS relative to the DBMS in the first line, using the absolute throughput from the previous table.
| dbms | l.i0 | l.x | l.i1 | q100.1 | q500.1 | q1000.1 |
|---|---|---|---|---|---|---|
| 20m.pg152_o2_nofp.cx8_1g_bee | 1.00 | 1.00 | 1.00 | 1.00 | 1.00 | 1.00 |
| 20m.pg152_o2_nofp.cx8a1_1g_bee | 0.98 | 1.04 | 1.00 | 1.00 | 1.00 | 1.00 |
| 20m.pg152_o2_nofp.cx8a2_1g_bee | 1.00 | 1.04 | 0.87 | 1.00 | 1.00 | 1.01 |
| 20m.pg152_o2_nofp.cx8a3_1g_bee | 0.99 | 1.00 | 1.00 | 0.99 | 1.00 | 1.00 |
| 20m.pg152_o2_nofp.cx8a4_1g_bee | 1.00 | 1.04 | 1.00 | 1.01 | 1.01 | 1.02 |
| 20m.pg152_o2_nofp.cx8a9_1g_bee | 1.00 | 1.04 | 0.99 | 0.99 | 0.98 | 0.99 |
| 20m.pg152_o2_nofp.cx8a10_1g_bee | 1.00 | 1.04 | 1.00 | 1.00 | 1.00 | 1.00 |
| 20m.pg152_o2_nofp.cx8a12_1g_bee | 1.00 | 1.04 | 1.00 | 1.02 | 1.01 | 1.01 |
| 20m.pg152_o2_nofp.cx8a14_1g_bee | 0.99 | 1.04 | 0.88 | 0.98 | 0.99 | 1.00 |
| 20m.pg152_o2_nofp.cx8a15_1g_bee | 0.99 | 1.04 | 1.00 | 1.02 | 1.01 | 1.01 |
| 20m.pg152_o2_nofp.cx8a16_1g_bee | 1.01 | 1.04 | 1.02 | 1.01 | 1.03 | 1.04 |
| 20m.pg152_o2_nofp.cx8a17_1g_bee | 1.00 | 1.00 | 1.00 | 0.98 | 0.97 | 0.94 |
| 20m.pg152_o2_nofp.cx8a18_1g_bee | 0.99 | 1.08 | 1.02 | 1.01 | 1.03 | 1.03 |
This lists the average rate of inserts/s for the tests that do inserts concurrent with queries. For such tests the query rate is listed in the table above. The read+write tests are setup so that the insert rate should match the target rate every second. Cells that are not at least 95% of the target have a red background to indicate a failure to satisfy the target.
| dbms | q100.1 | q500.1 | q1000.1 |
|---|---|---|---|
| pg152_o2_nofp.cx8_1g_bee | 399 | 1993 | 3989 |
| pg152_o2_nofp.cx8a1_1g_bee | 399 | 1993 | 3989 |
| pg152_o2_nofp.cx8a2_1g_bee | 399 | 1994 | 3989 |
| pg152_o2_nofp.cx8a3_1g_bee | 399 | 1994 | 3989 |
| pg152_o2_nofp.cx8a4_1g_bee | 399 | 1994 | 3989 |
| pg152_o2_nofp.cx8a9_1g_bee | 399 | 1994 | 3989 |
| pg152_o2_nofp.cx8a10_1g_bee | 399 | 1994 | 3989 |
| pg152_o2_nofp.cx8a12_1g_bee | 399 | 1993 | 3989 |
| pg152_o2_nofp.cx8a14_1g_bee | 399 | 1994 | 3989 |
| pg152_o2_nofp.cx8a15_1g_bee | 399 | 1993 | 3987 |
| pg152_o2_nofp.cx8a16_1g_bee | 399 | 1993 | 3989 |
| pg152_o2_nofp.cx8a17_1g_bee | 399 | 1994 | 3989 |
| pg152_o2_nofp.cx8a18_1g_bee | 399 | 1994 | 3989 |
| target | 400 | 2000 | 4000 |
l.i0
l.i0: load without secondary indexes. Graphs for performance per 1-second interval are here.
Average throughput:
Insert response time histogram: each cell has the percentage of responses that take <= the time in the header and max is the max response time in seconds. For the max column values in the top 25% of the range have a red background and in the bottom 25% of the range have a green background. The red background is not used when the min value is within 80% of the max value.
| dbms | 256us | 1ms | 4ms | 16ms | 64ms | 256ms | 1s | 4s | 16s | gt | max |
|---|---|---|---|---|---|---|---|---|---|---|---|
| pg152_o2_nofp.cx8_1g_bee | 99.926 | 0.073 | 0.001 | 0.021 | |||||||
| pg152_o2_nofp.cx8a1_1g_bee | 99.912 | 0.089 | 0.013 | ||||||||
| pg152_o2_nofp.cx8a2_1g_bee | 99.925 | 0.075 | 0.012 | ||||||||
| pg152_o2_nofp.cx8a3_1g_bee | 99.919 | 0.081 | 0.013 | ||||||||
| pg152_o2_nofp.cx8a4_1g_bee | 99.906 | 0.093 | 0.011 | ||||||||
| pg152_o2_nofp.cx8a9_1g_bee | 99.918 | 0.082 | 0.013 | ||||||||
| pg152_o2_nofp.cx8a10_1g_bee | 99.918 | 0.082 | 0.011 | ||||||||
| pg152_o2_nofp.cx8a12_1g_bee | 99.912 | 0.088 | 0.014 | ||||||||
| pg152_o2_nofp.cx8a14_1g_bee | 99.922 | 0.077 | 0.011 | ||||||||
| pg152_o2_nofp.cx8a15_1g_bee | 99.919 | 0.081 | 0.011 | ||||||||
| pg152_o2_nofp.cx8a16_1g_bee | 99.910 | 0.089 | 0.012 | ||||||||
| pg152_o2_nofp.cx8a17_1g_bee | 99.928 | 0.072 | 0.011 | ||||||||
| pg152_o2_nofp.cx8a18_1g_bee | 99.894 | 0.105 | 0.011 |
Performance metrics for the DBMS listed above. Some are normalized by throughput, others are not. Legend for results is here.
ips	qps	rps	rmbps	wps	wmbps	rpq	rkbpq	wpi	wkbpi	csps	cpups	cspq	cpupq	dbgb1	dbgb2	rss	maxop	p50	p99	tag
238095	0	0	0.0	716.5	113.5	0.000	0.000	0.003	0.488	23377	72.3	0.098	24	1.9	5.2	1.0	0.021	70722	43766	20m.pg152_o2_nofp.cx8_1g_bee
232558	0	0	0.0	730.3	110.1	0.000	0.000	0.003	0.485	22849	71.0	0.098	24	1.9	5.2	0.0	0.013	69350	40956	20m.pg152_o2_nofp.cx8a1_1g_bee
238095	0	0	0.0	718.3	114.1	0.000	0.000	0.003	0.491	23500	72.0	0.099	24	1.9	5.2	1.0	0.012	71028	2298	20m.pg152_o2_nofp.cx8a2_1g_bee
235294	0	0	0.0	726.2	109.6	0.000	0.000	0.003	0.477	22913	70.7	0.097	24	1.9	5.2	0.9	0.013	69625	16082	20m.pg152_o2_nofp.cx8a3_1g_bee
238095	0	0	0.0	719.4	114.3	0.000	0.000	0.003	0.492	23608	72.2	0.099	24	1.9	5.2	1.0	0.011	71089	9689	20m.pg152_o2_nofp.cx8a4_1g_bee
238095	0	0	0.0	712.7	113.4	0.000	0.000	0.003	0.488	23249	71.9	0.098	24	1.9	5.2	1.0	0.013	70233	49446	20m.pg152_o2_nofp.cx8a9_1g_bee
238095	0	0	0.0	691.3	114.4	0.000	0.000	0.003	0.492	23577	72.4	0.099	24	1.9	5.2	0.0	0.011	70723	61658	20m.pg152_o2_nofp.cx8a10_1g_bee
238095	0	0	0.0	604.2	112.7	0.000	0.000	0.003	0.485	22882	72.1	0.096	24	1.9	5.2	0.0	0.014	70223	40756	20m.pg152_o2_nofp.cx8a12_1g_bee
235294	0	0	0.0	715.3	113.5	0.000	0.000	0.003	0.494	23286	71.9	0.099	24	1.9	5.2	1.0	0.011	70423	31178	20m.pg152_o2_nofp.cx8a14_1g_bee
235294	0	0	0.0	714.4	113.5	0.000	0.000	0.003	0.494	23316	72.3	0.099	25	1.9	5.2	0.0	0.011	70223	52243	20m.pg152_o2_nofp.cx8a15_1g_bee
240964	0	0	0.0	710.7	114.3	0.000	0.000	0.003	0.486	21900	72.2	0.091	24	1.9	5.2	1.0	0.012	71023	62452	20m.pg152_o2_nofp.cx8a16_1g_bee
238095	0	0	0.0	720.5	113.6	0.000	0.000	0.003	0.489	23384	71.9	0.098	24	1.9	5.2	0.0	0.011	70823	28569	20m.pg152_o2_nofp.cx8a17_1g_bee
235294	0	0	0.0	698.4	113.6	0.000	0.000	0.003	0.494	23489	72.2	0.100	25	1.9	5.2	0.0	0.011	70624	28569	20m.pg152_o2_nofp.cx8a18_1g_bee
l.x
l.x: create secondary indexes.
Average throughput:
Performance metrics for the DBMS listed above. Some are normalized by throughput, others are not. Legend for results is here.
ips	qps	rps	rmbps	wps	wmbps	rpq	rkbpq	wpi	wkbpi	csps	cpups	cspq	cpupq	dbgb1	dbgb2	rss	maxop	p50	p99	tag
773077	0	0	0.0	651.0	207.2	0.000	0.000	0.001	0.275	2244	37.3	0.003	4	3.7	8.6	0.0	0.003	NA	NA	20m.pg152_o2_nofp.cx8_1g_bee
804000	0	0	0.0	550.6	166.2	0.000	0.000	0.001	0.212	2081	38.3	0.003	4	3.7	8.0	0.0	0.003	NA	NA	20m.pg152_o2_nofp.cx8a1_1g_bee
804000	0	0	0.0	643.7	207.4	0.000	0.000	0.001	0.264	2461	37.7	0.003	4	3.7	8.6	0.0	0.003	NA	NA	20m.pg152_o2_nofp.cx8a2_1g_bee
773077	0	0	0.0	651.2	208.1	0.000	0.000	0.001	0.276	2390	37.8	0.003	4	3.7	8.6	0.0	0.004	NA	NA	20m.pg152_o2_nofp.cx8a3_1g_bee
804000	0	0	0.0	643.6	207.7	0.000	0.000	0.001	0.265	2365	37.2	0.003	4	3.7	8.6	0.0	0.003	NA	NA	20m.pg152_o2_nofp.cx8a4_1g_bee
804000	0	0	0.0	664.1	208.1	0.000	0.000	0.001	0.265	2043	37.7	0.003	4	3.7	8.6	0.0	0.003	NA	NA	20m.pg152_o2_nofp.cx8a9_1g_bee
804000	0	0	0.0	565.7	205.8	0.000	0.000	0.001	0.262	2082	37.7	0.003	4	3.7	8.6	0.0	0.003	NA	NA	20m.pg152_o2_nofp.cx8a10_1g_bee
804000	0	0	0.0	616.4	216.3	0.000	0.000	0.001	0.275	2509	37.3	0.003	4	3.7	8.6	0.0	0.004	NA	NA	20m.pg152_o2_nofp.cx8a12_1g_bee
804000	0	0	0.0	653.1	208.5	0.000	0.000	0.001	0.266	2112	37.7	0.003	4	3.7	8.6	0.0	0.003	NA	NA	20m.pg152_o2_nofp.cx8a14_1g_bee
804000	0	0	0.0	649.6	206.0	0.000	0.000	0.001	0.262	2436	37.8	0.003	4	3.7	8.6	0.0	0.003	NA	NA	20m.pg152_o2_nofp.cx8a15_1g_bee
804000	0	0	0.0	671.1	216.5	0.000	0.000	0.001	0.276	3203	37.7	0.004	4	3.7	8.6	0.0	0.003	NA	NA	20m.pg152_o2_nofp.cx8a16_1g_bee
773077	0	0	0.0	642.8	204.6	0.000	0.000	0.001	0.271	2183	37.0	0.003	4	3.7	8.6	0.0	0.003	NA	NA	20m.pg152_o2_nofp.cx8a17_1g_bee
837500	0	0	0.0	483.3	123.3	0.000	0.000	0.001	0.151	1596	42.0	0.002	4	3.7	8.0	0.0	0.003	NA	NA	20m.pg152_o2_nofp.cx8a18_1g_bee
l.i1
l.i1: continue load after secondary indexes created. Graphs for performance per 1-second interval are here.
Average throughput:
Insert response time histogram: each cell has the percentage of responses that take <= the time in the header and max is the max response time in seconds. For the max column values in the top 25% of the range have a red background and in the bottom 25% of the range have a green background. The red background is not used when the min value is within 80% of the max value.
| dbms | 256us | 1ms | 4ms | 16ms | 64ms | 256ms | 1s | 4s | 16s | gt | max |
|---|---|---|---|---|---|---|---|---|---|---|---|
| pg152_o2_nofp.cx8_1g_bee | 88.344 | 11.625 | 0.030 | 0.001 | 0.157 | ||||||
| pg152_o2_nofp.cx8a1_1g_bee | 88.182 | 11.794 | 0.021 | 0.002 | 0.207 | ||||||
| pg152_o2_nofp.cx8a2_1g_bee | 59.906 | 39.928 | 0.161 | 0.005 | 0.117 | ||||||
| pg152_o2_nofp.cx8a3_1g_bee | 88.554 | 11.431 | 0.015 | 0.001 | 0.186 | ||||||
| pg152_o2_nofp.cx8a4_1g_bee | 88.564 | 11.400 | 0.035 | 0.001 | 0.178 | ||||||
| pg152_o2_nofp.cx8a9_1g_bee | 88.425 | 11.541 | 0.033 | 0.002 | 0.149 | ||||||
| pg152_o2_nofp.cx8a10_1g_bee | 88.260 | 11.698 | 0.036 | 0.006 | 0.190 | ||||||
| pg152_o2_nofp.cx8a12_1g_bee | 88.419 | 11.556 | 0.023 | 0.002 | nonzero | 0.491 | |||||
| pg152_o2_nofp.cx8a14_1g_bee | 57.178 | 42.665 | 0.152 | 0.004 | 0.123 | ||||||
| pg152_o2_nofp.cx8a15_1g_bee | 87.228 | 12.625 | 0.144 | 0.003 | 0.136 | ||||||
| pg152_o2_nofp.cx8a16_1g_bee | 85.806 | 14.160 | 0.032 | 0.002 | 0.185 | ||||||
| pg152_o2_nofp.cx8a17_1g_bee | 89.554 | 10.415 | 0.029 | 0.002 | 0.144 | ||||||
| pg152_o2_nofp.cx8a18_1g_bee | 86.187 | 13.796 | 0.017 | 0.001 | nonzero | 0.426 |
Delete response time histogram: each cell has the percentage of responses that take <= the time in the header and max is the max response time in seconds. For the max column values in the top 25% of the range have a red background and in the bottom 25% of the range have a green background. The red background is not used when the min value is within 80% of the max value.
| dbms | 256us | 1ms | 4ms | 16ms | 64ms | 256ms | 1s | 4s | 16s | gt | max |
|---|---|---|---|---|---|---|---|---|---|---|---|
| pg152_o2_nofp.cx8_1g_bee | 1.838 | 89.548 | 2.191 | 6.366 | 0.057 | nonzero | 0.122 | ||||
| pg152_o2_nofp.cx8a1_1g_bee | 1.806 | 90.216 | 2.405 | 5.413 | 0.160 | nonzero | 0.169 | ||||
| pg152_o2_nofp.cx8a2_1g_bee | 0.804 | 90.538 | 1.498 | 7.094 | 0.065 | nonzero | 0.090 | ||||
| pg152_o2_nofp.cx8a3_1g_bee | 1.993 | 89.444 | 2.083 | 6.373 | 0.108 | nonzero | 0.075 | ||||
| pg152_o2_nofp.cx8a4_1g_bee | 2.005 | 89.810 | 2.295 | 5.811 | 0.079 | nonzero | 0.171 | ||||
| pg152_o2_nofp.cx8a9_1g_bee | 2.060 | 89.375 | 2.299 | 6.122 | 0.143 | 0.001 | 0.146 | ||||
| pg152_o2_nofp.cx8a10_1g_bee | 1.968 | 89.793 | 2.556 | 5.533 | 0.149 | 0.002 | 0.200 | ||||
| pg152_o2_nofp.cx8a12_1g_bee | 1.984 | 89.815 | 2.468 | 5.641 | 0.091 | nonzero | nonzero | 0.488 | |||
| pg152_o2_nofp.cx8a14_1g_bee | 1.011 | 90.100 | 1.461 | 7.367 | 0.060 | nonzero | 0.125 | ||||
| pg152_o2_nofp.cx8a15_1g_bee | 1.811 | 89.518 | 3.494 | 5.083 | 0.093 | 0.001 | 0.136 | ||||
| pg152_o2_nofp.cx8a16_1g_bee | 2.067 | 89.541 | 2.592 | 5.773 | 0.026 | nonzero | 0.124 | ||||
| pg152_o2_nofp.cx8a17_1g_bee | 1.771 | 89.559 | 2.274 | 6.336 | 0.059 | nonzero | 0.132 | ||||
| pg152_o2_nofp.cx8a18_1g_bee | 1.884 | 89.822 | 2.716 | 5.549 | 0.029 | nonzero | nonzero | 0.422 |
Performance metrics for the DBMS listed above. Some are normalized by throughput, others are not. Legend for results is here.
ips	qps	rps	rmbps	wps	wmbps	rpq	rkbpq	wpi	wkbpi	csps	cpups	cspq	cpupq	dbgb1	dbgb2	rss	maxop	p50	p99	tag
53333	0	12	0.1	47874.1	799.7	0.000	0.002	0.898	15.354	28583	70.5	0.536	106	6.2	46.3	0.9	0.157	14588	4195	20m.pg152_o2_nofp.cx8_1g_bee
53348	0	11	0.1	48398.6	802.7	0.000	0.001	0.907	15.408	28582	70.1	0.536	105	6.3	46.3	0.0	0.207	14534	4145	20m.pg152_o2_nofp.cx8a1_1g_bee
46458	0	6	0.1	98923.1	832.2	0.000	0.001	2.129	18.342	24424	68.3	0.526	118	6.2	46.2	0.0	0.117	12536	4545	20m.pg152_o2_nofp.cx8a2_1g_bee
53255	0	7	0.1	48330.7	797.3	0.000	0.001	0.908	15.330	28244	70.6	0.530	106	6.2	46.3	1.0	0.186	14634	4145	20m.pg152_o2_nofp.cx8a3_1g_bee
53576	0	14	0.1	48086.9	804.6	0.000	0.002	0.898	15.378	28704	70.2	0.536	105	6.2	46.3	0.0	0.178	14634	4197	20m.pg152_o2_nofp.cx8a4_1g_bee
53050	0	16	0.1	48061.0	800.0	0.000	0.002	0.906	15.442	28285	70.6	0.533	106	6.2	46.3	0.0	0.149	14631	4147	20m.pg152_o2_nofp.cx8a9_1g_bee
53213	0	21	0.1	48362.1	805.3	0.000	0.002	0.909	15.496	28685	69.9	0.539	105	6.3	46.4	0.0	0.190	14534	4097	20m.pg152_o2_nofp.cx8a10_1g_bee
53569	0	16	0.1	48463.1	807.5	0.000	0.002	0.905	15.436	28808	70.2	0.538	105	6.3	46.3	0.0	0.491	14584	4190	20m.pg152_o2_nofp.cx8a12_1g_bee
47192	0	7	0.1	97710.4	825.7	0.000	0.001	2.070	17.917	24879	68.5	0.527	116	6.2	46.2	0.2	0.123	12735	4597	20m.pg152_o2_nofp.cx8a14_1g_bee
53086	0	108	0.6	48407.5	818.2	0.002	0.012	0.912	15.783	28505	69.6	0.537	105	6.3	16.3	0.0	0.136	14334	4195	20m.pg152_o2_nofp.cx8a15_1g_bee
54281	0	8	0.0	47893.0	829.1	0.000	0.001	0.882	15.642	29642	71.3	0.546	105	5.9	46.0	1.0	0.185	14385	5993	20m.pg152_o2_nofp.cx8a16_1g_bee
53213	0	11	0.1	41626.8	805.9	0.000	0.002	0.782	15.508	28339	69.7	0.533	105	6.2	46.3	0.0	0.144	14634	4195	20m.pg152_o2_nofp.cx8a17_1g_bee
54533	0	5	0.0	48097.3	829.0	0.000	0.000	0.882	15.567	29703	71.2	0.545	104	5.9	45.9	0.5	0.426	14434	5993	20m.pg152_o2_nofp.cx8a18_1g_bee
q100.1
q100.1: range queries with 100 insert/s per client. Graphs for performance per 1-second interval are here.
Average throughput:
Query response time histogram: each cell has the percentage of responses that take <= the time in the header and max is the max response time in seconds. For max values in the top 25% of the range have a red background and in the bottom 25% of the range have a green background. The red background is not used when the min value is within 80% of the max value.
| dbms | 256us | 1ms | 4ms | 16ms | 64ms | 256ms | 1s | 4s | 16s | gt | max |
|---|---|---|---|---|---|---|---|---|---|---|---|
| pg152_o2_nofp.cx8_1g_bee | 99.970 | 0.021 | 0.008 | nonzero | 0.011 | ||||||
| pg152_o2_nofp.cx8a1_1g_bee | 99.966 | 0.025 | 0.010 | nonzero | 0.011 | ||||||
| pg152_o2_nofp.cx8a2_1g_bee | 99.974 | 0.017 | 0.009 | nonzero | 0.012 | ||||||
| pg152_o2_nofp.cx8a3_1g_bee | 99.974 | 0.016 | 0.009 | nonzero | 0.010 | ||||||
| pg152_o2_nofp.cx8a4_1g_bee | 99.973 | 0.019 | 0.008 | nonzero | 0.011 | ||||||
| pg152_o2_nofp.cx8a9_1g_bee | 99.958 | 0.030 | 0.012 | nonzero | 0.013 | ||||||
| pg152_o2_nofp.cx8a10_1g_bee | 99.971 | 0.020 | 0.009 | nonzero | 0.010 | ||||||
| pg152_o2_nofp.cx8a12_1g_bee | 99.974 | 0.017 | 0.009 | nonzero | 0.014 | ||||||
| pg152_o2_nofp.cx8a14_1g_bee | 99.969 | 0.021 | 0.009 | nonzero | 0.012 | ||||||
| pg152_o2_nofp.cx8a15_1g_bee | 99.978 | 0.014 | 0.008 | nonzero | 0.011 | ||||||
| pg152_o2_nofp.cx8a16_1g_bee | 99.975 | 0.016 | 0.009 | nonzero | 0.010 | ||||||
| pg152_o2_nofp.cx8a17_1g_bee | 99.968 | 0.022 | 0.009 | nonzero | 0.008 | ||||||
| pg152_o2_nofp.cx8a18_1g_bee | 99.972 | 0.018 | 0.009 | nonzero | 0.011 |
Insert response time histogram: each cell has the percentage of responses that take <= the time in the header and max is the max response time in seconds. For max values in the top 25% of the range have a red background and in the bottom 25% of the range have a green background. The red background is not used when the min value is within 80% of the max value.
| dbms | 256us | 1ms | 4ms | 16ms | 64ms | 256ms | 1s | 4s | 16s | gt | max |
|---|---|---|---|---|---|---|---|---|---|---|---|
| pg152_o2_nofp.cx8_1g_bee | 99.507 | 0.493 | 0.009 | ||||||||
| pg152_o2_nofp.cx8a1_1g_bee | 99.028 | 0.972 | 0.010 | ||||||||
| pg152_o2_nofp.cx8a2_1g_bee | 99.792 | 0.208 | 0.008 | ||||||||
| pg152_o2_nofp.cx8a3_1g_bee | 99.472 | 0.528 | 0.010 | ||||||||
| pg152_o2_nofp.cx8a4_1g_bee | 99.847 | 0.153 | 0.011 | ||||||||
| pg152_o2_nofp.cx8a9_1g_bee | 99.549 | 0.451 | 0.009 | ||||||||
| pg152_o2_nofp.cx8a10_1g_bee | 99.479 | 0.521 | 0.009 | ||||||||
| pg152_o2_nofp.cx8a12_1g_bee | 99.806 | 0.194 | 0.010 | ||||||||
| pg152_o2_nofp.cx8a14_1g_bee | 99.812 | 0.188 | 0.014 | ||||||||
| pg152_o2_nofp.cx8a15_1g_bee | 99.653 | 0.347 | 0.011 | ||||||||
| pg152_o2_nofp.cx8a16_1g_bee | 99.785 | 0.215 | 0.010 | ||||||||
| pg152_o2_nofp.cx8a17_1g_bee | 99.375 | 0.625 | 0.009 | ||||||||
| pg152_o2_nofp.cx8a18_1g_bee | 99.125 | 0.875 | 0.010 |
Delete response time histogram: each cell has the percentage of responses that take <= the time in the header and max is the max response time in seconds. For max values in the top 25% of the range have a red background and in the bottom 25% of the range have a green background. The red background is not used when the min value is within 80% of the max value.
| dbms | 256us | 1ms | 4ms | 16ms | 64ms | 256ms | 1s | 4s | 16s | gt | max |
|---|---|---|---|---|---|---|---|---|---|---|---|
| pg152_o2_nofp.cx8_1g_bee | 9.618 | 71.681 | 18.174 | 0.528 | 0.008 | ||||||
| pg152_o2_nofp.cx8a1_1g_bee | 10.014 | 77.049 | 12.514 | 0.424 | 0.013 | ||||||
| pg152_o2_nofp.cx8a2_1g_bee | 10.132 | 68.708 | 20.972 | 0.188 | 0.010 | ||||||
| pg152_o2_nofp.cx8a3_1g_bee | 13.229 | 62.493 | 23.639 | 0.639 | 0.007 | ||||||
| pg152_o2_nofp.cx8a4_1g_bee | 11.431 | 77.847 | 10.667 | 0.056 | 0.008 | ||||||
| pg152_o2_nofp.cx8a9_1g_bee | 14.438 | 65.139 | 19.965 | 0.458 | 0.008 | ||||||
| pg152_o2_nofp.cx8a10_1g_bee | 11.326 | 75.312 | 13.049 | 0.312 | 0.008 | ||||||
| pg152_o2_nofp.cx8a12_1g_bee | 9.708 | 78.194 | 12.056 | 0.042 | 0.007 | ||||||
| pg152_o2_nofp.cx8a14_1g_bee | 10.007 | 62.528 | 27.236 | 0.229 | 0.007 | ||||||
| pg152_o2_nofp.cx8a15_1g_bee | 10.243 | 80.667 | 9.028 | 0.062 | 0.006 | ||||||
| pg152_o2_nofp.cx8a16_1g_bee | 11.042 | 80.396 | 8.528 | 0.035 | 0.006 | ||||||
| pg152_o2_nofp.cx8a17_1g_bee | 11.868 | 75.208 | 12.535 | 0.389 | 0.010 | ||||||
| pg152_o2_nofp.cx8a18_1g_bee | 9.660 | 81.688 | 8.542 | 0.111 | 0.008 |
Performance metrics for the DBMS listed above. Some are normalized by throughput, others are not. Legend for results is here.
ips	qps	rps	rmbps	wps	wmbps	rpq	rkbpq	wpi	wkbpi	csps	cpups	cspq	cpupq	dbgb1	dbgb2	rss	maxop	p50	p99	tag
399	41226	1	0.0	1745.1	14.9	0.000	0.000	4.376	38.286	157142	50.4	3.812	98	6.2	46.3	0.0	0.011	10437	8551	20m.pg152_o2_nofp.cx8_1g_bee
399	41096	0	0.0	1704.8	14.5	0.000	0.000	4.277	37.153	156799	50.4	3.815	98	6.3	46.3	0.0	0.011	10485	8266	20m.pg152_o2_nofp.cx8a1_1g_bee
399	41418	0	0.0	1693.8	14.1	0.000	0.000	4.247	36.091	157944	50.5	3.813	98	6.2	46.2	0.0	0.012	10564	8647	20m.pg152_o2_nofp.cx8a2_1g_bee
399	40997	0	0.0	1782.2	14.6	0.000	0.000	4.469	37.561	156264	50.5	3.812	99	6.2	46.3	0.0	0.010	10389	8455	20m.pg152_o2_nofp.cx8a3_1g_bee
399	41596	0	0.0	1719.9	14.4	0.000	0.000	4.313	36.931	158615	50.4	3.813	97	6.2	46.3	0.0	0.011	10580	8746	20m.pg152_o2_nofp.cx8a4_1g_bee
399	40998	0	0.0	1752.7	15.4	0.000	0.000	4.395	39.661	156407	50.4	3.815	98	6.2	46.3	0.0	0.013	10420	8407	20m.pg152_o2_nofp.cx8a9_1g_bee
399	41040	0	0.0	1726.1	14.8	0.000	0.000	4.328	37.915	156523	50.4	3.814	98	6.3	46.4	0.0	0.010	10437	8551	20m.pg152_o2_nofp.cx8a10_1g_bee
399	41898	0	0.0	1704.7	14.8	0.000	0.000	4.274	37.978	159790	50.5	3.814	96	6.3	46.3	0.0	0.014	10664	9050	20m.pg152_o2_nofp.cx8a12_1g_bee
399	40604	0	0.0	1699.7	14.1	0.000	0.000	4.262	36.128	154800	50.5	3.812	99	6.2	46.2	0.0	0.012	10296	8407	20m.pg152_o2_nofp.cx8a14_1g_bee
399	41874	1	0.0	1700.2	14.5	0.000	0.000	4.263	37.195	159673	50.4	3.813	96	6.3	16.3	0.0	0.011	10724	9030	20m.pg152_o2_nofp.cx8a15_1g_bee
399	41526	0	0.0	1701.4	14.2	0.000	0.000	4.266	36.533	158365	50.5	3.814	97	5.9	45.9	0.0	0.010	10453	8426	20m.pg152_o2_nofp.cx8a16_1g_bee
399	40496	0	0.0	1679.3	14.2	0.000	0.000	4.213	36.513	154499	50.4	3.815	100	6.2	46.2	0.0	0.008	10341	8491	20m.pg152_o2_nofp.cx8a17_1g_bee
399	41699	0	0.0	1700.8	14.0	0.000	0.000	4.265	36.023	159030	50.5	3.814	97	5.9	45.9	0.0	0.011	10568	8743	20m.pg152_o2_nofp.cx8a18_1g_bee
q500.1
q500.1: range queries with 500 insert/s per client. Graphs for performance per 1-second interval are here.
Average throughput:
Query response time histogram: each cell has the percentage of responses that take <= the time in the header and max is the max response time in seconds. For max values in the top 25% of the range have a red background and in the bottom 25% of the range have a green background. The red background is not used when the min value is within 80% of the max value.
| dbms | 256us | 1ms | 4ms | 16ms | 64ms | 256ms | 1s | 4s | 16s | gt | max |
|---|---|---|---|---|---|---|---|---|---|---|---|
| pg152_o2_nofp.cx8_1g_bee | 99.878 | 0.093 | 0.024 | 0.005 | nonzero | 0.022 | |||||
| pg152_o2_nofp.cx8a1_1g_bee | 99.880 | 0.091 | 0.025 | 0.004 | nonzero | 0.020 | |||||
| pg152_o2_nofp.cx8a2_1g_bee | 99.887 | 0.084 | 0.025 | 0.005 | nonzero | 0.023 | |||||
| pg152_o2_nofp.cx8a3_1g_bee | 99.887 | 0.084 | 0.024 | 0.005 | nonzero | 0.022 | |||||
| pg152_o2_nofp.cx8a4_1g_bee | 99.880 | 0.091 | 0.024 | 0.005 | nonzero | 0.024 | |||||
| pg152_o2_nofp.cx8a9_1g_bee | 99.841 | 0.127 | 0.027 | 0.005 | nonzero | 0.019 | |||||
| pg152_o2_nofp.cx8a10_1g_bee | 99.876 | 0.095 | 0.024 | 0.005 | nonzero | 0.019 | |||||
| pg152_o2_nofp.cx8a12_1g_bee | 99.879 | 0.092 | 0.024 | 0.005 | nonzero | 0.023 | |||||
| pg152_o2_nofp.cx8a14_1g_bee | 99.880 | 0.091 | 0.025 | 0.005 | nonzero | 0.021 | |||||
| pg152_o2_nofp.cx8a15_1g_bee | 99.877 | 0.095 | 0.024 | 0.004 | nonzero | 0.021 | |||||
| pg152_o2_nofp.cx8a16_1g_bee | 99.900 | 0.071 | 0.026 | 0.003 | nonzero | 0.023 | |||||
| pg152_o2_nofp.cx8a17_1g_bee | 99.849 | 0.118 | 0.028 | 0.005 | nonzero | 0.027 | |||||
| pg152_o2_nofp.cx8a18_1g_bee | 99.898 | 0.073 | 0.026 | 0.004 | nonzero | 0.024 |
Insert response time histogram: each cell has the percentage of responses that take <= the time in the header and max is the max response time in seconds. For max values in the top 25% of the range have a red background and in the bottom 25% of the range have a green background. The red background is not used when the min value is within 80% of the max value.
| dbms | 256us | 1ms | 4ms | 16ms | 64ms | 256ms | 1s | 4s | 16s | gt | max |
|---|---|---|---|---|---|---|---|---|---|---|---|
| pg152_o2_nofp.cx8_1g_bee | 93.593 | 6.276 | 0.131 | 0.039 | |||||||
| pg152_o2_nofp.cx8a1_1g_bee | 96.074 | 3.849 | 0.078 | 0.027 | |||||||
| pg152_o2_nofp.cx8a2_1g_bee | 95.140 | 4.761 | 0.099 | 0.026 | |||||||
| pg152_o2_nofp.cx8a3_1g_bee | 94.514 | 5.381 | 0.106 | 0.033 | |||||||
| pg152_o2_nofp.cx8a4_1g_bee | 94.364 | 5.550 | 0.086 | 0.028 | |||||||
| pg152_o2_nofp.cx8a9_1g_bee | 97.097 | 2.874 | 0.029 | 0.022 | |||||||
| pg152_o2_nofp.cx8a10_1g_bee | 95.022 | 4.903 | 0.075 | 0.026 | |||||||
| pg152_o2_nofp.cx8a12_1g_bee | 95.506 | 4.394 | 0.100 | 0.027 | |||||||
| pg152_o2_nofp.cx8a14_1g_bee | 96.399 | 3.539 | 0.062 | 0.028 | |||||||
| pg152_o2_nofp.cx8a15_1g_bee | 97.189 | 2.769 | 0.042 | 0.026 | |||||||
| pg152_o2_nofp.cx8a16_1g_bee | 97.194 | 2.768 | 0.037 | 0.024 | |||||||
| pg152_o2_nofp.cx8a17_1g_bee | 95.196 | 4.768 | 0.036 | 0.024 | |||||||
| pg152_o2_nofp.cx8a18_1g_bee | 96.167 | 3.769 | 0.064 | 0.027 |
Delete response time histogram: each cell has the percentage of responses that take <= the time in the header and max is the max response time in seconds. For max values in the top 25% of the range have a red background and in the bottom 25% of the range have a green background. The red background is not used when the min value is within 80% of the max value.
| dbms | 256us | 1ms | 4ms | 16ms | 64ms | 256ms | 1s | 4s | 16s | gt | max |
|---|---|---|---|---|---|---|---|---|---|---|---|
| pg152_o2_nofp.cx8_1g_bee | 34.774 | 41.744 | 9.108 | 14.137 | 0.236 | 0.034 | |||||
| pg152_o2_nofp.cx8a1_1g_bee | 29.832 | 49.721 | 8.354 | 12.000 | 0.093 | 0.033 | |||||
| pg152_o2_nofp.cx8a2_1g_bee | 37.858 | 41.136 | 8.139 | 12.785 | 0.082 | 0.031 | |||||
| pg152_o2_nofp.cx8a3_1g_bee | 40.347 | 36.475 | 9.004 | 13.953 | 0.221 | 0.036 | |||||
| pg152_o2_nofp.cx8a4_1g_bee | 37.604 | 39.343 | 8.575 | 14.303 | 0.175 | 0.036 | |||||
| pg152_o2_nofp.cx8a9_1g_bee | 40.547 | 38.297 | 7.883 | 13.221 | 0.051 | 0.035 | |||||
| pg152_o2_nofp.cx8a10_1g_bee | 37.317 | 39.842 | 8.500 | 14.217 | 0.125 | 0.035 | |||||
| pg152_o2_nofp.cx8a12_1g_bee | 35.665 | 41.436 | 8.154 | 14.550 | 0.194 | 0.050 | |||||
| pg152_o2_nofp.cx8a14_1g_bee | 39.853 | 40.318 | 7.671 | 12.097 | 0.061 | 0.034 | |||||
| pg152_o2_nofp.cx8a15_1g_bee | 36.092 | 40.157 | 9.808 | 13.700 | 0.243 | 0.039 | |||||
| pg152_o2_nofp.cx8a16_1g_bee | 36.343 | 45.932 | 17.363 | 0.356 | 0.007 | 0.021 | |||||
| pg152_o2_nofp.cx8a17_1g_bee | 36.886 | 40.410 | 8.560 | 14.037 | 0.107 | 0.035 | |||||
| pg152_o2_nofp.cx8a18_1g_bee | 28.738 | 54.015 | 16.629 | 0.614 | 0.004 | 0.024 |
Performance metrics for the DBMS listed above. Some are normalized by throughput, others are not. Legend for results is here.
ips	qps	rps	rmbps	wps	wmbps	rpq	rkbpq	wpi	wkbpi	csps	cpups	cspq	cpupq	dbgb1	dbgb2	rss	maxop	p50	p99	tag
1993	38511	14	0.1	7737.0	62.7	0.000	0.002	3.881	32.234	145113	52.6	3.768	109	6.2	46.3	0.0	0.022	9749	7831	20m.pg152_o2_nofp.cx8_1g_bee
1993	38393	3	0.0	7753.3	62.5	0.000	0.000	3.890	32.100	144604	52.5	3.766	109	6.3	46.3	0.0	0.020	9734	7690	20m.pg152_o2_nofp.cx8a1_1g_bee
1994	38689	1	0.0	7751.6	63.2	0.000	0.000	3.887	32.473	145717	52.5	3.766	109	6.2	46.2	0.0	0.023	9797	7863	20m.pg152_o2_nofp.cx8a2_1g_bee
1994	38476	0	0.0	7748.3	62.0	0.000	0.000	3.885	31.834	144828	52.6	3.764	109	6.2	46.3	0.0	0.022	9749	7879	20m.pg152_o2_nofp.cx8a3_1g_bee
1994	38777	8	0.0	7749.2	62.9	0.000	0.001	3.885	32.288	146033	52.6	3.766	109	6.2	46.3	0.0	0.024	9797	7755	20m.pg152_o2_nofp.cx8a4_1g_bee
1994	37920	1	0.0	7751.7	64.4	0.000	0.000	3.887	33.069	143070	52.4	3.773	111	6.2	42.1	0.0	0.019	9577	7704	20m.pg152_o2_nofp.cx8a9_1g_bee
1994	38478	8	0.0	7759.9	63.0	0.000	0.001	3.891	32.340	144932	52.5	3.767	109	6.3	46.4	0.0	0.019	9813	7927	20m.pg152_o2_nofp.cx8a10_1g_bee
1993	38830	1	0.0	7777.4	63.9	0.000	0.000	3.902	32.832	146227	52.6	3.766	108	6.3	46.3	0.0	0.023	9829	7879	20m.pg152_o2_nofp.cx8a12_1g_bee
1994	38144	0	0.0	7723.8	62.6	0.000	0.000	3.873	32.161	143699	52.6	3.767	110	6.2	46.2	0.0	0.021	9621	7719	20m.pg152_o2_nofp.cx8a14_1g_bee
1993	39039	14	0.1	7766.9	63.5	0.000	0.002	3.897	32.640	147143	52.5	3.769	108	6.3	16.3	0.0	0.021	9961	7882	20m.pg152_o2_nofp.cx8a15_1g_bee
1993	39801	0	0.0	7870.9	66.6	0.000	0.000	3.949	34.236	150214	52.4	3.774	105	5.9	45.9	0.0	0.023	10101	8231	20m.pg152_o2_nofp.cx8a16_1g_bee
1994	37264	1	0.0	6727.8	59.2	0.000	0.000	3.373	30.399	140677	52.2	3.775	112	6.2	46.2	0.0	0.027	9461	7672	20m.pg152_o2_nofp.cx8a17_1g_bee
1994	39658	0	0.0	7878.1	66.7	0.000	0.000	3.950	34.254	149619	52.4	3.773	106	5.9	45.9	0.0	0.024	10069	8167	20m.pg152_o2_nofp.cx8a18_1g_bee
q1000.1
q1000.1: range queries with 1000 insert/s per client. Graphs for performance per 1-second interval are here.
Average throughput:
Query response time histogram: each cell has the percentage of responses that take <= the time in the header and max is the max response time in seconds. For max values in the top 25% of the range have a red background and in the bottom 25% of the range have a green background. The red background is not used when the min value is within 80% of the max value.
| dbms | 256us | 1ms | 4ms | 16ms | 64ms | 256ms | 1s | 4s | 16s | gt | max |
|---|---|---|---|---|---|---|---|---|---|---|---|
| pg152_o2_nofp.cx8_1g_bee | 99.725 | 0.223 | 0.043 | 0.008 | nonzero | 0.030 | |||||
| pg152_o2_nofp.cx8a1_1g_bee | 99.724 | 0.224 | 0.043 | 0.008 | nonzero | 0.032 | |||||
| pg152_o2_nofp.cx8a2_1g_bee | 99.738 | 0.210 | 0.044 | 0.008 | nonzero | 0.029 | |||||
| pg152_o2_nofp.cx8a3_1g_bee | 99.744 | 0.204 | 0.044 | 0.008 | nonzero | 0.036 | |||||
| pg152_o2_nofp.cx8a4_1g_bee | 99.745 | 0.204 | 0.043 | 0.008 | nonzero | 0.043 | |||||
| pg152_o2_nofp.cx8a9_1g_bee | 99.647 | 0.296 | 0.048 | 0.008 | nonzero | 0.026 | |||||
| pg152_o2_nofp.cx8a10_1g_bee | 99.725 | 0.222 | 0.045 | 0.008 | nonzero | 0.034 | |||||
| pg152_o2_nofp.cx8a12_1g_bee | 99.736 | 0.212 | 0.044 | 0.008 | nonzero | 0.032 | |||||
| pg152_o2_nofp.cx8a14_1g_bee | 99.728 | 0.220 | 0.044 | 0.008 | nonzero | 0.044 | |||||
| pg152_o2_nofp.cx8a15_1g_bee | 99.737 | 0.210 | 0.044 | 0.008 | nonzero | 0.034 | |||||
| pg152_o2_nofp.cx8a16_1g_bee | 99.801 | 0.154 | 0.039 | 0.006 | nonzero | 0.032 | |||||
| pg152_o2_nofp.cx8a17_1g_bee | 99.445 | 0.471 | 0.074 | 0.009 | nonzero | 0.029 | |||||
| pg152_o2_nofp.cx8a18_1g_bee | 99.781 | 0.172 | 0.041 | 0.007 | nonzero | 0.053 |
Insert response time histogram: each cell has the percentage of responses that take <= the time in the header and max is the max response time in seconds. For max values in the top 25% of the range have a red background and in the bottom 25% of the range have a green background. The red background is not used when the min value is within 80% of the max value.
| dbms | 256us | 1ms | 4ms | 16ms | 64ms | 256ms | 1s | 4s | 16s | gt | max |
|---|---|---|---|---|---|---|---|---|---|---|---|
| pg152_o2_nofp.cx8_1g_bee | 88.828 | 10.865 | 0.307 | 0.039 | |||||||
| pg152_o2_nofp.cx8a1_1g_bee | 86.783 | 12.904 | 0.313 | 0.036 | |||||||
| pg152_o2_nofp.cx8a2_1g_bee | 85.167 | 14.556 | 0.277 | 0.031 | |||||||
| pg152_o2_nofp.cx8a3_1g_bee | 86.235 | 13.441 | 0.324 | 0.040 | |||||||
| pg152_o2_nofp.cx8a4_1g_bee | 88.053 | 11.621 | 0.326 | 0.036 | |||||||
| pg152_o2_nofp.cx8a9_1g_bee | 90.948 | 8.808 | 0.244 | 0.038 | |||||||
| pg152_o2_nofp.cx8a10_1g_bee | 86.786 | 12.892 | 0.322 | 0.058 | |||||||
| pg152_o2_nofp.cx8a12_1g_bee | 87.480 | 12.201 | 0.319 | 0.038 | |||||||
| pg152_o2_nofp.cx8a14_1g_bee | 86.724 | 12.999 | 0.277 | 0.034 | |||||||
| pg152_o2_nofp.cx8a15_1g_bee | 85.547 | 14.097 | 0.356 | 0.038 | |||||||
| pg152_o2_nofp.cx8a16_1g_bee | 89.277 | 10.459 | 0.264 | 0.036 | |||||||
| pg152_o2_nofp.cx8a17_1g_bee | 78.040 | 21.702 | 0.258 | 0.049 | |||||||
| pg152_o2_nofp.cx8a18_1g_bee | 85.921 | 13.781 | 0.299 | 0.063 |
Delete response time histogram: each cell has the percentage of responses that take <= the time in the header and max is the max response time in seconds. For max values in the top 25% of the range have a red background and in the bottom 25% of the range have a green background. The red background is not used when the min value is within 80% of the max value.
| dbms | 256us | 1ms | 4ms | 16ms | 64ms | 256ms | 1s | 4s | 16s | gt | max |
|---|---|---|---|---|---|---|---|---|---|---|---|
| pg152_o2_nofp.cx8_1g_bee | 19.941 | 58.582 | 6.849 | 14.347 | 0.281 | 0.047 | |||||
| pg152_o2_nofp.cx8a1_1g_bee | 15.552 | 62.694 | 7.363 | 14.128 | 0.263 | 0.049 | |||||
| pg152_o2_nofp.cx8a2_1g_bee | 20.637 | 59.109 | 7.406 | 12.608 | 0.240 | 0.039 | |||||
| pg152_o2_nofp.cx8a3_1g_bee | 21.078 | 57.172 | 7.174 | 14.186 | 0.388 | 0.001 | 0.065 | ||||
| pg152_o2_nofp.cx8a4_1g_bee | 21.201 | 57.100 | 6.283 | 14.988 | 0.428 | 0.063 | |||||
| pg152_o2_nofp.cx8a9_1g_bee | 20.466 | 57.961 | 6.865 | 14.463 | 0.245 | 0.051 | |||||
| pg152_o2_nofp.cx8a10_1g_bee | 20.841 | 57.846 | 6.763 | 14.124 | 0.426 | 0.001 | 0.070 | ||||
| pg152_o2_nofp.cx8a12_1g_bee | 20.015 | 58.060 | 6.370 | 15.135 | 0.419 | 0.001 | 0.086 | ||||
| pg152_o2_nofp.cx8a14_1g_bee | 20.222 | 60.015 | 7.141 | 12.387 | 0.236 | 0.040 | |||||
| pg152_o2_nofp.cx8a15_1g_bee | 20.228 | 58.172 | 6.241 | 14.651 | 0.708 | 0.062 | |||||
| pg152_o2_nofp.cx8a16_1g_bee | 21.285 | 57.115 | 17.522 | 3.980 | 0.099 | 0.037 | |||||
| pg152_o2_nofp.cx8a17_1g_bee | 18.120 | 61.143 | 7.019 | 13.497 | 0.222 | 0.061 | |||||
| pg152_o2_nofp.cx8a18_1g_bee | 16.233 | 62.981 | 15.975 | 4.708 | 0.104 | 0.037 |
Performance metrics for the DBMS listed above. Some are normalized by throughput, others are not. Legend for results is here.
ips	qps	rps	rmbps	wps	wmbps	rpq	rkbpq	wpi	wkbpi	csps	cpups	cspq	cpupq	dbgb1	dbgb2	rss	maxop	p50	p99	tag
3989	36659	2	0.0	14563.5	118.9	0.000	0.000	3.651	30.529	134782	55.3	3.677	121	6.2	44.1	0.0	0.030	9238	7352	20m.pg152_o2_nofp.cx8_1g_bee
3989	36793	1	0.0	14570.1	118.2	0.000	0.000	3.653	30.341	135322	55.4	3.678	120	6.2	44.4	0.0	0.032	9286	7471	20m.pg152_o2_nofp.cx8a1_1g_bee
3989	36950	1	0.0	14576.9	119.4	0.000	0.000	3.654	30.641	135976	55.4	3.680	120	6.1	44.1	0.0	0.029	9302	7370	20m.pg152_o2_nofp.cx8a2_1g_bee
3989	36719	0	0.0	14574.6	118.2	0.000	0.000	3.654	30.346	134988	55.4	3.676	121	6.2	45.1	0.0	0.036	9270	7432	20m.pg152_o2_nofp.cx8a3_1g_bee
3989	37214	2	0.0	14592.8	119.5	0.000	0.000	3.658	30.685	136819	55.4	3.677	119	6.2	44.1	0.0	0.043	9477	7467	20m.pg152_o2_nofp.cx8a4_1g_bee
3989	36231	1	0.0	14587.7	120.7	0.000	0.000	3.657	30.973	133522	55.3	3.685	122	6.2	35.7	0.0	0.026	9206	7144	20m.pg152_o2_nofp.cx8a9_1g_bee
3989	36560	2	0.0	14611.9	119.8	0.000	0.000	3.663	30.745	134471	55.4	3.678	121	6.3	44.3	0.0	0.034	9305	7544	20m.pg152_o2_nofp.cx8a10_1g_bee
3989	36878	1	0.0	14575.4	119.2	0.000	0.000	3.654	30.598	135282	55.6	3.668	121	6.2	44.1	0.0	0.032	9318	7435	20m.pg152_o2_nofp.cx8a12_1g_bee
3989	36506	1	0.0	14553.6	119.3	0.000	0.000	3.649	30.621	134360	55.4	3.681	121	6.2	44.1	0.0	0.044	9222	7400	20m.pg152_o2_nofp.cx8a14_1g_bee
3987	37126	2	0.0	14600.4	119.3	0.000	0.000	3.662	30.632	136684	55.4	3.682	119	6.2	16.2	0.0	0.034	9386	7352	20m.pg152_o2_nofp.cx8a15_1g_bee
3989	37947	0	0.0	14597.5	121.4	0.000	0.000	3.660	31.155	139916	55.2	3.687	116	5.8	43.8	0.2	0.032	9545	7927	20m.pg152_o2_nofp.cx8a16_1g_bee
3989	34392	0	0.0	8888.9	97.2	0.000	0.000	2.228	24.951	128693	53.8	3.742	125	6.1	44.0	0.0	0.029	8679	7128	20m.pg152_o2_nofp.cx8a17_1g_bee
3989	37786	0	0.0	14606.4	121.6	0.000	0.000	3.662	31.226	139587	55.1	3.694	117	5.8	44.2	0.6	0.053	9558	7783	20m.pg152_o2_nofp.cx8a18_1g_bee
l.i0
l.i0: load without secondary indexes
Performance metrics for all DBMS, not just the ones listed above. Some are normalized by throughput, others are not. Legend for results is here.
ips	qps	rps	rmbps	wps	wmbps	rpq	rkbpq	wpi	wkbpi	csps	cpups	cspq	cpupq	dbgb1	dbgb2	rss	maxop	p50	p99	tag
238095	0	0	0.0	716.5	113.5	0.000	0.000	0.003	0.488	23377	72.3	0.098	24	1.9	5.2	1.0	0.021	70722	43766	20m.pg152_o2_nofp.cx8_1g_bee
232558	0	0	0.0	730.3	110.1	0.000	0.000	0.003	0.485	22849	71.0	0.098	24	1.9	5.2	0.0	0.013	69350	40956	20m.pg152_o2_nofp.cx8a1_1g_bee
238095	0	0	0.0	718.3	114.1	0.000	0.000	0.003	0.491	23500	72.0	0.099	24	1.9	5.2	1.0	0.012	71028	2298	20m.pg152_o2_nofp.cx8a2_1g_bee
235294	0	0	0.0	726.2	109.6	0.000	0.000	0.003	0.477	22913	70.7	0.097	24	1.9	5.2	0.9	0.013	69625	16082	20m.pg152_o2_nofp.cx8a3_1g_bee
238095	0	0	0.0	719.4	114.3	0.000	0.000	0.003	0.492	23608	72.2	0.099	24	1.9	5.2	1.0	0.011	71089	9689	20m.pg152_o2_nofp.cx8a4_1g_bee
238095	0	0	0.0	712.7	113.4	0.000	0.000	0.003	0.488	23249	71.9	0.098	24	1.9	5.2	1.0	0.013	70233	49446	20m.pg152_o2_nofp.cx8a9_1g_bee
238095	0	0	0.0	691.3	114.4	0.000	0.000	0.003	0.492	23577	72.4	0.099	24	1.9	5.2	0.0	0.011	70723	61658	20m.pg152_o2_nofp.cx8a10_1g_bee
238095	0	0	0.0	604.2	112.7	0.000	0.000	0.003	0.485	22882	72.1	0.096	24	1.9	5.2	0.0	0.014	70223	40756	20m.pg152_o2_nofp.cx8a12_1g_bee
235294	0	0	0.0	715.3	113.5	0.000	0.000	0.003	0.494	23286	71.9	0.099	24	1.9	5.2	1.0	0.011	70423	31178	20m.pg152_o2_nofp.cx8a14_1g_bee
235294	0	0	0.0	714.4	113.5	0.000	0.000	0.003	0.494	23316	72.3	0.099	25	1.9	5.2	0.0	0.011	70223	52243	20m.pg152_o2_nofp.cx8a15_1g_bee
240964	0	0	0.0	710.7	114.3	0.000	0.000	0.003	0.486	21900	72.2	0.091	24	1.9	5.2	1.0	0.012	71023	62452	20m.pg152_o2_nofp.cx8a16_1g_bee
238095	0	0	0.0	720.5	113.6	0.000	0.000	0.003	0.489	23384	71.9	0.098	24	1.9	5.2	0.0	0.011	70823	28569	20m.pg152_o2_nofp.cx8a17_1g_bee
235294	0	0	0.0	698.4	113.6	0.000	0.000	0.003	0.494	23489	72.2	0.100	25	1.9	5.2	0.0	0.011	70624	28569	20m.pg152_o2_nofp.cx8a18_1g_bee
l.x
l.x: create secondary indexes
Performance metrics for all DBMS, not just the ones listed above. Some are normalized by throughput, others are not. Legend for results is here.
ips	qps	rps	rmbps	wps	wmbps	rpq	rkbpq	wpi	wkbpi	csps	cpups	cspq	cpupq	dbgb1	dbgb2	rss	maxop	p50	p99	tag
773077	0	0	0.0	651.0	207.2	0.000	0.000	0.001	0.275	2244	37.3	0.003	4	3.7	8.6	0.0	0.003	NA	NA	20m.pg152_o2_nofp.cx8_1g_bee
804000	0	0	0.0	550.6	166.2	0.000	0.000	0.001	0.212	2081	38.3	0.003	4	3.7	8.0	0.0	0.003	NA	NA	20m.pg152_o2_nofp.cx8a1_1g_bee
804000	0	0	0.0	643.7	207.4	0.000	0.000	0.001	0.264	2461	37.7	0.003	4	3.7	8.6	0.0	0.003	NA	NA	20m.pg152_o2_nofp.cx8a2_1g_bee
773077	0	0	0.0	651.2	208.1	0.000	0.000	0.001	0.276	2390	37.8	0.003	4	3.7	8.6	0.0	0.004	NA	NA	20m.pg152_o2_nofp.cx8a3_1g_bee
804000	0	0	0.0	643.6	207.7	0.000	0.000	0.001	0.265	2365	37.2	0.003	4	3.7	8.6	0.0	0.003	NA	NA	20m.pg152_o2_nofp.cx8a4_1g_bee
804000	0	0	0.0	664.1	208.1	0.000	0.000	0.001	0.265	2043	37.7	0.003	4	3.7	8.6	0.0	0.003	NA	NA	20m.pg152_o2_nofp.cx8a9_1g_bee
804000	0	0	0.0	565.7	205.8	0.000	0.000	0.001	0.262	2082	37.7	0.003	4	3.7	8.6	0.0	0.003	NA	NA	20m.pg152_o2_nofp.cx8a10_1g_bee
804000	0	0	0.0	616.4	216.3	0.000	0.000	0.001	0.275	2509	37.3	0.003	4	3.7	8.6	0.0	0.004	NA	NA	20m.pg152_o2_nofp.cx8a12_1g_bee
804000	0	0	0.0	653.1	208.5	0.000	0.000	0.001	0.266	2112	37.7	0.003	4	3.7	8.6	0.0	0.003	NA	NA	20m.pg152_o2_nofp.cx8a14_1g_bee
804000	0	0	0.0	649.6	206.0	0.000	0.000	0.001	0.262	2436	37.8	0.003	4	3.7	8.6	0.0	0.003	NA	NA	20m.pg152_o2_nofp.cx8a15_1g_bee
804000	0	0	0.0	671.1	216.5	0.000	0.000	0.001	0.276	3203	37.7	0.004	4	3.7	8.6	0.0	0.003	NA	NA	20m.pg152_o2_nofp.cx8a16_1g_bee
773077	0	0	0.0	642.8	204.6	0.000	0.000	0.001	0.271	2183	37.0	0.003	4	3.7	8.6	0.0	0.003	NA	NA	20m.pg152_o2_nofp.cx8a17_1g_bee
837500	0	0	0.0	483.3	123.3	0.000	0.000	0.001	0.151	1596	42.0	0.002	4	3.7	8.0	0.0	0.003	NA	NA	20m.pg152_o2_nofp.cx8a18_1g_bee
l.i1
l.i1: continue load after secondary indexes created
Performance metrics for all DBMS, not just the ones listed above. Some are normalized by throughput, others are not. Legend for results is here.
ips	qps	rps	rmbps	wps	wmbps	rpq	rkbpq	wpi	wkbpi	csps	cpups	cspq	cpupq	dbgb1	dbgb2	rss	maxop	p50	p99	tag
53333	0	12	0.1	47874.1	799.7	0.000	0.002	0.898	15.354	28583	70.5	0.536	106	6.2	46.3	0.9	0.157	14588	4195	20m.pg152_o2_nofp.cx8_1g_bee
53348	0	11	0.1	48398.6	802.7	0.000	0.001	0.907	15.408	28582	70.1	0.536	105	6.3	46.3	0.0	0.207	14534	4145	20m.pg152_o2_nofp.cx8a1_1g_bee
46458	0	6	0.1	98923.1	832.2	0.000	0.001	2.129	18.342	24424	68.3	0.526	118	6.2	46.2	0.0	0.117	12536	4545	20m.pg152_o2_nofp.cx8a2_1g_bee
53255	0	7	0.1	48330.7	797.3	0.000	0.001	0.908	15.330	28244	70.6	0.530	106	6.2	46.3	1.0	0.186	14634	4145	20m.pg152_o2_nofp.cx8a3_1g_bee
53576	0	14	0.1	48086.9	804.6	0.000	0.002	0.898	15.378	28704	70.2	0.536	105	6.2	46.3	0.0	0.178	14634	4197	20m.pg152_o2_nofp.cx8a4_1g_bee
53050	0	16	0.1	48061.0	800.0	0.000	0.002	0.906	15.442	28285	70.6	0.533	106	6.2	46.3	0.0	0.149	14631	4147	20m.pg152_o2_nofp.cx8a9_1g_bee
53213	0	21	0.1	48362.1	805.3	0.000	0.002	0.909	15.496	28685	69.9	0.539	105	6.3	46.4	0.0	0.190	14534	4097	20m.pg152_o2_nofp.cx8a10_1g_bee
53569	0	16	0.1	48463.1	807.5	0.000	0.002	0.905	15.436	28808	70.2	0.538	105	6.3	46.3	0.0	0.491	14584	4190	20m.pg152_o2_nofp.cx8a12_1g_bee
47192	0	7	0.1	97710.4	825.7	0.000	0.001	2.070	17.917	24879	68.5	0.527	116	6.2	46.2	0.2	0.123	12735	4597	20m.pg152_o2_nofp.cx8a14_1g_bee
53086	0	108	0.6	48407.5	818.2	0.002	0.012	0.912	15.783	28505	69.6	0.537	105	6.3	16.3	0.0	0.136	14334	4195	20m.pg152_o2_nofp.cx8a15_1g_bee
54281	0	8	0.0	47893.0	829.1	0.000	0.001	0.882	15.642	29642	71.3	0.546	105	5.9	46.0	1.0	0.185	14385	5993	20m.pg152_o2_nofp.cx8a16_1g_bee
53213	0	11	0.1	41626.8	805.9	0.000	0.002	0.782	15.508	28339	69.7	0.533	105	6.2	46.3	0.0	0.144	14634	4195	20m.pg152_o2_nofp.cx8a17_1g_bee
54533	0	5	0.0	48097.3	829.0	0.000	0.000	0.882	15.567	29703	71.2	0.545	104	5.9	45.9	0.5	0.426	14434	5993	20m.pg152_o2_nofp.cx8a18_1g_bee
q100.1
q100.1: range queries with 100 insert/s per client
Performance metrics for all DBMS, not just the ones listed above. Some are normalized by throughput, others are not. Legend for results is here.
ips	qps	rps	rmbps	wps	wmbps	rpq	rkbpq	wpi	wkbpi	csps	cpups	cspq	cpupq	dbgb1	dbgb2	rss	maxop	p50	p99	tag
399	41226	1	0.0	1745.1	14.9	0.000	0.000	4.376	38.286	157142	50.4	3.812	98	6.2	46.3	0.0	0.011	10437	8551	20m.pg152_o2_nofp.cx8_1g_bee
399	41096	0	0.0	1704.8	14.5	0.000	0.000	4.277	37.153	156799	50.4	3.815	98	6.3	46.3	0.0	0.011	10485	8266	20m.pg152_o2_nofp.cx8a1_1g_bee
399	41418	0	0.0	1693.8	14.1	0.000	0.000	4.247	36.091	157944	50.5	3.813	98	6.2	46.2	0.0	0.012	10564	8647	20m.pg152_o2_nofp.cx8a2_1g_bee
399	40997	0	0.0	1782.2	14.6	0.000	0.000	4.469	37.561	156264	50.5	3.812	99	6.2	46.3	0.0	0.010	10389	8455	20m.pg152_o2_nofp.cx8a3_1g_bee
399	41596	0	0.0	1719.9	14.4	0.000	0.000	4.313	36.931	158615	50.4	3.813	97	6.2	46.3	0.0	0.011	10580	8746	20m.pg152_o2_nofp.cx8a4_1g_bee
399	40998	0	0.0	1752.7	15.4	0.000	0.000	4.395	39.661	156407	50.4	3.815	98	6.2	46.3	0.0	0.013	10420	8407	20m.pg152_o2_nofp.cx8a9_1g_bee
399	41040	0	0.0	1726.1	14.8	0.000	0.000	4.328	37.915	156523	50.4	3.814	98	6.3	46.4	0.0	0.010	10437	8551	20m.pg152_o2_nofp.cx8a10_1g_bee
399	41898	0	0.0	1704.7	14.8	0.000	0.000	4.274	37.978	159790	50.5	3.814	96	6.3	46.3	0.0	0.014	10664	9050	20m.pg152_o2_nofp.cx8a12_1g_bee
399	40604	0	0.0	1699.7	14.1	0.000	0.000	4.262	36.128	154800	50.5	3.812	99	6.2	46.2	0.0	0.012	10296	8407	20m.pg152_o2_nofp.cx8a14_1g_bee
399	41874	1	0.0	1700.2	14.5	0.000	0.000	4.263	37.195	159673	50.4	3.813	96	6.3	16.3	0.0	0.011	10724	9030	20m.pg152_o2_nofp.cx8a15_1g_bee
399	41526	0	0.0	1701.4	14.2	0.000	0.000	4.266	36.533	158365	50.5	3.814	97	5.9	45.9	0.0	0.010	10453	8426	20m.pg152_o2_nofp.cx8a16_1g_bee
399	40496	0	0.0	1679.3	14.2	0.000	0.000	4.213	36.513	154499	50.4	3.815	100	6.2	46.2	0.0	0.008	10341	8491	20m.pg152_o2_nofp.cx8a17_1g_bee
399	41699	0	0.0	1700.8	14.0	0.000	0.000	4.265	36.023	159030	50.5	3.814	97	5.9	45.9	0.0	0.011	10568	8743	20m.pg152_o2_nofp.cx8a18_1g_bee
q500.1
q500.1: range queries with 500 insert/s per client
Performance metrics for all DBMS, not just the ones listed above. Some are normalized by throughput, others are not. Legend for results is here.
ips	qps	rps	rmbps	wps	wmbps	rpq	rkbpq	wpi	wkbpi	csps	cpups	cspq	cpupq	dbgb1	dbgb2	rss	maxop	p50	p99	tag
1993	38511	14	0.1	7737.0	62.7	0.000	0.002	3.881	32.234	145113	52.6	3.768	109	6.2	46.3	0.0	0.022	9749	7831	20m.pg152_o2_nofp.cx8_1g_bee
1993	38393	3	0.0	7753.3	62.5	0.000	0.000	3.890	32.100	144604	52.5	3.766	109	6.3	46.3	0.0	0.020	9734	7690	20m.pg152_o2_nofp.cx8a1_1g_bee
1994	38689	1	0.0	7751.6	63.2	0.000	0.000	3.887	32.473	145717	52.5	3.766	109	6.2	46.2	0.0	0.023	9797	7863	20m.pg152_o2_nofp.cx8a2_1g_bee
1994	38476	0	0.0	7748.3	62.0	0.000	0.000	3.885	31.834	144828	52.6	3.764	109	6.2	46.3	0.0	0.022	9749	7879	20m.pg152_o2_nofp.cx8a3_1g_bee
1994	38777	8	0.0	7749.2	62.9	0.000	0.001	3.885	32.288	146033	52.6	3.766	109	6.2	46.3	0.0	0.024	9797	7755	20m.pg152_o2_nofp.cx8a4_1g_bee
1994	37920	1	0.0	7751.7	64.4	0.000	0.000	3.887	33.069	143070	52.4	3.773	111	6.2	42.1	0.0	0.019	9577	7704	20m.pg152_o2_nofp.cx8a9_1g_bee
1994	38478	8	0.0	7759.9	63.0	0.000	0.001	3.891	32.340	144932	52.5	3.767	109	6.3	46.4	0.0	0.019	9813	7927	20m.pg152_o2_nofp.cx8a10_1g_bee
1993	38830	1	0.0	7777.4	63.9	0.000	0.000	3.902	32.832	146227	52.6	3.766	108	6.3	46.3	0.0	0.023	9829	7879	20m.pg152_o2_nofp.cx8a12_1g_bee
1994	38144	0	0.0	7723.8	62.6	0.000	0.000	3.873	32.161	143699	52.6	3.767	110	6.2	46.2	0.0	0.021	9621	7719	20m.pg152_o2_nofp.cx8a14_1g_bee
1993	39039	14	0.1	7766.9	63.5	0.000	0.002	3.897	32.640	147143	52.5	3.769	108	6.3	16.3	0.0	0.021	9961	7882	20m.pg152_o2_nofp.cx8a15_1g_bee
1993	39801	0	0.0	7870.9	66.6	0.000	0.000	3.949	34.236	150214	52.4	3.774	105	5.9	45.9	0.0	0.023	10101	8231	20m.pg152_o2_nofp.cx8a16_1g_bee
1994	37264	1	0.0	6727.8	59.2	0.000	0.000	3.373	30.399	140677	52.2	3.775	112	6.2	46.2	0.0	0.027	9461	7672	20m.pg152_o2_nofp.cx8a17_1g_bee
1994	39658	0	0.0	7878.1	66.7	0.000	0.000	3.950	34.254	149619	52.4	3.773	106	5.9	45.9	0.0	0.024	10069	8167	20m.pg152_o2_nofp.cx8a18_1g_bee
q1000.1
q1000.1: range queries with 1000 insert/s per client
Performance metrics for all DBMS, not just the ones listed above. Some are normalized by throughput, others are not. Legend for results is here.
ips	qps	rps	rmbps	wps	wmbps	rpq	rkbpq	wpi	wkbpi	csps	cpups	cspq	cpupq	dbgb1	dbgb2	rss	maxop	p50	p99	tag
3989	36659	2	0.0	14563.5	118.9	0.000	0.000	3.651	30.529	134782	55.3	3.677	121	6.2	44.1	0.0	0.030	9238	7352	20m.pg152_o2_nofp.cx8_1g_bee
3989	36793	1	0.0	14570.1	118.2	0.000	0.000	3.653	30.341	135322	55.4	3.678	120	6.2	44.4	0.0	0.032	9286	7471	20m.pg152_o2_nofp.cx8a1_1g_bee
3989	36950	1	0.0	14576.9	119.4	0.000	0.000	3.654	30.641	135976	55.4	3.680	120	6.1	44.1	0.0	0.029	9302	7370	20m.pg152_o2_nofp.cx8a2_1g_bee
3989	36719	0	0.0	14574.6	118.2	0.000	0.000	3.654	30.346	134988	55.4	3.676	121	6.2	45.1	0.0	0.036	9270	7432	20m.pg152_o2_nofp.cx8a3_1g_bee
3989	37214	2	0.0	14592.8	119.5	0.000	0.000	3.658	30.685	136819	55.4	3.677	119	6.2	44.1	0.0	0.043	9477	7467	20m.pg152_o2_nofp.cx8a4_1g_bee
3989	36231	1	0.0	14587.7	120.7	0.000	0.000	3.657	30.973	133522	55.3	3.685	122	6.2	35.7	0.0	0.026	9206	7144	20m.pg152_o2_nofp.cx8a9_1g_bee
3989	36560	2	0.0	14611.9	119.8	0.000	0.000	3.663	30.745	134471	55.4	3.678	121	6.3	44.3	0.0	0.034	9305	7544	20m.pg152_o2_nofp.cx8a10_1g_bee
3989	36878	1	0.0	14575.4	119.2	0.000	0.000	3.654	30.598	135282	55.6	3.668	121	6.2	44.1	0.0	0.032	9318	7435	20m.pg152_o2_nofp.cx8a12_1g_bee
3989	36506	1	0.0	14553.6	119.3	0.000	0.000	3.649	30.621	134360	55.4	3.681	121	6.2	44.1	0.0	0.044	9222	7400	20m.pg152_o2_nofp.cx8a14_1g_bee
3987	37126	2	0.0	14600.4	119.3	0.000	0.000	3.662	30.632	136684	55.4	3.682	119	6.2	16.2	0.0	0.034	9386	7352	20m.pg152_o2_nofp.cx8a15_1g_bee
3989	37947	0	0.0	14597.5	121.4	0.000	0.000	3.660	31.155	139916	55.2	3.687	116	5.8	43.8	0.2	0.032	9545	7927	20m.pg152_o2_nofp.cx8a16_1g_bee
3989	34392	0	0.0	8888.9	97.2	0.000	0.000	2.228	24.951	128693	53.8	3.742	125	6.1	44.0	0.0	0.029	8679	7128	20m.pg152_o2_nofp.cx8a17_1g_bee
3989	37786	0	0.0	14606.4	121.6	0.000	0.000	3.662	31.226	139587	55.1	3.694	117	5.8	44.2	0.6	0.053	9558	7783	20m.pg152_o2_nofp.cx8a18_1g_bee
l.i0
- l.i0: load without secondary indexes
- Legend for results is here.
- Each entry lists the percentage of responses that fit in that bucket (slower than max time for previous bucket, faster than min time for next bucket).
Insert response time histogram
256us	1ms	4ms	16ms	64ms	256ms	1s	4s	16s	gt	max	tag
0.000	0.000	99.926	0.073	0.001	0.000	0.000	0.000	0.000	0.000	0.021	pg152_o2_nofp.cx8_1g_bee
0.000	0.000	99.912	0.089	0.000	0.000	0.000	0.000	0.000	0.000	0.013	pg152_o2_nofp.cx8a1_1g_bee
0.000	0.000	99.925	0.075	0.000	0.000	0.000	0.000	0.000	0.000	0.012	pg152_o2_nofp.cx8a2_1g_bee
0.000	0.000	99.919	0.081	0.000	0.000	0.000	0.000	0.000	0.000	0.013	pg152_o2_nofp.cx8a3_1g_bee
0.000	0.000	99.906	0.093	0.000	0.000	0.000	0.000	0.000	0.000	0.011	pg152_o2_nofp.cx8a4_1g_bee
0.000	0.000	99.918	0.082	0.000	0.000	0.000	0.000	0.000	0.000	0.013	pg152_o2_nofp.cx8a9_1g_bee
0.000	0.000	99.918	0.082	0.000	0.000	0.000	0.000	0.000	0.000	0.011	pg152_o2_nofp.cx8a10_1g_bee
0.000	0.000	99.912	0.088	0.000	0.000	0.000	0.000	0.000	0.000	0.014	pg152_o2_nofp.cx8a12_1g_bee
0.000	0.000	99.922	0.077	0.000	0.000	0.000	0.000	0.000	0.000	0.011	pg152_o2_nofp.cx8a14_1g_bee
0.000	0.000	99.919	0.081	0.000	0.000	0.000	0.000	0.000	0.000	0.011	pg152_o2_nofp.cx8a15_1g_bee
0.000	0.000	99.910	0.089	0.000	0.000	0.000	0.000	0.000	0.000	0.012	pg152_o2_nofp.cx8a16_1g_bee
0.000	0.000	99.928	0.072	0.000	0.000	0.000	0.000	0.000	0.000	0.011	pg152_o2_nofp.cx8a17_1g_bee
0.000	0.000	99.894	0.105	0.000	0.000	0.000	0.000	0.000	0.000	0.011	pg152_o2_nofp.cx8a18_1g_bee
l.x
- l.x: create secondary indexes
- Legend for results is here.
- Each entry lists the percentage of responses that fit in that bucket (slower than max time for previous bucket, faster than min time for next bucket).
TODO - determine whether there is data for create index response time
l.i1
- l.i1: continue load after secondary indexes created
- Legend for results is here.
- Each entry lists the percentage of responses that fit in that bucket (slower than max time for previous bucket, faster than min time for next bucket).
Insert response time histogram
256us	1ms	4ms	16ms	64ms	256ms	1s	4s	16s	gt	max	tag
0.000	0.000	88.344	11.625	0.030	0.001	0.000	0.000	0.000	0.000	0.157	pg152_o2_nofp.cx8_1g_bee
0.000	0.000	88.182	11.794	0.021	0.002	0.000	0.000	0.000	0.000	0.207	pg152_o2_nofp.cx8a1_1g_bee
0.000	0.000	59.906	39.928	0.161	0.005	0.000	0.000	0.000	0.000	0.117	pg152_o2_nofp.cx8a2_1g_bee
0.000	0.000	88.554	11.431	0.015	0.001	0.000	0.000	0.000	0.000	0.186	pg152_o2_nofp.cx8a3_1g_bee
0.000	0.000	88.564	11.400	0.035	0.001	0.000	0.000	0.000	0.000	0.178	pg152_o2_nofp.cx8a4_1g_bee
0.000	0.000	88.425	11.541	0.033	0.002	0.000	0.000	0.000	0.000	0.149	pg152_o2_nofp.cx8a9_1g_bee
0.000	0.000	88.260	11.698	0.036	0.006	0.000	0.000	0.000	0.000	0.190	pg152_o2_nofp.cx8a10_1g_bee
0.000	0.000	88.419	11.556	0.023	0.002	nonzero	0.000	0.000	0.000	0.491	pg152_o2_nofp.cx8a12_1g_bee
0.000	0.000	57.178	42.665	0.152	0.004	0.000	0.000	0.000	0.000	0.123	pg152_o2_nofp.cx8a14_1g_bee
0.000	0.000	87.228	12.625	0.144	0.003	0.000	0.000	0.000	0.000	0.136	pg152_o2_nofp.cx8a15_1g_bee
0.000	0.000	85.806	14.160	0.032	0.002	0.000	0.000	0.000	0.000	0.185	pg152_o2_nofp.cx8a16_1g_bee
0.000	0.000	89.554	10.415	0.029	0.002	0.000	0.000	0.000	0.000	0.144	pg152_o2_nofp.cx8a17_1g_bee
0.000	0.000	86.187	13.796	0.017	0.001	nonzero	0.000	0.000	0.000	0.426	pg152_o2_nofp.cx8a18_1g_bee
Delete response time histogram
256us	1ms	4ms	16ms	64ms	256ms	1s	4s	16s	gt	max	tag
1.838	89.548	2.191	6.366	0.057	nonzero	0.000	0.000	0.000	0.000	0.122	pg152_o2_nofp.cx8_1g_bee
1.806	90.216	2.405	5.413	0.160	nonzero	0.000	0.000	0.000	0.000	0.169	pg152_o2_nofp.cx8a1_1g_bee
0.804	90.538	1.498	7.094	0.065	nonzero	0.000	0.000	0.000	0.000	0.090	pg152_o2_nofp.cx8a2_1g_bee
1.993	89.444	2.083	6.373	0.108	nonzero	0.000	0.000	0.000	0.000	0.075	pg152_o2_nofp.cx8a3_1g_bee
2.005	89.810	2.295	5.811	0.079	nonzero	0.000	0.000	0.000	0.000	0.171	pg152_o2_nofp.cx8a4_1g_bee
2.060	89.375	2.299	6.122	0.143	0.001	0.000	0.000	0.000	0.000	0.146	pg152_o2_nofp.cx8a9_1g_bee
1.968	89.793	2.556	5.533	0.149	0.002	0.000	0.000	0.000	0.000	0.200	pg152_o2_nofp.cx8a10_1g_bee
1.984	89.815	2.468	5.641	0.091	nonzero	nonzero	0.000	0.000	0.000	0.488	pg152_o2_nofp.cx8a12_1g_bee
1.011	90.100	1.461	7.367	0.060	nonzero	0.000	0.000	0.000	0.000	0.125	pg152_o2_nofp.cx8a14_1g_bee
1.811	89.518	3.494	5.083	0.093	0.001	0.000	0.000	0.000	0.000	0.136	pg152_o2_nofp.cx8a15_1g_bee
2.067	89.541	2.592	5.773	0.026	nonzero	0.000	0.000	0.000	0.000	0.124	pg152_o2_nofp.cx8a16_1g_bee
1.771	89.559	2.274	6.336	0.059	nonzero	0.000	0.000	0.000	0.000	0.132	pg152_o2_nofp.cx8a17_1g_bee
1.884	89.822	2.716	5.549	0.029	nonzero	nonzero	0.000	0.000	0.000	0.422	pg152_o2_nofp.cx8a18_1g_bee
q100.1
- q100.1: range queries with 100 insert/s per client
- Legend for results is here.
- Each entry lists the percentage of responses that fit in that bucket (slower than max time for previous bucket, faster than min time for next bucket).
Query response time histogram
256us	1ms	4ms	16ms	64ms	256ms	1s	4s	16s	gt	max	tag
99.970	0.021	0.008	nonzero	0.000	0.000	0.000	0.000	0.000	0.000	0.011	pg152_o2_nofp.cx8_1g_bee
99.966	0.025	0.010	nonzero	0.000	0.000	0.000	0.000	0.000	0.000	0.011	pg152_o2_nofp.cx8a1_1g_bee
99.974	0.017	0.009	nonzero	0.000	0.000	0.000	0.000	0.000	0.000	0.012	pg152_o2_nofp.cx8a2_1g_bee
99.974	0.016	0.009	nonzero	0.000	0.000	0.000	0.000	0.000	0.000	0.010	pg152_o2_nofp.cx8a3_1g_bee
99.973	0.019	0.008	nonzero	0.000	0.000	0.000	0.000	0.000	0.000	0.011	pg152_o2_nofp.cx8a4_1g_bee
99.958	0.030	0.012	nonzero	0.000	0.000	0.000	0.000	0.000	0.000	0.013	pg152_o2_nofp.cx8a9_1g_bee
99.971	0.020	0.009	nonzero	0.000	0.000	0.000	0.000	0.000	0.000	0.010	pg152_o2_nofp.cx8a10_1g_bee
99.974	0.017	0.009	nonzero	0.000	0.000	0.000	0.000	0.000	0.000	0.014	pg152_o2_nofp.cx8a12_1g_bee
99.969	0.021	0.009	nonzero	0.000	0.000	0.000	0.000	0.000	0.000	0.012	pg152_o2_nofp.cx8a14_1g_bee
99.978	0.014	0.008	nonzero	0.000	0.000	0.000	0.000	0.000	0.000	0.011	pg152_o2_nofp.cx8a15_1g_bee
99.975	0.016	0.009	nonzero	0.000	0.000	0.000	0.000	0.000	0.000	0.010	pg152_o2_nofp.cx8a16_1g_bee
99.968	0.022	0.009	nonzero	0.000	0.000	0.000	0.000	0.000	0.000	0.008	pg152_o2_nofp.cx8a17_1g_bee
99.972	0.018	0.009	nonzero	0.000	0.000	0.000	0.000	0.000	0.000	0.011	pg152_o2_nofp.cx8a18_1g_bee
Insert response time histogram
256us	1ms	4ms	16ms	64ms	256ms	1s	4s	16s	gt	max	tag
0.000	0.000	99.507	0.493	0.000	0.000	0.000	0.000	0.000	0.000	0.009	pg152_o2_nofp.cx8_1g_bee
0.000	0.000	99.028	0.972	0.000	0.000	0.000	0.000	0.000	0.000	0.010	pg152_o2_nofp.cx8a1_1g_bee
0.000	0.000	99.792	0.208	0.000	0.000	0.000	0.000	0.000	0.000	0.008	pg152_o2_nofp.cx8a2_1g_bee
0.000	0.000	99.472	0.528	0.000	0.000	0.000	0.000	0.000	0.000	0.010	pg152_o2_nofp.cx8a3_1g_bee
0.000	0.000	99.847	0.153	0.000	0.000	0.000	0.000	0.000	0.000	0.011	pg152_o2_nofp.cx8a4_1g_bee
0.000	0.000	99.549	0.451	0.000	0.000	0.000	0.000	0.000	0.000	0.009	pg152_o2_nofp.cx8a9_1g_bee
0.000	0.000	99.479	0.521	0.000	0.000	0.000	0.000	0.000	0.000	0.009	pg152_o2_nofp.cx8a10_1g_bee
0.000	0.000	99.806	0.194	0.000	0.000	0.000	0.000	0.000	0.000	0.010	pg152_o2_nofp.cx8a12_1g_bee
0.000	0.000	99.812	0.188	0.000	0.000	0.000	0.000	0.000	0.000	0.014	pg152_o2_nofp.cx8a14_1g_bee
0.000	0.000	99.653	0.347	0.000	0.000	0.000	0.000	0.000	0.000	0.011	pg152_o2_nofp.cx8a15_1g_bee
0.000	0.000	99.785	0.215	0.000	0.000	0.000	0.000	0.000	0.000	0.010	pg152_o2_nofp.cx8a16_1g_bee
0.000	0.000	99.375	0.625	0.000	0.000	0.000	0.000	0.000	0.000	0.009	pg152_o2_nofp.cx8a17_1g_bee
0.000	0.000	99.125	0.875	0.000	0.000	0.000	0.000	0.000	0.000	0.010	pg152_o2_nofp.cx8a18_1g_bee
Delete response time histogram
256us	1ms	4ms	16ms	64ms	256ms	1s	4s	16s	gt	max	tag
9.618	71.681	18.174	0.528	0.000	0.000	0.000	0.000	0.000	0.000	0.008	pg152_o2_nofp.cx8_1g_bee
10.014	77.049	12.514	0.424	0.000	0.000	0.000	0.000	0.000	0.000	0.013	pg152_o2_nofp.cx8a1_1g_bee
10.132	68.708	20.972	0.188	0.000	0.000	0.000	0.000	0.000	0.000	0.010	pg152_o2_nofp.cx8a2_1g_bee
13.229	62.493	23.639	0.639	0.000	0.000	0.000	0.000	0.000	0.000	0.007	pg152_o2_nofp.cx8a3_1g_bee
11.431	77.847	10.667	0.056	0.000	0.000	0.000	0.000	0.000	0.000	0.008	pg152_o2_nofp.cx8a4_1g_bee
14.438	65.139	19.965	0.458	0.000	0.000	0.000	0.000	0.000	0.000	0.008	pg152_o2_nofp.cx8a9_1g_bee
11.326	75.312	13.049	0.312	0.000	0.000	0.000	0.000	0.000	0.000	0.008	pg152_o2_nofp.cx8a10_1g_bee
9.708	78.194	12.056	0.042	0.000	0.000	0.000	0.000	0.000	0.000	0.007	pg152_o2_nofp.cx8a12_1g_bee
10.007	62.528	27.236	0.229	0.000	0.000	0.000	0.000	0.000	0.000	0.007	pg152_o2_nofp.cx8a14_1g_bee
10.243	80.667	9.028	0.062	0.000	0.000	0.000	0.000	0.000	0.000	0.006	pg152_o2_nofp.cx8a15_1g_bee
11.042	80.396	8.528	0.035	0.000	0.000	0.000	0.000	0.000	0.000	0.006	pg152_o2_nofp.cx8a16_1g_bee
11.868	75.208	12.535	0.389	0.000	0.000	0.000	0.000	0.000	0.000	0.010	pg152_o2_nofp.cx8a17_1g_bee
9.660	81.688	8.542	0.111	0.000	0.000	0.000	0.000	0.000	0.000	0.008	pg152_o2_nofp.cx8a18_1g_bee
q500.1
- q500.1: range queries with 500 insert/s per client
- Legend for results is here.
- Each entry lists the percentage of responses that fit in that bucket (slower than max time for previous bucket, faster than min time for next bucket).
Query response time histogram
256us	1ms	4ms	16ms	64ms	256ms	1s	4s	16s	gt	max	tag
99.878	0.093	0.024	0.005	nonzero	0.000	0.000	0.000	0.000	0.000	0.022	pg152_o2_nofp.cx8_1g_bee
99.880	0.091	0.025	0.004	nonzero	0.000	0.000	0.000	0.000	0.000	0.020	pg152_o2_nofp.cx8a1_1g_bee
99.887	0.084	0.025	0.005	nonzero	0.000	0.000	0.000	0.000	0.000	0.023	pg152_o2_nofp.cx8a2_1g_bee
99.887	0.084	0.024	0.005	nonzero	0.000	0.000	0.000	0.000	0.000	0.022	pg152_o2_nofp.cx8a3_1g_bee
99.880	0.091	0.024	0.005	nonzero	0.000	0.000	0.000	0.000	0.000	0.024	pg152_o2_nofp.cx8a4_1g_bee
99.841	0.127	0.027	0.005	nonzero	0.000	0.000	0.000	0.000	0.000	0.019	pg152_o2_nofp.cx8a9_1g_bee
99.876	0.095	0.024	0.005	nonzero	0.000	0.000	0.000	0.000	0.000	0.019	pg152_o2_nofp.cx8a10_1g_bee
99.879	0.092	0.024	0.005	nonzero	0.000	0.000	0.000	0.000	0.000	0.023	pg152_o2_nofp.cx8a12_1g_bee
99.880	0.091	0.025	0.005	nonzero	0.000	0.000	0.000	0.000	0.000	0.021	pg152_o2_nofp.cx8a14_1g_bee
99.877	0.095	0.024	0.004	nonzero	0.000	0.000	0.000	0.000	0.000	0.021	pg152_o2_nofp.cx8a15_1g_bee
99.900	0.071	0.026	0.003	nonzero	0.000	0.000	0.000	0.000	0.000	0.023	pg152_o2_nofp.cx8a16_1g_bee
99.849	0.118	0.028	0.005	nonzero	0.000	0.000	0.000	0.000	0.000	0.027	pg152_o2_nofp.cx8a17_1g_bee
99.898	0.073	0.026	0.004	nonzero	0.000	0.000	0.000	0.000	0.000	0.024	pg152_o2_nofp.cx8a18_1g_bee
Insert response time histogram
256us	1ms	4ms	16ms	64ms	256ms	1s	4s	16s	gt	max	tag
0.000	0.000	93.593	6.276	0.131	0.000	0.000	0.000	0.000	0.000	0.039	pg152_o2_nofp.cx8_1g_bee
0.000	0.000	96.074	3.849	0.078	0.000	0.000	0.000	0.000	0.000	0.027	pg152_o2_nofp.cx8a1_1g_bee
0.000	0.000	95.140	4.761	0.099	0.000	0.000	0.000	0.000	0.000	0.026	pg152_o2_nofp.cx8a2_1g_bee
0.000	0.000	94.514	5.381	0.106	0.000	0.000	0.000	0.000	0.000	0.033	pg152_o2_nofp.cx8a3_1g_bee
0.000	0.000	94.364	5.550	0.086	0.000	0.000	0.000	0.000	0.000	0.028	pg152_o2_nofp.cx8a4_1g_bee
0.000	0.000	97.097	2.874	0.029	0.000	0.000	0.000	0.000	0.000	0.022	pg152_o2_nofp.cx8a9_1g_bee
0.000	0.000	95.022	4.903	0.075	0.000	0.000	0.000	0.000	0.000	0.026	pg152_o2_nofp.cx8a10_1g_bee
0.000	0.000	95.506	4.394	0.100	0.000	0.000	0.000	0.000	0.000	0.027	pg152_o2_nofp.cx8a12_1g_bee
0.000	0.000	96.399	3.539	0.062	0.000	0.000	0.000	0.000	0.000	0.028	pg152_o2_nofp.cx8a14_1g_bee
0.000	0.000	97.189	2.769	0.042	0.000	0.000	0.000	0.000	0.000	0.026	pg152_o2_nofp.cx8a15_1g_bee
0.000	0.000	97.194	2.768	0.037	0.000	0.000	0.000	0.000	0.000	0.024	pg152_o2_nofp.cx8a16_1g_bee
0.000	0.000	95.196	4.768	0.036	0.000	0.000	0.000	0.000	0.000	0.024	pg152_o2_nofp.cx8a17_1g_bee
0.000	0.000	96.167	3.769	0.064	0.000	0.000	0.000	0.000	0.000	0.027	pg152_o2_nofp.cx8a18_1g_bee
Delete response time histogram
256us	1ms	4ms	16ms	64ms	256ms	1s	4s	16s	gt	max	tag
34.774	41.744	9.108	14.137	0.236	0.000	0.000	0.000	0.000	0.000	0.034	pg152_o2_nofp.cx8_1g_bee
29.832	49.721	8.354	12.000	0.093	0.000	0.000	0.000	0.000	0.000	0.033	pg152_o2_nofp.cx8a1_1g_bee
37.858	41.136	8.139	12.785	0.082	0.000	0.000	0.000	0.000	0.000	0.031	pg152_o2_nofp.cx8a2_1g_bee
40.347	36.475	9.004	13.953	0.221	0.000	0.000	0.000	0.000	0.000	0.036	pg152_o2_nofp.cx8a3_1g_bee
37.604	39.343	8.575	14.303	0.175	0.000	0.000	0.000	0.000	0.000	0.036	pg152_o2_nofp.cx8a4_1g_bee
40.547	38.297	7.883	13.221	0.051	0.000	0.000	0.000	0.000	0.000	0.035	pg152_o2_nofp.cx8a9_1g_bee
37.317	39.842	8.500	14.217	0.125	0.000	0.000	0.000	0.000	0.000	0.035	pg152_o2_nofp.cx8a10_1g_bee
35.665	41.436	8.154	14.550	0.194	0.000	0.000	0.000	0.000	0.000	0.050	pg152_o2_nofp.cx8a12_1g_bee
39.853	40.318	7.671	12.097	0.061	0.000	0.000	0.000	0.000	0.000	0.034	pg152_o2_nofp.cx8a14_1g_bee
36.092	40.157	9.808	13.700	0.243	0.000	0.000	0.000	0.000	0.000	0.039	pg152_o2_nofp.cx8a15_1g_bee
36.343	45.932	17.363	0.356	0.007	0.000	0.000	0.000	0.000	0.000	0.021	pg152_o2_nofp.cx8a16_1g_bee
36.886	40.410	8.560	14.037	0.107	0.000	0.000	0.000	0.000	0.000	0.035	pg152_o2_nofp.cx8a17_1g_bee
28.738	54.015	16.629	0.614	0.004	0.000	0.000	0.000	0.000	0.000	0.024	pg152_o2_nofp.cx8a18_1g_bee
q1000.1
- q1000.1: range queries with 1000 insert/s per client
- Legend for results is here.
- Each entry lists the percentage of responses that fit in that bucket (slower than max time for previous bucket, faster than min time for next bucket).
Query response time histogram
256us	1ms	4ms	16ms	64ms	256ms	1s	4s	16s	gt	max	tag
99.725	0.223	0.043	0.008	nonzero	0.000	0.000	0.000	0.000	0.000	0.030	pg152_o2_nofp.cx8_1g_bee
99.724	0.224	0.043	0.008	nonzero	0.000	0.000	0.000	0.000	0.000	0.032	pg152_o2_nofp.cx8a1_1g_bee
99.738	0.210	0.044	0.008	nonzero	0.000	0.000	0.000	0.000	0.000	0.029	pg152_o2_nofp.cx8a2_1g_bee
99.744	0.204	0.044	0.008	nonzero	0.000	0.000	0.000	0.000	0.000	0.036	pg152_o2_nofp.cx8a3_1g_bee
99.745	0.204	0.043	0.008	nonzero	0.000	0.000	0.000	0.000	0.000	0.043	pg152_o2_nofp.cx8a4_1g_bee
99.647	0.296	0.048	0.008	nonzero	0.000	0.000	0.000	0.000	0.000	0.026	pg152_o2_nofp.cx8a9_1g_bee
99.725	0.222	0.045	0.008	nonzero	0.000	0.000	0.000	0.000	0.000	0.034	pg152_o2_nofp.cx8a10_1g_bee
99.736	0.212	0.044	0.008	nonzero	0.000	0.000	0.000	0.000	0.000	0.032	pg152_o2_nofp.cx8a12_1g_bee
99.728	0.220	0.044	0.008	nonzero	0.000	0.000	0.000	0.000	0.000	0.044	pg152_o2_nofp.cx8a14_1g_bee
99.737	0.210	0.044	0.008	nonzero	0.000	0.000	0.000	0.000	0.000	0.034	pg152_o2_nofp.cx8a15_1g_bee
99.801	0.154	0.039	0.006	nonzero	0.000	0.000	0.000	0.000	0.000	0.032	pg152_o2_nofp.cx8a16_1g_bee
99.445	0.471	0.074	0.009	nonzero	0.000	0.000	0.000	0.000	0.000	0.029	pg152_o2_nofp.cx8a17_1g_bee
99.781	0.172	0.041	0.007	nonzero	0.000	0.000	0.000	0.000	0.000	0.053	pg152_o2_nofp.cx8a18_1g_bee
Insert response time histogram
256us	1ms	4ms	16ms	64ms	256ms	1s	4s	16s	gt	max	tag
0.000	0.000	88.828	10.865	0.307	0.000	0.000	0.000	0.000	0.000	0.039	pg152_o2_nofp.cx8_1g_bee
0.000	0.000	86.783	12.904	0.313	0.000	0.000	0.000	0.000	0.000	0.036	pg152_o2_nofp.cx8a1_1g_bee
0.000	0.000	85.167	14.556	0.277	0.000	0.000	0.000	0.000	0.000	0.031	pg152_o2_nofp.cx8a2_1g_bee
0.000	0.000	86.235	13.441	0.324	0.000	0.000	0.000	0.000	0.000	0.040	pg152_o2_nofp.cx8a3_1g_bee
0.000	0.000	88.053	11.621	0.326	0.000	0.000	0.000	0.000	0.000	0.036	pg152_o2_nofp.cx8a4_1g_bee
0.000	0.000	90.948	8.808	0.244	0.000	0.000	0.000	0.000	0.000	0.038	pg152_o2_nofp.cx8a9_1g_bee
0.000	0.000	86.786	12.892	0.322	0.000	0.000	0.000	0.000	0.000	0.058	pg152_o2_nofp.cx8a10_1g_bee
0.000	0.000	87.480	12.201	0.319	0.000	0.000	0.000	0.000	0.000	0.038	pg152_o2_nofp.cx8a12_1g_bee
0.000	0.000	86.724	12.999	0.277	0.000	0.000	0.000	0.000	0.000	0.034	pg152_o2_nofp.cx8a14_1g_bee
0.000	0.000	85.547	14.097	0.356	0.000	0.000	0.000	0.000	0.000	0.038	pg152_o2_nofp.cx8a15_1g_bee
0.000	0.000	89.277	10.459	0.264	0.000	0.000	0.000	0.000	0.000	0.036	pg152_o2_nofp.cx8a16_1g_bee
0.000	0.000	78.040	21.702	0.258	0.000	0.000	0.000	0.000	0.000	0.049	pg152_o2_nofp.cx8a17_1g_bee
0.000	0.000	85.921	13.781	0.299	0.000	0.000	0.000	0.000	0.000	0.063	pg152_o2_nofp.cx8a18_1g_bee
Delete response time histogram
256us	1ms	4ms	16ms	64ms	256ms	1s	4s	16s	gt	max	tag
19.941	58.582	6.849	14.347	0.281	0.000	0.000	0.000	0.000	0.000	0.047	pg152_o2_nofp.cx8_1g_bee
15.552	62.694	7.363	14.128	0.263	0.000	0.000	0.000	0.000	0.000	0.049	pg152_o2_nofp.cx8a1_1g_bee
20.637	59.109	7.406	12.608	0.240	0.000	0.000	0.000	0.000	0.000	0.039	pg152_o2_nofp.cx8a2_1g_bee
21.078	57.172	7.174	14.186	0.388	0.001	0.000	0.000	0.000	0.000	0.065	pg152_o2_nofp.cx8a3_1g_bee
21.201	57.100	6.283	14.988	0.428	0.000	0.000	0.000	0.000	0.000	0.063	pg152_o2_nofp.cx8a4_1g_bee
20.466	57.961	6.865	14.463	0.245	0.000	0.000	0.000	0.000	0.000	0.051	pg152_o2_nofp.cx8a9_1g_bee
20.841	57.846	6.763	14.124	0.426	0.001	0.000	0.000	0.000	0.000	0.070	pg152_o2_nofp.cx8a10_1g_bee
20.015	58.060	6.370	15.135	0.419	0.001	0.000	0.000	0.000	0.000	0.086	pg152_o2_nofp.cx8a12_1g_bee
20.222	60.015	7.141	12.387	0.236	0.000	0.000	0.000	0.000	0.000	0.040	pg152_o2_nofp.cx8a14_1g_bee
20.228	58.172	6.241	14.651	0.708	0.000	0.000	0.000	0.000	0.000	0.062	pg152_o2_nofp.cx8a15_1g_bee
21.285	57.115	17.522	3.980	0.099	0.000	0.000	0.000	0.000	0.000	0.037	pg152_o2_nofp.cx8a16_1g_bee
18.120	61.143	7.019	13.497	0.222	0.000	0.000	0.000	0.000	0.000	0.061	pg152_o2_nofp.cx8a17_1g_bee
16.233	62.981	15.975	4.708	0.104	0.000	0.000	0.000	0.000	0.000	0.037	pg152_o2_nofp.cx8a18_1g_bee