Introduction
This is a report for the insert benchmark with 20M docs and 1 client(s). It is generated by scripts (bash, awk, sed) and Tufte might not be impressed. An overview of the insert benchmark is here and a short update is here. Below, by DBMS, I mean DBMS+version.config. An example is my8020.c10b40 where my means MySQL, 8020 is version 8.0.20 and c10b40 is the name for the configuration file.
The test server has 8 AMD cores, 16G RAM and an NVMe SSD. It is described here as the Beelink. The benchmark was run with 1 client and there were 1 or 3 connections per client (1 for queries or inserts without rate limits, 1+1 for rate limited inserts+deletes). It uses 1 table. It loads 20M rows per table without secondary indexes, creates secondary indexes, then inserts 50M rows per table with a delete per insert to avoid growing the table. It then does 3 read+write tests for 1800s each that do queries as fast as possible with 100, 500 and then 1000 inserts/second/client concurrent with the queries and 1000 deletes/second to avoid growing the table. The database is cached by Postgres. Clients and the DBMS share one server. The per-database configs are in the per-database subdirectories here.
The tested DBMS are:
- pg152_o2_nofp.cx8_bee - Postgres 15.2, cx8_bee config, o2_nofp build that used: -O2 -no-omit-frame-pointer
- pg152_o2_nofp.cx8a1_bee - Postgres 15.2, cx8a1_bee config, o2_nofp build that used: -O2 -no-omit-frame-pointer, adds wal_compression=lz4
- pg152_o2_nofp.cx8a2_bee - Postgres 15.2, cx8a2_bee config, o2_nofp build that used: -O2 -no-omit-frame-pointer, adds backend_flush_after=256kb
- pg152_o2_nofp.cx8a3_bee - Postgres 15.2, cx8a3_bee config, o2_nofp build that used: -O2 -no-omit-frame-pointer, adds full_page_writes=off
- pg152_o2_nofp.cx8a4_bee - Postgres 15.2, cx8a4_bee config, o2_nofp build that used: -O2 -no-omit-frame-pointer, adds checkpoint_timeout=1800s which already set in the cx8_bee config
- pg152_o2_nofp.cx8a9_bee - Postgres 15.2, cx8a9_bee config, o2_nofp build that used: -O2 -no-omit-frame-pointer, adds checkpoint_timeout=900s
- pg152_o2_nofp.cx8a10_bee - Postgres 15.2, cx8a10_bee config, o2_nofp build that used: -O2 -no-omit-frame-pointer, adds autovacuum_work_mem=256MB
- pg152_o2_nofp.cx8a12_bee - Postgres 15.2, cx8a12_bee config, o2_nofp build that used: -O2 -no-omit-frame-pointer, adds wal_buffers=64MB
- pg152_o2_nofp.cx8a14_bee - Postgres 15.2, cx8a14_bee config, o2_nofp build that used: -O2 -no-omit-frame-pointer, adds backend_flush_after=1MB
- pg152_o2_nofp.cx8a15_bee - Postgres 15.2, cx8a15_bee config, o2_nofp build that used: -O2 -no-omit-frame-pointer, adds max_wal_size=10G
- pg152_o2_nofp.cx8a16_bee - Postgres 15.2, cx8a16_bee config, o2_nofp build that used: -O2 -no-omit-frame-pointer, adds autovacuum_vacuum_scale_factor=0.05 autovacuum_vacuum_insert_scale_factor=0.05
- pg152_o2_nofp.cx8a17_bee - Postgres 15.2, cx8a17_bee config, o2_nofp build that used: -O2 -no-omit-frame-pointer, reduces bgwriter_lru_maxpages from 2000 to 500
- pg152_o2_nofp.cx8a18_bee - Postgres 15.2, cx8a18_bee config, o2_nofp build that used: -O2 -no-omit-frame-pointer, combines a1, a10, a12, a16
Contents
- Summary
- l.i0: load without secondary indexes
- l.x: create secondary indexes
- l.i1: continue load after secondary indexes created
- q100.1: range queries with 100 insert/s per client
- q500.1: range queries with 500 insert/s per client
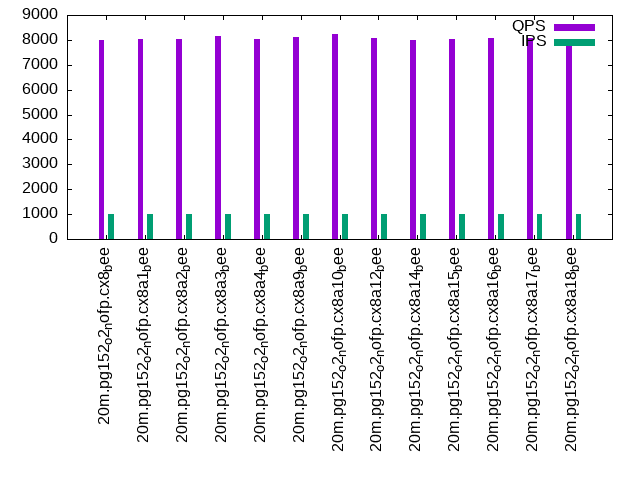
- q1000.1: range queries with 1000 insert/s per client
Summary
The numbers are inserts/s for l.i0 and l.i1, indexed docs (or rows) /s for l.x and queries/s for q*.2. The values are the average rate over the entire test for inserts (IPS) and queries (QPS). The range of values for IPS and QPS is split into 3 parts: bottom 25%, middle 50%, top 25%. Values in the bottom 25% have a red background, values in the top 25% have a green background and values in the middle have no color. A gray background is used for values that can be ignored because the DBMS did not sustain the target insert rate. Red backgrounds are not used when the minimum value is within 80% of the max value.
| dbms | l.i0 | l.x | l.i1 | q100.1 | q500.1 | q1000.1 |
|---|---|---|---|---|---|---|
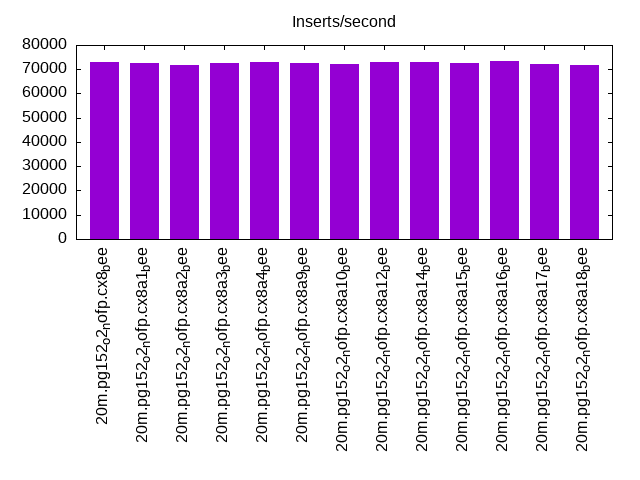
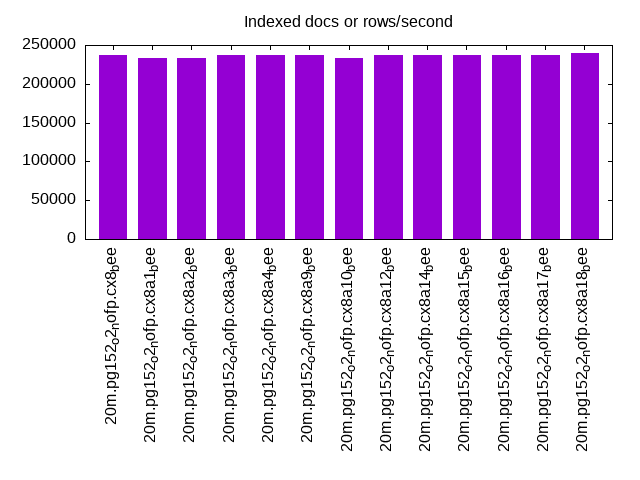
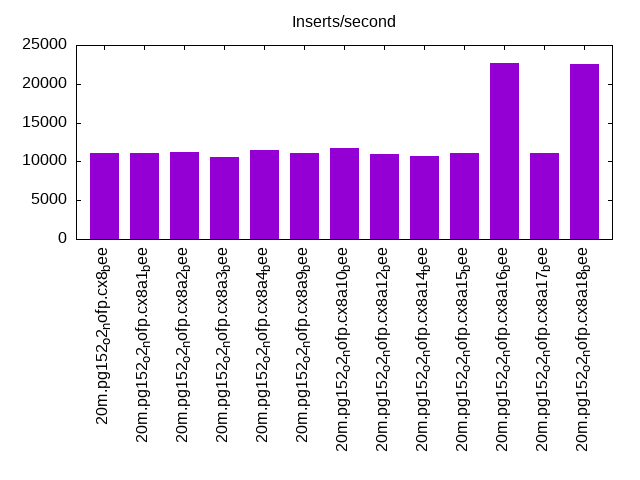
| 20m.pg152_o2_nofp.cx8_bee | 72993 | 236470 | 11030 | 8062 | 8032 | 7981 |
| 20m.pg152_o2_nofp.cx8a1_bee | 72464 | 233721 | 11062 | 8228 | 8162 | 8039 |
| 20m.pg152_o2_nofp.cx8a2_bee | 71942 | 233721 | 11206 | 8097 | 8022 | 8027 |
| 20m.pg152_o2_nofp.cx8a3_bee | 72464 | 236470 | 10616 | 8061 | 8223 | 8153 |
| 20m.pg152_o2_nofp.cx8a4_bee | 72993 | 236470 | 11436 | 8113 | 8169 | 8043 |
| 20m.pg152_o2_nofp.cx8a9_bee | 72727 | 236470 | 11035 | 8300 | 8064 | 8107 |
| 20m.pg152_o2_nofp.cx8a10_bee | 72202 | 233721 | 11669 | 8177 | 8102 | 8217 |
| 20m.pg152_o2_nofp.cx8a12_bee | 72993 | 236470 | 10900 | 8312 | 8177 | 8065 |
| 20m.pg152_o2_nofp.cx8a14_bee | 72993 | 236470 | 10693 | 8068 | 8073 | 7991 |
| 20m.pg152_o2_nofp.cx8a15_bee | 72727 | 236470 | 11091 | 8209 | 8113 | 8039 |
| 20m.pg152_o2_nofp.cx8a16_bee | 73260 | 236470 | 22635 | 8121 | 8098 | 8088 |
| 20m.pg152_o2_nofp.cx8a17_bee | 72202 | 236470 | 11104 | 8151 | 8141 | 8059 |
| 20m.pg152_o2_nofp.cx8a18_bee | 71942 | 239286 | 22512 | 8083 | 8093 | 7934 |
This table has relative throughput, throughput for the DBMS relative to the DBMS in the first line, using the absolute throughput from the previous table.
| dbms | l.i0 | l.x | l.i1 | q100.1 | q500.1 | q1000.1 |
|---|---|---|---|---|---|---|
| 20m.pg152_o2_nofp.cx8_bee | 1.00 | 1.00 | 1.00 | 1.00 | 1.00 | 1.00 |
| 20m.pg152_o2_nofp.cx8a1_bee | 0.99 | 0.99 | 1.00 | 1.02 | 1.02 | 1.01 |
| 20m.pg152_o2_nofp.cx8a2_bee | 0.99 | 0.99 | 1.02 | 1.00 | 1.00 | 1.01 |
| 20m.pg152_o2_nofp.cx8a3_bee | 0.99 | 1.00 | 0.96 | 1.00 | 1.02 | 1.02 |
| 20m.pg152_o2_nofp.cx8a4_bee | 1.00 | 1.00 | 1.04 | 1.01 | 1.02 | 1.01 |
| 20m.pg152_o2_nofp.cx8a9_bee | 1.00 | 1.00 | 1.00 | 1.03 | 1.00 | 1.02 |
| 20m.pg152_o2_nofp.cx8a10_bee | 0.99 | 0.99 | 1.06 | 1.01 | 1.01 | 1.03 |
| 20m.pg152_o2_nofp.cx8a12_bee | 1.00 | 1.00 | 0.99 | 1.03 | 1.02 | 1.01 |
| 20m.pg152_o2_nofp.cx8a14_bee | 1.00 | 1.00 | 0.97 | 1.00 | 1.01 | 1.00 |
| 20m.pg152_o2_nofp.cx8a15_bee | 1.00 | 1.00 | 1.01 | 1.02 | 1.01 | 1.01 |
| 20m.pg152_o2_nofp.cx8a16_bee | 1.00 | 1.00 | 2.05 | 1.01 | 1.01 | 1.01 |
| 20m.pg152_o2_nofp.cx8a17_bee | 0.99 | 1.00 | 1.01 | 1.01 | 1.01 | 1.01 |
| 20m.pg152_o2_nofp.cx8a18_bee | 0.99 | 1.01 | 2.04 | 1.00 | 1.01 | 0.99 |
This lists the average rate of inserts/s for the tests that do inserts concurrent with queries. For such tests the query rate is listed in the table above. The read+write tests are setup so that the insert rate should match the target rate every second. Cells that are not at least 95% of the target have a red background to indicate a failure to satisfy the target.
| dbms | q100.1 | q500.1 | q1000.1 |
|---|---|---|---|
| pg152_o2_nofp.cx8_bee | 100 | 499 | 998 |
| pg152_o2_nofp.cx8a1_bee | 100 | 499 | 998 |
| pg152_o2_nofp.cx8a2_bee | 100 | 499 | 998 |
| pg152_o2_nofp.cx8a3_bee | 100 | 499 | 998 |
| pg152_o2_nofp.cx8a4_bee | 100 | 499 | 998 |
| pg152_o2_nofp.cx8a9_bee | 100 | 499 | 998 |
| pg152_o2_nofp.cx8a10_bee | 100 | 499 | 998 |
| pg152_o2_nofp.cx8a12_bee | 100 | 499 | 998 |
| pg152_o2_nofp.cx8a14_bee | 100 | 499 | 998 |
| pg152_o2_nofp.cx8a15_bee | 100 | 499 | 998 |
| pg152_o2_nofp.cx8a16_bee | 100 | 499 | 998 |
| pg152_o2_nofp.cx8a17_bee | 100 | 499 | 998 |
| pg152_o2_nofp.cx8a18_bee | 100 | 499 | 998 |
| target | 100 | 500 | 1000 |
l.i0
l.i0: load without secondary indexes. Graphs for performance per 1-second interval are here.
Average throughput:
Insert response time histogram: each cell has the percentage of responses that take <= the time in the header and max is the max response time in seconds. For the max column values in the top 25% of the range have a red background and in the bottom 25% of the range have a green background. The red background is not used when the min value is within 80% of the max value.
| dbms | 256us | 1ms | 4ms | 16ms | 64ms | 256ms | 1s | 4s | 16s | gt | max |
|---|---|---|---|---|---|---|---|---|---|---|---|
| pg152_o2_nofp.cx8_bee | 100.000 | 0.003 | |||||||||
| pg152_o2_nofp.cx8a1_bee | 100.000 | 0.003 | |||||||||
| pg152_o2_nofp.cx8a2_bee | 100.000 | 0.003 | |||||||||
| pg152_o2_nofp.cx8a3_bee | 100.000 | 0.003 | |||||||||
| pg152_o2_nofp.cx8a4_bee | 100.000 | 0.003 | |||||||||
| pg152_o2_nofp.cx8a9_bee | 100.000 | 0.003 | |||||||||
| pg152_o2_nofp.cx8a10_bee | 100.000 | 0.004 | |||||||||
| pg152_o2_nofp.cx8a12_bee | 100.000 | 0.003 | |||||||||
| pg152_o2_nofp.cx8a14_bee | 100.000 | 0.004 | |||||||||
| pg152_o2_nofp.cx8a15_bee | 100.000 | 0.003 | |||||||||
| pg152_o2_nofp.cx8a16_bee | 100.000 | 0.003 | |||||||||
| pg152_o2_nofp.cx8a17_bee | 100.000 | 0.003 | |||||||||
| pg152_o2_nofp.cx8a18_bee | 100.000 | 0.003 |
Performance metrics for the DBMS listed above. Some are normalized by throughput, others are not. Legend for results is here.
ips	qps	rps	rmbps	wps	wmbps	rpq	rkbpq	wpi	wkbpi	csps	cpups	cspq	cpupq	dbgb1	dbgb2	rss	maxop	p50	p99	tag
72993	0	0	0.0	83.8	30.9	0.000	0.000	0.001	0.433	8959	23.2	0.123	25	1.9	5.2	0.0	0.003	73117	70213	20m.pg152_o2_nofp.cx8_bee
72464	0	0	0.0	84.2	30.5	0.000	0.000	0.001	0.431	8897	23.3	0.123	26	1.9	5.2	0.0	0.003	72517	70578	20m.pg152_o2_nofp.cx8a1_bee
71942	0	0	0.0	84.1	30.4	0.000	0.000	0.001	0.432	8783	23.1	0.122	26	1.9	5.2	0.0	0.003	72218	69515	20m.pg152_o2_nofp.cx8a2_bee
72464	0	0	0.0	84.4	30.5	0.000	0.000	0.001	0.431	8938	23.4	0.123	26	1.9	5.2	0.0	0.003	72717	70016	20m.pg152_o2_nofp.cx8a3_bee
72993	0	0	0.0	83.7	30.8	0.000	0.000	0.001	0.432	8989	23.4	0.123	26	1.9	5.2	0.0	0.003	73117	70215	20m.pg152_o2_nofp.cx8a4_bee
72727	0	0	0.0	84.4	30.6	0.000	0.000	0.001	0.431	8944	23.0	0.123	25	1.9	5.2	0.0	0.003	72917	70516	20m.pg152_o2_nofp.cx8a9_bee
72202	0	0	0.0	84.2	30.5	0.000	0.000	0.001	0.433	8919	23.1	0.124	26	1.9	5.2	0.0	0.004	72616	69716	20m.pg152_o2_nofp.cx8a10_bee
72993	0	0	0.0	84.1	30.9	0.000	0.000	0.001	0.433	8994	23.4	0.123	26	1.9	5.2	0.0	0.003	73416	70316	20m.pg152_o2_nofp.cx8a12_bee
72993	0	0	0.0	84.2	30.9	0.000	0.000	0.001	0.433	8986	23.1	0.123	25	1.9	5.2	0.0	0.004	73119	70215	20m.pg152_o2_nofp.cx8a14_bee
72727	0	0	0.0	84.3	30.8	0.000	0.000	0.001	0.434	8974	23.2	0.123	26	1.9	5.2	0.0	0.003	73019	70317	20m.pg152_o2_nofp.cx8a15_bee
73260	0	0	0.0	84.1	30.9	0.000	0.000	0.001	0.431	9003	23.1	0.123	25	1.9	5.2	0.0	0.003	73319	70515	20m.pg152_o2_nofp.cx8a16_bee
72202	0	0	0.0	83.0	30.5	0.000	0.000	0.001	0.433	8906	23.2	0.123	26	1.9	5.2	0.0	0.003	72617	69916	20m.pg152_o2_nofp.cx8a17_bee
71942	0	0	0.0	83.1	30.5	0.000	0.000	0.001	0.434	8894	23.1	0.124	26	1.9	5.2	0.0	0.003	72320	69016	20m.pg152_o2_nofp.cx8a18_bee
l.x
l.x: create secondary indexes.
Average throughput:
Performance metrics for the DBMS listed above. Some are normalized by throughput, others are not. Legend for results is here.
ips	qps	rps	rmbps	wps	wmbps	rpq	rkbpq	wpi	wkbpi	csps	cpups	cspq	cpupq	dbgb1	dbgb2	rss	maxop	p50	p99	tag
236470	0	0	0.0	140.4	62.5	0.000	0.000	0.001	0.271	784	12.0	0.003	4	3.7	8.6	0.0	0.003	NA	NA	20m.pg152_o2_nofp.cx8_bee
233721	0	0	0.0	93.9	44.1	0.000	0.000	0.000	0.193	754	12.2	0.003	4	3.7	8.0	0.0	0.003	NA	NA	20m.pg152_o2_nofp.cx8a1_bee
233721	0	0	0.0	127.0	59.9	0.000	0.000	0.001	0.263	709	12.0	0.003	4	3.7	8.6	0.0	0.003	NA	NA	20m.pg152_o2_nofp.cx8a2_bee
236470	0	0	0.0	126.6	59.5	0.000	0.000	0.001	0.258	684	12.0	0.003	4	3.7	8.6	0.0	0.003	NA	NA	20m.pg152_o2_nofp.cx8a3_bee
236470	0	0	0.0	134.4	63.5	0.000	0.000	0.001	0.275	830	11.9	0.004	4	3.7	8.6	0.0	0.003	NA	NA	20m.pg152_o2_nofp.cx8a4_bee
236470	0	0	0.0	123.3	57.7	0.000	0.000	0.001	0.250	777	12.1	0.003	4	3.7	8.6	0.0	0.003	NA	NA	20m.pg152_o2_nofp.cx8a9_bee
233721	0	0	0.0	143.3	67.5	0.000	0.000	0.001	0.296	711	11.8	0.003	4	3.7	8.6	0.0	0.003	NA	NA	20m.pg152_o2_nofp.cx8a10_bee
236470	0	0	0.0	97.1	45.7	0.000	0.000	0.000	0.198	734	12.3	0.003	4	3.7	8.6	0.0	0.003	NA	NA	20m.pg152_o2_nofp.cx8a12_bee
236470	0	0	0.0	128.1	60.3	0.000	0.000	0.001	0.261	755	11.9	0.003	4	3.7	8.6	0.0	0.003	NA	NA	20m.pg152_o2_nofp.cx8a14_bee
236470	0	0	0.0	132.3	62.2	0.000	0.000	0.001	0.269	725	12.0	0.003	4	3.7	8.6	0.0	0.003	NA	NA	20m.pg152_o2_nofp.cx8a15_bee
236470	0	0	0.0	138.2	65.2	0.000	0.000	0.001	0.282	991	12.1	0.004	4	3.7	8.6	0.0	0.003	NA	NA	20m.pg152_o2_nofp.cx8a16_bee
236470	0	0	0.0	145.7	68.7	0.000	0.000	0.001	0.298	754	12.2	0.003	4	3.7	8.6	0.0	0.003	NA	NA	20m.pg152_o2_nofp.cx8a17_bee
239286	0	0	0.0	75.6	35.5	0.000	0.000	0.000	0.152	665	12.8	0.003	4	3.7	8.0	0.0	0.003	NA	NA	20m.pg152_o2_nofp.cx8a18_bee
l.i1
l.i1: continue load after secondary indexes created. Graphs for performance per 1-second interval are here.
Average throughput:
Insert response time histogram: each cell has the percentage of responses that take <= the time in the header and max is the max response time in seconds. For the max column values in the top 25% of the range have a red background and in the bottom 25% of the range have a green background. The red background is not used when the min value is within 80% of the max value.
| dbms | 256us | 1ms | 4ms | 16ms | 64ms | 256ms | 1s | 4s | 16s | gt | max |
|---|---|---|---|---|---|---|---|---|---|---|---|
| pg152_o2_nofp.cx8_bee | 99.996 | 0.004 | 0.013 | ||||||||
| pg152_o2_nofp.cx8a1_bee | 99.975 | 0.025 | 0.010 | ||||||||
| pg152_o2_nofp.cx8a2_bee | 99.997 | 0.002 | nonzero | 0.021 | |||||||
| pg152_o2_nofp.cx8a3_bee | 99.998 | 0.002 | nonzero | 0.023 | |||||||
| pg152_o2_nofp.cx8a4_bee | 99.997 | 0.002 | 0.001 | 0.030 | |||||||
| pg152_o2_nofp.cx8a9_bee | 99.999 | 0.002 | 0.007 | ||||||||
| pg152_o2_nofp.cx8a10_bee | 99.995 | 0.004 | 0.001 | 0.048 | |||||||
| pg152_o2_nofp.cx8a12_bee | 99.998 | 0.002 | nonzero | 0.020 | |||||||
| pg152_o2_nofp.cx8a14_bee | 99.996 | 0.003 | nonzero | 0.022 | |||||||
| pg152_o2_nofp.cx8a15_bee | 99.991 | 0.006 | 0.003 | 0.054 | |||||||
| pg152_o2_nofp.cx8a16_bee | 99.997 | 0.003 | nonzero | 0.035 | |||||||
| pg152_o2_nofp.cx8a17_bee | 99.999 | 0.001 | nonzero | 0.026 | |||||||
| pg152_o2_nofp.cx8a18_bee | 99.989 | 0.011 | nonzero | 0.026 |
Delete response time histogram: each cell has the percentage of responses that take <= the time in the header and max is the max response time in seconds. For the max column values in the top 25% of the range have a red background and in the bottom 25% of the range have a green background. The red background is not used when the min value is within 80% of the max value.
| dbms | 256us | 1ms | 4ms | 16ms | 64ms | 256ms | 1s | 4s | 16s | gt | max |
|---|---|---|---|---|---|---|---|---|---|---|---|
| pg152_o2_nofp.cx8_bee | 0.101 | 84.262 | 0.349 | 5.252 | 10.036 | nonzero | 0.074 | ||||
| pg152_o2_nofp.cx8a1_bee | 0.083 | 84.038 | 1.194 | 4.821 | 9.863 | 0.050 | |||||
| pg152_o2_nofp.cx8a2_bee | 0.083 | 84.433 | 1.000 | 4.976 | 9.508 | nonzero | 0.084 | ||||
| pg152_o2_nofp.cx8a3_bee | 0.083 | 83.870 | 1.042 | 4.666 | 10.339 | 0.048 | |||||
| pg152_o2_nofp.cx8a4_bee | 0.095 | 84.091 | 1.366 | 4.941 | 9.507 | 0.049 | |||||
| pg152_o2_nofp.cx8a9_bee | 0.080 | 83.885 | 1.675 | 4.744 | 9.616 | 0.047 | |||||
| pg152_o2_nofp.cx8a10_bee | 0.095 | 84.472 | 1.408 | 5.212 | 8.813 | 0.049 | |||||
| pg152_o2_nofp.cx8a12_bee | 0.099 | 83.288 | 1.892 | 5.322 | 9.398 | 0.049 | |||||
| pg152_o2_nofp.cx8a14_bee | 0.091 | 83.778 | 0.714 | 5.276 | 10.140 | nonzero | 0.081 | ||||
| pg152_o2_nofp.cx8a15_bee | 0.080 | 84.526 | 0.534 | 4.994 | 9.867 | 0.046 | |||||
| pg152_o2_nofp.cx8a16_bee | 0.138 | 82.953 | 2.873 | 14.036 | nonzero | 0.036 | |||||
| pg152_o2_nofp.cx8a17_bee | 0.096 | 84.409 | 1.378 | 4.732 | 9.385 | 0.049 | |||||
| pg152_o2_nofp.cx8a18_bee | 0.106 | 82.910 | 3.061 | 13.923 | nonzero | 0.024 |
Performance metrics for the DBMS listed above. Some are normalized by throughput, others are not. Legend for results is here.
ips	qps	rps	rmbps	wps	wmbps	rpq	rkbpq	wpi	wkbpi	csps	cpups	cspq	cpupq	dbgb1	dbgb2	rss	maxop	p50	p99	tag
11030	0	0	0.0	52.1	14.4	0.000	0.000	0.005	1.334	5404	17.2	0.490	125	6.1	31.0	0.0	0.013	2797	1199	20m.pg152_o2_nofp.cx8_bee
11062	0	0	0.0	49.9	13.5	0.000	0.000	0.005	1.254	5423	17.2	0.490	124	6.1	29.6	0.0	0.010	2697	1199	20m.pg152_o2_nofp.cx8a1_bee
11206	0	0	0.0	52.5	14.6	0.000	0.000	0.005	1.332	5482	17.3	0.489	124	6.1	31.1	0.0	0.021	2697	1249	20m.pg152_o2_nofp.cx8a2_bee
10616	0	0	0.0	43.8	11.6	0.000	0.000	0.004	1.114	5198	16.9	0.490	127	6.1	26.8	0.0	0.023	2547	1149	20m.pg152_o2_nofp.cx8a3_bee
11436	0	0	0.0	53.6	15.0	0.000	0.000	0.005	1.344	5604	17.3	0.490	121	6.1	32.1	0.0	0.030	2797	1249	20m.pg152_o2_nofp.cx8a4_bee
11035	0	0	0.0	81.3	16.4	0.000	0.000	0.007	1.521	5384	17.3	0.488	125	6.1	21.6	0.0	0.007	2697	1199	20m.pg152_o2_nofp.cx8a9_bee
11669	0	0	0.0	53.9	15.2	0.000	0.000	0.005	1.331	5711	17.4	0.489	119	6.1	31.9	0.0	0.048	2747	1249	20m.pg152_o2_nofp.cx8a10_bee
10900	0	0	0.0	51.3	14.2	0.000	0.000	0.005	1.331	5352	17.1	0.491	126	6.1	31.0	0.0	0.020	2597	1199	20m.pg152_o2_nofp.cx8a12_bee
10693	0	0	0.0	50.8	13.9	0.000	0.000	0.005	1.329	5248	17.0	0.491	127	6.1	30.5	0.0	0.022	2597	1249	20m.pg152_o2_nofp.cx8a14_bee
11091	0	0	0.0	110.2	20.4	0.000	0.000	0.010	1.882	5406	17.3	0.487	125	6.1	16.1	3.8	0.054	2697	1249	20m.pg152_o2_nofp.cx8a15_bee
22635	0	0	0.0	84.6	26.3	0.000	0.000	0.004	1.192	10975	23.1	0.485	82	4.8	36.1	0.0	0.035	29268	8195	20m.pg152_o2_nofp.cx8a16_bee
11104	0	0	0.0	51.8	14.4	0.000	0.000	0.005	1.324	5442	17.1	0.490	123	6.1	30.9	0.0	0.026	2597	1199	20m.pg152_o2_nofp.cx8a17_bee
22512	0	0	0.0	72.5	21.6	0.000	0.000	0.003	0.982	10869	23.0	0.483	82	5.0	42.9	0.2	0.026	29168	8091	20m.pg152_o2_nofp.cx8a18_bee
q100.1
q100.1: range queries with 100 insert/s per client. Graphs for performance per 1-second interval are here.
Average throughput:

Query response time histogram: each cell has the percentage of responses that take <= the time in the header and max is the max response time in seconds. For max values in the top 25% of the range have a red background and in the bottom 25% of the range have a green background. The red background is not used when the min value is within 80% of the max value.
| dbms | 256us | 1ms | 4ms | 16ms | 64ms | 256ms | 1s | 4s | 16s | gt | max |
|---|---|---|---|---|---|---|---|---|---|---|---|
| pg152_o2_nofp.cx8_bee | 99.949 | 0.050 | nonzero | 0.003 | |||||||
| pg152_o2_nofp.cx8a1_bee | 99.938 | 0.062 | nonzero | nonzero | 0.004 | ||||||
| pg152_o2_nofp.cx8a2_bee | 99.941 | 0.059 | 0.001 | nonzero | 0.006 | ||||||
| pg152_o2_nofp.cx8a3_bee | 99.947 | 0.053 | nonzero | 0.004 | |||||||
| pg152_o2_nofp.cx8a4_bee | 99.926 | 0.074 | nonzero | 0.004 | |||||||
| pg152_o2_nofp.cx8a9_bee | 99.950 | 0.050 | nonzero | 0.003 | |||||||
| pg152_o2_nofp.cx8a10_bee | 99.962 | 0.038 | nonzero | 0.003 | |||||||
| pg152_o2_nofp.cx8a12_bee | 99.960 | 0.040 | nonzero | nonzero | 0.004 | ||||||
| pg152_o2_nofp.cx8a14_bee | 99.946 | 0.054 | nonzero | 0.003 | |||||||
| pg152_o2_nofp.cx8a15_bee | 99.949 | 0.051 | nonzero | 0.003 | |||||||
| pg152_o2_nofp.cx8a16_bee | 99.947 | 0.053 | nonzero | 0.003 | |||||||
| pg152_o2_nofp.cx8a17_bee | 99.946 | 0.053 | nonzero | 0.003 | |||||||
| pg152_o2_nofp.cx8a18_bee | 99.935 | 0.065 | nonzero | nonzero | 0.004 |
Insert response time histogram: each cell has the percentage of responses that take <= the time in the header and max is the max response time in seconds. For max values in the top 25% of the range have a red background and in the bottom 25% of the range have a green background. The red background is not used when the min value is within 80% of the max value.
| dbms | 256us | 1ms | 4ms | 16ms | 64ms | 256ms | 1s | 4s | 16s | gt | max |
|---|---|---|---|---|---|---|---|---|---|---|---|
| pg152_o2_nofp.cx8_bee | 99.667 | 0.333 | 0.007 | ||||||||
| pg152_o2_nofp.cx8a1_bee | 69.278 | 30.722 | 0.006 | ||||||||
| pg152_o2_nofp.cx8a2_bee | 99.778 | 0.222 | 0.008 | ||||||||
| pg152_o2_nofp.cx8a3_bee | 99.889 | 0.111 | 0.006 | ||||||||
| pg152_o2_nofp.cx8a4_bee | 99.917 | 0.083 | 0.005 | ||||||||
| pg152_o2_nofp.cx8a9_bee | 99.889 | 0.111 | 0.006 | ||||||||
| pg152_o2_nofp.cx8a10_bee | 99.944 | 0.056 | 0.006 | ||||||||
| pg152_o2_nofp.cx8a12_bee | 99.889 | 0.111 | 0.006 | ||||||||
| pg152_o2_nofp.cx8a14_bee | 99.861 | 0.139 | 0.007 | ||||||||
| pg152_o2_nofp.cx8a15_bee | 99.889 | 0.111 | 0.006 | ||||||||
| pg152_o2_nofp.cx8a16_bee | 99.917 | 0.083 | 0.005 | ||||||||
| pg152_o2_nofp.cx8a17_bee | 99.806 | 0.194 | 0.005 | ||||||||
| pg152_o2_nofp.cx8a18_bee | 68.944 | 31.056 | 0.006 |
Delete response time histogram: each cell has the percentage of responses that take <= the time in the header and max is the max response time in seconds. For max values in the top 25% of the range have a red background and in the bottom 25% of the range have a green background. The red background is not used when the min value is within 80% of the max value.
| dbms | 256us | 1ms | 4ms | 16ms | 64ms | 256ms | 1s | 4s | 16s | gt | max |
|---|---|---|---|---|---|---|---|---|---|---|---|
| pg152_o2_nofp.cx8_bee | 23.889 | 76.028 | 0.083 | 0.005 | |||||||
| pg152_o2_nofp.cx8a1_bee | 0.833 | 97.639 | 1.472 | 0.056 | 0.005 | ||||||
| pg152_o2_nofp.cx8a2_bee | 0.056 | 23.167 | 76.667 | 0.111 | 0.005 | ||||||
| pg152_o2_nofp.cx8a3_bee | 0.417 | 91.806 | 7.778 | 0.001 | |||||||
| pg152_o2_nofp.cx8a4_bee | 0.917 | 99.056 | 0.028 | 0.002 | |||||||
| pg152_o2_nofp.cx8a9_bee | 0.389 | 99.583 | 0.028 | 0.001 | |||||||
| pg152_o2_nofp.cx8a10_bee | 0.556 | 99.361 | 0.083 | 0.003 | |||||||
| pg152_o2_nofp.cx8a12_bee | 0.556 | 99.389 | 0.056 | 0.003 | |||||||
| pg152_o2_nofp.cx8a14_bee | 0.667 | 99.278 | 0.056 | 0.002 | |||||||
| pg152_o2_nofp.cx8a15_bee | 26.167 | 73.778 | 0.056 | 0.005 | |||||||
| pg152_o2_nofp.cx8a16_bee | 0.556 | 94.722 | 4.722 | 0.003 | |||||||
| pg152_o2_nofp.cx8a17_bee | 0.083 | 39.972 | 59.694 | 0.250 | 0.007 | ||||||
| pg152_o2_nofp.cx8a18_bee | 0.556 | 99.417 | 0.028 | 0.002 |
Performance metrics for the DBMS listed above. Some are normalized by throughput, others are not. Legend for results is here.
ips	qps	rps	rmbps	wps	wmbps	rpq	rkbpq	wpi	wkbpi	csps	cpups	cspq	cpupq	dbgb1	dbgb2	rss	maxop	p50	p99	tag
100	8062	0	0.0	24.9	3.4	0.000	0.000	0.249	35.072	31007	13.1	3.846	130	6.1	31.0	0.0	0.003	7765	7623	20m.pg152_o2_nofp.cx8_bee
100	8228	0	0.0	24.5	3.2	0.000	0.000	0.245	32.365	31622	13.2	3.843	128	6.1	29.6	0.0	0.004	7846	7717	20m.pg152_o2_nofp.cx8a1_bee
100	8097	0	0.0	24.4	3.4	0.000	0.000	0.244	34.980	31142	13.2	3.846	130	6.1	31.1	0.0	0.006	7781	7652	20m.pg152_o2_nofp.cx8a2_bee
100	8061	0	0.0	26.1	2.9	0.000	0.000	0.262	30.265	30955	13.1	3.840	130	6.1	26.8	0.0	0.004	7797	7655	20m.pg152_o2_nofp.cx8a3_bee
100	8113	0	0.0	28.2	3.3	0.000	0.000	0.283	33.633	31193	13.2	3.845	130	6.1	32.1	0.0	0.004	7829	7718	20m.pg152_o2_nofp.cx8a4_bee
100	8300	0	0.0	111.9	4.0	0.000	0.000	1.121	40.560	31919	13.4	3.846	129	6.1	21.6	0.0	0.003	7847	7733	20m.pg152_o2_nofp.cx8a9_bee
100	8177	0	0.0	21.8	3.2	0.000	0.000	0.218	32.810	31446	13.3	3.846	130	6.1	31.9	0.0	0.003	7799	7718	20m.pg152_o2_nofp.cx8a10_bee
100	8312	0	0.0	24.0	3.4	0.000	0.000	0.241	35.094	31965	13.0	3.846	125	6.1	31.0	0.0	0.004	7991	7885	20m.pg152_o2_nofp.cx8a12_bee
100	8068	0	0.0	24.7	3.6	0.000	0.000	0.248	36.715	31051	13.3	3.849	132	6.1	30.4	0.0	0.003	7719	7592	20m.pg152_o2_nofp.cx8a14_bee
100	8209	0	0.0	24.5	1.4	0.000	0.000	0.245	14.651	31546	13.2	3.843	129	6.1	16.1	0.0	0.003	7847	7703	20m.pg152_o2_nofp.cx8a15_bee
100	8121	0	0.0	17.7	2.5	0.000	0.000	0.178	25.446	31244	13.4	3.848	132	4.8	36.2	0.0	0.003	7767	7653	20m.pg152_o2_nofp.cx8a16_bee
100	8151	0	0.0	24.4	3.4	0.000	0.000	0.245	34.888	31336	13.2	3.844	130	6.1	30.9	0.0	0.003	7847	7719	20m.pg152_o2_nofp.cx8a17_bee
100	8083	0	0.0	20.5	2.8	0.000	0.000	0.206	29.148	31076	13.3	3.845	132	5.0	42.9	0.0	0.004	7639	7526	20m.pg152_o2_nofp.cx8a18_bee
q500.1
q500.1: range queries with 500 insert/s per client. Graphs for performance per 1-second interval are here.
Average throughput:
Query response time histogram: each cell has the percentage of responses that take <= the time in the header and max is the max response time in seconds. For max values in the top 25% of the range have a red background and in the bottom 25% of the range have a green background. The red background is not used when the min value is within 80% of the max value.
| dbms | 256us | 1ms | 4ms | 16ms | 64ms | 256ms | 1s | 4s | 16s | gt | max |
|---|---|---|---|---|---|---|---|---|---|---|---|
| pg152_o2_nofp.cx8_bee | 99.949 | 0.051 | nonzero | nonzero | 0.004 | ||||||
| pg152_o2_nofp.cx8a1_bee | 99.956 | 0.044 | nonzero | 0.003 | |||||||
| pg152_o2_nofp.cx8a2_bee | 99.949 | 0.051 | nonzero | nonzero | 0.004 | ||||||
| pg152_o2_nofp.cx8a3_bee | 99.953 | 0.047 | nonzero | nonzero | 0.004 | ||||||
| pg152_o2_nofp.cx8a4_bee | 99.946 | 0.054 | nonzero | nonzero | 0.005 | ||||||
| pg152_o2_nofp.cx8a9_bee | 99.943 | 0.057 | nonzero | 0.003 | |||||||
| pg152_o2_nofp.cx8a10_bee | 99.946 | 0.053 | nonzero | 0.003 | |||||||
| pg152_o2_nofp.cx8a12_bee | 99.956 | 0.044 | nonzero | 0.003 | |||||||
| pg152_o2_nofp.cx8a14_bee | 99.944 | 0.056 | nonzero | 0.003 | |||||||
| pg152_o2_nofp.cx8a15_bee | 99.943 | 0.057 | nonzero | nonzero | 0.006 | ||||||
| pg152_o2_nofp.cx8a16_bee | 99.954 | 0.046 | nonzero | 0.003 | |||||||
| pg152_o2_nofp.cx8a17_bee | 99.941 | 0.059 | nonzero | nonzero | 0.004 | ||||||
| pg152_o2_nofp.cx8a18_bee | 99.935 | 0.065 | nonzero | 0.004 |
Insert response time histogram: each cell has the percentage of responses that take <= the time in the header and max is the max response time in seconds. For max values in the top 25% of the range have a red background and in the bottom 25% of the range have a green background. The red background is not used when the min value is within 80% of the max value.
| dbms | 256us | 1ms | 4ms | 16ms | 64ms | 256ms | 1s | 4s | 16s | gt | max |
|---|---|---|---|---|---|---|---|---|---|---|---|
| pg152_o2_nofp.cx8_bee | 99.961 | 0.039 | 0.005 | ||||||||
| pg152_o2_nofp.cx8a1_bee | 93.594 | 6.406 | 0.006 | ||||||||
| pg152_o2_nofp.cx8a2_bee | 99.978 | 0.022 | 0.006 | ||||||||
| pg152_o2_nofp.cx8a3_bee | 99.972 | 0.028 | 0.008 | ||||||||
| pg152_o2_nofp.cx8a4_bee | 99.917 | 0.083 | 0.007 | ||||||||
| pg152_o2_nofp.cx8a9_bee | 99.922 | 0.078 | 0.006 | ||||||||
| pg152_o2_nofp.cx8a10_bee | 99.928 | 0.072 | 0.007 | ||||||||
| pg152_o2_nofp.cx8a12_bee | 99.961 | 0.039 | 0.009 | ||||||||
| pg152_o2_nofp.cx8a14_bee | 99.967 | 0.033 | 0.006 | ||||||||
| pg152_o2_nofp.cx8a15_bee | 99.944 | 0.056 | 0.008 | ||||||||
| pg152_o2_nofp.cx8a16_bee | 99.944 | 0.050 | 0.006 | 0.040 | |||||||
| pg152_o2_nofp.cx8a17_bee | 99.972 | 0.028 | 0.006 | ||||||||
| pg152_o2_nofp.cx8a18_bee | 92.911 | 7.089 | 0.008 |
Delete response time histogram: each cell has the percentage of responses that take <= the time in the header and max is the max response time in seconds. For max values in the top 25% of the range have a red background and in the bottom 25% of the range have a green background. The red background is not used when the min value is within 80% of the max value.
| dbms | 256us | 1ms | 4ms | 16ms | 64ms | 256ms | 1s | 4s | 16s | gt | max |
|---|---|---|---|---|---|---|---|---|---|---|---|
| pg152_o2_nofp.cx8_bee | 4.911 | 86.583 | 0.994 | 7.500 | 0.011 | 0.017 | |||||
| pg152_o2_nofp.cx8a1_bee | 3.228 | 76.100 | 0.072 | 20.600 | 0.015 | ||||||
| pg152_o2_nofp.cx8a2_bee | 5.367 | 83.356 | 3.667 | 7.611 | 0.015 | ||||||
| pg152_o2_nofp.cx8a3_bee | 3.450 | 74.311 | 0.117 | 22.122 | 0.015 | ||||||
| pg152_o2_nofp.cx8a4_bee | 3.806 | 73.756 | 0.089 | 22.350 | 0.011 | ||||||
| pg152_o2_nofp.cx8a9_bee | 3.067 | 75.406 | 0.089 | 21.439 | 0.010 | ||||||
| pg152_o2_nofp.cx8a10_bee | 4.067 | 71.067 | 0.089 | 24.778 | 0.013 | ||||||
| pg152_o2_nofp.cx8a12_bee | 2.967 | 76.006 | 0.133 | 20.894 | 0.011 | ||||||
| pg152_o2_nofp.cx8a14_bee | 3.883 | 75.400 | 0.122 | 20.594 | 0.010 | ||||||
| pg152_o2_nofp.cx8a15_bee | 4.667 | 87.689 | 0.094 | 7.544 | 0.006 | 0.016 | |||||
| pg152_o2_nofp.cx8a16_bee | 3.556 | 76.789 | 0.211 | 19.433 | 0.011 | 0.022 | |||||
| pg152_o2_nofp.cx8a17_bee | 7.133 | 80.278 | 8.672 | 3.917 | 0.015 | ||||||
| pg152_o2_nofp.cx8a18_bee | 3.883 | 74.961 | 5.494 | 15.661 | 0.010 |
Performance metrics for the DBMS listed above. Some are normalized by throughput, others are not. Legend for results is here.
ips	qps	rps	rmbps	wps	wmbps	rpq	rkbpq	wpi	wkbpi	csps	cpups	cspq	cpupq	dbgb1	dbgb2	rss	maxop	p50	p99	tag
499	8032	0	0.0	64.5	3.3	0.000	0.000	0.129	6.746	31070	13.5	3.868	134	6.1	31.0	0.0	0.004	7687	7575	20m.pg152_o2_nofp.cx8_bee
499	8162	0	0.0	62.2	2.8	0.000	0.000	0.125	5.841	31534	13.4	3.863	131	6.1	29.6	0.0	0.003	7767	7612	20m.pg152_o2_nofp.cx8a1_bee
499	8022	0	0.0	61.7	3.4	0.000	0.000	0.124	6.885	31004	13.4	3.865	134	6.1	31.1	0.0	0.004	7688	7495	20m.pg152_o2_nofp.cx8a2_bee
499	8223	0	0.0	67.0	1.9	0.000	0.000	0.134	3.847	31734	13.7	3.859	133	6.1	26.8	0.0	0.004	7750	7622	20m.pg152_o2_nofp.cx8a3_bee
499	8169	0	0.0	62.6	3.4	0.000	0.000	0.125	7.009	31553	13.7	3.863	134	6.1	32.1	0.0	0.005	7782	7623	20m.pg152_o2_nofp.cx8a4_bee
499	8064	0	0.0	100.5	5.4	0.000	0.000	0.201	11.000	31236	13.5	3.873	134	6.1	21.6	0.0	0.003	7751	7622	20m.pg152_o2_nofp.cx8a9_bee
499	8102	0	0.0	62.4	3.4	0.000	0.000	0.125	7.048	31296	13.6	3.863	134	6.1	31.9	0.0	0.003	7719	7590	20m.pg152_o2_nofp.cx8a10_bee
499	8177	0	0.0	65.0	3.2	0.000	0.000	0.130	6.625	31624	13.5	3.867	132	6.1	31.0	0.0	0.003	7813	7671	20m.pg152_o2_nofp.cx8a12_bee
499	8073	0	0.0	70.1	3.1	0.000	0.000	0.141	6.334	31249	13.5	3.871	134	6.1	30.4	0.0	0.003	7735	7575	20m.pg152_o2_nofp.cx8a14_bee
499	8113	0	0.0	55.8	3.5	0.000	0.000	0.112	7.210	31357	13.4	3.865	132	6.1	16.1	0.0	0.006	7814	7687	20m.pg152_o2_nofp.cx8a15_bee
499	8098	0	0.0	53.6	3.2	0.000	0.000	0.107	6.608	31278	13.9	3.863	137	4.8	36.2	0.0	0.003	7732	7591	20m.pg152_o2_nofp.cx8a16_bee
499	8141	0	0.0	63.4	3.3	0.000	0.000	0.127	6.798	31754	13.5	3.900	133	6.1	30.9	0.0	0.004	7797	7560	20m.pg152_o2_nofp.cx8a17_bee
499	8093	0	0.0	51.2	2.7	0.000	0.000	0.103	5.561	31257	13.5	3.862	133	5.0	42.9	0.0	0.004	7717	7575	20m.pg152_o2_nofp.cx8a18_bee
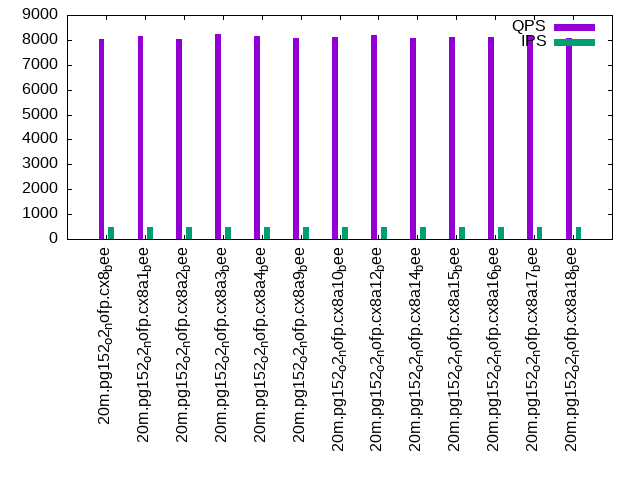
q1000.1
q1000.1: range queries with 1000 insert/s per client. Graphs for performance per 1-second interval are here.
Average throughput:
Query response time histogram: each cell has the percentage of responses that take <= the time in the header and max is the max response time in seconds. For max values in the top 25% of the range have a red background and in the bottom 25% of the range have a green background. The red background is not used when the min value is within 80% of the max value.
| dbms | 256us | 1ms | 4ms | 16ms | 64ms | 256ms | 1s | 4s | 16s | gt | max |
|---|---|---|---|---|---|---|---|---|---|---|---|
| pg152_o2_nofp.cx8_bee | 99.945 | 0.055 | nonzero | nonzero | 0.004 | ||||||
| pg152_o2_nofp.cx8a1_bee | 99.961 | 0.039 | nonzero | 0.003 | |||||||
| pg152_o2_nofp.cx8a2_bee | 99.949 | 0.051 | nonzero | nonzero | 0.005 | ||||||
| pg152_o2_nofp.cx8a3_bee | 99.960 | 0.040 | nonzero | 0.002 | |||||||
| pg152_o2_nofp.cx8a4_bee | 99.953 | 0.047 | nonzero | 0.003 | |||||||
| pg152_o2_nofp.cx8a9_bee | 99.948 | 0.052 | nonzero | 0.003 | |||||||
| pg152_o2_nofp.cx8a10_bee | 99.954 | 0.046 | nonzero | 0.003 | |||||||
| pg152_o2_nofp.cx8a12_bee | 99.945 | 0.055 | nonzero | nonzero | 0.004 | ||||||
| pg152_o2_nofp.cx8a14_bee | 99.944 | 0.056 | nonzero | 0.003 | |||||||
| pg152_o2_nofp.cx8a15_bee | 99.955 | 0.044 | nonzero | nonzero | 0.004 | ||||||
| pg152_o2_nofp.cx8a16_bee | 99.946 | 0.054 | nonzero | 0.004 | |||||||
| pg152_o2_nofp.cx8a17_bee | 99.952 | 0.048 | nonzero | nonzero | 0.004 | ||||||
| pg152_o2_nofp.cx8a18_bee | 99.946 | 0.054 | nonzero | 0.003 |
Insert response time histogram: each cell has the percentage of responses that take <= the time in the header and max is the max response time in seconds. For max values in the top 25% of the range have a red background and in the bottom 25% of the range have a green background. The red background is not used when the min value is within 80% of the max value.
| dbms | 256us | 1ms | 4ms | 16ms | 64ms | 256ms | 1s | 4s | 16s | gt | max |
|---|---|---|---|---|---|---|---|---|---|---|---|
| pg152_o2_nofp.cx8_bee | 99.983 | 0.017 | 0.005 | ||||||||
| pg152_o2_nofp.cx8a1_bee | 96.956 | 3.044 | 0.006 | ||||||||
| pg152_o2_nofp.cx8a2_bee | 99.989 | 0.011 | 0.006 | ||||||||
| pg152_o2_nofp.cx8a3_bee | 99.992 | 0.008 | 0.006 | ||||||||
| pg152_o2_nofp.cx8a4_bee | 99.989 | 0.011 | 0.007 | ||||||||
| pg152_o2_nofp.cx8a9_bee | 99.986 | 0.014 | 0.007 | ||||||||
| pg152_o2_nofp.cx8a10_bee | 99.992 | 0.008 | 0.006 | ||||||||
| pg152_o2_nofp.cx8a12_bee | 99.989 | 0.011 | 0.007 | ||||||||
| pg152_o2_nofp.cx8a14_bee | 99.986 | 0.014 | 0.005 | ||||||||
| pg152_o2_nofp.cx8a15_bee | 99.989 | 0.011 | 0.007 | ||||||||
| pg152_o2_nofp.cx8a16_bee | 99.992 | 0.008 | 0.006 | ||||||||
| pg152_o2_nofp.cx8a17_bee | 99.986 | 0.014 | 0.005 | ||||||||
| pg152_o2_nofp.cx8a18_bee | 96.806 | 3.194 | 0.007 |
Delete response time histogram: each cell has the percentage of responses that take <= the time in the header and max is the max response time in seconds. For max values in the top 25% of the range have a red background and in the bottom 25% of the range have a green background. The red background is not used when the min value is within 80% of the max value.
| dbms | 256us | 1ms | 4ms | 16ms | 64ms | 256ms | 1s | 4s | 16s | gt | max |
|---|---|---|---|---|---|---|---|---|---|---|---|
| pg152_o2_nofp.cx8_bee | 3.058 | 78.431 | 6.822 | 11.689 | 0.015 | ||||||
| pg152_o2_nofp.cx8a1_bee | 2.078 | 76.911 | 0.092 | 13.944 | 6.975 | 0.022 | |||||
| pg152_o2_nofp.cx8a2_bee | 3.319 | 79.331 | 6.050 | 11.300 | 0.016 | ||||||
| pg152_o2_nofp.cx8a3_bee | 2.444 | 79.106 | 0.089 | 10.983 | 7.378 | 0.022 | |||||
| pg152_o2_nofp.cx8a4_bee | 2.800 | 76.908 | 0.567 | 19.500 | 0.225 | 0.019 | |||||
| pg152_o2_nofp.cx8a9_bee | 1.767 | 75.164 | 1.814 | 20.625 | 0.631 | 0.019 | |||||
| pg152_o2_nofp.cx8a10_bee | 3.356 | 74.747 | 0.081 | 21.556 | 0.261 | 0.020 | |||||
| pg152_o2_nofp.cx8a12_bee | 2.964 | 72.331 | 0.408 | 23.983 | 0.314 | 0.019 | |||||
| pg152_o2_nofp.cx8a14_bee | 2.572 | 72.947 | 1.081 | 23.103 | 0.297 | 0.019 | |||||
| pg152_o2_nofp.cx8a15_bee | 3.544 | 81.286 | 4.808 | 10.361 | 0.015 | ||||||
| pg152_o2_nofp.cx8a16_bee | 3.642 | 80.103 | 0.081 | 16.175 | 0.013 | ||||||
| pg152_o2_nofp.cx8a17_bee | 2.936 | 76.686 | 9.086 | 11.292 | 0.016 | ||||||
| pg152_o2_nofp.cx8a18_bee | 2.047 | 76.272 | 11.322 | 10.358 | 0.009 |
Performance metrics for the DBMS listed above. Some are normalized by throughput, others are not. Legend for results is here.
ips	qps	rps	rmbps	wps	wmbps	rpq	rkbpq	wpi	wkbpi	csps	cpups	cspq	cpupq	dbgb1	dbgb2	rss	maxop	p50	p99	tag
998	7981	0	0.0	33.4	3.4	0.000	0.000	0.033	3.474	31042	14.4	3.890	144	6.1	30.8	0.0	0.004	7671	7541	20m.pg152_o2_nofp.cx8_bee
998	8039	0	0.0	33.0	3.0	0.000	0.000	0.033	3.082	31240	14.5	3.886	144	6.1	29.1	0.0	0.003	7707	7527	20m.pg152_o2_nofp.cx8a1_bee
998	8027	0	0.0	35.7	3.4	0.000	0.000	0.036	3.473	31200	14.2	3.887	142	6.1	30.3	0.0	0.005	7733	7528	20m.pg152_o2_nofp.cx8a2_bee
998	8153	0	0.0	29.6	2.4	0.000	0.000	0.030	2.506	31669	14.6	3.884	143	6.1	26.8	0.0	0.002	7719	7561	20m.pg152_o2_nofp.cx8a3_bee
998	8043	0	0.0	35.7	3.4	0.000	0.000	0.036	3.467	31250	14.4	3.886	143	6.1	31.3	0.0	0.003	7719	7559	20m.pg152_o2_nofp.cx8a4_bee
998	8107	0	0.0	80.9	6.1	0.000	0.000	0.081	6.231	31555	14.7	3.892	145	6.1	21.6	0.0	0.003	7767	7577	20m.pg152_o2_nofp.cx8a9_bee
998	8217	0	0.0	33.9	3.4	0.000	0.000	0.034	3.484	31920	14.6	3.885	142	6.1	31.1	0.0	0.003	7735	7559	20m.pg152_o2_nofp.cx8a10_bee
998	8065	0	0.0	32.8	3.4	0.000	0.000	0.033	3.517	31371	14.7	3.890	146	6.1	30.3	0.0	0.004	7733	7559	20m.pg152_o2_nofp.cx8a12_bee
998	7991	0	0.0	35.0	3.4	0.000	0.000	0.035	3.507	31105	14.5	3.893	145	6.1	29.9	0.0	0.003	7622	7416	20m.pg152_o2_nofp.cx8a14_bee
998	8039	0	0.0	40.8	3.2	0.000	0.000	0.041	3.327	31232	14.4	3.885	143	6.1	16.1	0.0	0.004	7719	7559	20m.pg152_o2_nofp.cx8a15_bee
998	8088	0	0.0	27.6	3.1	0.000	0.000	0.028	3.137	31517	14.7	3.897	145	4.9	36.2	0.0	0.004	7686	7543	20m.pg152_o2_nofp.cx8a16_bee
998	8059	0	0.0	33.1	3.4	0.000	0.000	0.033	3.483	31325	14.4	3.887	143	6.1	30.2	0.0	0.004	7719	7574	20m.pg152_o2_nofp.cx8a17_bee
998	7934	0	0.0	22.8	2.8	0.000	0.000	0.023	2.845	30838	14.2	3.887	143	5.0	42.7	0.0	0.003	7591	7463	20m.pg152_o2_nofp.cx8a18_bee
l.i0
l.i0: load without secondary indexes
Performance metrics for all DBMS, not just the ones listed above. Some are normalized by throughput, others are not. Legend for results is here.
ips	qps	rps	rmbps	wps	wmbps	rpq	rkbpq	wpi	wkbpi	csps	cpups	cspq	cpupq	dbgb1	dbgb2	rss	maxop	p50	p99	tag
72993	0	0	0.0	83.8	30.9	0.000	0.000	0.001	0.433	8959	23.2	0.123	25	1.9	5.2	0.0	0.003	73117	70213	20m.pg152_o2_nofp.cx8_bee
72464	0	0	0.0	84.2	30.5	0.000	0.000	0.001	0.431	8897	23.3	0.123	26	1.9	5.2	0.0	0.003	72517	70578	20m.pg152_o2_nofp.cx8a1_bee
71942	0	0	0.0	84.1	30.4	0.000	0.000	0.001	0.432	8783	23.1	0.122	26	1.9	5.2	0.0	0.003	72218	69515	20m.pg152_o2_nofp.cx8a2_bee
72464	0	0	0.0	84.4	30.5	0.000	0.000	0.001	0.431	8938	23.4	0.123	26	1.9	5.2	0.0	0.003	72717	70016	20m.pg152_o2_nofp.cx8a3_bee
72993	0	0	0.0	83.7	30.8	0.000	0.000	0.001	0.432	8989	23.4	0.123	26	1.9	5.2	0.0	0.003	73117	70215	20m.pg152_o2_nofp.cx8a4_bee
72727	0	0	0.0	84.4	30.6	0.000	0.000	0.001	0.431	8944	23.0	0.123	25	1.9	5.2	0.0	0.003	72917	70516	20m.pg152_o2_nofp.cx8a9_bee
72202	0	0	0.0	84.2	30.5	0.000	0.000	0.001	0.433	8919	23.1	0.124	26	1.9	5.2	0.0	0.004	72616	69716	20m.pg152_o2_nofp.cx8a10_bee
72993	0	0	0.0	84.1	30.9	0.000	0.000	0.001	0.433	8994	23.4	0.123	26	1.9	5.2	0.0	0.003	73416	70316	20m.pg152_o2_nofp.cx8a12_bee
72993	0	0	0.0	84.2	30.9	0.000	0.000	0.001	0.433	8986	23.1	0.123	25	1.9	5.2	0.0	0.004	73119	70215	20m.pg152_o2_nofp.cx8a14_bee
72727	0	0	0.0	84.3	30.8	0.000	0.000	0.001	0.434	8974	23.2	0.123	26	1.9	5.2	0.0	0.003	73019	70317	20m.pg152_o2_nofp.cx8a15_bee
73260	0	0	0.0	84.1	30.9	0.000	0.000	0.001	0.431	9003	23.1	0.123	25	1.9	5.2	0.0	0.003	73319	70515	20m.pg152_o2_nofp.cx8a16_bee
72202	0	0	0.0	83.0	30.5	0.000	0.000	0.001	0.433	8906	23.2	0.123	26	1.9	5.2	0.0	0.003	72617	69916	20m.pg152_o2_nofp.cx8a17_bee
71942	0	0	0.0	83.1	30.5	0.000	0.000	0.001	0.434	8894	23.1	0.124	26	1.9	5.2	0.0	0.003	72320	69016	20m.pg152_o2_nofp.cx8a18_bee
l.x
l.x: create secondary indexes
Performance metrics for all DBMS, not just the ones listed above. Some are normalized by throughput, others are not. Legend for results is here.
ips	qps	rps	rmbps	wps	wmbps	rpq	rkbpq	wpi	wkbpi	csps	cpups	cspq	cpupq	dbgb1	dbgb2	rss	maxop	p50	p99	tag
236470	0	0	0.0	140.4	62.5	0.000	0.000	0.001	0.271	784	12.0	0.003	4	3.7	8.6	0.0	0.003	NA	NA	20m.pg152_o2_nofp.cx8_bee
233721	0	0	0.0	93.9	44.1	0.000	0.000	0.000	0.193	754	12.2	0.003	4	3.7	8.0	0.0	0.003	NA	NA	20m.pg152_o2_nofp.cx8a1_bee
233721	0	0	0.0	127.0	59.9	0.000	0.000	0.001	0.263	709	12.0	0.003	4	3.7	8.6	0.0	0.003	NA	NA	20m.pg152_o2_nofp.cx8a2_bee
236470	0	0	0.0	126.6	59.5	0.000	0.000	0.001	0.258	684	12.0	0.003	4	3.7	8.6	0.0	0.003	NA	NA	20m.pg152_o2_nofp.cx8a3_bee
236470	0	0	0.0	134.4	63.5	0.000	0.000	0.001	0.275	830	11.9	0.004	4	3.7	8.6	0.0	0.003	NA	NA	20m.pg152_o2_nofp.cx8a4_bee
236470	0	0	0.0	123.3	57.7	0.000	0.000	0.001	0.250	777	12.1	0.003	4	3.7	8.6	0.0	0.003	NA	NA	20m.pg152_o2_nofp.cx8a9_bee
233721	0	0	0.0	143.3	67.5	0.000	0.000	0.001	0.296	711	11.8	0.003	4	3.7	8.6	0.0	0.003	NA	NA	20m.pg152_o2_nofp.cx8a10_bee
236470	0	0	0.0	97.1	45.7	0.000	0.000	0.000	0.198	734	12.3	0.003	4	3.7	8.6	0.0	0.003	NA	NA	20m.pg152_o2_nofp.cx8a12_bee
236470	0	0	0.0	128.1	60.3	0.000	0.000	0.001	0.261	755	11.9	0.003	4	3.7	8.6	0.0	0.003	NA	NA	20m.pg152_o2_nofp.cx8a14_bee
236470	0	0	0.0	132.3	62.2	0.000	0.000	0.001	0.269	725	12.0	0.003	4	3.7	8.6	0.0	0.003	NA	NA	20m.pg152_o2_nofp.cx8a15_bee
236470	0	0	0.0	138.2	65.2	0.000	0.000	0.001	0.282	991	12.1	0.004	4	3.7	8.6	0.0	0.003	NA	NA	20m.pg152_o2_nofp.cx8a16_bee
236470	0	0	0.0	145.7	68.7	0.000	0.000	0.001	0.298	754	12.2	0.003	4	3.7	8.6	0.0	0.003	NA	NA	20m.pg152_o2_nofp.cx8a17_bee
239286	0	0	0.0	75.6	35.5	0.000	0.000	0.000	0.152	665	12.8	0.003	4	3.7	8.0	0.0	0.003	NA	NA	20m.pg152_o2_nofp.cx8a18_bee
l.i1
l.i1: continue load after secondary indexes created
Performance metrics for all DBMS, not just the ones listed above. Some are normalized by throughput, others are not. Legend for results is here.
ips	qps	rps	rmbps	wps	wmbps	rpq	rkbpq	wpi	wkbpi	csps	cpups	cspq	cpupq	dbgb1	dbgb2	rss	maxop	p50	p99	tag
11030	0	0	0.0	52.1	14.4	0.000	0.000	0.005	1.334	5404	17.2	0.490	125	6.1	31.0	0.0	0.013	2797	1199	20m.pg152_o2_nofp.cx8_bee
11062	0	0	0.0	49.9	13.5	0.000	0.000	0.005	1.254	5423	17.2	0.490	124	6.1	29.6	0.0	0.010	2697	1199	20m.pg152_o2_nofp.cx8a1_bee
11206	0	0	0.0	52.5	14.6	0.000	0.000	0.005	1.332	5482	17.3	0.489	124	6.1	31.1	0.0	0.021	2697	1249	20m.pg152_o2_nofp.cx8a2_bee
10616	0	0	0.0	43.8	11.6	0.000	0.000	0.004	1.114	5198	16.9	0.490	127	6.1	26.8	0.0	0.023	2547	1149	20m.pg152_o2_nofp.cx8a3_bee
11436	0	0	0.0	53.6	15.0	0.000	0.000	0.005	1.344	5604	17.3	0.490	121	6.1	32.1	0.0	0.030	2797	1249	20m.pg152_o2_nofp.cx8a4_bee
11035	0	0	0.0	81.3	16.4	0.000	0.000	0.007	1.521	5384	17.3	0.488	125	6.1	21.6	0.0	0.007	2697	1199	20m.pg152_o2_nofp.cx8a9_bee
11669	0	0	0.0	53.9	15.2	0.000	0.000	0.005	1.331	5711	17.4	0.489	119	6.1	31.9	0.0	0.048	2747	1249	20m.pg152_o2_nofp.cx8a10_bee
10900	0	0	0.0	51.3	14.2	0.000	0.000	0.005	1.331	5352	17.1	0.491	126	6.1	31.0	0.0	0.020	2597	1199	20m.pg152_o2_nofp.cx8a12_bee
10693	0	0	0.0	50.8	13.9	0.000	0.000	0.005	1.329	5248	17.0	0.491	127	6.1	30.5	0.0	0.022	2597	1249	20m.pg152_o2_nofp.cx8a14_bee
11091	0	0	0.0	110.2	20.4	0.000	0.000	0.010	1.882	5406	17.3	0.487	125	6.1	16.1	3.8	0.054	2697	1249	20m.pg152_o2_nofp.cx8a15_bee
22635	0	0	0.0	84.6	26.3	0.000	0.000	0.004	1.192	10975	23.1	0.485	82	4.8	36.1	0.0	0.035	29268	8195	20m.pg152_o2_nofp.cx8a16_bee
11104	0	0	0.0	51.8	14.4	0.000	0.000	0.005	1.324	5442	17.1	0.490	123	6.1	30.9	0.0	0.026	2597	1199	20m.pg152_o2_nofp.cx8a17_bee
22512	0	0	0.0	72.5	21.6	0.000	0.000	0.003	0.982	10869	23.0	0.483	82	5.0	42.9	0.2	0.026	29168	8091	20m.pg152_o2_nofp.cx8a18_bee
q100.1
q100.1: range queries with 100 insert/s per client
Performance metrics for all DBMS, not just the ones listed above. Some are normalized by throughput, others are not. Legend for results is here.
ips	qps	rps	rmbps	wps	wmbps	rpq	rkbpq	wpi	wkbpi	csps	cpups	cspq	cpupq	dbgb1	dbgb2	rss	maxop	p50	p99	tag
100	8062	0	0.0	24.9	3.4	0.000	0.000	0.249	35.072	31007	13.1	3.846	130	6.1	31.0	0.0	0.003	7765	7623	20m.pg152_o2_nofp.cx8_bee
100	8228	0	0.0	24.5	3.2	0.000	0.000	0.245	32.365	31622	13.2	3.843	128	6.1	29.6	0.0	0.004	7846	7717	20m.pg152_o2_nofp.cx8a1_bee
100	8097	0	0.0	24.4	3.4	0.000	0.000	0.244	34.980	31142	13.2	3.846	130	6.1	31.1	0.0	0.006	7781	7652	20m.pg152_o2_nofp.cx8a2_bee
100	8061	0	0.0	26.1	2.9	0.000	0.000	0.262	30.265	30955	13.1	3.840	130	6.1	26.8	0.0	0.004	7797	7655	20m.pg152_o2_nofp.cx8a3_bee
100	8113	0	0.0	28.2	3.3	0.000	0.000	0.283	33.633	31193	13.2	3.845	130	6.1	32.1	0.0	0.004	7829	7718	20m.pg152_o2_nofp.cx8a4_bee
100	8300	0	0.0	111.9	4.0	0.000	0.000	1.121	40.560	31919	13.4	3.846	129	6.1	21.6	0.0	0.003	7847	7733	20m.pg152_o2_nofp.cx8a9_bee
100	8177	0	0.0	21.8	3.2	0.000	0.000	0.218	32.810	31446	13.3	3.846	130	6.1	31.9	0.0	0.003	7799	7718	20m.pg152_o2_nofp.cx8a10_bee
100	8312	0	0.0	24.0	3.4	0.000	0.000	0.241	35.094	31965	13.0	3.846	125	6.1	31.0	0.0	0.004	7991	7885	20m.pg152_o2_nofp.cx8a12_bee
100	8068	0	0.0	24.7	3.6	0.000	0.000	0.248	36.715	31051	13.3	3.849	132	6.1	30.4	0.0	0.003	7719	7592	20m.pg152_o2_nofp.cx8a14_bee
100	8209	0	0.0	24.5	1.4	0.000	0.000	0.245	14.651	31546	13.2	3.843	129	6.1	16.1	0.0	0.003	7847	7703	20m.pg152_o2_nofp.cx8a15_bee
100	8121	0	0.0	17.7	2.5	0.000	0.000	0.178	25.446	31244	13.4	3.848	132	4.8	36.2	0.0	0.003	7767	7653	20m.pg152_o2_nofp.cx8a16_bee
100	8151	0	0.0	24.4	3.4	0.000	0.000	0.245	34.888	31336	13.2	3.844	130	6.1	30.9	0.0	0.003	7847	7719	20m.pg152_o2_nofp.cx8a17_bee
100	8083	0	0.0	20.5	2.8	0.000	0.000	0.206	29.148	31076	13.3	3.845	132	5.0	42.9	0.0	0.004	7639	7526	20m.pg152_o2_nofp.cx8a18_bee
q500.1
q500.1: range queries with 500 insert/s per client
Performance metrics for all DBMS, not just the ones listed above. Some are normalized by throughput, others are not. Legend for results is here.
ips	qps	rps	rmbps	wps	wmbps	rpq	rkbpq	wpi	wkbpi	csps	cpups	cspq	cpupq	dbgb1	dbgb2	rss	maxop	p50	p99	tag
499	8032	0	0.0	64.5	3.3	0.000	0.000	0.129	6.746	31070	13.5	3.868	134	6.1	31.0	0.0	0.004	7687	7575	20m.pg152_o2_nofp.cx8_bee
499	8162	0	0.0	62.2	2.8	0.000	0.000	0.125	5.841	31534	13.4	3.863	131	6.1	29.6	0.0	0.003	7767	7612	20m.pg152_o2_nofp.cx8a1_bee
499	8022	0	0.0	61.7	3.4	0.000	0.000	0.124	6.885	31004	13.4	3.865	134	6.1	31.1	0.0	0.004	7688	7495	20m.pg152_o2_nofp.cx8a2_bee
499	8223	0	0.0	67.0	1.9	0.000	0.000	0.134	3.847	31734	13.7	3.859	133	6.1	26.8	0.0	0.004	7750	7622	20m.pg152_o2_nofp.cx8a3_bee
499	8169	0	0.0	62.6	3.4	0.000	0.000	0.125	7.009	31553	13.7	3.863	134	6.1	32.1	0.0	0.005	7782	7623	20m.pg152_o2_nofp.cx8a4_bee
499	8064	0	0.0	100.5	5.4	0.000	0.000	0.201	11.000	31236	13.5	3.873	134	6.1	21.6	0.0	0.003	7751	7622	20m.pg152_o2_nofp.cx8a9_bee
499	8102	0	0.0	62.4	3.4	0.000	0.000	0.125	7.048	31296	13.6	3.863	134	6.1	31.9	0.0	0.003	7719	7590	20m.pg152_o2_nofp.cx8a10_bee
499	8177	0	0.0	65.0	3.2	0.000	0.000	0.130	6.625	31624	13.5	3.867	132	6.1	31.0	0.0	0.003	7813	7671	20m.pg152_o2_nofp.cx8a12_bee
499	8073	0	0.0	70.1	3.1	0.000	0.000	0.141	6.334	31249	13.5	3.871	134	6.1	30.4	0.0	0.003	7735	7575	20m.pg152_o2_nofp.cx8a14_bee
499	8113	0	0.0	55.8	3.5	0.000	0.000	0.112	7.210	31357	13.4	3.865	132	6.1	16.1	0.0	0.006	7814	7687	20m.pg152_o2_nofp.cx8a15_bee
499	8098	0	0.0	53.6	3.2	0.000	0.000	0.107	6.608	31278	13.9	3.863	137	4.8	36.2	0.0	0.003	7732	7591	20m.pg152_o2_nofp.cx8a16_bee
499	8141	0	0.0	63.4	3.3	0.000	0.000	0.127	6.798	31754	13.5	3.900	133	6.1	30.9	0.0	0.004	7797	7560	20m.pg152_o2_nofp.cx8a17_bee
499	8093	0	0.0	51.2	2.7	0.000	0.000	0.103	5.561	31257	13.5	3.862	133	5.0	42.9	0.0	0.004	7717	7575	20m.pg152_o2_nofp.cx8a18_bee
q1000.1
q1000.1: range queries with 1000 insert/s per client
Performance metrics for all DBMS, not just the ones listed above. Some are normalized by throughput, others are not. Legend for results is here.
ips	qps	rps	rmbps	wps	wmbps	rpq	rkbpq	wpi	wkbpi	csps	cpups	cspq	cpupq	dbgb1	dbgb2	rss	maxop	p50	p99	tag
998	7981	0	0.0	33.4	3.4	0.000	0.000	0.033	3.474	31042	14.4	3.890	144	6.1	30.8	0.0	0.004	7671	7541	20m.pg152_o2_nofp.cx8_bee
998	8039	0	0.0	33.0	3.0	0.000	0.000	0.033	3.082	31240	14.5	3.886	144	6.1	29.1	0.0	0.003	7707	7527	20m.pg152_o2_nofp.cx8a1_bee
998	8027	0	0.0	35.7	3.4	0.000	0.000	0.036	3.473	31200	14.2	3.887	142	6.1	30.3	0.0	0.005	7733	7528	20m.pg152_o2_nofp.cx8a2_bee
998	8153	0	0.0	29.6	2.4	0.000	0.000	0.030	2.506	31669	14.6	3.884	143	6.1	26.8	0.0	0.002	7719	7561	20m.pg152_o2_nofp.cx8a3_bee
998	8043	0	0.0	35.7	3.4	0.000	0.000	0.036	3.467	31250	14.4	3.886	143	6.1	31.3	0.0	0.003	7719	7559	20m.pg152_o2_nofp.cx8a4_bee
998	8107	0	0.0	80.9	6.1	0.000	0.000	0.081	6.231	31555	14.7	3.892	145	6.1	21.6	0.0	0.003	7767	7577	20m.pg152_o2_nofp.cx8a9_bee
998	8217	0	0.0	33.9	3.4	0.000	0.000	0.034	3.484	31920	14.6	3.885	142	6.1	31.1	0.0	0.003	7735	7559	20m.pg152_o2_nofp.cx8a10_bee
998	8065	0	0.0	32.8	3.4	0.000	0.000	0.033	3.517	31371	14.7	3.890	146	6.1	30.3	0.0	0.004	7733	7559	20m.pg152_o2_nofp.cx8a12_bee
998	7991	0	0.0	35.0	3.4	0.000	0.000	0.035	3.507	31105	14.5	3.893	145	6.1	29.9	0.0	0.003	7622	7416	20m.pg152_o2_nofp.cx8a14_bee
998	8039	0	0.0	40.8	3.2	0.000	0.000	0.041	3.327	31232	14.4	3.885	143	6.1	16.1	0.0	0.004	7719	7559	20m.pg152_o2_nofp.cx8a15_bee
998	8088	0	0.0	27.6	3.1	0.000	0.000	0.028	3.137	31517	14.7	3.897	145	4.9	36.2	0.0	0.004	7686	7543	20m.pg152_o2_nofp.cx8a16_bee
998	8059	0	0.0	33.1	3.4	0.000	0.000	0.033	3.483	31325	14.4	3.887	143	6.1	30.2	0.0	0.004	7719	7574	20m.pg152_o2_nofp.cx8a17_bee
998	7934	0	0.0	22.8	2.8	0.000	0.000	0.023	2.845	30838	14.2	3.887	143	5.0	42.7	0.0	0.003	7591	7463	20m.pg152_o2_nofp.cx8a18_bee
l.i0
- l.i0: load without secondary indexes
- Legend for results is here.
- Each entry lists the percentage of responses that fit in that bucket (slower than max time for previous bucket, faster than min time for next bucket).
Insert response time histogram
256us	1ms	4ms	16ms	64ms	256ms	1s	4s	16s	gt	max	tag
0.000	0.000	100.000	0.000	0.000	0.000	0.000	0.000	0.000	0.000	0.003	pg152_o2_nofp.cx8_bee
0.000	0.000	100.000	0.000	0.000	0.000	0.000	0.000	0.000	0.000	0.003	pg152_o2_nofp.cx8a1_bee
0.000	0.000	100.000	0.000	0.000	0.000	0.000	0.000	0.000	0.000	0.003	pg152_o2_nofp.cx8a2_bee
0.000	0.000	100.000	0.000	0.000	0.000	0.000	0.000	0.000	0.000	0.003	pg152_o2_nofp.cx8a3_bee
0.000	0.000	100.000	0.000	0.000	0.000	0.000	0.000	0.000	0.000	0.003	pg152_o2_nofp.cx8a4_bee
0.000	0.000	100.000	0.000	0.000	0.000	0.000	0.000	0.000	0.000	0.003	pg152_o2_nofp.cx8a9_bee
0.000	0.000	100.000	0.000	0.000	0.000	0.000	0.000	0.000	0.000	0.004	pg152_o2_nofp.cx8a10_bee
0.000	0.000	100.000	0.000	0.000	0.000	0.000	0.000	0.000	0.000	0.003	pg152_o2_nofp.cx8a12_bee
0.000	0.000	100.000	0.000	0.000	0.000	0.000	0.000	0.000	0.000	0.004	pg152_o2_nofp.cx8a14_bee
0.000	0.000	100.000	0.000	0.000	0.000	0.000	0.000	0.000	0.000	0.003	pg152_o2_nofp.cx8a15_bee
0.000	0.000	100.000	0.000	0.000	0.000	0.000	0.000	0.000	0.000	0.003	pg152_o2_nofp.cx8a16_bee
0.000	0.000	100.000	0.000	0.000	0.000	0.000	0.000	0.000	0.000	0.003	pg152_o2_nofp.cx8a17_bee
0.000	0.000	100.000	0.000	0.000	0.000	0.000	0.000	0.000	0.000	0.003	pg152_o2_nofp.cx8a18_bee
l.x
- l.x: create secondary indexes
- Legend for results is here.
- Each entry lists the percentage of responses that fit in that bucket (slower than max time for previous bucket, faster than min time for next bucket).
TODO - determine whether there is data for create index response time
l.i1
- l.i1: continue load after secondary indexes created
- Legend for results is here.
- Each entry lists the percentage of responses that fit in that bucket (slower than max time for previous bucket, faster than min time for next bucket).
Insert response time histogram
256us	1ms	4ms	16ms	64ms	256ms	1s	4s	16s	gt	max	tag
0.000	0.000	99.996	0.004	0.000	0.000	0.000	0.000	0.000	0.000	0.013	pg152_o2_nofp.cx8_bee
0.000	0.000	99.975	0.025	0.000	0.000	0.000	0.000	0.000	0.000	0.010	pg152_o2_nofp.cx8a1_bee
0.000	0.000	99.997	0.002	nonzero	0.000	0.000	0.000	0.000	0.000	0.021	pg152_o2_nofp.cx8a2_bee
0.000	0.000	99.998	0.002	nonzero	0.000	0.000	0.000	0.000	0.000	0.023	pg152_o2_nofp.cx8a3_bee
0.000	0.000	99.997	0.002	0.001	0.000	0.000	0.000	0.000	0.000	0.030	pg152_o2_nofp.cx8a4_bee
0.000	0.000	99.999	0.002	0.000	0.000	0.000	0.000	0.000	0.000	0.007	pg152_o2_nofp.cx8a9_bee
0.000	0.000	99.995	0.004	0.001	0.000	0.000	0.000	0.000	0.000	0.048	pg152_o2_nofp.cx8a10_bee
0.000	0.000	99.998	0.002	nonzero	0.000	0.000	0.000	0.000	0.000	0.020	pg152_o2_nofp.cx8a12_bee
0.000	0.000	99.996	0.003	nonzero	0.000	0.000	0.000	0.000	0.000	0.022	pg152_o2_nofp.cx8a14_bee
0.000	0.000	99.991	0.006	0.003	0.000	0.000	0.000	0.000	0.000	0.054	pg152_o2_nofp.cx8a15_bee
0.000	0.000	99.997	0.003	nonzero	0.000	0.000	0.000	0.000	0.000	0.035	pg152_o2_nofp.cx8a16_bee
0.000	0.000	99.999	0.001	nonzero	0.000	0.000	0.000	0.000	0.000	0.026	pg152_o2_nofp.cx8a17_bee
0.000	0.000	99.989	0.011	nonzero	0.000	0.000	0.000	0.000	0.000	0.026	pg152_o2_nofp.cx8a18_bee
Delete response time histogram
256us	1ms	4ms	16ms	64ms	256ms	1s	4s	16s	gt	max	tag
0.101	84.262	0.349	5.252	10.036	nonzero	0.000	0.000	0.000	0.000	0.074	pg152_o2_nofp.cx8_bee
0.083	84.038	1.194	4.821	9.863	0.000	0.000	0.000	0.000	0.000	0.050	pg152_o2_nofp.cx8a1_bee
0.083	84.433	1.000	4.976	9.508	nonzero	0.000	0.000	0.000	0.000	0.084	pg152_o2_nofp.cx8a2_bee
0.083	83.870	1.042	4.666	10.339	0.000	0.000	0.000	0.000	0.000	0.048	pg152_o2_nofp.cx8a3_bee
0.095	84.091	1.366	4.941	9.507	0.000	0.000	0.000	0.000	0.000	0.049	pg152_o2_nofp.cx8a4_bee
0.080	83.885	1.675	4.744	9.616	0.000	0.000	0.000	0.000	0.000	0.047	pg152_o2_nofp.cx8a9_bee
0.095	84.472	1.408	5.212	8.813	0.000	0.000	0.000	0.000	0.000	0.049	pg152_o2_nofp.cx8a10_bee
0.099	83.288	1.892	5.322	9.398	0.000	0.000	0.000	0.000	0.000	0.049	pg152_o2_nofp.cx8a12_bee
0.091	83.778	0.714	5.276	10.140	nonzero	0.000	0.000	0.000	0.000	0.081	pg152_o2_nofp.cx8a14_bee
0.080	84.526	0.534	4.994	9.867	0.000	0.000	0.000	0.000	0.000	0.046	pg152_o2_nofp.cx8a15_bee
0.138	82.953	2.873	14.036	nonzero	0.000	0.000	0.000	0.000	0.000	0.036	pg152_o2_nofp.cx8a16_bee
0.096	84.409	1.378	4.732	9.385	0.000	0.000	0.000	0.000	0.000	0.049	pg152_o2_nofp.cx8a17_bee
0.106	82.910	3.061	13.923	nonzero	0.000	0.000	0.000	0.000	0.000	0.024	pg152_o2_nofp.cx8a18_bee
q100.1
- q100.1: range queries with 100 insert/s per client
- Legend for results is here.
- Each entry lists the percentage of responses that fit in that bucket (slower than max time for previous bucket, faster than min time for next bucket).
Query response time histogram
256us	1ms	4ms	16ms	64ms	256ms	1s	4s	16s	gt	max	tag
99.949	0.050	nonzero	0.000	0.000	0.000	0.000	0.000	0.000	0.000	0.003	pg152_o2_nofp.cx8_bee
99.938	0.062	nonzero	nonzero	0.000	0.000	0.000	0.000	0.000	0.000	0.004	pg152_o2_nofp.cx8a1_bee
99.941	0.059	0.001	nonzero	0.000	0.000	0.000	0.000	0.000	0.000	0.006	pg152_o2_nofp.cx8a2_bee
99.947	0.053	nonzero	0.000	0.000	0.000	0.000	0.000	0.000	0.000	0.004	pg152_o2_nofp.cx8a3_bee
99.926	0.074	nonzero	0.000	0.000	0.000	0.000	0.000	0.000	0.000	0.004	pg152_o2_nofp.cx8a4_bee
99.950	0.050	nonzero	0.000	0.000	0.000	0.000	0.000	0.000	0.000	0.003	pg152_o2_nofp.cx8a9_bee
99.962	0.038	nonzero	0.000	0.000	0.000	0.000	0.000	0.000	0.000	0.003	pg152_o2_nofp.cx8a10_bee
99.960	0.040	nonzero	nonzero	0.000	0.000	0.000	0.000	0.000	0.000	0.004	pg152_o2_nofp.cx8a12_bee
99.946	0.054	nonzero	0.000	0.000	0.000	0.000	0.000	0.000	0.000	0.003	pg152_o2_nofp.cx8a14_bee
99.949	0.051	nonzero	0.000	0.000	0.000	0.000	0.000	0.000	0.000	0.003	pg152_o2_nofp.cx8a15_bee
99.947	0.053	nonzero	0.000	0.000	0.000	0.000	0.000	0.000	0.000	0.003	pg152_o2_nofp.cx8a16_bee
99.946	0.053	nonzero	0.000	0.000	0.000	0.000	0.000	0.000	0.000	0.003	pg152_o2_nofp.cx8a17_bee
99.935	0.065	nonzero	nonzero	0.000	0.000	0.000	0.000	0.000	0.000	0.004	pg152_o2_nofp.cx8a18_bee
Insert response time histogram
256us	1ms	4ms	16ms	64ms	256ms	1s	4s	16s	gt	max	tag
0.000	0.000	99.667	0.333	0.000	0.000	0.000	0.000	0.000	0.000	0.007	pg152_o2_nofp.cx8_bee
0.000	0.000	69.278	30.722	0.000	0.000	0.000	0.000	0.000	0.000	0.006	pg152_o2_nofp.cx8a1_bee
0.000	0.000	99.778	0.222	0.000	0.000	0.000	0.000	0.000	0.000	0.008	pg152_o2_nofp.cx8a2_bee
0.000	0.000	99.889	0.111	0.000	0.000	0.000	0.000	0.000	0.000	0.006	pg152_o2_nofp.cx8a3_bee
0.000	0.000	99.917	0.083	0.000	0.000	0.000	0.000	0.000	0.000	0.005	pg152_o2_nofp.cx8a4_bee
0.000	0.000	99.889	0.111	0.000	0.000	0.000	0.000	0.000	0.000	0.006	pg152_o2_nofp.cx8a9_bee
0.000	0.000	99.944	0.056	0.000	0.000	0.000	0.000	0.000	0.000	0.006	pg152_o2_nofp.cx8a10_bee
0.000	0.000	99.889	0.111	0.000	0.000	0.000	0.000	0.000	0.000	0.006	pg152_o2_nofp.cx8a12_bee
0.000	0.000	99.861	0.139	0.000	0.000	0.000	0.000	0.000	0.000	0.007	pg152_o2_nofp.cx8a14_bee
0.000	0.000	99.889	0.111	0.000	0.000	0.000	0.000	0.000	0.000	0.006	pg152_o2_nofp.cx8a15_bee
0.000	0.000	99.917	0.083	0.000	0.000	0.000	0.000	0.000	0.000	0.005	pg152_o2_nofp.cx8a16_bee
0.000	0.000	99.806	0.194	0.000	0.000	0.000	0.000	0.000	0.000	0.005	pg152_o2_nofp.cx8a17_bee
0.000	0.000	68.944	31.056	0.000	0.000	0.000	0.000	0.000	0.000	0.006	pg152_o2_nofp.cx8a18_bee
Delete response time histogram
256us	1ms	4ms	16ms	64ms	256ms	1s	4s	16s	gt	max	tag
0.000	23.889	76.028	0.083	0.000	0.000	0.000	0.000	0.000	0.000	0.005	pg152_o2_nofp.cx8_bee
0.833	97.639	1.472	0.056	0.000	0.000	0.000	0.000	0.000	0.000	0.005	pg152_o2_nofp.cx8a1_bee
0.056	23.167	76.667	0.111	0.000	0.000	0.000	0.000	0.000	0.000	0.005	pg152_o2_nofp.cx8a2_bee
0.417	91.806	7.778	0.000	0.000	0.000	0.000	0.000	0.000	0.000	0.001	pg152_o2_nofp.cx8a3_bee
0.917	99.056	0.028	0.000	0.000	0.000	0.000	0.000	0.000	0.000	0.002	pg152_o2_nofp.cx8a4_bee
0.389	99.583	0.028	0.000	0.000	0.000	0.000	0.000	0.000	0.000	0.001	pg152_o2_nofp.cx8a9_bee
0.556	99.361	0.083	0.000	0.000	0.000	0.000	0.000	0.000	0.000	0.003	pg152_o2_nofp.cx8a10_bee
0.556	99.389	0.056	0.000	0.000	0.000	0.000	0.000	0.000	0.000	0.003	pg152_o2_nofp.cx8a12_bee
0.667	99.278	0.056	0.000	0.000	0.000	0.000	0.000	0.000	0.000	0.002	pg152_o2_nofp.cx8a14_bee
0.000	26.167	73.778	0.056	0.000	0.000	0.000	0.000	0.000	0.000	0.005	pg152_o2_nofp.cx8a15_bee
0.556	94.722	4.722	0.000	0.000	0.000	0.000	0.000	0.000	0.000	0.003	pg152_o2_nofp.cx8a16_bee
0.083	39.972	59.694	0.250	0.000	0.000	0.000	0.000	0.000	0.000	0.007	pg152_o2_nofp.cx8a17_bee
0.556	99.417	0.028	0.000	0.000	0.000	0.000	0.000	0.000	0.000	0.002	pg152_o2_nofp.cx8a18_bee
q500.1
- q500.1: range queries with 500 insert/s per client
- Legend for results is here.
- Each entry lists the percentage of responses that fit in that bucket (slower than max time for previous bucket, faster than min time for next bucket).
Query response time histogram
256us	1ms	4ms	16ms	64ms	256ms	1s	4s	16s	gt	max	tag
99.949	0.051	nonzero	nonzero	0.000	0.000	0.000	0.000	0.000	0.000	0.004	pg152_o2_nofp.cx8_bee
99.956	0.044	nonzero	0.000	0.000	0.000	0.000	0.000	0.000	0.000	0.003	pg152_o2_nofp.cx8a1_bee
99.949	0.051	nonzero	nonzero	0.000	0.000	0.000	0.000	0.000	0.000	0.004	pg152_o2_nofp.cx8a2_bee
99.953	0.047	nonzero	nonzero	0.000	0.000	0.000	0.000	0.000	0.000	0.004	pg152_o2_nofp.cx8a3_bee
99.946	0.054	nonzero	nonzero	0.000	0.000	0.000	0.000	0.000	0.000	0.005	pg152_o2_nofp.cx8a4_bee
99.943	0.057	nonzero	0.000	0.000	0.000	0.000	0.000	0.000	0.000	0.003	pg152_o2_nofp.cx8a9_bee
99.946	0.053	nonzero	0.000	0.000	0.000	0.000	0.000	0.000	0.000	0.003	pg152_o2_nofp.cx8a10_bee
99.956	0.044	nonzero	0.000	0.000	0.000	0.000	0.000	0.000	0.000	0.003	pg152_o2_nofp.cx8a12_bee
99.944	0.056	nonzero	0.000	0.000	0.000	0.000	0.000	0.000	0.000	0.003	pg152_o2_nofp.cx8a14_bee
99.943	0.057	nonzero	nonzero	0.000	0.000	0.000	0.000	0.000	0.000	0.006	pg152_o2_nofp.cx8a15_bee
99.954	0.046	nonzero	0.000	0.000	0.000	0.000	0.000	0.000	0.000	0.003	pg152_o2_nofp.cx8a16_bee
99.941	0.059	nonzero	nonzero	0.000	0.000	0.000	0.000	0.000	0.000	0.004	pg152_o2_nofp.cx8a17_bee
99.935	0.065	nonzero	0.000	0.000	0.000	0.000	0.000	0.000	0.000	0.004	pg152_o2_nofp.cx8a18_bee
Insert response time histogram
256us	1ms	4ms	16ms	64ms	256ms	1s	4s	16s	gt	max	tag
0.000	0.000	99.961	0.039	0.000	0.000	0.000	0.000	0.000	0.000	0.005	pg152_o2_nofp.cx8_bee
0.000	0.000	93.594	6.406	0.000	0.000	0.000	0.000	0.000	0.000	0.006	pg152_o2_nofp.cx8a1_bee
0.000	0.000	99.978	0.022	0.000	0.000	0.000	0.000	0.000	0.000	0.006	pg152_o2_nofp.cx8a2_bee
0.000	0.000	99.972	0.028	0.000	0.000	0.000	0.000	0.000	0.000	0.008	pg152_o2_nofp.cx8a3_bee
0.000	0.000	99.917	0.083	0.000	0.000	0.000	0.000	0.000	0.000	0.007	pg152_o2_nofp.cx8a4_bee
0.000	0.000	99.922	0.078	0.000	0.000	0.000	0.000	0.000	0.000	0.006	pg152_o2_nofp.cx8a9_bee
0.000	0.000	99.928	0.072	0.000	0.000	0.000	0.000	0.000	0.000	0.007	pg152_o2_nofp.cx8a10_bee
0.000	0.000	99.961	0.039	0.000	0.000	0.000	0.000	0.000	0.000	0.009	pg152_o2_nofp.cx8a12_bee
0.000	0.000	99.967	0.033	0.000	0.000	0.000	0.000	0.000	0.000	0.006	pg152_o2_nofp.cx8a14_bee
0.000	0.000	99.944	0.056	0.000	0.000	0.000	0.000	0.000	0.000	0.008	pg152_o2_nofp.cx8a15_bee
0.000	0.000	99.944	0.050	0.006	0.000	0.000	0.000	0.000	0.000	0.040	pg152_o2_nofp.cx8a16_bee
0.000	0.000	99.972	0.028	0.000	0.000	0.000	0.000	0.000	0.000	0.006	pg152_o2_nofp.cx8a17_bee
0.000	0.000	92.911	7.089	0.000	0.000	0.000	0.000	0.000	0.000	0.008	pg152_o2_nofp.cx8a18_bee
Delete response time histogram
256us	1ms	4ms	16ms	64ms	256ms	1s	4s	16s	gt	max	tag
4.911	86.583	0.994	7.500	0.011	0.000	0.000	0.000	0.000	0.000	0.017	pg152_o2_nofp.cx8_bee
3.228	76.100	0.072	20.600	0.000	0.000	0.000	0.000	0.000	0.000	0.015	pg152_o2_nofp.cx8a1_bee
5.367	83.356	3.667	7.611	0.000	0.000	0.000	0.000	0.000	0.000	0.015	pg152_o2_nofp.cx8a2_bee
3.450	74.311	0.117	22.122	0.000	0.000	0.000	0.000	0.000	0.000	0.015	pg152_o2_nofp.cx8a3_bee
3.806	73.756	0.089	22.350	0.000	0.000	0.000	0.000	0.000	0.000	0.011	pg152_o2_nofp.cx8a4_bee
3.067	75.406	0.089	21.439	0.000	0.000	0.000	0.000	0.000	0.000	0.010	pg152_o2_nofp.cx8a9_bee
4.067	71.067	0.089	24.778	0.000	0.000	0.000	0.000	0.000	0.000	0.013	pg152_o2_nofp.cx8a10_bee
2.967	76.006	0.133	20.894	0.000	0.000	0.000	0.000	0.000	0.000	0.011	pg152_o2_nofp.cx8a12_bee
3.883	75.400	0.122	20.594	0.000	0.000	0.000	0.000	0.000	0.000	0.010	pg152_o2_nofp.cx8a14_bee
4.667	87.689	0.094	7.544	0.006	0.000	0.000	0.000	0.000	0.000	0.016	pg152_o2_nofp.cx8a15_bee
3.556	76.789	0.211	19.433	0.011	0.000	0.000	0.000	0.000	0.000	0.022	pg152_o2_nofp.cx8a16_bee
7.133	80.278	8.672	3.917	0.000	0.000	0.000	0.000	0.000	0.000	0.015	pg152_o2_nofp.cx8a17_bee
3.883	74.961	5.494	15.661	0.000	0.000	0.000	0.000	0.000	0.000	0.010	pg152_o2_nofp.cx8a18_bee
q1000.1
- q1000.1: range queries with 1000 insert/s per client
- Legend for results is here.
- Each entry lists the percentage of responses that fit in that bucket (slower than max time for previous bucket, faster than min time for next bucket).
Query response time histogram
256us	1ms	4ms	16ms	64ms	256ms	1s	4s	16s	gt	max	tag
99.945	0.055	nonzero	nonzero	0.000	0.000	0.000	0.000	0.000	0.000	0.004	pg152_o2_nofp.cx8_bee
99.961	0.039	nonzero	0.000	0.000	0.000	0.000	0.000	0.000	0.000	0.003	pg152_o2_nofp.cx8a1_bee
99.949	0.051	nonzero	nonzero	0.000	0.000	0.000	0.000	0.000	0.000	0.005	pg152_o2_nofp.cx8a2_bee
99.960	0.040	nonzero	0.000	0.000	0.000	0.000	0.000	0.000	0.000	0.002	pg152_o2_nofp.cx8a3_bee
99.953	0.047	nonzero	0.000	0.000	0.000	0.000	0.000	0.000	0.000	0.003	pg152_o2_nofp.cx8a4_bee
99.948	0.052	nonzero	0.000	0.000	0.000	0.000	0.000	0.000	0.000	0.003	pg152_o2_nofp.cx8a9_bee
99.954	0.046	nonzero	0.000	0.000	0.000	0.000	0.000	0.000	0.000	0.003	pg152_o2_nofp.cx8a10_bee
99.945	0.055	nonzero	nonzero	0.000	0.000	0.000	0.000	0.000	0.000	0.004	pg152_o2_nofp.cx8a12_bee
99.944	0.056	nonzero	0.000	0.000	0.000	0.000	0.000	0.000	0.000	0.003	pg152_o2_nofp.cx8a14_bee
99.955	0.044	nonzero	nonzero	0.000	0.000	0.000	0.000	0.000	0.000	0.004	pg152_o2_nofp.cx8a15_bee
99.946	0.054	nonzero	0.000	0.000	0.000	0.000	0.000	0.000	0.000	0.004	pg152_o2_nofp.cx8a16_bee
99.952	0.048	nonzero	nonzero	0.000	0.000	0.000	0.000	0.000	0.000	0.004	pg152_o2_nofp.cx8a17_bee
99.946	0.054	nonzero	0.000	0.000	0.000	0.000	0.000	0.000	0.000	0.003	pg152_o2_nofp.cx8a18_bee
Insert response time histogram
256us	1ms	4ms	16ms	64ms	256ms	1s	4s	16s	gt	max	tag
0.000	0.000	99.983	0.017	0.000	0.000	0.000	0.000	0.000	0.000	0.005	pg152_o2_nofp.cx8_bee
0.000	0.000	96.956	3.044	0.000	0.000	0.000	0.000	0.000	0.000	0.006	pg152_o2_nofp.cx8a1_bee
0.000	0.000	99.989	0.011	0.000	0.000	0.000	0.000	0.000	0.000	0.006	pg152_o2_nofp.cx8a2_bee
0.000	0.000	99.992	0.008	0.000	0.000	0.000	0.000	0.000	0.000	0.006	pg152_o2_nofp.cx8a3_bee
0.000	0.000	99.989	0.011	0.000	0.000	0.000	0.000	0.000	0.000	0.007	pg152_o2_nofp.cx8a4_bee
0.000	0.000	99.986	0.014	0.000	0.000	0.000	0.000	0.000	0.000	0.007	pg152_o2_nofp.cx8a9_bee
0.000	0.000	99.992	0.008	0.000	0.000	0.000	0.000	0.000	0.000	0.006	pg152_o2_nofp.cx8a10_bee
0.000	0.000	99.989	0.011	0.000	0.000	0.000	0.000	0.000	0.000	0.007	pg152_o2_nofp.cx8a12_bee
0.000	0.000	99.986	0.014	0.000	0.000	0.000	0.000	0.000	0.000	0.005	pg152_o2_nofp.cx8a14_bee
0.000	0.000	99.989	0.011	0.000	0.000	0.000	0.000	0.000	0.000	0.007	pg152_o2_nofp.cx8a15_bee
0.000	0.000	99.992	0.008	0.000	0.000	0.000	0.000	0.000	0.000	0.006	pg152_o2_nofp.cx8a16_bee
0.000	0.000	99.986	0.014	0.000	0.000	0.000	0.000	0.000	0.000	0.005	pg152_o2_nofp.cx8a17_bee
0.000	0.000	96.806	3.194	0.000	0.000	0.000	0.000	0.000	0.000	0.007	pg152_o2_nofp.cx8a18_bee
Delete response time histogram
256us	1ms	4ms	16ms	64ms	256ms	1s	4s	16s	gt	max	tag
3.058	78.431	6.822	11.689	0.000	0.000	0.000	0.000	0.000	0.000	0.015	pg152_o2_nofp.cx8_bee
2.078	76.911	0.092	13.944	6.975	0.000	0.000	0.000	0.000	0.000	0.022	pg152_o2_nofp.cx8a1_bee
3.319	79.331	6.050	11.300	0.000	0.000	0.000	0.000	0.000	0.000	0.016	pg152_o2_nofp.cx8a2_bee
2.444	79.106	0.089	10.983	7.378	0.000	0.000	0.000	0.000	0.000	0.022	pg152_o2_nofp.cx8a3_bee
2.800	76.908	0.567	19.500	0.225	0.000	0.000	0.000	0.000	0.000	0.019	pg152_o2_nofp.cx8a4_bee
1.767	75.164	1.814	20.625	0.631	0.000	0.000	0.000	0.000	0.000	0.019	pg152_o2_nofp.cx8a9_bee
3.356	74.747	0.081	21.556	0.261	0.000	0.000	0.000	0.000	0.000	0.020	pg152_o2_nofp.cx8a10_bee
2.964	72.331	0.408	23.983	0.314	0.000	0.000	0.000	0.000	0.000	0.019	pg152_o2_nofp.cx8a12_bee
2.572	72.947	1.081	23.103	0.297	0.000	0.000	0.000	0.000	0.000	0.019	pg152_o2_nofp.cx8a14_bee
3.544	81.286	4.808	10.361	0.000	0.000	0.000	0.000	0.000	0.000	0.015	pg152_o2_nofp.cx8a15_bee
3.642	80.103	0.081	16.175	0.000	0.000	0.000	0.000	0.000	0.000	0.013	pg152_o2_nofp.cx8a16_bee
2.936	76.686	9.086	11.292	0.000	0.000	0.000	0.000	0.000	0.000	0.016	pg152_o2_nofp.cx8a17_bee
2.047	76.272	11.322	10.358	0.000	0.000	0.000	0.000	0.000	0.000	0.009	pg152_o2_nofp.cx8a18_bee