Introduction
This is a report for the insert benchmark with 20M docs and 1 client(s). It is generated by scripts (bash, awk, sed) and Tufte might not be impressed. An overview of the insert benchmark is here and a short update is here. Below, by DBMS, I mean DBMS+version.config. An example is my8020.c10b40 where my means MySQL, 8020 is version 8.0.20 and c10b40 is the name for the configuration file.
The test server has 8 AMD cores, 16G RAM and an NVMe SSD. It is described here as the Beelink. The benchmark was run with 1 client and there were 1 or 3 connections per client (1 for queries or inserts without rate limits, 1+1 for rate limited inserts+deletes). It uses 1 table. It loads 20M rows per table without secondary indexes, creates secondary indexes, then inserts 50M rows per table with a delete per insert to avoid growing the table. It then does 3 read+write tests for 1800s each that do queries as fast as possible with 100, 500 and then 1000 inserts/second/client concurrent with the queries and 1000 deletes/second to avoid growing the table. The database is cached by the OS page cache but not by the storage engine. Clients and the DBMS share one server. The per-database configs are in the per-database subdirectories here.
The tested DBMS are:
- pg152_o2_nofp.cx8_1g_bee - Postgres 15.2, cx8_1g_bee config, o2_nofp build that used: -O2 -no-omit-frame-pointer
- pg152_o2_nofp.cx8a1_1g_bee - Postgres 15.2, cx8a1_1g_bee config, o2_nofp build that used: -O2 -no-omit-frame-pointer, adds wal_compression=lz4
- pg152_o2_nofp.cx8a2_1g_bee - Postgres 15.2, cx8a2_1g_bee config, o2_nofp build that used: -O2 -no-omit-frame-pointer, adds backend_flush_after=256kb
- pg152_o2_nofp.cx8a3_1g_bee - Postgres 15.2, cx8a3_1g_bee config, o2_nofp build that used: -O2 -no-omit-frame-pointer, adds full_page_writes=off
- pg152_o2_nofp.cx8a4_1g_bee - Postgres 15.2, cx8a4_1g_bee config, o2_nofp build that used: -O2 -no-omit-frame-pointer, adds checkpoint_timeout=1800s which already set in the cx8_1g_bee config
- pg152_o2_nofp.cx8a9_1g_bee - Postgres 15.2, cx8a9_1g_bee config, o2_nofp build that used: -O2 -no-omit-frame-pointer, adds checkpoint_timeout=900s
- pg152_o2_nofp.cx8a10_1g_bee - Postgres 15.2, cx8a10_1g_bee config, o2_nofp build that used: -O2 -no-omit-frame-pointer, adds autovacuum_work_mem=256MB
- pg152_o2_nofp.cx8a12_1g_bee - Postgres 15.2, cx8a12_1g_bee config, o2_nofp build that used: -O2 -no-omit-frame-pointer, adds wal_buffers=64MB
- pg152_o2_nofp.cx8a14_1g_bee - Postgres 15.2, cx8a14_1g_bee config, o2_nofp build that used: -O2 -no-omit-frame-pointer, adds backend_flush_after=1MB
- pg152_o2_nofp.cx8a15_1g_bee - Postgres 15.2, cx8a15_1g_bee config, o2_nofp build that used: -O2 -no-omit-frame-pointer, adds max_wal_size=10G
- pg152_o2_nofp.cx8a16_1g_bee - Postgres 15.2, cx8a16_1g_bee config, o2_nofp build that used: -O2 -no-omit-frame-pointer, adds autovacuum_vacuum_scale_factor=0.05 autovacuum_vacuum_insert_scale_factor=0.05
- pg152_o2_nofp.cx8a17_1g_bee - Postgres 15.2, cx8a17_1g_bee config, o2_nofp build that used: -O2 -no-omit-frame-pointer, reduces bgwriter_lru_maxpages from 2000 to 500
- pg152_o2_nofp.cx8a18_1g_bee - Postgres 15.2, cx8a18_1g_bee config, o2_nofp build that used: -O2 -no-omit-frame-pointer, combines a1, a10, a12, a16
Contents
- Summary
- l.i0: load without secondary indexes
- l.x: create secondary indexes
- l.i1: continue load after secondary indexes created
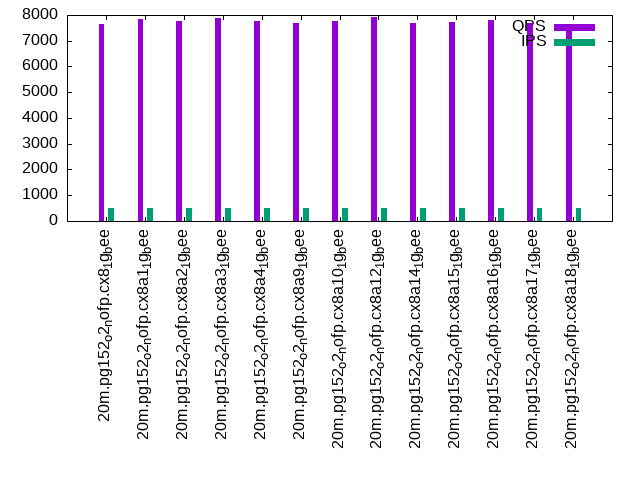
- q100.1: range queries with 100 insert/s per client
- q500.1: range queries with 500 insert/s per client
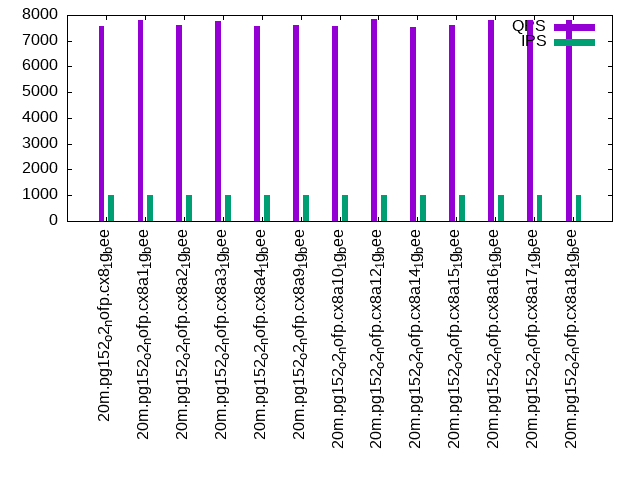
- q1000.1: range queries with 1000 insert/s per client
Summary
The numbers are inserts/s for l.i0 and l.i1, indexed docs (or rows) /s for l.x and queries/s for q*.2. The values are the average rate over the entire test for inserts (IPS) and queries (QPS). The range of values for IPS and QPS is split into 3 parts: bottom 25%, middle 50%, top 25%. Values in the bottom 25% have a red background, values in the top 25% have a green background and values in the middle have no color. A gray background is used for values that can be ignored because the DBMS did not sustain the target insert rate. Red backgrounds are not used when the minimum value is within 80% of the max value.
| dbms | l.i0 | l.x | l.i1 | q100.1 | q500.1 | q1000.1 |
|---|---|---|---|---|---|---|
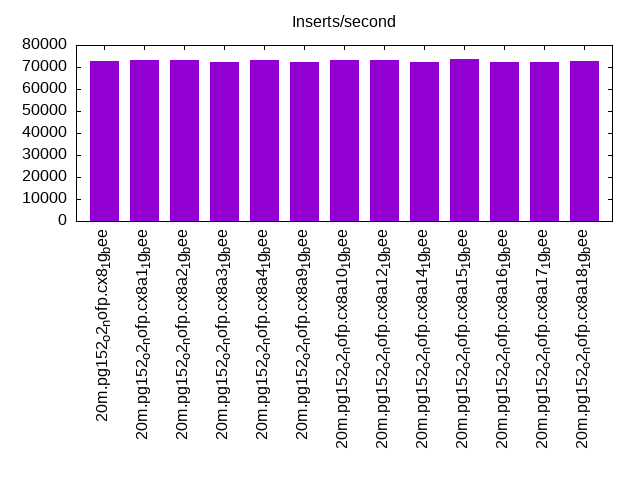
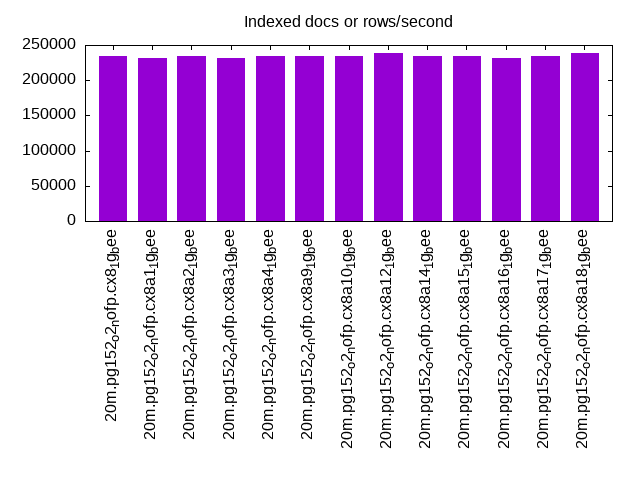
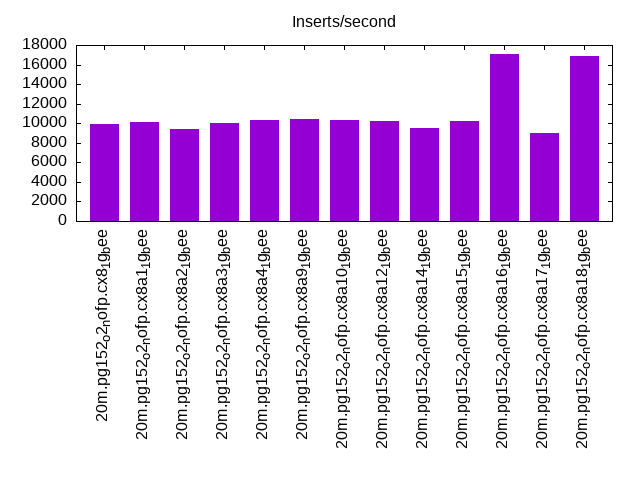
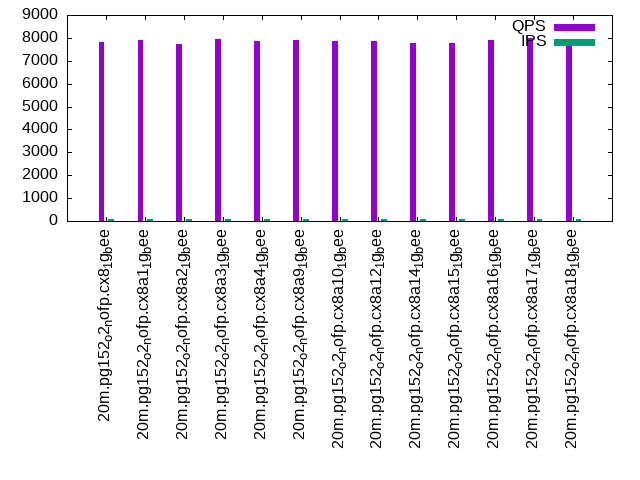
| 20m.pg152_o2_nofp.cx8_1g_bee | 72727 | 233721 | 9897 | 7803 | 7668 | 7588 |
| 20m.pg152_o2_nofp.cx8a1_1g_bee | 73260 | 231034 | 10091 | 7900 | 7859 | 7803 |
| 20m.pg152_o2_nofp.cx8a2_1g_bee | 72993 | 233721 | 9432 | 7720 | 7763 | 7617 |
| 20m.pg152_o2_nofp.cx8a3_1g_bee | 72464 | 231034 | 9996 | 7947 | 7884 | 7762 |
| 20m.pg152_o2_nofp.cx8a4_1g_bee | 73260 | 233721 | 10339 | 7863 | 7774 | 7580 |
| 20m.pg152_o2_nofp.cx8a9_1g_bee | 72464 | 233721 | 10410 | 7912 | 7671 | 7614 |
| 20m.pg152_o2_nofp.cx8a10_1g_bee | 72993 | 233721 | 10333 | 7874 | 7777 | 7562 |
| 20m.pg152_o2_nofp.cx8a12_1g_bee | 73260 | 239286 | 10202 | 7854 | 7919 | 7844 |
| 20m.pg152_o2_nofp.cx8a14_1g_bee | 72464 | 233721 | 9535 | 7760 | 7692 | 7546 |
| 20m.pg152_o2_nofp.cx8a15_1g_bee | 73529 | 233721 | 10204 | 7778 | 7732 | 7599 |
| 20m.pg152_o2_nofp.cx8a16_1g_bee | 72202 | 231034 | 17036 | 7901 | 7791 | 7788 |
| 20m.pg152_o2_nofp.cx8a17_1g_bee | 72464 | 233721 | 9042 | 8015 | 7689 | 7800 |
| 20m.pg152_o2_nofp.cx8a18_1g_bee | 72727 | 239286 | 16900 | 7761 | 7637 | 7798 |
This table has relative throughput, throughput for the DBMS relative to the DBMS in the first line, using the absolute throughput from the previous table.
| dbms | l.i0 | l.x | l.i1 | q100.1 | q500.1 | q1000.1 |
|---|---|---|---|---|---|---|
| 20m.pg152_o2_nofp.cx8_1g_bee | 1.00 | 1.00 | 1.00 | 1.00 | 1.00 | 1.00 |
| 20m.pg152_o2_nofp.cx8a1_1g_bee | 1.01 | 0.99 | 1.02 | 1.01 | 1.02 | 1.03 |
| 20m.pg152_o2_nofp.cx8a2_1g_bee | 1.00 | 1.00 | 0.95 | 0.99 | 1.01 | 1.00 |
| 20m.pg152_o2_nofp.cx8a3_1g_bee | 1.00 | 0.99 | 1.01 | 1.02 | 1.03 | 1.02 |
| 20m.pg152_o2_nofp.cx8a4_1g_bee | 1.01 | 1.00 | 1.04 | 1.01 | 1.01 | 1.00 |
| 20m.pg152_o2_nofp.cx8a9_1g_bee | 1.00 | 1.00 | 1.05 | 1.01 | 1.00 | 1.00 |
| 20m.pg152_o2_nofp.cx8a10_1g_bee | 1.00 | 1.00 | 1.04 | 1.01 | 1.01 | 1.00 |
| 20m.pg152_o2_nofp.cx8a12_1g_bee | 1.01 | 1.02 | 1.03 | 1.01 | 1.03 | 1.03 |
| 20m.pg152_o2_nofp.cx8a14_1g_bee | 1.00 | 1.00 | 0.96 | 0.99 | 1.00 | 0.99 |
| 20m.pg152_o2_nofp.cx8a15_1g_bee | 1.01 | 1.00 | 1.03 | 1.00 | 1.01 | 1.00 |
| 20m.pg152_o2_nofp.cx8a16_1g_bee | 0.99 | 0.99 | 1.72 | 1.01 | 1.02 | 1.03 |
| 20m.pg152_o2_nofp.cx8a17_1g_bee | 1.00 | 1.00 | 0.91 | 1.03 | 1.00 | 1.03 |
| 20m.pg152_o2_nofp.cx8a18_1g_bee | 1.00 | 1.02 | 1.71 | 0.99 | 1.00 | 1.03 |
This lists the average rate of inserts/s for the tests that do inserts concurrent with queries. For such tests the query rate is listed in the table above. The read+write tests are setup so that the insert rate should match the target rate every second. Cells that are not at least 95% of the target have a red background to indicate a failure to satisfy the target.
| dbms | q100.1 | q500.1 | q1000.1 |
|---|---|---|---|
| pg152_o2_nofp.cx8_1g_bee | 100 | 499 | 998 |
| pg152_o2_nofp.cx8a1_1g_bee | 100 | 499 | 998 |
| pg152_o2_nofp.cx8a2_1g_bee | 100 | 499 | 998 |
| pg152_o2_nofp.cx8a3_1g_bee | 100 | 499 | 998 |
| pg152_o2_nofp.cx8a4_1g_bee | 100 | 499 | 998 |
| pg152_o2_nofp.cx8a9_1g_bee | 100 | 499 | 998 |
| pg152_o2_nofp.cx8a10_1g_bee | 100 | 499 | 998 |
| pg152_o2_nofp.cx8a12_1g_bee | 100 | 499 | 998 |
| pg152_o2_nofp.cx8a14_1g_bee | 100 | 499 | 998 |
| pg152_o2_nofp.cx8a15_1g_bee | 100 | 499 | 998 |
| pg152_o2_nofp.cx8a16_1g_bee | 100 | 499 | 998 |
| pg152_o2_nofp.cx8a17_1g_bee | 100 | 499 | 998 |
| pg152_o2_nofp.cx8a18_1g_bee | 100 | 499 | 998 |
| target | 100 | 500 | 1000 |
l.i0
l.i0: load without secondary indexes. Graphs for performance per 1-second interval are here.
Average throughput:
Insert response time histogram: each cell has the percentage of responses that take <= the time in the header and max is the max response time in seconds. For the max column values in the top 25% of the range have a red background and in the bottom 25% of the range have a green background. The red background is not used when the min value is within 80% of the max value.
| dbms | 256us | 1ms | 4ms | 16ms | 64ms | 256ms | 1s | 4s | 16s | gt | max |
|---|---|---|---|---|---|---|---|---|---|---|---|
| pg152_o2_nofp.cx8_1g_bee | 99.997 | 0.003 | 0.005 | ||||||||
| pg152_o2_nofp.cx8a1_1g_bee | 99.997 | 0.003 | 0.005 | ||||||||
| pg152_o2_nofp.cx8a2_1g_bee | 99.997 | 0.003 | 0.004 | ||||||||
| pg152_o2_nofp.cx8a3_1g_bee | 99.997 | 0.003 | 0.005 | ||||||||
| pg152_o2_nofp.cx8a4_1g_bee | 99.997 | 0.003 | 0.005 | ||||||||
| pg152_o2_nofp.cx8a9_1g_bee | 99.997 | 0.003 | 0.005 | ||||||||
| pg152_o2_nofp.cx8a10_1g_bee | 99.997 | 0.003 | 0.004 | ||||||||
| pg152_o2_nofp.cx8a12_1g_bee | 99.997 | 0.003 | 0.004 | ||||||||
| pg152_o2_nofp.cx8a14_1g_bee | 99.997 | 0.003 | 0.005 | ||||||||
| pg152_o2_nofp.cx8a15_1g_bee | 99.997 | 0.003 | 0.005 | ||||||||
| pg152_o2_nofp.cx8a16_1g_bee | 99.997 | 0.003 | 0.005 | ||||||||
| pg152_o2_nofp.cx8a17_1g_bee | 99.998 | 0.002 | 0.004 | ||||||||
| pg152_o2_nofp.cx8a18_1g_bee | 99.997 | 0.003 | 0.005 |
Performance metrics for the DBMS listed above. Some are normalized by throughput, others are not. Legend for results is here.
ips	qps	rps	rmbps	wps	wmbps	rpq	rkbpq	wpi	wkbpi	csps	cpups	cspq	cpupq	dbgb1	dbgb2	rss	maxop	p50	p99	tag
72727	0	0	0.0	259.3	34.6	0.000	0.000	0.004	0.488	8984	23.4	0.124	26	1.9	5.2	0.0	0.005	73053	70615	20m.pg152_o2_nofp.cx8_1g_bee
73260	0	0	0.0	241.0	34.8	0.000	0.000	0.003	0.487	9008	23.4	0.123	26	1.9	5.2	0.0	0.005	73283	69520	20m.pg152_o2_nofp.cx8a1_1g_bee
72993	0	0	0.0	265.0	34.7	0.000	0.000	0.004	0.487	8970	23.1	0.123	25	1.9	5.2	0.0	0.004	73217	70016	20m.pg152_o2_nofp.cx8a2_1g_bee
72464	0	0	0.0	272.2	34.3	0.000	0.000	0.004	0.485	8928	23.3	0.123	26	1.9	5.2	0.0	0.005	72717	69716	20m.pg152_o2_nofp.cx8a3_1g_bee
73260	0	0	0.0	241.9	34.7	0.000	0.000	0.003	0.485	8994	23.3	0.123	25	1.9	5.2	0.0	0.005	73216	71416	20m.pg152_o2_nofp.cx8a4_1g_bee
72464	0	0	0.0	271.2	34.3	0.000	0.000	0.004	0.485	8919	23.3	0.123	26	1.9	5.2	0.0	0.005	72617	69817	20m.pg152_o2_nofp.cx8a9_1g_bee
72993	0	0	0.0	272.7	34.6	0.000	0.000	0.004	0.486	8977	23.1	0.123	25	1.9	5.2	0.0	0.004	72920	70416	20m.pg152_o2_nofp.cx8a10_1g_bee
73260	0	0	0.0	267.1	34.9	0.000	0.000	0.004	0.488	9043	23.3	0.123	25	1.9	5.2	0.0	0.004	73617	70216	20m.pg152_o2_nofp.cx8a12_1g_bee
72464	0	0	0.0	278.2	34.3	0.000	0.000	0.004	0.485	8952	23.2	0.124	26	1.9	5.2	0.0	0.005	72750	69721	20m.pg152_o2_nofp.cx8a14_1g_bee
73529	0	0	0.0	236.7	34.7	0.000	0.000	0.003	0.483	9027	23.4	0.123	25	1.9	5.2	0.0	0.005	73517	70141	20m.pg152_o2_nofp.cx8a15_1g_bee
72202	0	0	0.0	288.4	34.3	0.000	0.000	0.004	0.487	8945	23.3	0.124	26	1.9	5.2	0.0	0.005	72618	69616	20m.pg152_o2_nofp.cx8a16_1g_bee
72464	0	0	0.0	272.6	34.3	0.000	0.000	0.004	0.485	8941	23.3	0.123	26	1.9	5.2	0.0	0.004	72818	69618	20m.pg152_o2_nofp.cx8a17_1g_bee
72727	0	0	0.0	271.9	34.5	0.000	0.000	0.004	0.485	8970	23.2	0.123	26	1.9	5.2	0.0	0.005	72919	68821	20m.pg152_o2_nofp.cx8a18_1g_bee
l.x
l.x: create secondary indexes.
Average throughput:
Performance metrics for the DBMS listed above. Some are normalized by throughput, others are not. Legend for results is here.
ips	qps	rps	rmbps	wps	wmbps	rpq	rkbpq	wpi	wkbpi	csps	cpups	cspq	cpupq	dbgb1	dbgb2	rss	maxop	p50	p99	tag
233721	0	0	0.0	126.8	54.3	0.000	0.000	0.001	0.238	740	12.1	0.003	4	3.7	8.6	0.0	0.003	NA	NA	20m.pg152_o2_nofp.cx8_1g_bee
231034	0	0	0.0	77.9	36.0	0.000	0.000	0.000	0.160	716	12.3	0.003	4	3.7	8.0	0.0	0.003	NA	NA	20m.pg152_o2_nofp.cx8a1_1g_bee
233721	0	0	0.0	118.2	53.0	0.000	0.000	0.001	0.232	705	11.9	0.003	4	3.7	8.6	0.0	0.003	NA	NA	20m.pg152_o2_nofp.cx8a2_1g_bee
231034	0	0	0.0	121.4	52.7	0.000	0.000	0.001	0.233	665	12.2	0.003	4	3.7	8.6	0.0	0.003	NA	NA	20m.pg152_o2_nofp.cx8a3_1g_bee
233721	0	0	0.0	117.8	53.6	0.000	0.000	0.001	0.235	693	12.1	0.003	4	3.7	8.6	0.0	0.003	NA	NA	20m.pg152_o2_nofp.cx8a4_1g_bee
233721	0	0	0.0	119.1	54.0	0.000	0.000	0.001	0.237	693	12.1	0.003	4	3.7	8.6	0.0	0.003	NA	NA	20m.pg152_o2_nofp.cx8a9_1g_bee
233721	0	0	0.0	119.9	53.8	0.000	0.000	0.001	0.236	729	12.3	0.003	4	3.7	8.6	0.0	0.004	NA	NA	20m.pg152_o2_nofp.cx8a10_1g_bee
239286	0	0	0.0	99.4	44.7	0.000	0.000	0.000	0.191	767	12.5	0.003	4	3.7	8.6	0.0	0.003	NA	NA	20m.pg152_o2_nofp.cx8a12_1g_bee
233721	0	0	0.0	119.6	53.1	0.000	0.000	0.001	0.233	774	12.1	0.003	4	3.7	8.6	0.0	0.003	NA	NA	20m.pg152_o2_nofp.cx8a14_1g_bee
233721	0	0	0.0	124.7	53.4	0.000	0.000	0.001	0.234	765	12.2	0.003	4	3.7	8.6	0.0	0.003	NA	NA	20m.pg152_o2_nofp.cx8a15_1g_bee
231034	0	0	0.0	115.0	53.4	0.000	0.000	0.000	0.237	803	12.2	0.003	4	3.7	8.6	0.0	0.003	NA	NA	20m.pg152_o2_nofp.cx8a16_1g_bee
233721	0	0	0.0	116.1	50.4	0.000	0.000	0.000	0.221	734	12.3	0.003	4	3.7	8.6	0.0	0.003	NA	NA	20m.pg152_o2_nofp.cx8a17_1g_bee
239286	0	0	0.0	82.6	34.4	0.000	0.000	0.000	0.147	793	12.9	0.003	4	3.7	8.0	0.0	0.003	NA	NA	20m.pg152_o2_nofp.cx8a18_1g_bee
l.i1
l.i1: continue load after secondary indexes created. Graphs for performance per 1-second interval are here.
Average throughput:
Insert response time histogram: each cell has the percentage of responses that take <= the time in the header and max is the max response time in seconds. For the max column values in the top 25% of the range have a red background and in the bottom 25% of the range have a green background. The red background is not used when the min value is within 80% of the max value.
| dbms | 256us | 1ms | 4ms | 16ms | 64ms | 256ms | 1s | 4s | 16s | gt | max |
|---|---|---|---|---|---|---|---|---|---|---|---|
| pg152_o2_nofp.cx8_1g_bee | 99.954 | 0.043 | 0.003 | 0.048 | |||||||
| pg152_o2_nofp.cx8a1_1g_bee | 99.700 | 0.298 | 0.003 | 0.031 | |||||||
| pg152_o2_nofp.cx8a2_1g_bee | 98.879 | 1.094 | 0.026 | 0.001 | nonzero | 0.361 | |||||
| pg152_o2_nofp.cx8a3_1g_bee | 99.921 | 0.076 | 0.002 | 0.031 | |||||||
| pg152_o2_nofp.cx8a4_1g_bee | 99.957 | 0.039 | 0.003 | nonzero | 0.102 | ||||||
| pg152_o2_nofp.cx8a9_1g_bee | 99.953 | 0.044 | 0.003 | 0.044 | |||||||
| pg152_o2_nofp.cx8a10_1g_bee | 99.953 | 0.044 | 0.003 | 0.064 | |||||||
| pg152_o2_nofp.cx8a12_1g_bee | 99.959 | 0.037 | 0.004 | nonzero | 0.101 | ||||||
| pg152_o2_nofp.cx8a14_1g_bee | 97.637 | 2.337 | 0.026 | 0.001 | nonzero | 0.329 | |||||
| pg152_o2_nofp.cx8a15_1g_bee | 99.931 | 0.063 | 0.006 | 0.041 | |||||||
| pg152_o2_nofp.cx8a16_1g_bee | 99.969 | 0.026 | 0.004 | 0.001 | 0.135 | ||||||
| pg152_o2_nofp.cx8a17_1g_bee | 99.890 | 0.107 | 0.002 | 0.033 | |||||||
| pg152_o2_nofp.cx8a18_1g_bee | 99.865 | 0.134 | 0.001 | 0.033 |
Delete response time histogram: each cell has the percentage of responses that take <= the time in the header and max is the max response time in seconds. For the max column values in the top 25% of the range have a red background and in the bottom 25% of the range have a green background. The red background is not used when the min value is within 80% of the max value.
| dbms | 256us | 1ms | 4ms | 16ms | 64ms | 256ms | 1s | 4s | 16s | gt | max |
|---|---|---|---|---|---|---|---|---|---|---|---|
| pg152_o2_nofp.cx8_1g_bee | 0.028 | 88.041 | 1.560 | 0.775 | 9.595 | 0.002 | 0.148 | ||||
| pg152_o2_nofp.cx8a1_1g_bee | 0.030 | 89.434 | 0.697 | 0.480 | 9.358 | 0.001 | 0.119 | ||||
| pg152_o2_nofp.cx8a2_1g_bee | 0.027 | 89.679 | 0.752 | 0.576 | 8.964 | 0.001 | 0.182 | ||||
| pg152_o2_nofp.cx8a3_1g_bee | 0.035 | 89.391 | 0.602 | 0.550 | 9.421 | 0.001 | 0.133 | ||||
| pg152_o2_nofp.cx8a4_1g_bee | 0.031 | 89.324 | 0.993 | 1.034 | 8.616 | 0.002 | 0.126 | ||||
| pg152_o2_nofp.cx8a9_1g_bee | 0.032 | 89.845 | 0.666 | 0.747 | 8.709 | 0.001 | 0.116 | ||||
| pg152_o2_nofp.cx8a10_1g_bee | 0.030 | 89.415 | 1.046 | 0.794 | 8.713 | 0.001 | 0.149 | ||||
| pg152_o2_nofp.cx8a12_1g_bee | 0.026 | 89.594 | 0.748 | 0.822 | 8.808 | 0.001 | 0.125 | ||||
| pg152_o2_nofp.cx8a14_1g_bee | 0.026 | 88.634 | 1.331 | 0.746 | 9.261 | 0.002 | 0.204 | ||||
| pg152_o2_nofp.cx8a15_1g_bee | 0.027 | 88.242 | 2.037 | 0.345 | 9.347 | 0.002 | 0.142 | ||||
| pg152_o2_nofp.cx8a16_1g_bee | 0.021 | 83.354 | 11.034 | 5.549 | 0.041 | nonzero | 0.071 | ||||
| pg152_o2_nofp.cx8a17_1g_bee | 0.030 | 86.622 | 1.616 | 0.456 | 11.274 | 0.002 | 0.140 | ||||
| pg152_o2_nofp.cx8a18_1g_bee | 0.018 | 84.249 | 9.958 | 5.690 | 0.085 | 0.042 |
Performance metrics for the DBMS listed above. Some are normalized by throughput, others are not. Legend for results is here.
ips	qps	rps	rmbps	wps	wmbps	rpq	rkbpq	wpi	wkbpi	csps	cpups	cspq	cpupq	dbgb1	dbgb2	rss	maxop	p50	p99	tag
9897	0	19	0.2	12803.2	142.8	0.002	0.019	1.294	14.772	5756	19.5	0.582	158	6.3	29.5	1.1	0.048	2597	1249	20m.pg152_o2_nofp.cx8_1g_bee
10091	0	17	0.1	12985.7	143.7	0.002	0.014	1.287	14.585	5846	19.6	0.579	155	6.3	27.4	1.1	0.031	2797	1398	20m.pg152_o2_nofp.cx8a1_1g_bee
9432	0	18	0.1	18892.0	163.7	0.002	0.016	2.003	17.770	5530	19.0	0.586	161	6.3	28.8	0.0	0.361	15183	1348	20m.pg152_o2_nofp.cx8a2_1g_bee
9996	0	15	0.1	12899.4	141.8	0.001	0.015	1.290	14.522	5774	19.4	0.578	155	6.3	25.8	0.0	0.031	2347	1348	20m.pg152_o2_nofp.cx8a3_1g_bee
10339	0	20	0.1	13147.7	146.9	0.002	0.015	1.272	14.548	6040	19.7	0.584	152	6.3	30.4	1.1	0.102	4395	1348	20m.pg152_o2_nofp.cx8a4_1g_bee
10410	0	22	0.2	13305.4	148.5	0.002	0.017	1.278	14.610	6002	19.7	0.577	151	6.3	21.1	0.0	0.044	5047	1448	20m.pg152_o2_nofp.cx8a9_1g_bee
10333	0	19	0.1	13136.1	146.7	0.002	0.014	1.271	14.536	6007	19.7	0.581	153	6.3	29.7	0.0	0.064	3346	1348	20m.pg152_o2_nofp.cx8a10_1g_bee
10202	0	19	0.2	13008.0	145.2	0.002	0.016	1.275	14.571	5934	19.6	0.582	154	6.3	29.6	0.0	0.101	3046	1398	20m.pg152_o2_nofp.cx8a12_1g_bee
9535	0	18	0.1	19040.2	165.0	0.002	0.014	1.997	17.719	5606	19.1	0.588	160	6.3	28.9	0.0	0.329	14983	1249	20m.pg152_o2_nofp.cx8a14_1g_bee
10204	0	24	0.3	13170.4	146.8	0.002	0.026	1.291	14.728	5860	19.7	0.574	154	6.3	16.3	1.0	0.041	2697	1249	20m.pg152_o2_nofp.cx8a15_1g_bee
17036	0	17	0.1	17397.0	199.6	0.001	0.006	1.021	11.999	10357	24.9	0.608	117	5.1	36.9	1.0	0.135	20426	3546	20m.pg152_o2_nofp.cx8a16_1g_bee
9042	0	16	0.1	9427.0	135.1	0.002	0.016	1.043	15.301	4992	18.2	0.552	161	6.2	28.6	1.0	0.033	2647	1249	20m.pg152_o2_nofp.cx8a17_1g_bee
16900	0	7	0.0	18629.4	212.7	0.000	0.002	1.102	12.888	10294	25.1	0.609	119	5.2	37.1	0.0	0.033	20128	3546	20m.pg152_o2_nofp.cx8a18_1g_bee
q100.1
q100.1: range queries with 100 insert/s per client. Graphs for performance per 1-second interval are here.
Average throughput:
Query response time histogram: each cell has the percentage of responses that take <= the time in the header and max is the max response time in seconds. For max values in the top 25% of the range have a red background and in the bottom 25% of the range have a green background. The red background is not used when the min value is within 80% of the max value.
| dbms | 256us | 1ms | 4ms | 16ms | 64ms | 256ms | 1s | 4s | 16s | gt | max |
|---|---|---|---|---|---|---|---|---|---|---|---|
| pg152_o2_nofp.cx8_1g_bee | 99.908 | 0.092 | nonzero | 0.002 | |||||||
| pg152_o2_nofp.cx8a1_1g_bee | 99.912 | 0.087 | nonzero | 0.003 | |||||||
| pg152_o2_nofp.cx8a2_1g_bee | 99.940 | 0.060 | nonzero | 0.004 | |||||||
| pg152_o2_nofp.cx8a3_1g_bee | 99.921 | 0.079 | nonzero | 0.003 | |||||||
| pg152_o2_nofp.cx8a4_1g_bee | 99.928 | 0.072 | 0.001 | 0.004 | |||||||
| pg152_o2_nofp.cx8a9_1g_bee | 99.943 | 0.057 | nonzero | 0.003 | |||||||
| pg152_o2_nofp.cx8a10_1g_bee | 99.921 | 0.078 | nonzero | 0.004 | |||||||
| pg152_o2_nofp.cx8a12_1g_bee | 99.905 | 0.095 | nonzero | 0.004 | |||||||
| pg152_o2_nofp.cx8a14_1g_bee | 99.914 | 0.085 | nonzero | 0.003 | |||||||
| pg152_o2_nofp.cx8a15_1g_bee | 99.955 | 0.045 | nonzero | nonzero | 0.004 | ||||||
| pg152_o2_nofp.cx8a16_1g_bee | 99.926 | 0.074 | nonzero | 0.003 | |||||||
| pg152_o2_nofp.cx8a17_1g_bee | 99.925 | 0.075 | nonzero | 0.004 | |||||||
| pg152_o2_nofp.cx8a18_1g_bee | 99.913 | 0.087 | nonzero | 0.004 |
Insert response time histogram: each cell has the percentage of responses that take <= the time in the header and max is the max response time in seconds. For max values in the top 25% of the range have a red background and in the bottom 25% of the range have a green background. The red background is not used when the min value is within 80% of the max value.
| dbms | 256us | 1ms | 4ms | 16ms | 64ms | 256ms | 1s | 4s | 16s | gt | max |
|---|---|---|---|---|---|---|---|---|---|---|---|
| pg152_o2_nofp.cx8_1g_bee | 99.750 | 0.250 | 0.008 | ||||||||
| pg152_o2_nofp.cx8a1_1g_bee | 47.056 | 52.944 | 0.009 | ||||||||
| pg152_o2_nofp.cx8a2_1g_bee | 99.750 | 0.250 | 0.009 | ||||||||
| pg152_o2_nofp.cx8a3_1g_bee | 99.861 | 0.139 | 0.005 | ||||||||
| pg152_o2_nofp.cx8a4_1g_bee | 99.556 | 0.444 | 0.007 | ||||||||
| pg152_o2_nofp.cx8a9_1g_bee | 99.667 | 0.333 | 0.007 | ||||||||
| pg152_o2_nofp.cx8a10_1g_bee | 99.639 | 0.361 | 0.013 | ||||||||
| pg152_o2_nofp.cx8a12_1g_bee | 98.611 | 1.389 | 0.005 | ||||||||
| pg152_o2_nofp.cx8a14_1g_bee | 99.722 | 0.278 | 0.006 | ||||||||
| pg152_o2_nofp.cx8a15_1g_bee | 99.722 | 0.278 | 0.005 | ||||||||
| pg152_o2_nofp.cx8a16_1g_bee | 99.861 | 0.139 | 0.005 | ||||||||
| pg152_o2_nofp.cx8a17_1g_bee | 99.722 | 0.278 | 0.006 | ||||||||
| pg152_o2_nofp.cx8a18_1g_bee | 54.250 | 45.750 | 0.013 |
Delete response time histogram: each cell has the percentage of responses that take <= the time in the header and max is the max response time in seconds. For max values in the top 25% of the range have a red background and in the bottom 25% of the range have a green background. The red background is not used when the min value is within 80% of the max value.
| dbms | 256us | 1ms | 4ms | 16ms | 64ms | 256ms | 1s | 4s | 16s | gt | max |
|---|---|---|---|---|---|---|---|---|---|---|---|
| pg152_o2_nofp.cx8_1g_bee | 0.611 | 96.889 | 0.167 | 2.333 | 0.010 | ||||||
| pg152_o2_nofp.cx8a1_1g_bee | 21.472 | 77.667 | 0.861 | 0.012 | |||||||
| pg152_o2_nofp.cx8a2_1g_bee | 20.528 | 77.222 | 2.250 | 0.012 | |||||||
| pg152_o2_nofp.cx8a3_1g_bee | 0.611 | 99.333 | 0.056 | 0.002 | |||||||
| pg152_o2_nofp.cx8a4_1g_bee | 20.167 | 78.500 | 1.333 | 0.012 | |||||||
| pg152_o2_nofp.cx8a9_1g_bee | 0.222 | 98.333 | 0.611 | 0.833 | 0.010 | ||||||
| pg152_o2_nofp.cx8a10_1g_bee | 0.083 | 24.750 | 74.444 | 0.722 | 0.012 | ||||||
| pg152_o2_nofp.cx8a12_1g_bee | 0.722 | 97.917 | 0.222 | 1.139 | 0.010 | ||||||
| pg152_o2_nofp.cx8a14_1g_bee | 0.028 | 20.361 | 77.556 | 2.056 | 0.012 | ||||||
| pg152_o2_nofp.cx8a15_1g_bee | 21.167 | 78.806 | 0.028 | 0.006 | |||||||
| pg152_o2_nofp.cx8a16_1g_bee | 0.222 | 99.667 | 0.056 | 0.056 | 0.010 | ||||||
| pg152_o2_nofp.cx8a17_1g_bee | 0.028 | 25.778 | 72.667 | 1.528 | 0.012 | ||||||
| pg152_o2_nofp.cx8a18_1g_bee | 20.889 | 78.972 | 0.139 | 0.011 |
Performance metrics for the DBMS listed above. Some are normalized by throughput, others are not. Legend for results is here.
ips	qps	rps	rmbps	wps	wmbps	rpq	rkbpq	wpi	wkbpi	csps	cpups	cspq	cpupq	dbgb1	dbgb2	rss	maxop	p50	p99	tag
100	7803	0	0.0	473.9	4.3	0.000	0.000	4.749	43.676	30016	13.3	3.847	136	6.3	29.5	0.0	0.002	7463	7350	20m.pg152_o2_nofp.cx8_1g_bee
100	7900	0	0.0	453.8	4.2	0.000	0.000	4.548	42.701	30454	13.4	3.855	136	6.3	27.4	0.0	0.003	7543	7286	20m.pg152_o2_nofp.cx8a1_1g_bee
100	7720	1	0.0	449.2	3.8	0.000	0.001	4.501	38.865	29719	13.2	3.849	137	6.3	28.7	0.0	0.004	7415	7256	20m.pg152_o2_nofp.cx8a2_1g_bee
100	7947	0	0.0	464.5	3.9	0.000	0.000	4.654	40.397	30562	13.2	3.846	133	6.3	25.8	0.0	0.003	7576	7447	20m.pg152_o2_nofp.cx8a3_1g_bee
100	7863	0	0.0	456.6	4.6	0.000	0.000	4.575	47.259	30303	13.5	3.854	137	6.3	30.4	0.0	0.004	7527	7320	20m.pg152_o2_nofp.cx8a4_1g_bee
100	7912	0	0.0	464.5	4.9	0.000	0.000	4.654	50.263	30540	13.4	3.860	135	6.3	21.1	0.0	0.003	7439	7256	20m.pg152_o2_nofp.cx8a9_1g_bee
100	7874	0	0.0	471.5	4.8	0.000	0.000	4.730	48.947	30364	13.5	3.856	137	6.3	29.7	0.0	0.004	7559	7304	20m.pg152_o2_nofp.cx8a10_1g_bee
100	7854	0	0.0	453.7	4.4	0.000	0.000	4.546	44.900	30274	13.3	3.855	135	6.3	29.6	0.0	0.004	7591	7382	20m.pg152_o2_nofp.cx8a12_1g_bee
100	7760	0	0.0	452.7	3.8	0.000	0.000	4.541	39.031	29876	13.4	3.850	138	6.3	28.9	0.0	0.003	7464	7336	20m.pg152_o2_nofp.cx8a14_1g_bee
100	7778	0	0.0	456.7	4.0	0.000	0.000	4.581	41.056	29945	13.0	3.850	134	6.3	16.3	0.0	0.004	7446	7334	20m.pg152_o2_nofp.cx8a15_1g_bee
100	7901	0	0.0	473.5	4.8	0.000	0.000	4.744	49.084	30446	13.4	3.854	136	5.1	36.9	0.0	0.003	7559	7387	20m.pg152_o2_nofp.cx8a16_1g_bee
100	8015	0	0.0	472.5	4.3	0.000	0.000	4.734	44.305	30858	13.6	3.850	136	6.2	28.6	0.0	0.004	7638	7495	20m.pg152_o2_nofp.cx8a17_1g_bee
100	7761	0	0.0	467.2	4.3	0.000	0.000	4.682	43.658	29876	13.4	3.850	138	5.2	37.1	0.0	0.004	7400	7208	20m.pg152_o2_nofp.cx8a18_1g_bee
q500.1
q500.1: range queries with 500 insert/s per client. Graphs for performance per 1-second interval are here.
Average throughput:
Query response time histogram: each cell has the percentage of responses that take <= the time in the header and max is the max response time in seconds. For max values in the top 25% of the range have a red background and in the bottom 25% of the range have a green background. The red background is not used when the min value is within 80% of the max value.
| dbms | 256us | 1ms | 4ms | 16ms | 64ms | 256ms | 1s | 4s | 16s | gt | max |
|---|---|---|---|---|---|---|---|---|---|---|---|
| pg152_o2_nofp.cx8_1g_bee | 99.930 | 0.070 | nonzero | 0.004 | |||||||
| pg152_o2_nofp.cx8a1_1g_bee | 99.930 | 0.070 | nonzero | nonzero | 0.006 | ||||||
| pg152_o2_nofp.cx8a2_1g_bee | 99.911 | 0.089 | nonzero | nonzero | 0.007 | ||||||
| pg152_o2_nofp.cx8a3_1g_bee | 99.946 | 0.054 | nonzero | nonzero | 0.004 | ||||||
| pg152_o2_nofp.cx8a4_1g_bee | 99.932 | 0.068 | nonzero | 0.003 | |||||||
| pg152_o2_nofp.cx8a9_1g_bee | 99.902 | 0.098 | nonzero | nonzero | 0.004 | ||||||
| pg152_o2_nofp.cx8a10_1g_bee | 99.938 | 0.062 | nonzero | 0.003 | |||||||
| pg152_o2_nofp.cx8a12_1g_bee | 99.923 | 0.077 | nonzero | nonzero | 0.005 | ||||||
| pg152_o2_nofp.cx8a14_1g_bee | 99.921 | 0.079 | nonzero | 0.003 | |||||||
| pg152_o2_nofp.cx8a15_1g_bee | 99.923 | 0.077 | nonzero | nonzero | 0.004 | ||||||
| pg152_o2_nofp.cx8a16_1g_bee | 99.915 | 0.084 | nonzero | 0.003 | |||||||
| pg152_o2_nofp.cx8a17_1g_bee | 99.914 | 0.086 | nonzero | nonzero | 0.005 | ||||||
| pg152_o2_nofp.cx8a18_1g_bee | 99.928 | 0.072 | nonzero | nonzero | 0.006 |
Insert response time histogram: each cell has the percentage of responses that take <= the time in the header and max is the max response time in seconds. For max values in the top 25% of the range have a red background and in the bottom 25% of the range have a green background. The red background is not used when the min value is within 80% of the max value.
| dbms | 256us | 1ms | 4ms | 16ms | 64ms | 256ms | 1s | 4s | 16s | gt | max |
|---|---|---|---|---|---|---|---|---|---|---|---|
| pg152_o2_nofp.cx8_1g_bee | 99.806 | 0.194 | 0.008 | ||||||||
| pg152_o2_nofp.cx8a1_1g_bee | 89.283 | 10.717 | 0.009 | ||||||||
| pg152_o2_nofp.cx8a2_1g_bee | 99.844 | 0.156 | 0.006 | ||||||||
| pg152_o2_nofp.cx8a3_1g_bee | 99.944 | 0.056 | 0.006 | ||||||||
| pg152_o2_nofp.cx8a4_1g_bee | 99.867 | 0.133 | 0.009 | ||||||||
| pg152_o2_nofp.cx8a9_1g_bee | 99.878 | 0.122 | 0.008 | ||||||||
| pg152_o2_nofp.cx8a10_1g_bee | 99.878 | 0.122 | 0.009 | ||||||||
| pg152_o2_nofp.cx8a12_1g_bee | 99.906 | 0.094 | 0.008 | ||||||||
| pg152_o2_nofp.cx8a14_1g_bee | 99.811 | 0.189 | 0.006 | ||||||||
| pg152_o2_nofp.cx8a15_1g_bee | 99.872 | 0.128 | 0.007 | ||||||||
| pg152_o2_nofp.cx8a16_1g_bee | 99.944 | 0.056 | 0.006 | ||||||||
| pg152_o2_nofp.cx8a17_1g_bee | 99.872 | 0.128 | 0.008 | ||||||||
| pg152_o2_nofp.cx8a18_1g_bee | 88.844 | 11.156 | 0.011 |
Delete response time histogram: each cell has the percentage of responses that take <= the time in the header and max is the max response time in seconds. For max values in the top 25% of the range have a red background and in the bottom 25% of the range have a green background. The red background is not used when the min value is within 80% of the max value.
| dbms | 256us | 1ms | 4ms | 16ms | 64ms | 256ms | 1s | 4s | 16s | gt | max |
|---|---|---|---|---|---|---|---|---|---|---|---|
| pg152_o2_nofp.cx8_1g_bee | 3.467 | 76.617 | 4.094 | 15.822 | 0.014 | ||||||
| pg152_o2_nofp.cx8a1_1g_bee | 2.122 | 87.106 | 2.828 | 7.922 | 0.022 | 0.018 | |||||
| pg152_o2_nofp.cx8a2_1g_bee | 2.800 | 84.506 | 5.161 | 7.506 | 0.028 | 0.018 | |||||
| pg152_o2_nofp.cx8a3_1g_bee | 3.172 | 76.606 | 0.144 | 20.078 | 0.016 | ||||||
| pg152_o2_nofp.cx8a4_1g_bee | 3.333 | 86.822 | 1.578 | 8.233 | 0.033 | 0.017 | |||||
| pg152_o2_nofp.cx8a9_1g_bee | 2.450 | 73.189 | 0.206 | 24.156 | 0.016 | ||||||
| pg152_o2_nofp.cx8a10_1g_bee | 3.211 | 88.456 | 5.439 | 2.878 | 0.017 | 0.018 | |||||
| pg152_o2_nofp.cx8a12_1g_bee | 3.128 | 72.750 | 0.150 | 23.967 | 0.006 | 0.016 | |||||
| pg152_o2_nofp.cx8a14_1g_bee | 3.294 | 86.728 | 1.522 | 8.428 | 0.028 | 0.020 | |||||
| pg152_o2_nofp.cx8a15_1g_bee | 3.750 | 84.011 | 4.061 | 8.122 | 0.056 | 0.020 | |||||
| pg152_o2_nofp.cx8a16_1g_bee | 3.861 | 70.972 | 0.467 | 24.694 | 0.006 | 0.016 | |||||
| pg152_o2_nofp.cx8a17_1g_bee | 3.117 | 88.328 | 0.194 | 8.339 | 0.022 | 0.017 | |||||
| pg152_o2_nofp.cx8a18_1g_bee | 1.700 | 88.633 | 3.300 | 6.356 | 0.011 | 0.018 |
Performance metrics for the DBMS listed above. Some are normalized by throughput, others are not. Legend for results is here.
ips	qps	rps	rmbps	wps	wmbps	rpq	rkbpq	wpi	wkbpi	csps	cpups	cspq	cpupq	dbgb1	dbgb2	rss	maxop	p50	p99	tag
499	7668	2	0.0	1776.6	15.3	0.000	0.001	3.560	31.334	29758	13.7	3.881	143	6.3	29.2	0.0	0.004	7335	7176	20m.pg152_o2_nofp.cx8_1g_bee
499	7859	1	0.0	1788.1	14.7	0.000	0.001	3.583	30.262	30443	14.0	3.874	143	6.3	27.3	0.0	0.006	7416	7240	20m.pg152_o2_nofp.cx8a1_1g_bee
499	7763	1	0.0	1791.5	15.6	0.000	0.001	3.589	32.029	30140	14.1	3.882	145	6.3	28.7	0.0	0.007	7383	7160	20m.pg152_o2_nofp.cx8a2_1g_bee
499	7884	0	0.0	1781.8	14.1	0.000	0.000	3.570	28.950	30481	13.7	3.866	139	6.3	25.8	0.0	0.004	7479	7342	20m.pg152_o2_nofp.cx8a3_1g_bee
499	7774	2	0.0	1791.3	15.2	0.000	0.001	3.589	31.171	30137	13.8	3.877	142	6.3	30.4	0.0	0.003	7446	7318	20m.pg152_o2_nofp.cx8a4_1g_bee
499	7671	3	0.0	1789.1	16.2	0.000	0.003	3.585	33.225	29850	13.9	3.891	145	6.3	21.1	0.0	0.004	7382	7208	20m.pg152_o2_nofp.cx8a9_1g_bee
499	7777	1	0.0	1787.0	15.2	0.000	0.001	3.580	31.096	30144	13.6	3.876	140	6.3	29.7	0.0	0.003	7480	7367	20m.pg152_o2_nofp.cx8a10_1g_bee
499	7919	2	0.0	1790.8	15.2	0.000	0.001	3.590	31.125	30701	14.1	3.877	142	6.3	29.6	0.0	0.005	7480	7336	20m.pg152_o2_nofp.cx8a12_1g_bee
499	7692	2	0.0	1787.6	15.6	0.000	0.002	3.584	31.959	29874	14.0	3.884	146	6.3	28.9	0.0	0.003	7303	7126	20m.pg152_o2_nofp.cx8a14_1g_bee
499	7732	0	0.0	1785.8	15.6	0.000	0.000	3.578	31.932	30013	13.7	3.882	142	6.3	16.3	0.0	0.004	7432	7256	20m.pg152_o2_nofp.cx8a15_1g_bee
499	7791	0	0.0	1773.6	15.9	0.000	0.000	3.554	32.544	30228	14.2	3.880	146	5.1	36.9	0.0	0.003	7445	7254	20m.pg152_o2_nofp.cx8a16_1g_bee
499	7689	1	0.0	1781.9	15.5	0.000	0.001	3.570	31.843	29847	13.8	3.882	144	6.2	28.6	0.0	0.005	7463	7288	20m.pg152_o2_nofp.cx8a17_1g_bee
499	7637	0	0.0	1792.8	15.8	0.000	0.000	3.592	32.395	29643	13.9	3.881	146	5.2	37.1	0.0	0.006	7336	7160	20m.pg152_o2_nofp.cx8a18_1g_bee
q1000.1
q1000.1: range queries with 1000 insert/s per client. Graphs for performance per 1-second interval are here.
Average throughput:
Query response time histogram: each cell has the percentage of responses that take <= the time in the header and max is the max response time in seconds. For max values in the top 25% of the range have a red background and in the bottom 25% of the range have a green background. The red background is not used when the min value is within 80% of the max value.
| dbms | 256us | 1ms | 4ms | 16ms | 64ms | 256ms | 1s | 4s | 16s | gt | max |
|---|---|---|---|---|---|---|---|---|---|---|---|
| pg152_o2_nofp.cx8_1g_bee | 99.918 | 0.082 | nonzero | 0.003 | |||||||
| pg152_o2_nofp.cx8a1_1g_bee | 99.917 | 0.083 | nonzero | nonzero | 0.004 | ||||||
| pg152_o2_nofp.cx8a2_1g_bee | 99.908 | 0.092 | nonzero | 0.003 | |||||||
| pg152_o2_nofp.cx8a3_1g_bee | 99.924 | 0.075 | nonzero | nonzero | 0.004 | ||||||
| pg152_o2_nofp.cx8a4_1g_bee | 99.919 | 0.081 | nonzero | 0.003 | |||||||
| pg152_o2_nofp.cx8a9_1g_bee | 99.902 | 0.097 | nonzero | 0.003 | |||||||
| pg152_o2_nofp.cx8a10_1g_bee | 99.919 | 0.080 | nonzero | nonzero | 0.005 | ||||||
| pg152_o2_nofp.cx8a12_1g_bee | 99.916 | 0.084 | nonzero | nonzero | 0.005 | ||||||
| pg152_o2_nofp.cx8a14_1g_bee | 99.905 | 0.094 | 0.001 | nonzero | 0.007 | ||||||
| pg152_o2_nofp.cx8a15_1g_bee | 99.919 | 0.081 | nonzero | nonzero | 0.005 | ||||||
| pg152_o2_nofp.cx8a16_1g_bee | 99.917 | 0.082 | nonzero | 0.004 | |||||||
| pg152_o2_nofp.cx8a17_1g_bee | 99.916 | 0.084 | nonzero | nonzero | 0.005 | ||||||
| pg152_o2_nofp.cx8a18_1g_bee | 99.918 | 0.081 | nonzero | nonzero | 0.006 |
Insert response time histogram: each cell has the percentage of responses that take <= the time in the header and max is the max response time in seconds. For max values in the top 25% of the range have a red background and in the bottom 25% of the range have a green background. The red background is not used when the min value is within 80% of the max value.
| dbms | 256us | 1ms | 4ms | 16ms | 64ms | 256ms | 1s | 4s | 16s | gt | max |
|---|---|---|---|---|---|---|---|---|---|---|---|
| pg152_o2_nofp.cx8_1g_bee | 99.897 | 0.103 | 0.007 | ||||||||
| pg152_o2_nofp.cx8a1_1g_bee | 97.961 | 2.039 | 0.009 | ||||||||
| pg152_o2_nofp.cx8a2_1g_bee | 99.900 | 0.100 | 0.006 | ||||||||
| pg152_o2_nofp.cx8a3_1g_bee | 99.964 | 0.036 | 0.007 | ||||||||
| pg152_o2_nofp.cx8a4_1g_bee | 99.908 | 0.092 | 0.009 | ||||||||
| pg152_o2_nofp.cx8a9_1g_bee | 99.939 | 0.061 | 0.007 | ||||||||
| pg152_o2_nofp.cx8a10_1g_bee | 99.931 | 0.069 | 0.009 | ||||||||
| pg152_o2_nofp.cx8a12_1g_bee | 99.900 | 0.100 | 0.009 | ||||||||
| pg152_o2_nofp.cx8a14_1g_bee | 99.831 | 0.169 | 0.011 | ||||||||
| pg152_o2_nofp.cx8a15_1g_bee | 99.878 | 0.122 | 0.009 | ||||||||
| pg152_o2_nofp.cx8a16_1g_bee | 99.972 | 0.028 | 0.006 | ||||||||
| pg152_o2_nofp.cx8a17_1g_bee | 99.947 | 0.053 | 0.008 | ||||||||
| pg152_o2_nofp.cx8a18_1g_bee | 95.069 | 4.931 | 0.009 |
Delete response time histogram: each cell has the percentage of responses that take <= the time in the header and max is the max response time in seconds. For max values in the top 25% of the range have a red background and in the bottom 25% of the range have a green background. The red background is not used when the min value is within 80% of the max value.
| dbms | 256us | 1ms | 4ms | 16ms | 64ms | 256ms | 1s | 4s | 16s | gt | max |
|---|---|---|---|---|---|---|---|---|---|---|---|
| pg152_o2_nofp.cx8_1g_bee | 2.375 | 74.325 | 6.308 | 16.725 | 0.267 | 0.023 | |||||
| pg152_o2_nofp.cx8a1_1g_bee | 1.553 | 81.500 | 6.036 | 10.892 | 0.019 | 0.020 | |||||
| pg152_o2_nofp.cx8a2_1g_bee | 1.831 | 80.681 | 5.939 | 11.522 | 0.028 | 0.016 | |||||
| pg152_o2_nofp.cx8a3_1g_bee | 1.831 | 74.975 | 0.364 | 21.028 | 1.803 | 0.028 | |||||
| pg152_o2_nofp.cx8a4_1g_bee | 1.939 | 82.636 | 5.358 | 10.064 | 0.003 | 0.016 | |||||
| pg152_o2_nofp.cx8a9_1g_bee | 1.203 | 77.283 | 0.181 | 12.256 | 9.078 | 0.040 | |||||
| pg152_o2_nofp.cx8a10_1g_bee | 1.350 | 77.078 | 10.667 | 10.883 | 0.022 | 0.018 | |||||
| pg152_o2_nofp.cx8a12_1g_bee | 1.792 | 74.747 | 0.244 | 21.161 | 2.056 | 0.030 | |||||
| pg152_o2_nofp.cx8a14_1g_bee | 2.103 | 82.272 | 6.583 | 9.042 | 0.015 | ||||||
| pg152_o2_nofp.cx8a15_1g_bee | 1.625 | 83.422 | 4.111 | 10.839 | 0.003 | 0.017 | |||||
| pg152_o2_nofp.cx8a16_1g_bee | 1.847 | 76.294 | 2.886 | 18.972 | 0.011 | ||||||
| pg152_o2_nofp.cx8a17_1g_bee | 1.783 | 82.989 | 3.725 | 11.497 | 0.006 | 0.018 | |||||
| pg152_o2_nofp.cx8a18_1g_bee | 1.286 | 83.789 | 8.186 | 6.739 | 0.016 |
Performance metrics for the DBMS listed above. Some are normalized by throughput, others are not. Legend for results is here.
ips	qps	rps	rmbps	wps	wmbps	rpq	rkbpq	wpi	wkbpi	csps	cpups	cspq	cpupq	dbgb1	dbgb2	rss	maxop	p50	p99	tag
998	7588	0	0.0	3388.6	29.0	0.000	0.000	3.394	29.711	29673	15.3	3.911	161	6.3	27.4	0.0	0.003	7321	7096	20m.pg152_o2_nofp.cx8_1g_bee
998	7803	1	0.0	3398.6	28.3	0.000	0.001	3.404	29.013	30453	15.3	3.903	157	6.3	26.3	0.0	0.004	7431	7064	20m.pg152_o2_nofp.cx8a1_1g_bee
998	7617	2	0.0	3383.4	28.7	0.000	0.002	3.389	29.464	29805	15.2	3.913	160	6.3	27.2	0.0	0.003	7333	7080	20m.pg152_o2_nofp.cx8a2_1g_bee
998	7762	0	0.0	3387.5	27.8	0.000	0.000	3.393	28.517	30290	15.5	3.902	160	6.3	25.8	0.0	0.004	7431	7196	20m.pg152_o2_nofp.cx8a3_1g_bee
998	7580	4	0.0	3399.7	28.9	0.001	0.004	3.405	29.621	29667	15.1	3.914	159	6.3	28.7	0.0	0.003	7351	7176	20m.pg152_o2_nofp.cx8a4_1g_bee
998	7614	13	0.1	3399.3	29.8	0.002	0.013	3.407	30.617	29904	15.5	3.928	163	6.3	21.1	0.0	0.003	7287	7096	20m.pg152_o2_nofp.cx8a9_1g_bee
998	7562	1	0.0	3379.4	28.7	0.000	0.001	3.385	29.435	29595	15.0	3.913	159	6.3	28.0	0.0	0.005	7352	7192	20m.pg152_o2_nofp.cx8a10_1g_bee
998	7844	6	0.0	3404.4	28.9	0.001	0.005	3.412	29.645	30689	15.6	3.912	159	6.3	28.2	0.0	0.005	7464	7271	20m.pg152_o2_nofp.cx8a12_1g_bee
998	7546	4	0.0	3363.0	28.6	0.001	0.005	3.369	29.286	29530	15.0	3.913	159	6.3	27.6	0.0	0.007	7302	7096	20m.pg152_o2_nofp.cx8a14_1g_bee
998	7599	0	0.0	3394.2	28.9	0.000	0.000	3.400	29.654	29736	15.0	3.913	158	6.3	16.3	0.0	0.005	7367	7160	20m.pg152_o2_nofp.cx8a15_1g_bee
998	7788	1	0.0	3157.5	26.8	0.000	0.001	3.163	27.464	30451	15.1	3.910	155	5.1	35.4	0.0	0.004	7400	7206	20m.pg152_o2_nofp.cx8a16_1g_bee
998	7800	1	0.0	3394.4	28.7	0.000	0.001	3.400	29.488	30501	15.4	3.910	158	6.2	28.2	0.0	0.005	7431	7164	20m.pg152_o2_nofp.cx8a17_1g_bee
998	7798	1	0.0	3199.4	26.8	0.000	0.000	3.205	27.501	30482	15.2	3.909	156	5.2	35.9	0.0	0.006	7366	7064	20m.pg152_o2_nofp.cx8a18_1g_bee
l.i0
l.i0: load without secondary indexes
Performance metrics for all DBMS, not just the ones listed above. Some are normalized by throughput, others are not. Legend for results is here.
ips	qps	rps	rmbps	wps	wmbps	rpq	rkbpq	wpi	wkbpi	csps	cpups	cspq	cpupq	dbgb1	dbgb2	rss	maxop	p50	p99	tag
72727	0	0	0.0	259.3	34.6	0.000	0.000	0.004	0.488	8984	23.4	0.124	26	1.9	5.2	0.0	0.005	73053	70615	20m.pg152_o2_nofp.cx8_1g_bee
73260	0	0	0.0	241.0	34.8	0.000	0.000	0.003	0.487	9008	23.4	0.123	26	1.9	5.2	0.0	0.005	73283	69520	20m.pg152_o2_nofp.cx8a1_1g_bee
72993	0	0	0.0	265.0	34.7	0.000	0.000	0.004	0.487	8970	23.1	0.123	25	1.9	5.2	0.0	0.004	73217	70016	20m.pg152_o2_nofp.cx8a2_1g_bee
72464	0	0	0.0	272.2	34.3	0.000	0.000	0.004	0.485	8928	23.3	0.123	26	1.9	5.2	0.0	0.005	72717	69716	20m.pg152_o2_nofp.cx8a3_1g_bee
73260	0	0	0.0	241.9	34.7	0.000	0.000	0.003	0.485	8994	23.3	0.123	25	1.9	5.2	0.0	0.005	73216	71416	20m.pg152_o2_nofp.cx8a4_1g_bee
72464	0	0	0.0	271.2	34.3	0.000	0.000	0.004	0.485	8919	23.3	0.123	26	1.9	5.2	0.0	0.005	72617	69817	20m.pg152_o2_nofp.cx8a9_1g_bee
72993	0	0	0.0	272.7	34.6	0.000	0.000	0.004	0.486	8977	23.1	0.123	25	1.9	5.2	0.0	0.004	72920	70416	20m.pg152_o2_nofp.cx8a10_1g_bee
73260	0	0	0.0	267.1	34.9	0.000	0.000	0.004	0.488	9043	23.3	0.123	25	1.9	5.2	0.0	0.004	73617	70216	20m.pg152_o2_nofp.cx8a12_1g_bee
72464	0	0	0.0	278.2	34.3	0.000	0.000	0.004	0.485	8952	23.2	0.124	26	1.9	5.2	0.0	0.005	72750	69721	20m.pg152_o2_nofp.cx8a14_1g_bee
73529	0	0	0.0	236.7	34.7	0.000	0.000	0.003	0.483	9027	23.4	0.123	25	1.9	5.2	0.0	0.005	73517	70141	20m.pg152_o2_nofp.cx8a15_1g_bee
72202	0	0	0.0	288.4	34.3	0.000	0.000	0.004	0.487	8945	23.3	0.124	26	1.9	5.2	0.0	0.005	72618	69616	20m.pg152_o2_nofp.cx8a16_1g_bee
72464	0	0	0.0	272.6	34.3	0.000	0.000	0.004	0.485	8941	23.3	0.123	26	1.9	5.2	0.0	0.004	72818	69618	20m.pg152_o2_nofp.cx8a17_1g_bee
72727	0	0	0.0	271.9	34.5	0.000	0.000	0.004	0.485	8970	23.2	0.123	26	1.9	5.2	0.0	0.005	72919	68821	20m.pg152_o2_nofp.cx8a18_1g_bee
l.x
l.x: create secondary indexes
Performance metrics for all DBMS, not just the ones listed above. Some are normalized by throughput, others are not. Legend for results is here.
ips	qps	rps	rmbps	wps	wmbps	rpq	rkbpq	wpi	wkbpi	csps	cpups	cspq	cpupq	dbgb1	dbgb2	rss	maxop	p50	p99	tag
233721	0	0	0.0	126.8	54.3	0.000	0.000	0.001	0.238	740	12.1	0.003	4	3.7	8.6	0.0	0.003	NA	NA	20m.pg152_o2_nofp.cx8_1g_bee
231034	0	0	0.0	77.9	36.0	0.000	0.000	0.000	0.160	716	12.3	0.003	4	3.7	8.0	0.0	0.003	NA	NA	20m.pg152_o2_nofp.cx8a1_1g_bee
233721	0	0	0.0	118.2	53.0	0.000	0.000	0.001	0.232	705	11.9	0.003	4	3.7	8.6	0.0	0.003	NA	NA	20m.pg152_o2_nofp.cx8a2_1g_bee
231034	0	0	0.0	121.4	52.7	0.000	0.000	0.001	0.233	665	12.2	0.003	4	3.7	8.6	0.0	0.003	NA	NA	20m.pg152_o2_nofp.cx8a3_1g_bee
233721	0	0	0.0	117.8	53.6	0.000	0.000	0.001	0.235	693	12.1	0.003	4	3.7	8.6	0.0	0.003	NA	NA	20m.pg152_o2_nofp.cx8a4_1g_bee
233721	0	0	0.0	119.1	54.0	0.000	0.000	0.001	0.237	693	12.1	0.003	4	3.7	8.6	0.0	0.003	NA	NA	20m.pg152_o2_nofp.cx8a9_1g_bee
233721	0	0	0.0	119.9	53.8	0.000	0.000	0.001	0.236	729	12.3	0.003	4	3.7	8.6	0.0	0.004	NA	NA	20m.pg152_o2_nofp.cx8a10_1g_bee
239286	0	0	0.0	99.4	44.7	0.000	0.000	0.000	0.191	767	12.5	0.003	4	3.7	8.6	0.0	0.003	NA	NA	20m.pg152_o2_nofp.cx8a12_1g_bee
233721	0	0	0.0	119.6	53.1	0.000	0.000	0.001	0.233	774	12.1	0.003	4	3.7	8.6	0.0	0.003	NA	NA	20m.pg152_o2_nofp.cx8a14_1g_bee
233721	0	0	0.0	124.7	53.4	0.000	0.000	0.001	0.234	765	12.2	0.003	4	3.7	8.6	0.0	0.003	NA	NA	20m.pg152_o2_nofp.cx8a15_1g_bee
231034	0	0	0.0	115.0	53.4	0.000	0.000	0.000	0.237	803	12.2	0.003	4	3.7	8.6	0.0	0.003	NA	NA	20m.pg152_o2_nofp.cx8a16_1g_bee
233721	0	0	0.0	116.1	50.4	0.000	0.000	0.000	0.221	734	12.3	0.003	4	3.7	8.6	0.0	0.003	NA	NA	20m.pg152_o2_nofp.cx8a17_1g_bee
239286	0	0	0.0	82.6	34.4	0.000	0.000	0.000	0.147	793	12.9	0.003	4	3.7	8.0	0.0	0.003	NA	NA	20m.pg152_o2_nofp.cx8a18_1g_bee
l.i1
l.i1: continue load after secondary indexes created
Performance metrics for all DBMS, not just the ones listed above. Some are normalized by throughput, others are not. Legend for results is here.
ips	qps	rps	rmbps	wps	wmbps	rpq	rkbpq	wpi	wkbpi	csps	cpups	cspq	cpupq	dbgb1	dbgb2	rss	maxop	p50	p99	tag
9897	0	19	0.2	12803.2	142.8	0.002	0.019	1.294	14.772	5756	19.5	0.582	158	6.3	29.5	1.1	0.048	2597	1249	20m.pg152_o2_nofp.cx8_1g_bee
10091	0	17	0.1	12985.7	143.7	0.002	0.014	1.287	14.585	5846	19.6	0.579	155	6.3	27.4	1.1	0.031	2797	1398	20m.pg152_o2_nofp.cx8a1_1g_bee
9432	0	18	0.1	18892.0	163.7	0.002	0.016	2.003	17.770	5530	19.0	0.586	161	6.3	28.8	0.0	0.361	15183	1348	20m.pg152_o2_nofp.cx8a2_1g_bee
9996	0	15	0.1	12899.4	141.8	0.001	0.015	1.290	14.522	5774	19.4	0.578	155	6.3	25.8	0.0	0.031	2347	1348	20m.pg152_o2_nofp.cx8a3_1g_bee
10339	0	20	0.1	13147.7	146.9	0.002	0.015	1.272	14.548	6040	19.7	0.584	152	6.3	30.4	1.1	0.102	4395	1348	20m.pg152_o2_nofp.cx8a4_1g_bee
10410	0	22	0.2	13305.4	148.5	0.002	0.017	1.278	14.610	6002	19.7	0.577	151	6.3	21.1	0.0	0.044	5047	1448	20m.pg152_o2_nofp.cx8a9_1g_bee
10333	0	19	0.1	13136.1	146.7	0.002	0.014	1.271	14.536	6007	19.7	0.581	153	6.3	29.7	0.0	0.064	3346	1348	20m.pg152_o2_nofp.cx8a10_1g_bee
10202	0	19	0.2	13008.0	145.2	0.002	0.016	1.275	14.571	5934	19.6	0.582	154	6.3	29.6	0.0	0.101	3046	1398	20m.pg152_o2_nofp.cx8a12_1g_bee
9535	0	18	0.1	19040.2	165.0	0.002	0.014	1.997	17.719	5606	19.1	0.588	160	6.3	28.9	0.0	0.329	14983	1249	20m.pg152_o2_nofp.cx8a14_1g_bee
10204	0	24	0.3	13170.4	146.8	0.002	0.026	1.291	14.728	5860	19.7	0.574	154	6.3	16.3	1.0	0.041	2697	1249	20m.pg152_o2_nofp.cx8a15_1g_bee
17036	0	17	0.1	17397.0	199.6	0.001	0.006	1.021	11.999	10357	24.9	0.608	117	5.1	36.9	1.0	0.135	20426	3546	20m.pg152_o2_nofp.cx8a16_1g_bee
9042	0	16	0.1	9427.0	135.1	0.002	0.016	1.043	15.301	4992	18.2	0.552	161	6.2	28.6	1.0	0.033	2647	1249	20m.pg152_o2_nofp.cx8a17_1g_bee
16900	0	7	0.0	18629.4	212.7	0.000	0.002	1.102	12.888	10294	25.1	0.609	119	5.2	37.1	0.0	0.033	20128	3546	20m.pg152_o2_nofp.cx8a18_1g_bee
q100.1
q100.1: range queries with 100 insert/s per client
Performance metrics for all DBMS, not just the ones listed above. Some are normalized by throughput, others are not. Legend for results is here.
ips	qps	rps	rmbps	wps	wmbps	rpq	rkbpq	wpi	wkbpi	csps	cpups	cspq	cpupq	dbgb1	dbgb2	rss	maxop	p50	p99	tag
100	7803	0	0.0	473.9	4.3	0.000	0.000	4.749	43.676	30016	13.3	3.847	136	6.3	29.5	0.0	0.002	7463	7350	20m.pg152_o2_nofp.cx8_1g_bee
100	7900	0	0.0	453.8	4.2	0.000	0.000	4.548	42.701	30454	13.4	3.855	136	6.3	27.4	0.0	0.003	7543	7286	20m.pg152_o2_nofp.cx8a1_1g_bee
100	7720	1	0.0	449.2	3.8	0.000	0.001	4.501	38.865	29719	13.2	3.849	137	6.3	28.7	0.0	0.004	7415	7256	20m.pg152_o2_nofp.cx8a2_1g_bee
100	7947	0	0.0	464.5	3.9	0.000	0.000	4.654	40.397	30562	13.2	3.846	133	6.3	25.8	0.0	0.003	7576	7447	20m.pg152_o2_nofp.cx8a3_1g_bee
100	7863	0	0.0	456.6	4.6	0.000	0.000	4.575	47.259	30303	13.5	3.854	137	6.3	30.4	0.0	0.004	7527	7320	20m.pg152_o2_nofp.cx8a4_1g_bee
100	7912	0	0.0	464.5	4.9	0.000	0.000	4.654	50.263	30540	13.4	3.860	135	6.3	21.1	0.0	0.003	7439	7256	20m.pg152_o2_nofp.cx8a9_1g_bee
100	7874	0	0.0	471.5	4.8	0.000	0.000	4.730	48.947	30364	13.5	3.856	137	6.3	29.7	0.0	0.004	7559	7304	20m.pg152_o2_nofp.cx8a10_1g_bee
100	7854	0	0.0	453.7	4.4	0.000	0.000	4.546	44.900	30274	13.3	3.855	135	6.3	29.6	0.0	0.004	7591	7382	20m.pg152_o2_nofp.cx8a12_1g_bee
100	7760	0	0.0	452.7	3.8	0.000	0.000	4.541	39.031	29876	13.4	3.850	138	6.3	28.9	0.0	0.003	7464	7336	20m.pg152_o2_nofp.cx8a14_1g_bee
100	7778	0	0.0	456.7	4.0	0.000	0.000	4.581	41.056	29945	13.0	3.850	134	6.3	16.3	0.0	0.004	7446	7334	20m.pg152_o2_nofp.cx8a15_1g_bee
100	7901	0	0.0	473.5	4.8	0.000	0.000	4.744	49.084	30446	13.4	3.854	136	5.1	36.9	0.0	0.003	7559	7387	20m.pg152_o2_nofp.cx8a16_1g_bee
100	8015	0	0.0	472.5	4.3	0.000	0.000	4.734	44.305	30858	13.6	3.850	136	6.2	28.6	0.0	0.004	7638	7495	20m.pg152_o2_nofp.cx8a17_1g_bee
100	7761	0	0.0	467.2	4.3	0.000	0.000	4.682	43.658	29876	13.4	3.850	138	5.2	37.1	0.0	0.004	7400	7208	20m.pg152_o2_nofp.cx8a18_1g_bee
q500.1
q500.1: range queries with 500 insert/s per client
Performance metrics for all DBMS, not just the ones listed above. Some are normalized by throughput, others are not. Legend for results is here.
ips	qps	rps	rmbps	wps	wmbps	rpq	rkbpq	wpi	wkbpi	csps	cpups	cspq	cpupq	dbgb1	dbgb2	rss	maxop	p50	p99	tag
499	7668	2	0.0	1776.6	15.3	0.000	0.001	3.560	31.334	29758	13.7	3.881	143	6.3	29.2	0.0	0.004	7335	7176	20m.pg152_o2_nofp.cx8_1g_bee
499	7859	1	0.0	1788.1	14.7	0.000	0.001	3.583	30.262	30443	14.0	3.874	143	6.3	27.3	0.0	0.006	7416	7240	20m.pg152_o2_nofp.cx8a1_1g_bee
499	7763	1	0.0	1791.5	15.6	0.000	0.001	3.589	32.029	30140	14.1	3.882	145	6.3	28.7	0.0	0.007	7383	7160	20m.pg152_o2_nofp.cx8a2_1g_bee
499	7884	0	0.0	1781.8	14.1	0.000	0.000	3.570	28.950	30481	13.7	3.866	139	6.3	25.8	0.0	0.004	7479	7342	20m.pg152_o2_nofp.cx8a3_1g_bee
499	7774	2	0.0	1791.3	15.2	0.000	0.001	3.589	31.171	30137	13.8	3.877	142	6.3	30.4	0.0	0.003	7446	7318	20m.pg152_o2_nofp.cx8a4_1g_bee
499	7671	3	0.0	1789.1	16.2	0.000	0.003	3.585	33.225	29850	13.9	3.891	145	6.3	21.1	0.0	0.004	7382	7208	20m.pg152_o2_nofp.cx8a9_1g_bee
499	7777	1	0.0	1787.0	15.2	0.000	0.001	3.580	31.096	30144	13.6	3.876	140	6.3	29.7	0.0	0.003	7480	7367	20m.pg152_o2_nofp.cx8a10_1g_bee
499	7919	2	0.0	1790.8	15.2	0.000	0.001	3.590	31.125	30701	14.1	3.877	142	6.3	29.6	0.0	0.005	7480	7336	20m.pg152_o2_nofp.cx8a12_1g_bee
499	7692	2	0.0	1787.6	15.6	0.000	0.002	3.584	31.959	29874	14.0	3.884	146	6.3	28.9	0.0	0.003	7303	7126	20m.pg152_o2_nofp.cx8a14_1g_bee
499	7732	0	0.0	1785.8	15.6	0.000	0.000	3.578	31.932	30013	13.7	3.882	142	6.3	16.3	0.0	0.004	7432	7256	20m.pg152_o2_nofp.cx8a15_1g_bee
499	7791	0	0.0	1773.6	15.9	0.000	0.000	3.554	32.544	30228	14.2	3.880	146	5.1	36.9	0.0	0.003	7445	7254	20m.pg152_o2_nofp.cx8a16_1g_bee
499	7689	1	0.0	1781.9	15.5	0.000	0.001	3.570	31.843	29847	13.8	3.882	144	6.2	28.6	0.0	0.005	7463	7288	20m.pg152_o2_nofp.cx8a17_1g_bee
499	7637	0	0.0	1792.8	15.8	0.000	0.000	3.592	32.395	29643	13.9	3.881	146	5.2	37.1	0.0	0.006	7336	7160	20m.pg152_o2_nofp.cx8a18_1g_bee
q1000.1
q1000.1: range queries with 1000 insert/s per client
Performance metrics for all DBMS, not just the ones listed above. Some are normalized by throughput, others are not. Legend for results is here.
ips	qps	rps	rmbps	wps	wmbps	rpq	rkbpq	wpi	wkbpi	csps	cpups	cspq	cpupq	dbgb1	dbgb2	rss	maxop	p50	p99	tag
998	7588	0	0.0	3388.6	29.0	0.000	0.000	3.394	29.711	29673	15.3	3.911	161	6.3	27.4	0.0	0.003	7321	7096	20m.pg152_o2_nofp.cx8_1g_bee
998	7803	1	0.0	3398.6	28.3	0.000	0.001	3.404	29.013	30453	15.3	3.903	157	6.3	26.3	0.0	0.004	7431	7064	20m.pg152_o2_nofp.cx8a1_1g_bee
998	7617	2	0.0	3383.4	28.7	0.000	0.002	3.389	29.464	29805	15.2	3.913	160	6.3	27.2	0.0	0.003	7333	7080	20m.pg152_o2_nofp.cx8a2_1g_bee
998	7762	0	0.0	3387.5	27.8	0.000	0.000	3.393	28.517	30290	15.5	3.902	160	6.3	25.8	0.0	0.004	7431	7196	20m.pg152_o2_nofp.cx8a3_1g_bee
998	7580	4	0.0	3399.7	28.9	0.001	0.004	3.405	29.621	29667	15.1	3.914	159	6.3	28.7	0.0	0.003	7351	7176	20m.pg152_o2_nofp.cx8a4_1g_bee
998	7614	13	0.1	3399.3	29.8	0.002	0.013	3.407	30.617	29904	15.5	3.928	163	6.3	21.1	0.0	0.003	7287	7096	20m.pg152_o2_nofp.cx8a9_1g_bee
998	7562	1	0.0	3379.4	28.7	0.000	0.001	3.385	29.435	29595	15.0	3.913	159	6.3	28.0	0.0	0.005	7352	7192	20m.pg152_o2_nofp.cx8a10_1g_bee
998	7844	6	0.0	3404.4	28.9	0.001	0.005	3.412	29.645	30689	15.6	3.912	159	6.3	28.2	0.0	0.005	7464	7271	20m.pg152_o2_nofp.cx8a12_1g_bee
998	7546	4	0.0	3363.0	28.6	0.001	0.005	3.369	29.286	29530	15.0	3.913	159	6.3	27.6	0.0	0.007	7302	7096	20m.pg152_o2_nofp.cx8a14_1g_bee
998	7599	0	0.0	3394.2	28.9	0.000	0.000	3.400	29.654	29736	15.0	3.913	158	6.3	16.3	0.0	0.005	7367	7160	20m.pg152_o2_nofp.cx8a15_1g_bee
998	7788	1	0.0	3157.5	26.8	0.000	0.001	3.163	27.464	30451	15.1	3.910	155	5.1	35.4	0.0	0.004	7400	7206	20m.pg152_o2_nofp.cx8a16_1g_bee
998	7800	1	0.0	3394.4	28.7	0.000	0.001	3.400	29.488	30501	15.4	3.910	158	6.2	28.2	0.0	0.005	7431	7164	20m.pg152_o2_nofp.cx8a17_1g_bee
998	7798	1	0.0	3199.4	26.8	0.000	0.000	3.205	27.501	30482	15.2	3.909	156	5.2	35.9	0.0	0.006	7366	7064	20m.pg152_o2_nofp.cx8a18_1g_bee
l.i0
- l.i0: load without secondary indexes
- Legend for results is here.
- Each entry lists the percentage of responses that fit in that bucket (slower than max time for previous bucket, faster than min time for next bucket).
Insert response time histogram
256us	1ms	4ms	16ms	64ms	256ms	1s	4s	16s	gt	max	tag
0.000	0.000	99.997	0.003	0.000	0.000	0.000	0.000	0.000	0.000	0.005	pg152_o2_nofp.cx8_1g_bee
0.000	0.000	99.997	0.003	0.000	0.000	0.000	0.000	0.000	0.000	0.005	pg152_o2_nofp.cx8a1_1g_bee
0.000	0.000	99.997	0.003	0.000	0.000	0.000	0.000	0.000	0.000	0.004	pg152_o2_nofp.cx8a2_1g_bee
0.000	0.000	99.997	0.003	0.000	0.000	0.000	0.000	0.000	0.000	0.005	pg152_o2_nofp.cx8a3_1g_bee
0.000	0.000	99.997	0.003	0.000	0.000	0.000	0.000	0.000	0.000	0.005	pg152_o2_nofp.cx8a4_1g_bee
0.000	0.000	99.997	0.003	0.000	0.000	0.000	0.000	0.000	0.000	0.005	pg152_o2_nofp.cx8a9_1g_bee
0.000	0.000	99.997	0.003	0.000	0.000	0.000	0.000	0.000	0.000	0.004	pg152_o2_nofp.cx8a10_1g_bee
0.000	0.000	99.997	0.003	0.000	0.000	0.000	0.000	0.000	0.000	0.004	pg152_o2_nofp.cx8a12_1g_bee
0.000	0.000	99.997	0.003	0.000	0.000	0.000	0.000	0.000	0.000	0.005	pg152_o2_nofp.cx8a14_1g_bee
0.000	0.000	99.997	0.003	0.000	0.000	0.000	0.000	0.000	0.000	0.005	pg152_o2_nofp.cx8a15_1g_bee
0.000	0.000	99.997	0.003	0.000	0.000	0.000	0.000	0.000	0.000	0.005	pg152_o2_nofp.cx8a16_1g_bee
0.000	0.000	99.998	0.002	0.000	0.000	0.000	0.000	0.000	0.000	0.004	pg152_o2_nofp.cx8a17_1g_bee
0.000	0.000	99.997	0.003	0.000	0.000	0.000	0.000	0.000	0.000	0.005	pg152_o2_nofp.cx8a18_1g_bee
l.x
- l.x: create secondary indexes
- Legend for results is here.
- Each entry lists the percentage of responses that fit in that bucket (slower than max time for previous bucket, faster than min time for next bucket).
TODO - determine whether there is data for create index response time
l.i1
- l.i1: continue load after secondary indexes created
- Legend for results is here.
- Each entry lists the percentage of responses that fit in that bucket (slower than max time for previous bucket, faster than min time for next bucket).
Insert response time histogram
256us	1ms	4ms	16ms	64ms	256ms	1s	4s	16s	gt	max	tag
0.000	0.000	99.954	0.043	0.003	0.000	0.000	0.000	0.000	0.000	0.048	pg152_o2_nofp.cx8_1g_bee
0.000	0.000	99.700	0.298	0.003	0.000	0.000	0.000	0.000	0.000	0.031	pg152_o2_nofp.cx8a1_1g_bee
0.000	0.000	98.879	1.094	0.026	0.001	nonzero	0.000	0.000	0.000	0.361	pg152_o2_nofp.cx8a2_1g_bee
0.000	0.000	99.921	0.076	0.002	0.000	0.000	0.000	0.000	0.000	0.031	pg152_o2_nofp.cx8a3_1g_bee
0.000	0.000	99.957	0.039	0.003	nonzero	0.000	0.000	0.000	0.000	0.102	pg152_o2_nofp.cx8a4_1g_bee
0.000	0.000	99.953	0.044	0.003	0.000	0.000	0.000	0.000	0.000	0.044	pg152_o2_nofp.cx8a9_1g_bee
0.000	0.000	99.953	0.044	0.003	0.000	0.000	0.000	0.000	0.000	0.064	pg152_o2_nofp.cx8a10_1g_bee
0.000	0.000	99.959	0.037	0.004	nonzero	0.000	0.000	0.000	0.000	0.101	pg152_o2_nofp.cx8a12_1g_bee
0.000	0.000	97.637	2.337	0.026	0.001	nonzero	0.000	0.000	0.000	0.329	pg152_o2_nofp.cx8a14_1g_bee
0.000	0.000	99.931	0.063	0.006	0.000	0.000	0.000	0.000	0.000	0.041	pg152_o2_nofp.cx8a15_1g_bee
0.000	0.000	99.969	0.026	0.004	0.001	0.000	0.000	0.000	0.000	0.135	pg152_o2_nofp.cx8a16_1g_bee
0.000	0.000	99.890	0.107	0.002	0.000	0.000	0.000	0.000	0.000	0.033	pg152_o2_nofp.cx8a17_1g_bee
0.000	0.000	99.865	0.134	0.001	0.000	0.000	0.000	0.000	0.000	0.033	pg152_o2_nofp.cx8a18_1g_bee
Delete response time histogram
256us	1ms	4ms	16ms	64ms	256ms	1s	4s	16s	gt	max	tag
0.028	88.041	1.560	0.775	9.595	0.002	0.000	0.000	0.000	0.000	0.148	pg152_o2_nofp.cx8_1g_bee
0.030	89.434	0.697	0.480	9.358	0.001	0.000	0.000	0.000	0.000	0.119	pg152_o2_nofp.cx8a1_1g_bee
0.027	89.679	0.752	0.576	8.964	0.001	0.000	0.000	0.000	0.000	0.182	pg152_o2_nofp.cx8a2_1g_bee
0.035	89.391	0.602	0.550	9.421	0.001	0.000	0.000	0.000	0.000	0.133	pg152_o2_nofp.cx8a3_1g_bee
0.031	89.324	0.993	1.034	8.616	0.002	0.000	0.000	0.000	0.000	0.126	pg152_o2_nofp.cx8a4_1g_bee
0.032	89.845	0.666	0.747	8.709	0.001	0.000	0.000	0.000	0.000	0.116	pg152_o2_nofp.cx8a9_1g_bee
0.030	89.415	1.046	0.794	8.713	0.001	0.000	0.000	0.000	0.000	0.149	pg152_o2_nofp.cx8a10_1g_bee
0.026	89.594	0.748	0.822	8.808	0.001	0.000	0.000	0.000	0.000	0.125	pg152_o2_nofp.cx8a12_1g_bee
0.026	88.634	1.331	0.746	9.261	0.002	0.000	0.000	0.000	0.000	0.204	pg152_o2_nofp.cx8a14_1g_bee
0.027	88.242	2.037	0.345	9.347	0.002	0.000	0.000	0.000	0.000	0.142	pg152_o2_nofp.cx8a15_1g_bee
0.021	83.354	11.034	5.549	0.041	nonzero	0.000	0.000	0.000	0.000	0.071	pg152_o2_nofp.cx8a16_1g_bee
0.030	86.622	1.616	0.456	11.274	0.002	0.000	0.000	0.000	0.000	0.140	pg152_o2_nofp.cx8a17_1g_bee
0.018	84.249	9.958	5.690	0.085	0.000	0.000	0.000	0.000	0.000	0.042	pg152_o2_nofp.cx8a18_1g_bee
q100.1
- q100.1: range queries with 100 insert/s per client
- Legend for results is here.
- Each entry lists the percentage of responses that fit in that bucket (slower than max time for previous bucket, faster than min time for next bucket).
Query response time histogram
256us	1ms	4ms	16ms	64ms	256ms	1s	4s	16s	gt	max	tag
99.908	0.092	nonzero	0.000	0.000	0.000	0.000	0.000	0.000	0.000	0.002	pg152_o2_nofp.cx8_1g_bee
99.912	0.087	nonzero	0.000	0.000	0.000	0.000	0.000	0.000	0.000	0.003	pg152_o2_nofp.cx8a1_1g_bee
99.940	0.060	nonzero	0.000	0.000	0.000	0.000	0.000	0.000	0.000	0.004	pg152_o2_nofp.cx8a2_1g_bee
99.921	0.079	nonzero	0.000	0.000	0.000	0.000	0.000	0.000	0.000	0.003	pg152_o2_nofp.cx8a3_1g_bee
99.928	0.072	0.001	0.000	0.000	0.000	0.000	0.000	0.000	0.000	0.004	pg152_o2_nofp.cx8a4_1g_bee
99.943	0.057	nonzero	0.000	0.000	0.000	0.000	0.000	0.000	0.000	0.003	pg152_o2_nofp.cx8a9_1g_bee
99.921	0.078	nonzero	0.000	0.000	0.000	0.000	0.000	0.000	0.000	0.004	pg152_o2_nofp.cx8a10_1g_bee
99.905	0.095	nonzero	0.000	0.000	0.000	0.000	0.000	0.000	0.000	0.004	pg152_o2_nofp.cx8a12_1g_bee
99.914	0.085	nonzero	0.000	0.000	0.000	0.000	0.000	0.000	0.000	0.003	pg152_o2_nofp.cx8a14_1g_bee
99.955	0.045	nonzero	nonzero	0.000	0.000	0.000	0.000	0.000	0.000	0.004	pg152_o2_nofp.cx8a15_1g_bee
99.926	0.074	nonzero	0.000	0.000	0.000	0.000	0.000	0.000	0.000	0.003	pg152_o2_nofp.cx8a16_1g_bee
99.925	0.075	nonzero	0.000	0.000	0.000	0.000	0.000	0.000	0.000	0.004	pg152_o2_nofp.cx8a17_1g_bee
99.913	0.087	nonzero	0.000	0.000	0.000	0.000	0.000	0.000	0.000	0.004	pg152_o2_nofp.cx8a18_1g_bee
Insert response time histogram
256us	1ms	4ms	16ms	64ms	256ms	1s	4s	16s	gt	max	tag
0.000	0.000	99.750	0.250	0.000	0.000	0.000	0.000	0.000	0.000	0.008	pg152_o2_nofp.cx8_1g_bee
0.000	0.000	47.056	52.944	0.000	0.000	0.000	0.000	0.000	0.000	0.009	pg152_o2_nofp.cx8a1_1g_bee
0.000	0.000	99.750	0.250	0.000	0.000	0.000	0.000	0.000	0.000	0.009	pg152_o2_nofp.cx8a2_1g_bee
0.000	0.000	99.861	0.139	0.000	0.000	0.000	0.000	0.000	0.000	0.005	pg152_o2_nofp.cx8a3_1g_bee
0.000	0.000	99.556	0.444	0.000	0.000	0.000	0.000	0.000	0.000	0.007	pg152_o2_nofp.cx8a4_1g_bee
0.000	0.000	99.667	0.333	0.000	0.000	0.000	0.000	0.000	0.000	0.007	pg152_o2_nofp.cx8a9_1g_bee
0.000	0.000	99.639	0.361	0.000	0.000	0.000	0.000	0.000	0.000	0.013	pg152_o2_nofp.cx8a10_1g_bee
0.000	0.000	98.611	1.389	0.000	0.000	0.000	0.000	0.000	0.000	0.005	pg152_o2_nofp.cx8a12_1g_bee
0.000	0.000	99.722	0.278	0.000	0.000	0.000	0.000	0.000	0.000	0.006	pg152_o2_nofp.cx8a14_1g_bee
0.000	0.000	99.722	0.278	0.000	0.000	0.000	0.000	0.000	0.000	0.005	pg152_o2_nofp.cx8a15_1g_bee
0.000	0.000	99.861	0.139	0.000	0.000	0.000	0.000	0.000	0.000	0.005	pg152_o2_nofp.cx8a16_1g_bee
0.000	0.000	99.722	0.278	0.000	0.000	0.000	0.000	0.000	0.000	0.006	pg152_o2_nofp.cx8a17_1g_bee
0.000	0.000	54.250	45.750	0.000	0.000	0.000	0.000	0.000	0.000	0.013	pg152_o2_nofp.cx8a18_1g_bee
Delete response time histogram
256us	1ms	4ms	16ms	64ms	256ms	1s	4s	16s	gt	max	tag
0.611	96.889	0.167	2.333	0.000	0.000	0.000	0.000	0.000	0.000	0.010	pg152_o2_nofp.cx8_1g_bee
0.000	21.472	77.667	0.861	0.000	0.000	0.000	0.000	0.000	0.000	0.012	pg152_o2_nofp.cx8a1_1g_bee
0.000	20.528	77.222	2.250	0.000	0.000	0.000	0.000	0.000	0.000	0.012	pg152_o2_nofp.cx8a2_1g_bee
0.611	99.333	0.056	0.000	0.000	0.000	0.000	0.000	0.000	0.000	0.002	pg152_o2_nofp.cx8a3_1g_bee
0.000	20.167	78.500	1.333	0.000	0.000	0.000	0.000	0.000	0.000	0.012	pg152_o2_nofp.cx8a4_1g_bee
0.222	98.333	0.611	0.833	0.000	0.000	0.000	0.000	0.000	0.000	0.010	pg152_o2_nofp.cx8a9_1g_bee
0.083	24.750	74.444	0.722	0.000	0.000	0.000	0.000	0.000	0.000	0.012	pg152_o2_nofp.cx8a10_1g_bee
0.722	97.917	0.222	1.139	0.000	0.000	0.000	0.000	0.000	0.000	0.010	pg152_o2_nofp.cx8a12_1g_bee
0.028	20.361	77.556	2.056	0.000	0.000	0.000	0.000	0.000	0.000	0.012	pg152_o2_nofp.cx8a14_1g_bee
0.000	21.167	78.806	0.028	0.000	0.000	0.000	0.000	0.000	0.000	0.006	pg152_o2_nofp.cx8a15_1g_bee
0.222	99.667	0.056	0.056	0.000	0.000	0.000	0.000	0.000	0.000	0.010	pg152_o2_nofp.cx8a16_1g_bee
0.028	25.778	72.667	1.528	0.000	0.000	0.000	0.000	0.000	0.000	0.012	pg152_o2_nofp.cx8a17_1g_bee
0.000	20.889	78.972	0.139	0.000	0.000	0.000	0.000	0.000	0.000	0.011	pg152_o2_nofp.cx8a18_1g_bee
q500.1
- q500.1: range queries with 500 insert/s per client
- Legend for results is here.
- Each entry lists the percentage of responses that fit in that bucket (slower than max time for previous bucket, faster than min time for next bucket).
Query response time histogram
256us	1ms	4ms	16ms	64ms	256ms	1s	4s	16s	gt	max	tag
99.930	0.070	nonzero	0.000	0.000	0.000	0.000	0.000	0.000	0.000	0.004	pg152_o2_nofp.cx8_1g_bee
99.930	0.070	nonzero	nonzero	0.000	0.000	0.000	0.000	0.000	0.000	0.006	pg152_o2_nofp.cx8a1_1g_bee
99.911	0.089	nonzero	nonzero	0.000	0.000	0.000	0.000	0.000	0.000	0.007	pg152_o2_nofp.cx8a2_1g_bee
99.946	0.054	nonzero	nonzero	0.000	0.000	0.000	0.000	0.000	0.000	0.004	pg152_o2_nofp.cx8a3_1g_bee
99.932	0.068	nonzero	0.000	0.000	0.000	0.000	0.000	0.000	0.000	0.003	pg152_o2_nofp.cx8a4_1g_bee
99.902	0.098	nonzero	nonzero	0.000	0.000	0.000	0.000	0.000	0.000	0.004	pg152_o2_nofp.cx8a9_1g_bee
99.938	0.062	nonzero	0.000	0.000	0.000	0.000	0.000	0.000	0.000	0.003	pg152_o2_nofp.cx8a10_1g_bee
99.923	0.077	nonzero	nonzero	0.000	0.000	0.000	0.000	0.000	0.000	0.005	pg152_o2_nofp.cx8a12_1g_bee
99.921	0.079	nonzero	0.000	0.000	0.000	0.000	0.000	0.000	0.000	0.003	pg152_o2_nofp.cx8a14_1g_bee
99.923	0.077	nonzero	nonzero	0.000	0.000	0.000	0.000	0.000	0.000	0.004	pg152_o2_nofp.cx8a15_1g_bee
99.915	0.084	nonzero	0.000	0.000	0.000	0.000	0.000	0.000	0.000	0.003	pg152_o2_nofp.cx8a16_1g_bee
99.914	0.086	nonzero	nonzero	0.000	0.000	0.000	0.000	0.000	0.000	0.005	pg152_o2_nofp.cx8a17_1g_bee
99.928	0.072	nonzero	nonzero	0.000	0.000	0.000	0.000	0.000	0.000	0.006	pg152_o2_nofp.cx8a18_1g_bee
Insert response time histogram
256us	1ms	4ms	16ms	64ms	256ms	1s	4s	16s	gt	max	tag
0.000	0.000	99.806	0.194	0.000	0.000	0.000	0.000	0.000	0.000	0.008	pg152_o2_nofp.cx8_1g_bee
0.000	0.000	89.283	10.717	0.000	0.000	0.000	0.000	0.000	0.000	0.009	pg152_o2_nofp.cx8a1_1g_bee
0.000	0.000	99.844	0.156	0.000	0.000	0.000	0.000	0.000	0.000	0.006	pg152_o2_nofp.cx8a2_1g_bee
0.000	0.000	99.944	0.056	0.000	0.000	0.000	0.000	0.000	0.000	0.006	pg152_o2_nofp.cx8a3_1g_bee
0.000	0.000	99.867	0.133	0.000	0.000	0.000	0.000	0.000	0.000	0.009	pg152_o2_nofp.cx8a4_1g_bee
0.000	0.000	99.878	0.122	0.000	0.000	0.000	0.000	0.000	0.000	0.008	pg152_o2_nofp.cx8a9_1g_bee
0.000	0.000	99.878	0.122	0.000	0.000	0.000	0.000	0.000	0.000	0.009	pg152_o2_nofp.cx8a10_1g_bee
0.000	0.000	99.906	0.094	0.000	0.000	0.000	0.000	0.000	0.000	0.008	pg152_o2_nofp.cx8a12_1g_bee
0.000	0.000	99.811	0.189	0.000	0.000	0.000	0.000	0.000	0.000	0.006	pg152_o2_nofp.cx8a14_1g_bee
0.000	0.000	99.872	0.128	0.000	0.000	0.000	0.000	0.000	0.000	0.007	pg152_o2_nofp.cx8a15_1g_bee
0.000	0.000	99.944	0.056	0.000	0.000	0.000	0.000	0.000	0.000	0.006	pg152_o2_nofp.cx8a16_1g_bee
0.000	0.000	99.872	0.128	0.000	0.000	0.000	0.000	0.000	0.000	0.008	pg152_o2_nofp.cx8a17_1g_bee
0.000	0.000	88.844	11.156	0.000	0.000	0.000	0.000	0.000	0.000	0.011	pg152_o2_nofp.cx8a18_1g_bee
Delete response time histogram
256us	1ms	4ms	16ms	64ms	256ms	1s	4s	16s	gt	max	tag
3.467	76.617	4.094	15.822	0.000	0.000	0.000	0.000	0.000	0.000	0.014	pg152_o2_nofp.cx8_1g_bee
2.122	87.106	2.828	7.922	0.022	0.000	0.000	0.000	0.000	0.000	0.018	pg152_o2_nofp.cx8a1_1g_bee
2.800	84.506	5.161	7.506	0.028	0.000	0.000	0.000	0.000	0.000	0.018	pg152_o2_nofp.cx8a2_1g_bee
3.172	76.606	0.144	20.078	0.000	0.000	0.000	0.000	0.000	0.000	0.016	pg152_o2_nofp.cx8a3_1g_bee
3.333	86.822	1.578	8.233	0.033	0.000	0.000	0.000	0.000	0.000	0.017	pg152_o2_nofp.cx8a4_1g_bee
2.450	73.189	0.206	24.156	0.000	0.000	0.000	0.000	0.000	0.000	0.016	pg152_o2_nofp.cx8a9_1g_bee
3.211	88.456	5.439	2.878	0.017	0.000	0.000	0.000	0.000	0.000	0.018	pg152_o2_nofp.cx8a10_1g_bee
3.128	72.750	0.150	23.967	0.006	0.000	0.000	0.000	0.000	0.000	0.016	pg152_o2_nofp.cx8a12_1g_bee
3.294	86.728	1.522	8.428	0.028	0.000	0.000	0.000	0.000	0.000	0.020	pg152_o2_nofp.cx8a14_1g_bee
3.750	84.011	4.061	8.122	0.056	0.000	0.000	0.000	0.000	0.000	0.020	pg152_o2_nofp.cx8a15_1g_bee
3.861	70.972	0.467	24.694	0.006	0.000	0.000	0.000	0.000	0.000	0.016	pg152_o2_nofp.cx8a16_1g_bee
3.117	88.328	0.194	8.339	0.022	0.000	0.000	0.000	0.000	0.000	0.017	pg152_o2_nofp.cx8a17_1g_bee
1.700	88.633	3.300	6.356	0.011	0.000	0.000	0.000	0.000	0.000	0.018	pg152_o2_nofp.cx8a18_1g_bee
q1000.1
- q1000.1: range queries with 1000 insert/s per client
- Legend for results is here.
- Each entry lists the percentage of responses that fit in that bucket (slower than max time for previous bucket, faster than min time for next bucket).
Query response time histogram
256us	1ms	4ms	16ms	64ms	256ms	1s	4s	16s	gt	max	tag
99.918	0.082	nonzero	0.000	0.000	0.000	0.000	0.000	0.000	0.000	0.003	pg152_o2_nofp.cx8_1g_bee
99.917	0.083	nonzero	nonzero	0.000	0.000	0.000	0.000	0.000	0.000	0.004	pg152_o2_nofp.cx8a1_1g_bee
99.908	0.092	nonzero	0.000	0.000	0.000	0.000	0.000	0.000	0.000	0.003	pg152_o2_nofp.cx8a2_1g_bee
99.924	0.075	nonzero	nonzero	0.000	0.000	0.000	0.000	0.000	0.000	0.004	pg152_o2_nofp.cx8a3_1g_bee
99.919	0.081	nonzero	0.000	0.000	0.000	0.000	0.000	0.000	0.000	0.003	pg152_o2_nofp.cx8a4_1g_bee
99.902	0.097	nonzero	0.000	0.000	0.000	0.000	0.000	0.000	0.000	0.003	pg152_o2_nofp.cx8a9_1g_bee
99.919	0.080	nonzero	nonzero	0.000	0.000	0.000	0.000	0.000	0.000	0.005	pg152_o2_nofp.cx8a10_1g_bee
99.916	0.084	nonzero	nonzero	0.000	0.000	0.000	0.000	0.000	0.000	0.005	pg152_o2_nofp.cx8a12_1g_bee
99.905	0.094	0.001	nonzero	0.000	0.000	0.000	0.000	0.000	0.000	0.007	pg152_o2_nofp.cx8a14_1g_bee
99.919	0.081	nonzero	nonzero	0.000	0.000	0.000	0.000	0.000	0.000	0.005	pg152_o2_nofp.cx8a15_1g_bee
99.917	0.082	nonzero	0.000	0.000	0.000	0.000	0.000	0.000	0.000	0.004	pg152_o2_nofp.cx8a16_1g_bee
99.916	0.084	nonzero	nonzero	0.000	0.000	0.000	0.000	0.000	0.000	0.005	pg152_o2_nofp.cx8a17_1g_bee
99.918	0.081	nonzero	nonzero	0.000	0.000	0.000	0.000	0.000	0.000	0.006	pg152_o2_nofp.cx8a18_1g_bee
Insert response time histogram
256us	1ms	4ms	16ms	64ms	256ms	1s	4s	16s	gt	max	tag
0.000	0.000	99.897	0.103	0.000	0.000	0.000	0.000	0.000	0.000	0.007	pg152_o2_nofp.cx8_1g_bee
0.000	0.000	97.961	2.039	0.000	0.000	0.000	0.000	0.000	0.000	0.009	pg152_o2_nofp.cx8a1_1g_bee
0.000	0.000	99.900	0.100	0.000	0.000	0.000	0.000	0.000	0.000	0.006	pg152_o2_nofp.cx8a2_1g_bee
0.000	0.000	99.964	0.036	0.000	0.000	0.000	0.000	0.000	0.000	0.007	pg152_o2_nofp.cx8a3_1g_bee
0.000	0.000	99.908	0.092	0.000	0.000	0.000	0.000	0.000	0.000	0.009	pg152_o2_nofp.cx8a4_1g_bee
0.000	0.000	99.939	0.061	0.000	0.000	0.000	0.000	0.000	0.000	0.007	pg152_o2_nofp.cx8a9_1g_bee
0.000	0.000	99.931	0.069	0.000	0.000	0.000	0.000	0.000	0.000	0.009	pg152_o2_nofp.cx8a10_1g_bee
0.000	0.000	99.900	0.100	0.000	0.000	0.000	0.000	0.000	0.000	0.009	pg152_o2_nofp.cx8a12_1g_bee
0.000	0.000	99.831	0.169	0.000	0.000	0.000	0.000	0.000	0.000	0.011	pg152_o2_nofp.cx8a14_1g_bee
0.000	0.000	99.878	0.122	0.000	0.000	0.000	0.000	0.000	0.000	0.009	pg152_o2_nofp.cx8a15_1g_bee
0.000	0.000	99.972	0.028	0.000	0.000	0.000	0.000	0.000	0.000	0.006	pg152_o2_nofp.cx8a16_1g_bee
0.000	0.000	99.947	0.053	0.000	0.000	0.000	0.000	0.000	0.000	0.008	pg152_o2_nofp.cx8a17_1g_bee
0.000	0.000	95.069	4.931	0.000	0.000	0.000	0.000	0.000	0.000	0.009	pg152_o2_nofp.cx8a18_1g_bee
Delete response time histogram
256us	1ms	4ms	16ms	64ms	256ms	1s	4s	16s	gt	max	tag
2.375	74.325	6.308	16.725	0.267	0.000	0.000	0.000	0.000	0.000	0.023	pg152_o2_nofp.cx8_1g_bee
1.553	81.500	6.036	10.892	0.019	0.000	0.000	0.000	0.000	0.000	0.020	pg152_o2_nofp.cx8a1_1g_bee
1.831	80.681	5.939	11.522	0.028	0.000	0.000	0.000	0.000	0.000	0.016	pg152_o2_nofp.cx8a2_1g_bee
1.831	74.975	0.364	21.028	1.803	0.000	0.000	0.000	0.000	0.000	0.028	pg152_o2_nofp.cx8a3_1g_bee
1.939	82.636	5.358	10.064	0.003	0.000	0.000	0.000	0.000	0.000	0.016	pg152_o2_nofp.cx8a4_1g_bee
1.203	77.283	0.181	12.256	9.078	0.000	0.000	0.000	0.000	0.000	0.040	pg152_o2_nofp.cx8a9_1g_bee
1.350	77.078	10.667	10.883	0.022	0.000	0.000	0.000	0.000	0.000	0.018	pg152_o2_nofp.cx8a10_1g_bee
1.792	74.747	0.244	21.161	2.056	0.000	0.000	0.000	0.000	0.000	0.030	pg152_o2_nofp.cx8a12_1g_bee
2.103	82.272	6.583	9.042	0.000	0.000	0.000	0.000	0.000	0.000	0.015	pg152_o2_nofp.cx8a14_1g_bee
1.625	83.422	4.111	10.839	0.003	0.000	0.000	0.000	0.000	0.000	0.017	pg152_o2_nofp.cx8a15_1g_bee
1.847	76.294	2.886	18.972	0.000	0.000	0.000	0.000	0.000	0.000	0.011	pg152_o2_nofp.cx8a16_1g_bee
1.783	82.989	3.725	11.497	0.006	0.000	0.000	0.000	0.000	0.000	0.018	pg152_o2_nofp.cx8a17_1g_bee
1.286	83.789	8.186	6.739	0.000	0.000	0.000	0.000	0.000	0.000	0.016	pg152_o2_nofp.cx8a18_1g_bee