Introduction
This is a report for the insert benchmark with 3200M docs and 8 client(s). It is generated by scripts (bash, awk, sed) and Tufte might not be impressed. An overview of the insert benchmark is here and a short update is here. Below, by DBMS, I mean DBMS+version.config. An example is my8020.c10b40 where my means MySQL, 8020 is version 8.0.20 and c10b40 is the name for the configuration file.
The test server is a c2-standard-30 from GCP with 15 cores, hyperthreads disabled, 120G RAM, XFS + SW RAID 0 on 4 NVMe devices (1.5TB). The benchmark was run with 8 client and there were 1 or 3 connections per client (1 for queries or inserts without rate limits, 1+1 for rate limited inserts+deletes). There are 8 tables, client per table. It loads 400M rows per table without secondary indexes, creates secondary indexes, then inserts 10M rows per table with a delete per insert to avoid growing the table. It then does 3 read+write tests for 1800s each that do queries as fast as possible with 100, 500 and then 1000 inserts/second/client concurrent with the queries and 1000 deletes/second to avoid growing the table. The database is larger than memory.
The tested DBMS are:
- my5740_rel_lto.cy10a_gcp_c2s30 - InnoDB and MySQL 5.7.40, rel_lto build, cy10a_gcp_c2s30 config, compiled with CMAKE_BUILD_TYPE=Release -O2, base config
- my5740_rel_lto.cy10a1_gcp_c2s30 - InnoDB and MySQL 5.7.40, rel_lto build, cy10a_gcp_c2s30 config, compiled with CMAKE_BUILD_TYPE=Release -O2, adds innodb_use_native_aio=off
- my5740_rel_lto.cy10a2_gcp_c2s30 - InnoDB and MySQL 5.7.40, rel_lto build, cy10a_gcp_c2s30 config, compiled with CMAKE_BUILD_TYPE=Release -O2, adds innodb_io_capacity=20k, innodb_io_capacity_max=40k
- my5740_rel_lto.cy10a3_gcp_c2s30 - InnoDB and MySQL 5.7.40, rel_lto build, cy10a_gcp_c2s30 config, compiled with CMAKE_BUILD_TYPE=Release -O2, adds innodb_io_capacity=20k, innodb_io_capacity_max=40k, innodb_flush_sync=OFF
- my5740_rel_lto.cy10a4_gcp_c2s30 - InnoDB and MySQL 5.7.40, rel_lto build, cy10a_gcp_c2s30 config, compiled with CMAKE_BUILD_TYPE=Release -O2, adds innodb_flush_method=fsync
Contents
- Summary
- l.i0: load without secondary indexes
- l.x: create secondary indexes
- l.i1: continue load after secondary indexes created
- q100.1: range queries with 100 insert/s per client
- q500.1: range queries with 500 insert/s per client
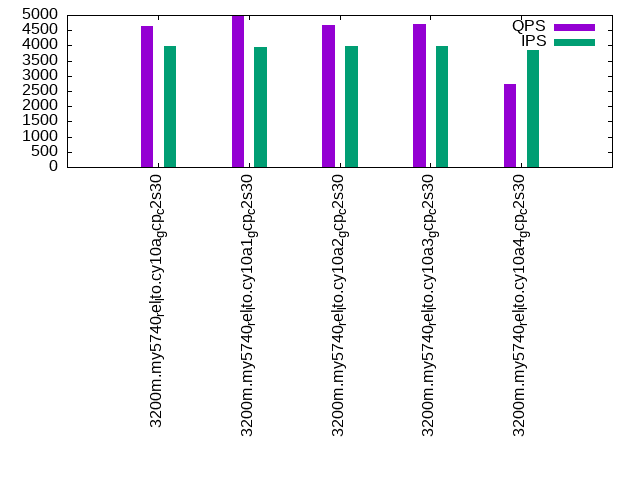
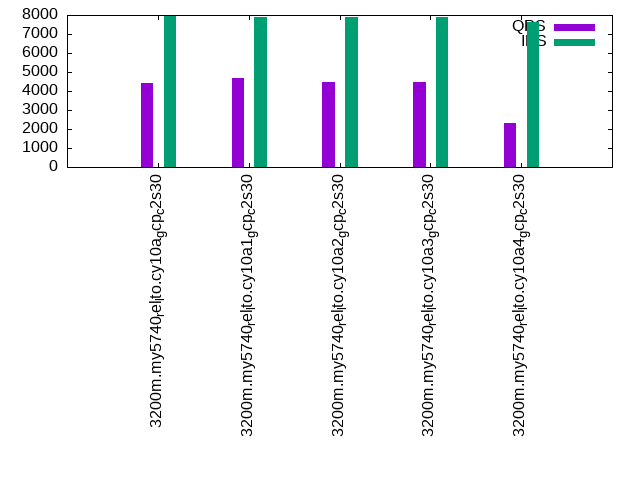
- q1000.1: range queries with 1000 insert/s per client
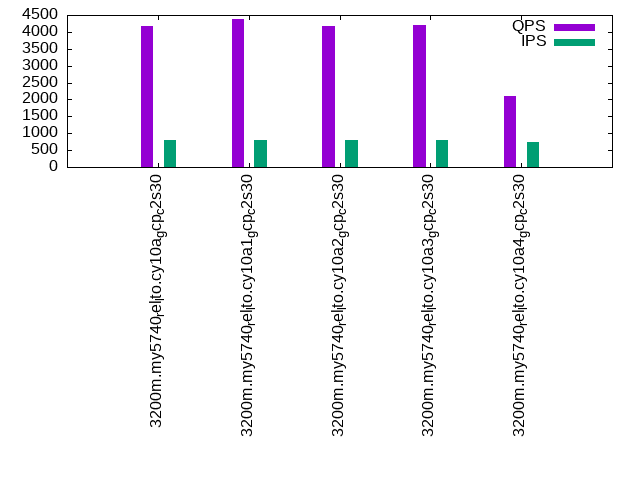
Summary
The numbers are inserts/s for l.i0 and l.i1, indexed docs (or rows) /s for l.x and queries/s for q*.2. The values are the average rate over the entire test for inserts (IPS) and queries (QPS). The range of values for IPS and QPS is split into 3 parts: bottom 25%, middle 50%, top 25%. Values in the bottom 25% have a red background, values in the top 25% have a green background and values in the middle have no color. A gray background is used for values that can be ignored because the DBMS did not sustain the target insert rate. Red backgrounds are not used when the minimum value is within 80% of the max value.
| dbms | l.i0 | l.x | l.i1 | q100.1 | q500.1 | q1000.1 |
|---|---|---|---|---|---|---|
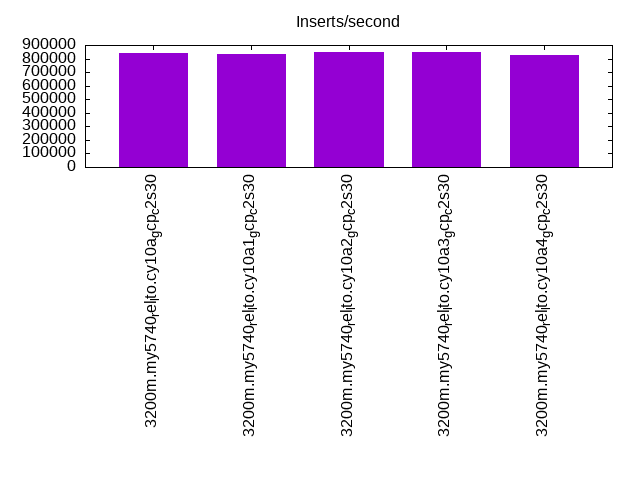
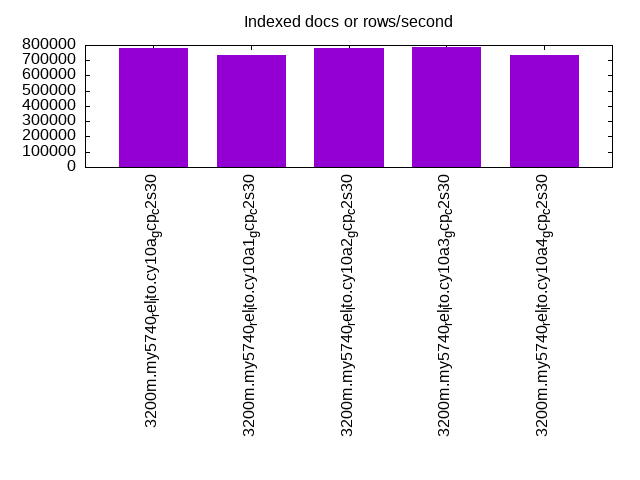
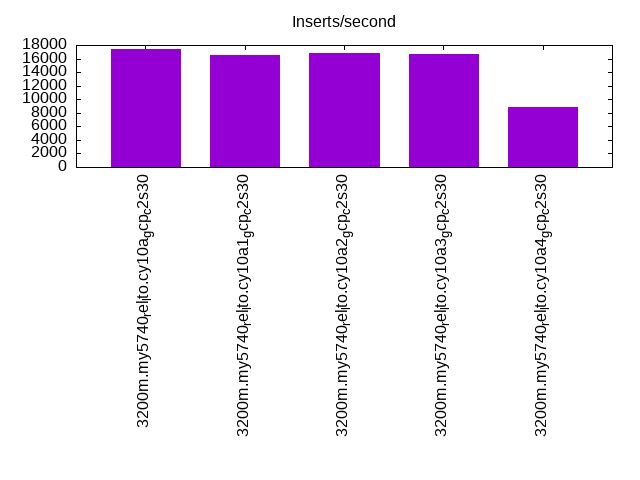
| 3200m.my5740_rel_lto.cy10a_gcp_c2s30 | 844327 | 778992 | 17433 | 4168 | 4646 | 4407 |
| 3200m.my5740_rel_lto.cy10a1_gcp_c2s30 | 834855 | 732624 | 16505 | 4384 | 4998 | 4694 |
| 3200m.my5740_rel_lto.cy10a2_gcp_c2s30 | 848806 | 782803 | 16842 | 4184 | 4681 | 4463 |
| 3200m.my5740_rel_lto.cy10a3_gcp_c2s30 | 850159 | 784530 | 16705 | 4214 | 4706 | 4475 |
| 3200m.my5740_rel_lto.cy10a4_gcp_c2s30 | 828157 | 733800 | 8877 | 2095 | 2720 | 2293 |
This table has relative throughput, throughput for the DBMS relative to the DBMS in the first line, using the absolute throughput from the previous table.
| dbms | l.i0 | l.x | l.i1 | q100.1 | q500.1 | q1000.1 |
|---|---|---|---|---|---|---|
| 3200m.my5740_rel_lto.cy10a_gcp_c2s30 | 1.00 | 1.00 | 1.00 | 1.00 | 1.00 | 1.00 |
| 3200m.my5740_rel_lto.cy10a1_gcp_c2s30 | 0.99 | 0.94 | 0.95 | 1.05 | 1.08 | 1.07 |
| 3200m.my5740_rel_lto.cy10a2_gcp_c2s30 | 1.01 | 1.00 | 0.97 | 1.00 | 1.01 | 1.01 |
| 3200m.my5740_rel_lto.cy10a3_gcp_c2s30 | 1.01 | 1.01 | 0.96 | 1.01 | 1.01 | 1.02 |
| 3200m.my5740_rel_lto.cy10a4_gcp_c2s30 | 0.98 | 0.94 | 0.51 | 0.50 | 0.59 | 0.52 |
This lists the average rate of inserts/s for the tests that do inserts concurrent with queries. For such tests the query rate is listed in the table above. The read+write tests are setup so that the insert rate should match the target rate every second. Cells that are not at least 95% of the target have a red background to indicate a failure to satisfy the target.
| dbms | q100.1 | q500.1 | q1000.1 |
|---|---|---|---|
| my5740_rel_lto.cy10a_gcp_c2s30 | 786 | 3965 | 7925 |
| my5740_rel_lto.cy10a1_gcp_c2s30 | 786 | 3954 | 7903 |
| my5740_rel_lto.cy10a2_gcp_c2s30 | 786 | 3965 | 7916 |
| my5740_rel_lto.cy10a3_gcp_c2s30 | 786 | 3967 | 7916 |
| my5740_rel_lto.cy10a4_gcp_c2s30 | 743 | 3838 | 7623 |
| target | 800 | 4000 | 8000 |
l.i0
l.i0: load without secondary indexes. Graphs for performance per 1-second interval are here.
Average throughput:
Insert response time histogram: each cell has the percentage of responses that take <= the time in the header and max is the max response time in seconds. For the max column values in the top 25% of the range have a red background and in the bottom 25% of the range have a green background. The red background is not used when the min value is within 80% of the max value.
| dbms | 256us | 1ms | 4ms | 16ms | 64ms | 256ms | 1s | 4s | 16s | gt | max |
|---|---|---|---|---|---|---|---|---|---|---|---|
| my5740_rel_lto.cy10a_gcp_c2s30 | 96.268 | 3.662 | 0.039 | 0.015 | 0.014 | 0.001 | 0.302 | ||||
| my5740_rel_lto.cy10a1_gcp_c2s30 | 94.622 | 5.306 | 0.042 | 0.015 | 0.015 | nonzero | 0.267 | ||||
| my5740_rel_lto.cy10a2_gcp_c2s30 | 96.375 | 3.547 | 0.044 | 0.018 | 0.015 | 0.001 | 0.308 | ||||
| my5740_rel_lto.cy10a3_gcp_c2s30 | 96.305 | 3.616 | 0.045 | 0.018 | 0.015 | 0.001 | 0.301 | ||||
| my5740_rel_lto.cy10a4_gcp_c2s30 | 94.319 | 5.417 | 0.225 | 0.024 | 0.015 | 0.001 | 0.300 |
Performance metrics for the DBMS listed above. Some are normalized by throughput, others are not. Legend for results is here.
ips	qps	rps	rmbps	wps	wmbps	rpq	rkbpq	wpi	wkbpi	csps	cpups	cspq	cpupq	dbgb1	dbgb2	rss	maxop	p50	p99	tag
844327	0	0	0.0	4008.6	235.0	0.000	0.000	0.005	0.285	86782	73.0	0.103	13	210.5	339.0	86.7	0.302	109083	82211	3200m.my5740_rel_lto.cy10a_gcp_c2s30
834855	0	0	0.0	3965.2	232.7	0.000	0.000	0.005	0.285	88294	73.6	0.106	13	210.5	339.0	86.7	0.267	107483	83310	3200m.my5740_rel_lto.cy10a1_gcp_c2s30
848806	0	0	0.0	4108.2	238.7	0.000	0.000	0.005	0.288	87366	73.3	0.103	13	210.5	339.0	86.7	0.308	108982	82011	3200m.my5740_rel_lto.cy10a2_gcp_c2s30
850159	0	0	0.0	4105.5	238.8	0.000	0.000	0.005	0.288	87640	73.5	0.103	13	210.5	339.0	86.7	0.301	109381	82138	3200m.my5740_rel_lto.cy10a3_gcp_c2s30
828157	0	0	0.0	961.5	211.4	0.000	0.000	0.001	0.261	87950	72.6	0.106	13	210.5	339.0	86.7	0.300	106385	81737	3200m.my5740_rel_lto.cy10a4_gcp_c2s30
l.x
l.x: create secondary indexes.
Average throughput:
Performance metrics for the DBMS listed above. Some are normalized by throughput, others are not. Legend for results is here.
ips	qps	rps	rmbps	wps	wmbps	rpq	rkbpq	wpi	wkbpi	csps	cpups	cspq	cpupq	dbgb1	dbgb2	rss	maxop	p50	p99	tag
778992	0	3997	633.2	7896.1	865.0	0.005	0.832	0.010	1.137	27896	29.4	0.036	6	470.7	599.2	87.2	0.032	NA	NA	3200m.my5740_rel_lto.cy10a_gcp_c2s30
732624	0	3742	599.6	7365.6	813.6	0.005	0.838	0.010	1.137	38898	26.8	0.053	5	470.7	599.2	87.2	0.026	NA	NA	3200m.my5740_rel_lto.cy10a1_gcp_c2s30
782803	0	3998	641.3	7781.8	868.3	0.005	0.839	0.010	1.136	27320	29.3	0.035	6	470.7	599.2	87.2	0.031	NA	NA	3200m.my5740_rel_lto.cy10a2_gcp_c2s30
784530	0	4007	640.1	7808.3	866.9	0.005	0.836	0.010	1.131	27384	29.2	0.035	6	470.7	599.2	87.2	0.028	NA	NA	3200m.my5740_rel_lto.cy10a3_gcp_c2s30
733800	0	1458	591.9	3254.8	768.5	0.002	0.826	0.004	1.072	28713	27.9	0.039	6	470.7	599.2	87.2	0.044	NA	NA	3200m.my5740_rel_lto.cy10a4_gcp_c2s30
l.i1
l.i1: continue load after secondary indexes created. Graphs for performance per 1-second interval are here.
Average throughput:
Insert response time histogram: each cell has the percentage of responses that take <= the time in the header and max is the max response time in seconds. For the max column values in the top 25% of the range have a red background and in the bottom 25% of the range have a green background. The red background is not used when the min value is within 80% of the max value.
| dbms | 256us | 1ms | 4ms | 16ms | 64ms | 256ms | 1s | 4s | 16s | gt | max |
|---|---|---|---|---|---|---|---|---|---|---|---|
| my5740_rel_lto.cy10a_gcp_c2s30 | 3.362 | 67.007 | 20.406 | 9.204 | 0.021 | 0.383 | |||||
| my5740_rel_lto.cy10a1_gcp_c2s30 | 6.291 | 63.466 | 19.750 | 10.481 | 0.012 | 0.364 | |||||
| my5740_rel_lto.cy10a2_gcp_c2s30 | 3.546 | 65.068 | 21.850 | 9.498 | 0.038 | 0.468 | |||||
| my5740_rel_lto.cy10a3_gcp_c2s30 | 4.200 | 63.360 | 22.781 | 9.631 | 0.028 | 0.351 | |||||
| my5740_rel_lto.cy10a4_gcp_c2s30 | 5.933 | 51.624 | 24.494 | 13.775 | 4.174 | 0.652 |
Delete response time histogram: each cell has the percentage of responses that take <= the time in the header and max is the max response time in seconds. For the max column values in the top 25% of the range have a red background and in the bottom 25% of the range have a green background. The red background is not used when the min value is within 80% of the max value.
| dbms | 256us | 1ms | 4ms | 16ms | 64ms | 256ms | 1s | 4s | 16s | gt | max |
|---|---|---|---|---|---|---|---|---|---|---|---|
| my5740_rel_lto.cy10a_gcp_c2s30 | 27.744 | 69.001 | 3.057 | 0.198 | 0.244 | ||||||
| my5740_rel_lto.cy10a1_gcp_c2s30 | 34.436 | 61.975 | 3.344 | 0.236 | 0.009 | 0.364 | |||||
| my5740_rel_lto.cy10a2_gcp_c2s30 | 29.286 | 65.724 | 4.832 | 0.158 | 0.204 | ||||||
| my5740_rel_lto.cy10a3_gcp_c2s30 | 29.814 | 64.657 | 5.353 | 0.176 | 0.195 | ||||||
| my5740_rel_lto.cy10a4_gcp_c2s30 | 30.986 | 58.757 | 10.000 | 0.256 | 0.189 |
Performance metrics for the DBMS listed above. Some are normalized by throughput, others are not. Legend for results is here.
ips	qps	rps	rmbps	wps	wmbps	rpq	rkbpq	wpi	wkbpi	csps	cpups	cspq	cpupq	dbgb1	dbgb2	rss	maxop	p50	p99	tag
17433	0	15304	239.1	30121.9	716.5	0.878	14.046	1.728	42.087	130293	31.8	7.474	274	653.9	819.9	87.0	0.383	999	300	3200m.my5740_rel_lto.cy10a_gcp_c2s30
16505	0	13952	218.0	27154.7	665.8	0.845	13.525	1.645	41.310	140598	30.2	8.519	274	654.0	820.6	87.0	0.364	849	250	3200m.my5740_rel_lto.cy10a1_gcp_c2s30
16842	0	14983	234.1	31929.3	732.7	0.890	14.234	1.896	44.549	130670	29.6	7.759	264	654.0	819.1	86.9	0.468	949	300	3200m.my5740_rel_lto.cy10a2_gcp_c2s30
16705	0	14882	232.5	31443.0	733.4	0.891	14.254	1.882	44.956	129928	29.1	7.778	261	654.0	818.9	87.0	0.351	899	300	3200m.my5740_rel_lto.cy10a3_gcp_c2s30
8877	0	7655	206.9	13262.2	360.9	0.862	23.862	1.494	41.627	121228	18.7	13.656	316	654.0	821.9	86.9	0.652	300	100	3200m.my5740_rel_lto.cy10a4_gcp_c2s30
q100.1
q100.1: range queries with 100 insert/s per client. Graphs for performance per 1-second interval are here.
Average throughput:
Query response time histogram: each cell has the percentage of responses that take <= the time in the header and max is the max response time in seconds. For max values in the top 25% of the range have a red background and in the bottom 25% of the range have a green background. The red background is not used when the min value is within 80% of the max value.
| dbms | 256us | 1ms | 4ms | 16ms | 64ms | 256ms | 1s | 4s | 16s | gt | max |
|---|---|---|---|---|---|---|---|---|---|---|---|
| my5740_rel_lto.cy10a_gcp_c2s30 | 39.546 | 2.485 | 47.370 | 10.531 | 0.069 | nonzero | 0.118 | ||||
| my5740_rel_lto.cy10a1_gcp_c2s30 | 39.945 | 2.570 | 48.917 | 8.460 | 0.098 | 0.010 | nonzero | 0.356 | |||
| my5740_rel_lto.cy10a2_gcp_c2s30 | 39.518 | 2.508 | 47.404 | 10.507 | 0.062 | nonzero | 0.179 | ||||
| my5740_rel_lto.cy10a3_gcp_c2s30 | 39.624 | 2.467 | 47.708 | 10.130 | 0.071 | nonzero | 0.168 | ||||
| my5740_rel_lto.cy10a4_gcp_c2s30 | 40.904 | 3.382 | 28.744 | 21.962 | 4.865 | 0.143 | nonzero | 0.327 |
Insert response time histogram: each cell has the percentage of responses that take <= the time in the header and max is the max response time in seconds. For max values in the top 25% of the range have a red background and in the bottom 25% of the range have a green background. The red background is not used when the min value is within 80% of the max value.
| dbms | 256us | 1ms | 4ms | 16ms | 64ms | 256ms | 1s | 4s | 16s | gt | max |
|---|---|---|---|---|---|---|---|---|---|---|---|
| my5740_rel_lto.cy10a_gcp_c2s30 | 32.552 | 66.562 | 0.840 | 0.045 | 0.159 | ||||||
| my5740_rel_lto.cy10a1_gcp_c2s30 | 36.969 | 60.976 | 1.785 | 0.271 | 0.236 | ||||||
| my5740_rel_lto.cy10a2_gcp_c2s30 | 44.410 | 54.628 | 0.941 | 0.017 | 0.003 | 0.304 | |||||
| my5740_rel_lto.cy10a3_gcp_c2s30 | 44.819 | 54.233 | 0.927 | 0.017 | 0.003 | 0.257 | |||||
| my5740_rel_lto.cy10a4_gcp_c2s30 | 18.038 | 63.108 | 18.799 | 0.056 | 0.132 |
Delete response time histogram: each cell has the percentage of responses that take <= the time in the header and max is the max response time in seconds. For max values in the top 25% of the range have a red background and in the bottom 25% of the range have a green background. The red background is not used when the min value is within 80% of the max value.
| dbms | 256us | 1ms | 4ms | 16ms | 64ms | 256ms | 1s | 4s | 16s | gt | max |
|---|---|---|---|---|---|---|---|---|---|---|---|
| my5740_rel_lto.cy10a_gcp_c2s30 | 37.948 | 61.201 | 0.809 | 0.042 | 0.155 | ||||||
| my5740_rel_lto.cy10a1_gcp_c2s30 | 41.410 | 56.684 | 1.646 | 0.260 | 0.236 | ||||||
| my5740_rel_lto.cy10a2_gcp_c2s30 | 49.132 | 49.962 | 0.885 | 0.014 | 0.007 | 0.304 | |||||
| my5740_rel_lto.cy10a3_gcp_c2s30 | 49.434 | 49.674 | 0.875 | 0.014 | 0.003 | 0.257 | |||||
| my5740_rel_lto.cy10a4_gcp_c2s30 | 20.868 | 61.517 | 17.500 | 0.115 | 0.142 |
Performance metrics for the DBMS listed above. Some are normalized by throughput, others are not. Legend for results is here.
ips	qps	rps	rmbps	wps	wmbps	rpq	rkbpq	wpi	wkbpi	csps	cpups	cspq	cpupq	dbgb1	dbgb2	rss	maxop	p50	p99	tag
786	4168	30679	479.4	22373.5	551.2	7.361	117.774	28.465	718.043	133642	20.6	32.065	741	653.9	819.9	86.9	0.118	544	112	3200m.my5740_rel_lto.cy10a_gcp_c2s30
786	4384	30099	470.3	20307.9	509.7	6.866	109.854	25.824	663.655	147198	21.0	33.577	719	654.0	820.6	86.9	0.356	591	128	3200m.my5740_rel_lto.cy10a1_gcp_c2s30
786	4184	31373	490.2	23457.2	567.6	7.497	119.958	29.829	739.043	135798	20.4	32.453	731	654.0	819.1	86.9	0.179	559	112	3200m.my5740_rel_lto.cy10a2_gcp_c2s30
786	4214	31388	490.4	23015.2	563.5	7.448	119.169	29.266	733.775	135630	20.4	32.184	726	654.0	818.9	86.9	0.168	559	128	3200m.my5740_rel_lto.cy10a3_gcp_c2s30
743	2095	13281	823.6	11485.0	282.4	6.338	402.494	15.449	389.015	121169	16.8	57.829	1203	654.0	821.9	86.9	0.327	272	16	3200m.my5740_rel_lto.cy10a4_gcp_c2s30
q500.1
q500.1: range queries with 500 insert/s per client. Graphs for performance per 1-second interval are here.
Average throughput:
Query response time histogram: each cell has the percentage of responses that take <= the time in the header and max is the max response time in seconds. For max values in the top 25% of the range have a red background and in the bottom 25% of the range have a green background. The red background is not used when the min value is within 80% of the max value.
| dbms | 256us | 1ms | 4ms | 16ms | 64ms | 256ms | 1s | 4s | 16s | gt | max |
|---|---|---|---|---|---|---|---|---|---|---|---|
| my5740_rel_lto.cy10a_gcp_c2s30 | 39.775 | 2.854 | 50.872 | 6.491 | 0.008 | 0.062 | |||||
| my5740_rel_lto.cy10a1_gcp_c2s30 | 40.298 | 2.995 | 52.499 | 4.166 | 0.040 | 0.001 | nonzero | nonzero | 1.902 | ||
| my5740_rel_lto.cy10a2_gcp_c2s30 | 39.856 | 2.942 | 50.747 | 6.448 | 0.007 | nonzero | 0.072 | ||||
| my5740_rel_lto.cy10a3_gcp_c2s30 | 39.897 | 2.932 | 50.727 | 6.434 | 0.009 | 0.059 | |||||
| my5740_rel_lto.cy10a4_gcp_c2s30 | 42.366 | 3.940 | 32.842 | 17.794 | 3.037 | 0.020 | 0.254 |
Insert response time histogram: each cell has the percentage of responses that take <= the time in the header and max is the max response time in seconds. For max values in the top 25% of the range have a red background and in the bottom 25% of the range have a green background. The red background is not used when the min value is within 80% of the max value.
| dbms | 256us | 1ms | 4ms | 16ms | 64ms | 256ms | 1s | 4s | 16s | gt | max |
|---|---|---|---|---|---|---|---|---|---|---|---|
| my5740_rel_lto.cy10a_gcp_c2s30 | 65.486 | 34.391 | 0.123 | 0.040 | |||||||
| my5740_rel_lto.cy10a1_gcp_c2s30 | 71.010 | 28.487 | 0.498 | 0.004 | 0.001 | 0.581 | |||||
| my5740_rel_lto.cy10a2_gcp_c2s30 | 74.442 | 25.464 | 0.094 | 0.044 | |||||||
| my5740_rel_lto.cy10a3_gcp_c2s30 | 73.399 | 26.469 | 0.132 | 0.049 | |||||||
| my5740_rel_lto.cy10a4_gcp_c2s30 | 50.501 | 44.324 | 5.165 | 0.009 | 0.107 |
Delete response time histogram: each cell has the percentage of responses that take <= the time in the header and max is the max response time in seconds. For max values in the top 25% of the range have a red background and in the bottom 25% of the range have a green background. The red background is not used when the min value is within 80% of the max value.
| dbms | 256us | 1ms | 4ms | 16ms | 64ms | 256ms | 1s | 4s | 16s | gt | max |
|---|---|---|---|---|---|---|---|---|---|---|---|
| my5740_rel_lto.cy10a_gcp_c2s30 | 75.881 | 24.003 | 0.116 | 0.031 | |||||||
| my5740_rel_lto.cy10a1_gcp_c2s30 | 76.763 | 22.795 | 0.437 | 0.005 | 0.001 | 0.443 | |||||
| my5740_rel_lto.cy10a2_gcp_c2s30 | 82.220 | 17.678 | 0.101 | 0.042 | |||||||
| my5740_rel_lto.cy10a3_gcp_c2s30 | 81.060 | 18.810 | 0.130 | 0.041 | |||||||
| my5740_rel_lto.cy10a4_gcp_c2s30 | 55.126 | 40.697 | 4.126 | 0.051 | 0.152 |
Performance metrics for the DBMS listed above. Some are normalized by throughput, others are not. Legend for results is here.
ips	qps	rps	rmbps	wps	wmbps	rpq	rkbpq	wpi	wkbpi	csps	cpups	cspq	cpupq	dbgb1	dbgb2	rss	maxop	p50	p99	tag
3965	4646	33009	515.8	21194.6	538.4	7.105	113.683	5.346	139.046	136620	21.9	29.407	707	653.9	819.9	86.9	0.062	591	511	3200m.my5740_rel_lto.cy10a_gcp_c2s30
3954	4998	32724	511.3	18698.8	491.2	6.548	104.763	4.729	127.227	150259	22.3	30.065	669	654.0	820.6	86.9	1.902	624	495	3200m.my5740_rel_lto.cy10a1_gcp_c2s30
3965	4681	33601	525.0	22124.1	553.0	7.179	114.859	5.580	142.818	138664	21.4	29.625	686	654.0	819.1	86.9	0.072	591	511	3200m.my5740_rel_lto.cy10a2_gcp_c2s30
3967	4706	33704	526.6	21979.3	554.0	7.162	114.597	5.541	143.006	139028	21.5	29.544	685	654.0	818.9	86.9	0.059	591	527	3200m.my5740_rel_lto.cy10a3_gcp_c2s30
3838	2720	15720	925.7	11385.2	268.9	5.779	348.466	2.967	71.744	126519	19.1	46.507	1053	654.0	822.1	86.9	0.254	352	48	3200m.my5740_rel_lto.cy10a4_gcp_c2s30
q1000.1
q1000.1: range queries with 1000 insert/s per client. Graphs for performance per 1-second interval are here.
Average throughput:
Query response time histogram: each cell has the percentage of responses that take <= the time in the header and max is the max response time in seconds. For max values in the top 25% of the range have a red background and in the bottom 25% of the range have a green background. The red background is not used when the min value is within 80% of the max value.
| dbms | 256us | 1ms | 4ms | 16ms | 64ms | 256ms | 1s | 4s | 16s | gt | max |
|---|---|---|---|---|---|---|---|---|---|---|---|
| my5740_rel_lto.cy10a_gcp_c2s30 | 39.371 | 2.609 | 49.337 | 8.668 | 0.014 | nonzero | 0.073 | ||||
| my5740_rel_lto.cy10a1_gcp_c2s30 | 39.932 | 2.647 | 50.838 | 6.529 | 0.052 | 0.002 | nonzero | 0.735 | |||
| my5740_rel_lto.cy10a2_gcp_c2s30 | 39.494 | 2.693 | 49.337 | 8.461 | 0.015 | nonzero | 0.073 | ||||
| my5740_rel_lto.cy10a3_gcp_c2s30 | 39.557 | 2.666 | 49.275 | 8.486 | 0.016 | nonzero | 0.090 | ||||
| my5740_rel_lto.cy10a4_gcp_c2s30 | 40.942 | 4.096 | 29.931 | 20.596 | 4.405 | 0.029 | 0.174 |
Insert response time histogram: each cell has the percentage of responses that take <= the time in the header and max is the max response time in seconds. For max values in the top 25% of the range have a red background and in the bottom 25% of the range have a green background. The red background is not used when the min value is within 80% of the max value.
| dbms | 256us | 1ms | 4ms | 16ms | 64ms | 256ms | 1s | 4s | 16s | gt | max |
|---|---|---|---|---|---|---|---|---|---|---|---|
| my5740_rel_lto.cy10a_gcp_c2s30 | 64.056 | 35.837 | 0.107 | 0.034 | |||||||
| my5740_rel_lto.cy10a1_gcp_c2s30 | 68.625 | 30.905 | 0.468 | 0.002 | 0.193 | ||||||
| my5740_rel_lto.cy10a2_gcp_c2s30 | 72.335 | 27.592 | 0.073 | 0.028 | |||||||
| my5740_rel_lto.cy10a3_gcp_c2s30 | 73.855 | 26.071 | 0.074 | 0.043 | |||||||
| my5740_rel_lto.cy10a4_gcp_c2s30 | 41.442 | 50.117 | 8.423 | 0.019 | 0.116 |
Delete response time histogram: each cell has the percentage of responses that take <= the time in the header and max is the max response time in seconds. For max values in the top 25% of the range have a red background and in the bottom 25% of the range have a green background. The red background is not used when the min value is within 80% of the max value.
| dbms | 256us | 1ms | 4ms | 16ms | 64ms | 256ms | 1s | 4s | 16s | gt | max |
|---|---|---|---|---|---|---|---|---|---|---|---|
| my5740_rel_lto.cy10a_gcp_c2s30 | 74.400 | 25.498 | 0.102 | nonzero | 0.069 | ||||||
| my5740_rel_lto.cy10a1_gcp_c2s30 | 74.870 | 24.713 | 0.415 | 0.002 | 0.193 | ||||||
| my5740_rel_lto.cy10a2_gcp_c2s30 | 80.289 | 19.627 | 0.084 | 0.001 | 0.069 | ||||||
| my5740_rel_lto.cy10a3_gcp_c2s30 | 81.534 | 18.363 | 0.102 | 0.001 | 0.070 | ||||||
| my5740_rel_lto.cy10a4_gcp_c2s30 | 45.420 | 47.078 | 7.433 | 0.068 | 0.155 |
Performance metrics for the DBMS listed above. Some are normalized by throughput, others are not. Legend for results is here.
ips	qps	rps	rmbps	wps	wmbps	rpq	rkbpq	wpi	wkbpi	csps	cpups	cspq	cpupq	dbgb1	dbgb2	rss	maxop	p50	p99	tag
7925	4407	30820	481.6	23281.7	568.1	6.993	111.895	2.938	73.404	137663	24.8	31.237	844	653.9	820.0	86.9	0.073	559	480	3200m.my5740_rel_lto.cy10a_gcp_c2s30
7903	4694	30417	475.3	21370.0	529.6	6.479	103.672	2.704	68.619	150586	25.0	32.078	799	654.2	821.1	86.9	0.735	591	432	3200m.my5740_rel_lto.cy10a1_gcp_c2s30
7916	4463	31466	491.7	24666.2	590.1	7.050	112.795	3.116	76.326	140960	24.3	31.581	817	654.0	819.2	86.9	0.073	559	463	3200m.my5740_rel_lto.cy10a2_gcp_c2s30
7916	4475	31468	491.7	24361.2	589.6	7.032	112.508	3.077	76.261	140608	24.0	31.420	804	654.0	819.2	86.9	0.090	560	479	3200m.my5740_rel_lto.cy10a3_gcp_c2s30
7623	2293	13222	792.6	12142.5	290.7	5.767	353.981	1.593	39.048	126732	21.4	55.274	1400	654.9	823.8	86.9	0.174	304	48	3200m.my5740_rel_lto.cy10a4_gcp_c2s30
l.i0
l.i0: load without secondary indexes
Performance metrics for all DBMS, not just the ones listed above. Some are normalized by throughput, others are not. Legend for results is here.
ips	qps	rps	rmbps	wps	wmbps	rpq	rkbpq	wpi	wkbpi	csps	cpups	cspq	cpupq	dbgb1	dbgb2	rss	maxop	p50	p99	tag
844327	0	0	0.0	4008.6	235.0	0.000	0.000	0.005	0.285	86782	73.0	0.103	13	210.5	339.0	86.7	0.302	109083	82211	3200m.my5740_rel_lto.cy10a_gcp_c2s30
834855	0	0	0.0	3965.2	232.7	0.000	0.000	0.005	0.285	88294	73.6	0.106	13	210.5	339.0	86.7	0.267	107483	83310	3200m.my5740_rel_lto.cy10a1_gcp_c2s30
848806	0	0	0.0	4108.2	238.7	0.000	0.000	0.005	0.288	87366	73.3	0.103	13	210.5	339.0	86.7	0.308	108982	82011	3200m.my5740_rel_lto.cy10a2_gcp_c2s30
850159	0	0	0.0	4105.5	238.8	0.000	0.000	0.005	0.288	87640	73.5	0.103	13	210.5	339.0	86.7	0.301	109381	82138	3200m.my5740_rel_lto.cy10a3_gcp_c2s30
828157	0	0	0.0	961.5	211.4	0.000	0.000	0.001	0.261	87950	72.6	0.106	13	210.5	339.0	86.7	0.300	106385	81737	3200m.my5740_rel_lto.cy10a4_gcp_c2s30
l.x
l.x: create secondary indexes
Performance metrics for all DBMS, not just the ones listed above. Some are normalized by throughput, others are not. Legend for results is here.
ips	qps	rps	rmbps	wps	wmbps	rpq	rkbpq	wpi	wkbpi	csps	cpups	cspq	cpupq	dbgb1	dbgb2	rss	maxop	p50	p99	tag
778992	0	3997	633.2	7896.1	865.0	0.005	0.832	0.010	1.137	27896	29.4	0.036	6	470.7	599.2	87.2	0.032	NA	NA	3200m.my5740_rel_lto.cy10a_gcp_c2s30
732624	0	3742	599.6	7365.6	813.6	0.005	0.838	0.010	1.137	38898	26.8	0.053	5	470.7	599.2	87.2	0.026	NA	NA	3200m.my5740_rel_lto.cy10a1_gcp_c2s30
782803	0	3998	641.3	7781.8	868.3	0.005	0.839	0.010	1.136	27320	29.3	0.035	6	470.7	599.2	87.2	0.031	NA	NA	3200m.my5740_rel_lto.cy10a2_gcp_c2s30
784530	0	4007	640.1	7808.3	866.9	0.005	0.836	0.010	1.131	27384	29.2	0.035	6	470.7	599.2	87.2	0.028	NA	NA	3200m.my5740_rel_lto.cy10a3_gcp_c2s30
733800	0	1458	591.9	3254.8	768.5	0.002	0.826	0.004	1.072	28713	27.9	0.039	6	470.7	599.2	87.2	0.044	NA	NA	3200m.my5740_rel_lto.cy10a4_gcp_c2s30
l.i1
l.i1: continue load after secondary indexes created
Performance metrics for all DBMS, not just the ones listed above. Some are normalized by throughput, others are not. Legend for results is here.
ips	qps	rps	rmbps	wps	wmbps	rpq	rkbpq	wpi	wkbpi	csps	cpups	cspq	cpupq	dbgb1	dbgb2	rss	maxop	p50	p99	tag
17433	0	15304	239.1	30121.9	716.5	0.878	14.046	1.728	42.087	130293	31.8	7.474	274	653.9	819.9	87.0	0.383	999	300	3200m.my5740_rel_lto.cy10a_gcp_c2s30
16505	0	13952	218.0	27154.7	665.8	0.845	13.525	1.645	41.310	140598	30.2	8.519	274	654.0	820.6	87.0	0.364	849	250	3200m.my5740_rel_lto.cy10a1_gcp_c2s30
16842	0	14983	234.1	31929.3	732.7	0.890	14.234	1.896	44.549	130670	29.6	7.759	264	654.0	819.1	86.9	0.468	949	300	3200m.my5740_rel_lto.cy10a2_gcp_c2s30
16705	0	14882	232.5	31443.0	733.4	0.891	14.254	1.882	44.956	129928	29.1	7.778	261	654.0	818.9	87.0	0.351	899	300	3200m.my5740_rel_lto.cy10a3_gcp_c2s30
8877	0	7655	206.9	13262.2	360.9	0.862	23.862	1.494	41.627	121228	18.7	13.656	316	654.0	821.9	86.9	0.652	300	100	3200m.my5740_rel_lto.cy10a4_gcp_c2s30
q100.1
q100.1: range queries with 100 insert/s per client
Performance metrics for all DBMS, not just the ones listed above. Some are normalized by throughput, others are not. Legend for results is here.
ips	qps	rps	rmbps	wps	wmbps	rpq	rkbpq	wpi	wkbpi	csps	cpups	cspq	cpupq	dbgb1	dbgb2	rss	maxop	p50	p99	tag
786	4168	30679	479.4	22373.5	551.2	7.361	117.774	28.465	718.043	133642	20.6	32.065	741	653.9	819.9	86.9	0.118	544	112	3200m.my5740_rel_lto.cy10a_gcp_c2s30
786	4384	30099	470.3	20307.9	509.7	6.866	109.854	25.824	663.655	147198	21.0	33.577	719	654.0	820.6	86.9	0.356	591	128	3200m.my5740_rel_lto.cy10a1_gcp_c2s30
786	4184	31373	490.2	23457.2	567.6	7.497	119.958	29.829	739.043	135798	20.4	32.453	731	654.0	819.1	86.9	0.179	559	112	3200m.my5740_rel_lto.cy10a2_gcp_c2s30
786	4214	31388	490.4	23015.2	563.5	7.448	119.169	29.266	733.775	135630	20.4	32.184	726	654.0	818.9	86.9	0.168	559	128	3200m.my5740_rel_lto.cy10a3_gcp_c2s30
743	2095	13281	823.6	11485.0	282.4	6.338	402.494	15.449	389.015	121169	16.8	57.829	1203	654.0	821.9	86.9	0.327	272	16	3200m.my5740_rel_lto.cy10a4_gcp_c2s30
q500.1
q500.1: range queries with 500 insert/s per client
Performance metrics for all DBMS, not just the ones listed above. Some are normalized by throughput, others are not. Legend for results is here.
ips	qps	rps	rmbps	wps	wmbps	rpq	rkbpq	wpi	wkbpi	csps	cpups	cspq	cpupq	dbgb1	dbgb2	rss	maxop	p50	p99	tag
3965	4646	33009	515.8	21194.6	538.4	7.105	113.683	5.346	139.046	136620	21.9	29.407	707	653.9	819.9	86.9	0.062	591	511	3200m.my5740_rel_lto.cy10a_gcp_c2s30
3954	4998	32724	511.3	18698.8	491.2	6.548	104.763	4.729	127.227	150259	22.3	30.065	669	654.0	820.6	86.9	1.902	624	495	3200m.my5740_rel_lto.cy10a1_gcp_c2s30
3965	4681	33601	525.0	22124.1	553.0	7.179	114.859	5.580	142.818	138664	21.4	29.625	686	654.0	819.1	86.9	0.072	591	511	3200m.my5740_rel_lto.cy10a2_gcp_c2s30
3967	4706	33704	526.6	21979.3	554.0	7.162	114.597	5.541	143.006	139028	21.5	29.544	685	654.0	818.9	86.9	0.059	591	527	3200m.my5740_rel_lto.cy10a3_gcp_c2s30
3838	2720	15720	925.7	11385.2	268.9	5.779	348.466	2.967	71.744	126519	19.1	46.507	1053	654.0	822.1	86.9	0.254	352	48	3200m.my5740_rel_lto.cy10a4_gcp_c2s30
q1000.1
q1000.1: range queries with 1000 insert/s per client
Performance metrics for all DBMS, not just the ones listed above. Some are normalized by throughput, others are not. Legend for results is here.
ips	qps	rps	rmbps	wps	wmbps	rpq	rkbpq	wpi	wkbpi	csps	cpups	cspq	cpupq	dbgb1	dbgb2	rss	maxop	p50	p99	tag
7925	4407	30820	481.6	23281.7	568.1	6.993	111.895	2.938	73.404	137663	24.8	31.237	844	653.9	820.0	86.9	0.073	559	480	3200m.my5740_rel_lto.cy10a_gcp_c2s30
7903	4694	30417	475.3	21370.0	529.6	6.479	103.672	2.704	68.619	150586	25.0	32.078	799	654.2	821.1	86.9	0.735	591	432	3200m.my5740_rel_lto.cy10a1_gcp_c2s30
7916	4463	31466	491.7	24666.2	590.1	7.050	112.795	3.116	76.326	140960	24.3	31.581	817	654.0	819.2	86.9	0.073	559	463	3200m.my5740_rel_lto.cy10a2_gcp_c2s30
7916	4475	31468	491.7	24361.2	589.6	7.032	112.508	3.077	76.261	140608	24.0	31.420	804	654.0	819.2	86.9	0.090	560	479	3200m.my5740_rel_lto.cy10a3_gcp_c2s30
7623	2293	13222	792.6	12142.5	290.7	5.767	353.981	1.593	39.048	126732	21.4	55.274	1400	654.9	823.8	86.9	0.174	304	48	3200m.my5740_rel_lto.cy10a4_gcp_c2s30
l.i0
- l.i0: load without secondary indexes
- Legend for results is here.
- Each entry lists the percentage of responses that fit in that bucket (slower than max time for previous bucket, faster than min time for next bucket).
Insert response time histogram
256us	1ms	4ms	16ms	64ms	256ms	1s	4s	16s	gt	max	tag
0.000	96.268	3.662	0.039	0.015	0.014	0.001	0.000	0.000	0.000	0.302	my5740_rel_lto.cy10a_gcp_c2s30
0.000	94.622	5.306	0.042	0.015	0.015	nonzero	0.000	0.000	0.000	0.267	my5740_rel_lto.cy10a1_gcp_c2s30
0.000	96.375	3.547	0.044	0.018	0.015	0.001	0.000	0.000	0.000	0.308	my5740_rel_lto.cy10a2_gcp_c2s30
0.000	96.305	3.616	0.045	0.018	0.015	0.001	0.000	0.000	0.000	0.301	my5740_rel_lto.cy10a3_gcp_c2s30
0.000	94.319	5.417	0.225	0.024	0.015	0.001	0.000	0.000	0.000	0.300	my5740_rel_lto.cy10a4_gcp_c2s30
l.x
- l.x: create secondary indexes
- Legend for results is here.
- Each entry lists the percentage of responses that fit in that bucket (slower than max time for previous bucket, faster than min time for next bucket).
TODO - determine whether there is data for create index response time
l.i1
- l.i1: continue load after secondary indexes created
- Legend for results is here.
- Each entry lists the percentage of responses that fit in that bucket (slower than max time for previous bucket, faster than min time for next bucket).
Insert response time histogram
256us	1ms	4ms	16ms	64ms	256ms	1s	4s	16s	gt	max	tag
0.000	0.000	3.362	67.007	20.406	9.204	0.021	0.000	0.000	0.000	0.383	my5740_rel_lto.cy10a_gcp_c2s30
0.000	0.000	6.291	63.466	19.750	10.481	0.012	0.000	0.000	0.000	0.364	my5740_rel_lto.cy10a1_gcp_c2s30
0.000	0.000	3.546	65.068	21.850	9.498	0.038	0.000	0.000	0.000	0.468	my5740_rel_lto.cy10a2_gcp_c2s30
0.000	0.000	4.200	63.360	22.781	9.631	0.028	0.000	0.000	0.000	0.351	my5740_rel_lto.cy10a3_gcp_c2s30
0.000	0.000	5.933	51.624	24.494	13.775	4.174	0.000	0.000	0.000	0.652	my5740_rel_lto.cy10a4_gcp_c2s30
Delete response time histogram
256us	1ms	4ms	16ms	64ms	256ms	1s	4s	16s	gt	max	tag
0.000	0.000	27.744	69.001	3.057	0.198	0.000	0.000	0.000	0.000	0.244	my5740_rel_lto.cy10a_gcp_c2s30
0.000	0.000	34.436	61.975	3.344	0.236	0.009	0.000	0.000	0.000	0.364	my5740_rel_lto.cy10a1_gcp_c2s30
0.000	0.000	29.286	65.724	4.832	0.158	0.000	0.000	0.000	0.000	0.204	my5740_rel_lto.cy10a2_gcp_c2s30
0.000	0.000	29.814	64.657	5.353	0.176	0.000	0.000	0.000	0.000	0.195	my5740_rel_lto.cy10a3_gcp_c2s30
0.000	0.000	30.986	58.757	10.000	0.256	0.000	0.000	0.000	0.000	0.189	my5740_rel_lto.cy10a4_gcp_c2s30
q100.1
- q100.1: range queries with 100 insert/s per client
- Legend for results is here.
- Each entry lists the percentage of responses that fit in that bucket (slower than max time for previous bucket, faster than min time for next bucket).
Query response time histogram
256us	1ms	4ms	16ms	64ms	256ms	1s	4s	16s	gt	max	tag
39.546	2.485	47.370	10.531	0.069	nonzero	0.000	0.000	0.000	0.000	0.118	my5740_rel_lto.cy10a_gcp_c2s30
39.945	2.570	48.917	8.460	0.098	0.010	nonzero	0.000	0.000	0.000	0.356	my5740_rel_lto.cy10a1_gcp_c2s30
39.518	2.508	47.404	10.507	0.062	nonzero	0.000	0.000	0.000	0.000	0.179	my5740_rel_lto.cy10a2_gcp_c2s30
39.624	2.467	47.708	10.130	0.071	nonzero	0.000	0.000	0.000	0.000	0.168	my5740_rel_lto.cy10a3_gcp_c2s30
40.904	3.382	28.744	21.962	4.865	0.143	nonzero	0.000	0.000	0.000	0.327	my5740_rel_lto.cy10a4_gcp_c2s30
Insert response time histogram
256us	1ms	4ms	16ms	64ms	256ms	1s	4s	16s	gt	max	tag
0.000	0.000	32.552	66.562	0.840	0.045	0.000	0.000	0.000	0.000	0.159	my5740_rel_lto.cy10a_gcp_c2s30
0.000	0.000	36.969	60.976	1.785	0.271	0.000	0.000	0.000	0.000	0.236	my5740_rel_lto.cy10a1_gcp_c2s30
0.000	0.000	44.410	54.628	0.941	0.017	0.003	0.000	0.000	0.000	0.304	my5740_rel_lto.cy10a2_gcp_c2s30
0.000	0.000	44.819	54.233	0.927	0.017	0.003	0.000	0.000	0.000	0.257	my5740_rel_lto.cy10a3_gcp_c2s30
0.000	0.000	18.038	63.108	18.799	0.056	0.000	0.000	0.000	0.000	0.132	my5740_rel_lto.cy10a4_gcp_c2s30
Delete response time histogram
256us	1ms	4ms	16ms	64ms	256ms	1s	4s	16s	gt	max	tag
0.000	0.000	37.948	61.201	0.809	0.042	0.000	0.000	0.000	0.000	0.155	my5740_rel_lto.cy10a_gcp_c2s30
0.000	0.000	41.410	56.684	1.646	0.260	0.000	0.000	0.000	0.000	0.236	my5740_rel_lto.cy10a1_gcp_c2s30
0.000	0.000	49.132	49.962	0.885	0.014	0.007	0.000	0.000	0.000	0.304	my5740_rel_lto.cy10a2_gcp_c2s30
0.000	0.000	49.434	49.674	0.875	0.014	0.003	0.000	0.000	0.000	0.257	my5740_rel_lto.cy10a3_gcp_c2s30
0.000	0.000	20.868	61.517	17.500	0.115	0.000	0.000	0.000	0.000	0.142	my5740_rel_lto.cy10a4_gcp_c2s30
q500.1
- q500.1: range queries with 500 insert/s per client
- Legend for results is here.
- Each entry lists the percentage of responses that fit in that bucket (slower than max time for previous bucket, faster than min time for next bucket).
Query response time histogram
256us	1ms	4ms	16ms	64ms	256ms	1s	4s	16s	gt	max	tag
39.775	2.854	50.872	6.491	0.008	0.000	0.000	0.000	0.000	0.000	0.062	my5740_rel_lto.cy10a_gcp_c2s30
40.298	2.995	52.499	4.166	0.040	0.001	nonzero	nonzero	0.000	0.000	1.902	my5740_rel_lto.cy10a1_gcp_c2s30
39.856	2.942	50.747	6.448	0.007	nonzero	0.000	0.000	0.000	0.000	0.072	my5740_rel_lto.cy10a2_gcp_c2s30
39.897	2.932	50.727	6.434	0.009	0.000	0.000	0.000	0.000	0.000	0.059	my5740_rel_lto.cy10a3_gcp_c2s30
42.366	3.940	32.842	17.794	3.037	0.020	0.000	0.000	0.000	0.000	0.254	my5740_rel_lto.cy10a4_gcp_c2s30
Insert response time histogram
256us	1ms	4ms	16ms	64ms	256ms	1s	4s	16s	gt	max	tag
0.000	0.000	65.486	34.391	0.123	0.000	0.000	0.000	0.000	0.000	0.040	my5740_rel_lto.cy10a_gcp_c2s30
0.000	0.000	71.010	28.487	0.498	0.004	0.001	0.000	0.000	0.000	0.581	my5740_rel_lto.cy10a1_gcp_c2s30
0.000	0.000	74.442	25.464	0.094	0.000	0.000	0.000	0.000	0.000	0.044	my5740_rel_lto.cy10a2_gcp_c2s30
0.000	0.000	73.399	26.469	0.132	0.000	0.000	0.000	0.000	0.000	0.049	my5740_rel_lto.cy10a3_gcp_c2s30
0.000	0.000	50.501	44.324	5.165	0.009	0.000	0.000	0.000	0.000	0.107	my5740_rel_lto.cy10a4_gcp_c2s30
Delete response time histogram
256us	1ms	4ms	16ms	64ms	256ms	1s	4s	16s	gt	max	tag
0.000	0.000	75.881	24.003	0.116	0.000	0.000	0.000	0.000	0.000	0.031	my5740_rel_lto.cy10a_gcp_c2s30
0.000	0.000	76.763	22.795	0.437	0.005	0.001	0.000	0.000	0.000	0.443	my5740_rel_lto.cy10a1_gcp_c2s30
0.000	0.000	82.220	17.678	0.101	0.000	0.000	0.000	0.000	0.000	0.042	my5740_rel_lto.cy10a2_gcp_c2s30
0.000	0.000	81.060	18.810	0.130	0.000	0.000	0.000	0.000	0.000	0.041	my5740_rel_lto.cy10a3_gcp_c2s30
0.000	0.000	55.126	40.697	4.126	0.051	0.000	0.000	0.000	0.000	0.152	my5740_rel_lto.cy10a4_gcp_c2s30
q1000.1
- q1000.1: range queries with 1000 insert/s per client
- Legend for results is here.
- Each entry lists the percentage of responses that fit in that bucket (slower than max time for previous bucket, faster than min time for next bucket).
Query response time histogram
256us	1ms	4ms	16ms	64ms	256ms	1s	4s	16s	gt	max	tag
39.371	2.609	49.337	8.668	0.014	nonzero	0.000	0.000	0.000	0.000	0.073	my5740_rel_lto.cy10a_gcp_c2s30
39.932	2.647	50.838	6.529	0.052	0.002	nonzero	0.000	0.000	0.000	0.735	my5740_rel_lto.cy10a1_gcp_c2s30
39.494	2.693	49.337	8.461	0.015	nonzero	0.000	0.000	0.000	0.000	0.073	my5740_rel_lto.cy10a2_gcp_c2s30
39.557	2.666	49.275	8.486	0.016	nonzero	0.000	0.000	0.000	0.000	0.090	my5740_rel_lto.cy10a3_gcp_c2s30
40.942	4.096	29.931	20.596	4.405	0.029	0.000	0.000	0.000	0.000	0.174	my5740_rel_lto.cy10a4_gcp_c2s30
Insert response time histogram
256us	1ms	4ms	16ms	64ms	256ms	1s	4s	16s	gt	max	tag
0.000	0.000	64.056	35.837	0.107	0.000	0.000	0.000	0.000	0.000	0.034	my5740_rel_lto.cy10a_gcp_c2s30
0.000	0.000	68.625	30.905	0.468	0.002	0.000	0.000	0.000	0.000	0.193	my5740_rel_lto.cy10a1_gcp_c2s30
0.000	0.000	72.335	27.592	0.073	0.000	0.000	0.000	0.000	0.000	0.028	my5740_rel_lto.cy10a2_gcp_c2s30
0.000	0.000	73.855	26.071	0.074	0.000	0.000	0.000	0.000	0.000	0.043	my5740_rel_lto.cy10a3_gcp_c2s30
0.000	0.000	41.442	50.117	8.423	0.019	0.000	0.000	0.000	0.000	0.116	my5740_rel_lto.cy10a4_gcp_c2s30
Delete response time histogram
256us	1ms	4ms	16ms	64ms	256ms	1s	4s	16s	gt	max	tag
0.000	0.000	74.400	25.498	0.102	nonzero	0.000	0.000	0.000	0.000	0.069	my5740_rel_lto.cy10a_gcp_c2s30
0.000	0.000	74.870	24.713	0.415	0.002	0.000	0.000	0.000	0.000	0.193	my5740_rel_lto.cy10a1_gcp_c2s30
0.000	0.000	80.289	19.627	0.084	0.001	0.000	0.000	0.000	0.000	0.069	my5740_rel_lto.cy10a2_gcp_c2s30
0.000	0.000	81.534	18.363	0.102	0.001	0.000	0.000	0.000	0.000	0.070	my5740_rel_lto.cy10a3_gcp_c2s30
0.000	0.000	45.420	47.078	7.433	0.068	0.000	0.000	0.000	0.000	0.155	my5740_rel_lto.cy10a4_gcp_c2s30