Introduction
This is a report for the insert benchmark with 160M docs and 8 client(s). It is generated by scripts (bash, awk, sed) and Tufte might not be impressed. An overview of the insert benchmark is here and a short update is here. Below, by DBMS, I mean DBMS+version.config. An example is my8020.c10b40 where my means MySQL, 8020 is version 8.0.20 and c10b40 is the name for the configuration file.
The test server is a c2-standard-30 from GCP with 15 cores, hyperthreads disabled, 120G RAM, XFS + SW RAID 0 on 4 NVMe devices (1.5TB). The benchmark was run with 8 client and there were 1 or 3 connections per client (1 for queries or inserts without rate limits, 1+1 for rate limited inserts+deletes). There are 8 tables, client per table. It loads 160M rows without secondary indexes, creates secondary indexes, then inserts 80M rows with a delete per insert to avoid growing the table. It then does 3 read+write tests for 1800s each that do queries as fast as possible with 100, 500 and then 1000 inserts/second/client concurrent with the queries and 1000 deletes/second to avoid growing the table. The database is cached by InnoDB and the only IO is for writes.
The tested DBMS are:
- my5740_rel_lto.cy10a_gcp_c2s30 - InnoDB and MySQL 5.7.40, rel_lto build, cy10a_gcp_c2s30 config, compiled with CMAKE_BUILD_TYPE=Release -O2, base config
- my5740_rel_lto.cy10a1_gcp_c2s30 - InnoDB and MySQL 5.7.40, rel_lto build, cy10a_gcp_c2s30 config, compiled with CMAKE_BUILD_TYPE=Release -O2, adds innodb_use_native_aio=off
- my5740_rel_lto.cy10a2_gcp_c2s30 - InnoDB and MySQL 5.7.40, rel_lto build, cy10a_gcp_c2s30 config, compiled with CMAKE_BUILD_TYPE=Release -O2, adds innodb_io_capacity=20k, innodb_io_capacity_max=40k
- my5740_rel_lto.cy10a3_gcp_c2s30 - InnoDB and MySQL 5.7.40, rel_lto build, cy10a_gcp_c2s30 config, compiled with CMAKE_BUILD_TYPE=Release -O2, adds innodb_io_capacity=20k, innodb_io_capacity_max=40k, innodb_flush_sync=OFF
- my5740_rel_lto.cy10a4_gcp_c2s30 - InnoDB and MySQL 5.7.40, rel_lto build, cy10a_gcp_c2s30 config, compiled with CMAKE_BUILD_TYPE=Release -O2, adds innodb_flush_method=fsync
Contents
- Summary
- l.i0: load without secondary indexes
- l.x: create secondary indexes
- l.i1: continue load after secondary indexes created
- q100.1: range queries with 100 insert/s per client
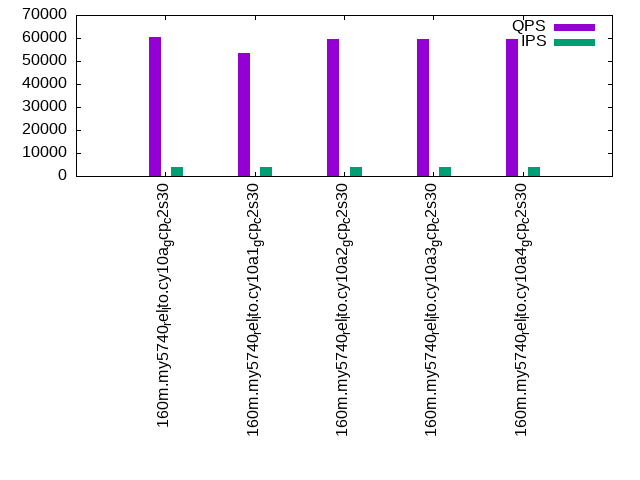
- q500.1: range queries with 500 insert/s per client
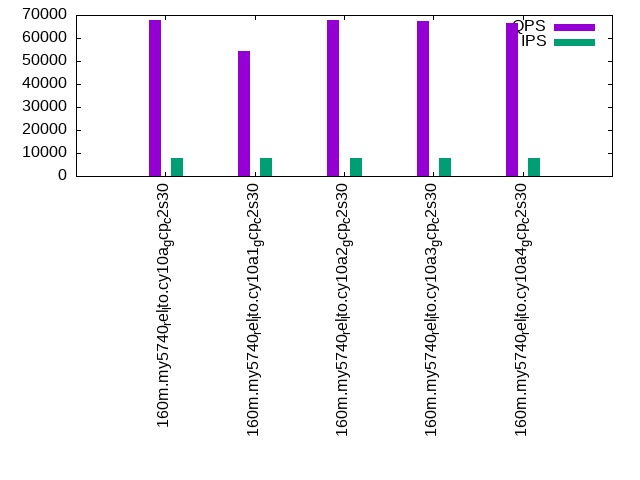
- q1000.1: range queries with 1000 insert/s per client
Summary
The numbers are inserts/s for l.i0 and l.i1, indexed docs (or rows) /s for l.x and queries/s for q*.2. The values are the average rate over the entire test for inserts (IPS) and queries (QPS). The range of values for IPS and QPS is split into 3 parts: bottom 25%, middle 50%, top 25%. Values in the bottom 25% have a red background, values in the top 25% have a green background and values in the middle have no color. A gray background is used for values that can be ignored because the DBMS did not sustain the target insert rate. Red backgrounds are not used when the minimum value is within 80% of the max value.
| dbms | l.i0 | l.x | l.i1 | q100.1 | q500.1 | q1000.1 |
|---|---|---|---|---|---|---|
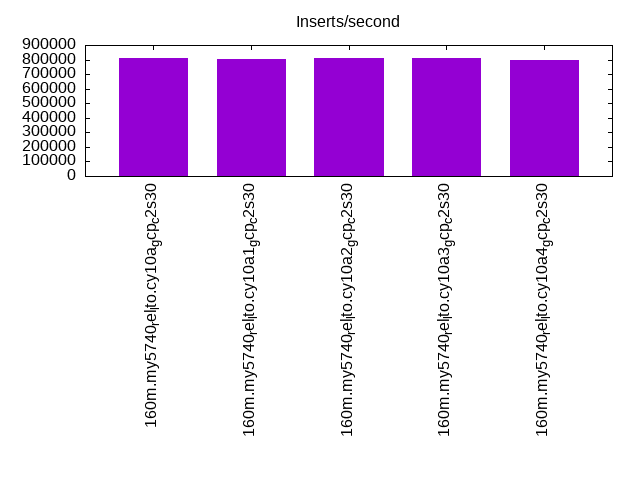
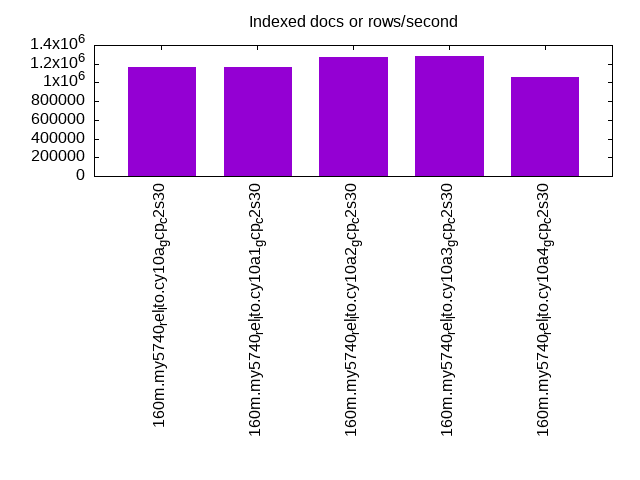
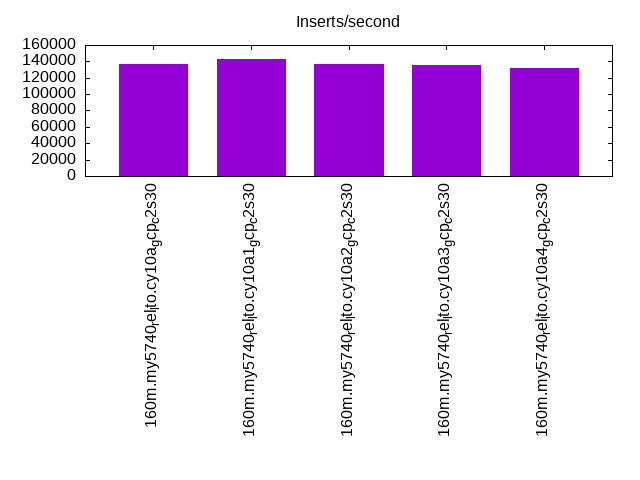
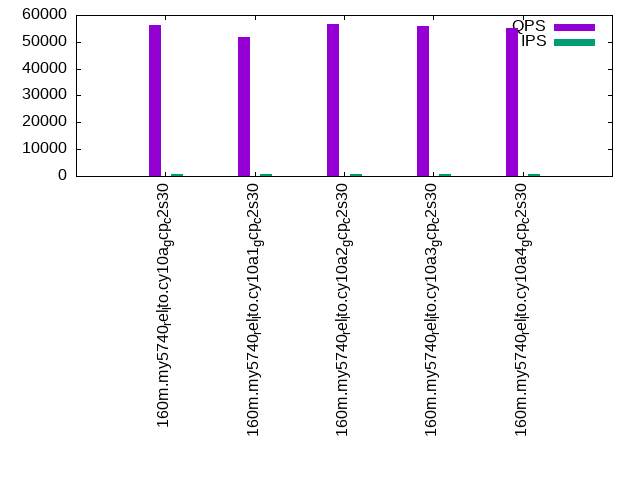
| 160m.my5740_rel_lto.cy10a_gcp_c2s30 | 812183 | 1168613 | 137368 | 56095 | 60273 | 67691 |
| 160m.my5740_rel_lto.cy10a1_gcp_c2s30 | 804020 | 1168613 | 142634 | 51823 | 53523 | 54549 |
| 160m.my5740_rel_lto.cy10a2_gcp_c2s30 | 808081 | 1270635 | 137133 | 56577 | 59765 | 67755 |
| 160m.my5740_rel_lto.cy10a3_gcp_c2s30 | 812183 | 1280800 | 135997 | 55898 | 59398 | 67402 |
| 160m.my5740_rel_lto.cy10a4_gcp_c2s30 | 800000 | 1053289 | 132122 | 55121 | 59376 | 66695 |
This table has relative throughput, throughput for the DBMS relative to the DBMS in the first line, using the absolute throughput from the previous table.
| dbms | l.i0 | l.x | l.i1 | q100.1 | q500.1 | q1000.1 |
|---|---|---|---|---|---|---|
| 160m.my5740_rel_lto.cy10a_gcp_c2s30 | 1.00 | 1.00 | 1.00 | 1.00 | 1.00 | 1.00 |
| 160m.my5740_rel_lto.cy10a1_gcp_c2s30 | 0.99 | 1.00 | 1.04 | 0.92 | 0.89 | 0.81 |
| 160m.my5740_rel_lto.cy10a2_gcp_c2s30 | 0.99 | 1.09 | 1.00 | 1.01 | 0.99 | 1.00 |
| 160m.my5740_rel_lto.cy10a3_gcp_c2s30 | 1.00 | 1.10 | 0.99 | 1.00 | 0.99 | 1.00 |
| 160m.my5740_rel_lto.cy10a4_gcp_c2s30 | 0.98 | 0.90 | 0.96 | 0.98 | 0.99 | 0.99 |
This lists the average rate of inserts/s for the tests that do inserts concurrent with queries. For such tests the query rate is listed in the table above. The read+write tests are setup so that the insert rate should match the target rate every second. Cells that are not at least 95% of the target have a red background to indicate a failure to satisfy the target.
| dbms | q100.1 | q500.1 | q1000.1 |
|---|---|---|---|
| my5740_rel_lto.cy10a_gcp_c2s30 | 793 | 3978 | 7956 |
| my5740_rel_lto.cy10a1_gcp_c2s30 | 753 | 3852 | 7869 |
| my5740_rel_lto.cy10a2_gcp_c2s30 | 794 | 3978 | 7960 |
| my5740_rel_lto.cy10a3_gcp_c2s30 | 793 | 3976 | 7960 |
| my5740_rel_lto.cy10a4_gcp_c2s30 | 792 | 3976 | 7956 |
| target | 800 | 4000 | 8000 |
l.i0
l.i0: load without secondary indexes. Graphs for performance per 1-second interval are here.
Average throughput:
Insert response time histogram: each cell has the percentage of responses that take <= the time in the header and max is the max response time in seconds. For the max column values in the top 25% of the range have a red background and in the bottom 25% of the range have a green background. The red background is not used when the min value is within 80% of the max value.
| dbms | 256us | 1ms | 4ms | 16ms | 64ms | 256ms | 1s | 4s | 16s | gt | max |
|---|---|---|---|---|---|---|---|---|---|---|---|
| my5740_rel_lto.cy10a_gcp_c2s30 | 97.287 | 2.650 | 0.030 | 0.019 | 0.015 | 0.234 | |||||
| my5740_rel_lto.cy10a1_gcp_c2s30 | 97.180 | 2.756 | 0.031 | 0.019 | 0.015 | 0.235 | |||||
| my5740_rel_lto.cy10a2_gcp_c2s30 | 96.923 | 3.013 | 0.033 | 0.017 | 0.015 | 0.233 | |||||
| my5740_rel_lto.cy10a3_gcp_c2s30 | 97.401 | 2.536 | 0.032 | 0.017 | 0.015 | 0.246 | |||||
| my5740_rel_lto.cy10a4_gcp_c2s30 | 96.785 | 2.979 | 0.196 | 0.026 | 0.014 | 0.218 |
Performance metrics for the DBMS listed above. Some are normalized by throughput, others are not. Legend for results is here.
ips	qps	rps	rmbps	wps	wmbps	rpq	rkbpq	wpi	wkbpi	csps	cpups	cspq	cpupq	dbgb1	dbgb2	rss	maxop	p50	p99	tag
812183	0	0	0.0	1478.3	157.1	0.000	0.000	0.002	0.198	80731	69.7	0.099	13	10.6	139.1	17.2	0.234	112978	85835	160m.my5740_rel_lto.cy10a_gcp_c2s30
804020	0	0	0.0	1468.4	156.3	0.000	0.000	0.002	0.199	82073	70.0	0.102	13	10.6	139.1	17.2	0.235	111679	85736	160m.my5740_rel_lto.cy10a1_gcp_c2s30
808081	0	0	0.0	1550.2	159.0	0.000	0.000	0.002	0.201	80274	70.1	0.099	13	10.6	139.1	17.2	0.233	111515	81711	160m.my5740_rel_lto.cy10a2_gcp_c2s30
812183	0	0	0.0	1561.2	157.9	0.000	0.000	0.002	0.199	80527	69.9	0.099	13	10.6	139.1	17.2	0.246	112379	86906	160m.my5740_rel_lto.cy10a3_gcp_c2s30
800000	0	0	0.0	573.1	151.8	0.000	0.000	0.001	0.194	80169	69.4	0.100	13	10.6	139.1	17.2	0.218	110481	87334	160m.my5740_rel_lto.cy10a4_gcp_c2s30
l.x
l.x: create secondary indexes.
Average throughput:
Performance metrics for the DBMS listed above. Some are normalized by throughput, others are not. Legend for results is here.
ips	qps	rps	rmbps	wps	wmbps	rpq	rkbpq	wpi	wkbpi	csps	cpups	cspq	cpupq	dbgb1	dbgb2	rss	maxop	p50	p99	tag
1168613	0	0	0.0	13961.9	1060.7	0.000	0.000	0.012	0.929	48986	37.2	0.042	5	23.6	152.1	28.6	0.029	NA	NA	160m.my5740_rel_lto.cy10a_gcp_c2s30
1168613	0	0	0.0	13965.9	1060.4	0.000	0.000	0.012	0.929	89590	37.3	0.077	5	23.6	152.1	28.6	0.029	NA	NA	160m.my5740_rel_lto.cy10a1_gcp_c2s30
1270635	0	0	0.0	14220.2	1142.7	0.000	0.000	0.011	0.921	39322	36.2	0.031	4	23.6	152.1	28.6	0.030	NA	NA	160m.my5740_rel_lto.cy10a2_gcp_c2s30
1280800	0	0	0.0	14402.7	1149.8	0.000	0.000	0.011	0.919	34806	36.1	0.027	4	23.6	152.1	28.6	0.030	NA	NA	160m.my5740_rel_lto.cy10a3_gcp_c2s30
1053289	0	0	0.0	3991.3	926.6	0.000	0.000	0.004	0.901	54333	32.7	0.052	5	23.6	152.1	28.6	0.030	NA	NA	160m.my5740_rel_lto.cy10a4_gcp_c2s30
l.i1
l.i1: continue load after secondary indexes created. Graphs for performance per 1-second interval are here.
Average throughput:
Insert response time histogram: each cell has the percentage of responses that take <= the time in the header and max is the max response time in seconds. For the max column values in the top 25% of the range have a red background and in the bottom 25% of the range have a green background. The red background is not used when the min value is within 80% of the max value.
| dbms | 256us | 1ms | 4ms | 16ms | 64ms | 256ms | 1s | 4s | 16s | gt | max |
|---|---|---|---|---|---|---|---|---|---|---|---|
| my5740_rel_lto.cy10a_gcp_c2s30 | 89.239 | 10.684 | 0.061 | 0.016 | nonzero | 0.275 | |||||
| my5740_rel_lto.cy10a1_gcp_c2s30 | 92.057 | 7.872 | 0.055 | 0.016 | 0.231 | ||||||
| my5740_rel_lto.cy10a2_gcp_c2s30 | 89.033 | 10.910 | 0.041 | 0.016 | nonzero | 0.285 | |||||
| my5740_rel_lto.cy10a3_gcp_c2s30 | 88.690 | 11.253 | 0.041 | 0.016 | nonzero | 0.830 | |||||
| my5740_rel_lto.cy10a4_gcp_c2s30 | 85.578 | 14.336 | 0.069 | 0.017 | nonzero | 0.305 |
Delete response time histogram: each cell has the percentage of responses that take <= the time in the header and max is the max response time in seconds. For the max column values in the top 25% of the range have a red background and in the bottom 25% of the range have a green background. The red background is not used when the min value is within 80% of the max value.
| dbms | 256us | 1ms | 4ms | 16ms | 64ms | 256ms | 1s | 4s | 16s | gt | max |
|---|---|---|---|---|---|---|---|---|---|---|---|
| my5740_rel_lto.cy10a_gcp_c2s30 | nonzero | 88.075 | 11.844 | 0.064 | 0.016 | nonzero | 0.274 | ||||
| my5740_rel_lto.cy10a1_gcp_c2s30 | nonzero | 91.541 | 8.393 | 0.049 | 0.016 | 0.229 | |||||
| my5740_rel_lto.cy10a2_gcp_c2s30 | nonzero | 88.016 | 11.924 | 0.044 | 0.016 | nonzero | 0.284 | ||||
| my5740_rel_lto.cy10a3_gcp_c2s30 | 0.001 | 87.707 | 12.231 | 0.046 | 0.016 | nonzero | 0.287 | ||||
| my5740_rel_lto.cy10a4_gcp_c2s30 | 0.025 | 89.089 | 10.818 | 0.049 | 0.018 | nonzero | 0.278 |
Performance metrics for the DBMS listed above. Some are normalized by throughput, others are not. Legend for results is here.
ips	qps	rps	rmbps	wps	wmbps	rpq	rkbpq	wpi	wkbpi	csps	cpups	cspq	cpupq	dbgb1	dbgb2	rss	maxop	p50	p99	tag
137368	0	138	2.2	6887.5	268.3	0.001	0.016	0.050	2.000	54299	87.4	0.395	95	80.0	230.7	86.9	0.275	17381	13385	160m.my5740_rel_lto.cy10a_gcp_c2s30
142634	0	325	5.1	7327.2	286.3	0.002	0.036	0.051	2.055	69945	87.0	0.490	91	100.5	261.4	86.9	0.231	18087	14085	160m.my5740_rel_lto.cy10a1_gcp_c2s30
137133	0	139	2.2	8472.6	316.1	0.001	0.016	0.062	2.360	57225	87.1	0.417	95	80.1	230.8	86.9	0.285	17331	13336	160m.my5740_rel_lto.cy10a2_gcp_c2s30
135997	0	140	2.2	8419.0	313.9	0.001	0.016	0.062	2.363	56703	87.2	0.417	96	80.2	230.9	86.9	0.830	17231	13336	160m.my5740_rel_lto.cy10a3_gcp_c2s30
132122	0	16	2.5	5741.8	254.6	0.000	0.020	0.043	1.973	54551	84.7	0.413	96	83.0	234.8	86.9	0.305	16773	12586	160m.my5740_rel_lto.cy10a4_gcp_c2s30
q100.1
q100.1: range queries with 100 insert/s per client. Graphs for performance per 1-second interval are here.
Average throughput:
Query response time histogram: each cell has the percentage of responses that take <= the time in the header and max is the max response time in seconds. For max values in the top 25% of the range have a red background and in the bottom 25% of the range have a green background. The red background is not used when the min value is within 80% of the max value.
| dbms | 256us | 1ms | 4ms | 16ms | 64ms | 256ms | 1s | 4s | 16s | gt | max |
|---|---|---|---|---|---|---|---|---|---|---|---|
| my5740_rel_lto.cy10a_gcp_c2s30 | 99.727 | 0.263 | 0.009 | nonzero | nonzero | 0.020 | |||||
| my5740_rel_lto.cy10a1_gcp_c2s30 | 99.403 | 0.589 | 0.008 | nonzero | nonzero | nonzero | 0.078 | ||||
| my5740_rel_lto.cy10a2_gcp_c2s30 | 99.721 | 0.269 | 0.010 | nonzero | nonzero | 0.024 | |||||
| my5740_rel_lto.cy10a3_gcp_c2s30 | 99.706 | 0.284 | 0.009 | 0.001 | nonzero | 0.024 | |||||
| my5740_rel_lto.cy10a4_gcp_c2s30 | 99.630 | 0.330 | 0.034 | 0.006 | nonzero | 0.038 |
Insert response time histogram: each cell has the percentage of responses that take <= the time in the header and max is the max response time in seconds. For max values in the top 25% of the range have a red background and in the bottom 25% of the range have a green background. The red background is not used when the min value is within 80% of the max value.
| dbms | 256us | 1ms | 4ms | 16ms | 64ms | 256ms | 1s | 4s | 16s | gt | max |
|---|---|---|---|---|---|---|---|---|---|---|---|
| my5740_rel_lto.cy10a_gcp_c2s30 | 92.747 | 7.219 | 0.035 | 0.023 | |||||||
| my5740_rel_lto.cy10a1_gcp_c2s30 | 97.326 | 2.653 | 0.021 | 0.021 | |||||||
| my5740_rel_lto.cy10a2_gcp_c2s30 | 91.812 | 8.111 | 0.076 | 0.026 | |||||||
| my5740_rel_lto.cy10a3_gcp_c2s30 | 90.417 | 9.517 | 0.066 | 0.026 | |||||||
| my5740_rel_lto.cy10a4_gcp_c2s30 | 85.941 | 13.736 | 0.319 | 0.003 | 0.067 |
Delete response time histogram: each cell has the percentage of responses that take <= the time in the header and max is the max response time in seconds. For max values in the top 25% of the range have a red background and in the bottom 25% of the range have a green background. The red background is not used when the min value is within 80% of the max value.
| dbms | 256us | 1ms | 4ms | 16ms | 64ms | 256ms | 1s | 4s | 16s | gt | max |
|---|---|---|---|---|---|---|---|---|---|---|---|
| my5740_rel_lto.cy10a_gcp_c2s30 | 94.243 | 5.740 | 0.017 | 0.021 | |||||||
| my5740_rel_lto.cy10a1_gcp_c2s30 | 98.056 | 1.931 | 0.014 | 0.023 | |||||||
| my5740_rel_lto.cy10a2_gcp_c2s30 | 93.611 | 6.319 | 0.069 | 0.026 | |||||||
| my5740_rel_lto.cy10a3_gcp_c2s30 | 92.226 | 7.708 | 0.066 | 0.026 | |||||||
| my5740_rel_lto.cy10a4_gcp_c2s30 | 91.330 | 8.535 | 0.135 | 0.029 |
Performance metrics for the DBMS listed above. Some are normalized by throughput, others are not. Legend for results is here.
ips	qps	rps	rmbps	wps	wmbps	rpq	rkbpq	wpi	wkbpi	csps	cpups	cspq	cpupq	dbgb1	dbgb2	rss	maxop	p50	p99	tag
793	56095	887	13.9	3595.0	116.6	0.016	0.253	4.532	150.523	184379	72.8	3.287	195	80.0	230.7	86.9	0.020	7080	6713	160m.my5740_rel_lto.cy10a_gcp_c2s30
753	51823	1679	26.2	3825.3	108.0	0.032	0.518	5.082	146.864	193183	71.0	3.728	206	100.5	261.4	86.9	0.078	6569	5402	160m.my5740_rel_lto.cy10a1_gcp_c2s30
794	56577	901	14.1	3886.1	125.6	0.016	0.255	4.896	162.055	183519	73.2	3.244	194	80.1	230.8	86.9	0.024	7144	6731	160m.my5740_rel_lto.cy10a2_gcp_c2s30
793	55898	892	13.9	3824.8	123.5	0.016	0.255	4.821	159.386	182684	72.9	3.268	196	80.2	230.9	86.9	0.024	7064	6697	160m.my5740_rel_lto.cy10a3_gcp_c2s30
792	55121	115	17.9	3245.0	132.2	0.002	0.333	4.099	171.061	179459	74.4	3.256	202	83.0	234.8	86.9	0.038	6987	4987	160m.my5740_rel_lto.cy10a4_gcp_c2s30
q500.1
q500.1: range queries with 500 insert/s per client. Graphs for performance per 1-second interval are here.
Average throughput:
Query response time histogram: each cell has the percentage of responses that take <= the time in the header and max is the max response time in seconds. For max values in the top 25% of the range have a red background and in the bottom 25% of the range have a green background. The red background is not used when the min value is within 80% of the max value.
| dbms | 256us | 1ms | 4ms | 16ms | 64ms | 256ms | 1s | 4s | 16s | gt | max |
|---|---|---|---|---|---|---|---|---|---|---|---|
| my5740_rel_lto.cy10a_gcp_c2s30 | 99.785 | 0.202 | 0.011 | 0.001 | nonzero | 0.024 | |||||
| my5740_rel_lto.cy10a1_gcp_c2s30 | 99.549 | 0.437 | 0.012 | 0.001 | nonzero | 0.024 | |||||
| my5740_rel_lto.cy10a2_gcp_c2s30 | 99.764 | 0.224 | 0.011 | 0.001 | nonzero | 0.024 | |||||
| my5740_rel_lto.cy10a3_gcp_c2s30 | 99.760 | 0.228 | 0.011 | 0.001 | nonzero | 0.024 | |||||
| my5740_rel_lto.cy10a4_gcp_c2s30 | 99.759 | 0.220 | 0.018 | 0.002 | nonzero | 0.034 |
Insert response time histogram: each cell has the percentage of responses that take <= the time in the header and max is the max response time in seconds. For max values in the top 25% of the range have a red background and in the bottom 25% of the range have a green background. The red background is not used when the min value is within 80% of the max value.
| dbms | 256us | 1ms | 4ms | 16ms | 64ms | 256ms | 1s | 4s | 16s | gt | max |
|---|---|---|---|---|---|---|---|---|---|---|---|
| my5740_rel_lto.cy10a_gcp_c2s30 | 96.505 | 3.433 | 0.062 | 0.034 | |||||||
| my5740_rel_lto.cy10a1_gcp_c2s30 | 94.877 | 5.077 | 0.046 | 0.034 | |||||||
| my5740_rel_lto.cy10a2_gcp_c2s30 | 97.132 | 2.797 | 0.071 | 0.030 | |||||||
| my5740_rel_lto.cy10a3_gcp_c2s30 | 96.747 | 3.212 | 0.041 | 0.027 | |||||||
| my5740_rel_lto.cy10a4_gcp_c2s30 | 95.422 | 4.549 | 0.028 | 0.034 |
Delete response time histogram: each cell has the percentage of responses that take <= the time in the header and max is the max response time in seconds. For max values in the top 25% of the range have a red background and in the bottom 25% of the range have a green background. The red background is not used when the min value is within 80% of the max value.
| dbms | 256us | 1ms | 4ms | 16ms | 64ms | 256ms | 1s | 4s | 16s | gt | max |
|---|---|---|---|---|---|---|---|---|---|---|---|
| my5740_rel_lto.cy10a_gcp_c2s30 | 0.085 | 97.594 | 2.284 | 0.036 | 0.029 | ||||||
| my5740_rel_lto.cy10a1_gcp_c2s30 | 0.003 | 97.765 | 2.206 | 0.025 | 0.033 | ||||||
| my5740_rel_lto.cy10a2_gcp_c2s30 | 0.053 | 98.099 | 1.814 | 0.035 | 0.037 | ||||||
| my5740_rel_lto.cy10a3_gcp_c2s30 | 0.054 | 97.879 | 2.034 | 0.033 | 0.024 | ||||||
| my5740_rel_lto.cy10a4_gcp_c2s30 | 0.554 | 97.756 | 1.679 | 0.011 | 0.028 |
Performance metrics for the DBMS listed above. Some are normalized by throughput, others are not. Legend for results is here.
ips	qps	rps	rmbps	wps	wmbps	rpq	rkbpq	wpi	wkbpi	csps	cpups	cspq	cpupq	dbgb1	dbgb2	rss	maxop	p50	p99	tag
3978	60273	336	5.2	2567.6	84.4	0.006	0.089	0.645	21.738	211225	67.3	3.504	167	80.0	230.7	86.9	0.024	7192	6777	160m.my5740_rel_lto.cy10a_gcp_c2s30
3852	53523	1119	17.5	3566.3	113.8	0.021	0.335	0.926	30.262	196809	73.6	3.677	206	100.5	261.4	86.9	0.024	6729	5546	160m.my5740_rel_lto.cy10a1_gcp_c2s30
3978	59765	328	5.1	2730.4	89.2	0.005	0.088	0.686	22.951	212722	66.8	3.559	168	80.1	230.8	86.9	0.024	7064	6728	160m.my5740_rel_lto.cy10a2_gcp_c2s30
3976	59398	340	5.3	2793.0	91.3	0.006	0.092	0.703	23.522	208960	67.5	3.518	170	80.2	230.9	86.9	0.024	7112	6761	160m.my5740_rel_lto.cy10a3_gcp_c2s30
3976	59376	43	4.6	2462.0	98.9	0.001	0.078	0.619	25.461	206246	68.7	3.474	174	83.0	234.8	86.9	0.034	7179	6699	160m.my5740_rel_lto.cy10a4_gcp_c2s30
q1000.1
q1000.1: range queries with 1000 insert/s per client. Graphs for performance per 1-second interval are here.
Average throughput:
Query response time histogram: each cell has the percentage of responses that take <= the time in the header and max is the max response time in seconds. For max values in the top 25% of the range have a red background and in the bottom 25% of the range have a green background. The red background is not used when the min value is within 80% of the max value.
| dbms | 256us | 1ms | 4ms | 16ms | 64ms | 256ms | 1s | 4s | 16s | gt | max |
|---|---|---|---|---|---|---|---|---|---|---|---|
| my5740_rel_lto.cy10a_gcp_c2s30 | 99.845 | 0.123 | 0.027 | 0.005 | nonzero | 0.033 | |||||
| my5740_rel_lto.cy10a1_gcp_c2s30 | 99.640 | 0.341 | 0.017 | 0.002 | nonzero | 0.024 | |||||
| my5740_rel_lto.cy10a2_gcp_c2s30 | 99.833 | 0.128 | 0.032 | 0.007 | nonzero | 0.027 | |||||
| my5740_rel_lto.cy10a3_gcp_c2s30 | 99.832 | 0.131 | 0.030 | 0.006 | nonzero | 0.029 | |||||
| my5740_rel_lto.cy10a4_gcp_c2s30 | 99.842 | 0.136 | 0.019 | 0.003 | nonzero | 0.024 |
Insert response time histogram: each cell has the percentage of responses that take <= the time in the header and max is the max response time in seconds. For max values in the top 25% of the range have a red background and in the bottom 25% of the range have a green background. The red background is not used when the min value is within 80% of the max value.
| dbms | 256us | 1ms | 4ms | 16ms | 64ms | 256ms | 1s | 4s | 16s | gt | max |
|---|---|---|---|---|---|---|---|---|---|---|---|
| my5740_rel_lto.cy10a_gcp_c2s30 | 89.897 | 9.950 | 0.153 | 0.034 | |||||||
| my5740_rel_lto.cy10a1_gcp_c2s30 | 96.065 | 3.890 | 0.045 | 0.049 | |||||||
| my5740_rel_lto.cy10a2_gcp_c2s30 | 86.654 | 13.111 | 0.234 | 0.033 | |||||||
| my5740_rel_lto.cy10a3_gcp_c2s30 | 88.277 | 11.517 | 0.206 | 0.033 | |||||||
| my5740_rel_lto.cy10a4_gcp_c2s30 | 93.705 | 6.206 | 0.089 | 0.030 |
Delete response time histogram: each cell has the percentage of responses that take <= the time in the header and max is the max response time in seconds. For max values in the top 25% of the range have a red background and in the bottom 25% of the range have a green background. The red background is not used when the min value is within 80% of the max value.
| dbms | 256us | 1ms | 4ms | 16ms | 64ms | 256ms | 1s | 4s | 16s | gt | max |
|---|---|---|---|---|---|---|---|---|---|---|---|
| my5740_rel_lto.cy10a_gcp_c2s30 | 0.015 | 91.653 | 8.193 | 0.138 | 0.034 | ||||||
| my5740_rel_lto.cy10a1_gcp_c2s30 | 0.045 | 97.590 | 2.332 | 0.034 | 0.027 | ||||||
| my5740_rel_lto.cy10a2_gcp_c2s30 | 0.027 | 88.596 | 11.183 | 0.194 | 0.031 | ||||||
| my5740_rel_lto.cy10a3_gcp_c2s30 | 0.014 | 90.083 | 9.718 | 0.185 | 0.036 | ||||||
| my5740_rel_lto.cy10a4_gcp_c2s30 | 0.176 | 95.646 | 4.107 | 0.071 | 0.028 |
Performance metrics for the DBMS listed above. Some are normalized by throughput, others are not. Legend for results is here.
ips	qps	rps	rmbps	wps	wmbps	rpq	rkbpq	wpi	wkbpi	csps	cpups	cspq	cpupq	dbgb1	dbgb2	rss	maxop	p50	p99	tag
7956	67691	66	1.0	962.9	32.2	0.001	0.016	0.121	4.149	253197	58.5	3.740	130	80.0	230.7	86.9	0.033	8539	8375	160m.my5740_rel_lto.cy10a_gcp_c2s30
7869	54549	713	11.1	2959.8	97.9	0.013	0.209	0.376	12.741	197375	74.5	3.618	205	100.5	261.4	86.9	0.024	6856	5658	160m.my5740_rel_lto.cy10a1_gcp_c2s30
7960	67755	71	1.1	959.7	32.2	0.001	0.017	0.121	4.137	253711	58.6	3.745	130	80.1	230.8	86.9	0.027	8522	8359	160m.my5740_rel_lto.cy10a2_gcp_c2s30
7960	67402	70	1.1	963.8	32.2	0.001	0.016	0.121	4.140	252160	58.8	3.741	131	80.2	230.9	86.9	0.029	8503	8327	160m.my5740_rel_lto.cy10a3_gcp_c2s30
7956	66695	39	0.9	893.8	43.4	0.001	0.014	0.112	5.584	251230	58.8	3.767	132	83.0	234.8	86.9	0.024	8407	8231	160m.my5740_rel_lto.cy10a4_gcp_c2s30
l.i0
l.i0: load without secondary indexes
Performance metrics for all DBMS, not just the ones listed above. Some are normalized by throughput, others are not. Legend for results is here.
ips	qps	rps	rmbps	wps	wmbps	rpq	rkbpq	wpi	wkbpi	csps	cpups	cspq	cpupq	dbgb1	dbgb2	rss	maxop	p50	p99	tag
812183	0	0	0.0	1478.3	157.1	0.000	0.000	0.002	0.198	80731	69.7	0.099	13	10.6	139.1	17.2	0.234	112978	85835	160m.my5740_rel_lto.cy10a_gcp_c2s30
804020	0	0	0.0	1468.4	156.3	0.000	0.000	0.002	0.199	82073	70.0	0.102	13	10.6	139.1	17.2	0.235	111679	85736	160m.my5740_rel_lto.cy10a1_gcp_c2s30
808081	0	0	0.0	1550.2	159.0	0.000	0.000	0.002	0.201	80274	70.1	0.099	13	10.6	139.1	17.2	0.233	111515	81711	160m.my5740_rel_lto.cy10a2_gcp_c2s30
812183	0	0	0.0	1561.2	157.9	0.000	0.000	0.002	0.199	80527	69.9	0.099	13	10.6	139.1	17.2	0.246	112379	86906	160m.my5740_rel_lto.cy10a3_gcp_c2s30
800000	0	0	0.0	573.1	151.8	0.000	0.000	0.001	0.194	80169	69.4	0.100	13	10.6	139.1	17.2	0.218	110481	87334	160m.my5740_rel_lto.cy10a4_gcp_c2s30
l.x
l.x: create secondary indexes
Performance metrics for all DBMS, not just the ones listed above. Some are normalized by throughput, others are not. Legend for results is here.
ips	qps	rps	rmbps	wps	wmbps	rpq	rkbpq	wpi	wkbpi	csps	cpups	cspq	cpupq	dbgb1	dbgb2	rss	maxop	p50	p99	tag
1168613	0	0	0.0	13961.9	1060.7	0.000	0.000	0.012	0.929	48986	37.2	0.042	5	23.6	152.1	28.6	0.029	NA	NA	160m.my5740_rel_lto.cy10a_gcp_c2s30
1168613	0	0	0.0	13965.9	1060.4	0.000	0.000	0.012	0.929	89590	37.3	0.077	5	23.6	152.1	28.6	0.029	NA	NA	160m.my5740_rel_lto.cy10a1_gcp_c2s30
1270635	0	0	0.0	14220.2	1142.7	0.000	0.000	0.011	0.921	39322	36.2	0.031	4	23.6	152.1	28.6	0.030	NA	NA	160m.my5740_rel_lto.cy10a2_gcp_c2s30
1280800	0	0	0.0	14402.7	1149.8	0.000	0.000	0.011	0.919	34806	36.1	0.027	4	23.6	152.1	28.6	0.030	NA	NA	160m.my5740_rel_lto.cy10a3_gcp_c2s30
1053289	0	0	0.0	3991.3	926.6	0.000	0.000	0.004	0.901	54333	32.7	0.052	5	23.6	152.1	28.6	0.030	NA	NA	160m.my5740_rel_lto.cy10a4_gcp_c2s30
l.i1
l.i1: continue load after secondary indexes created
Performance metrics for all DBMS, not just the ones listed above. Some are normalized by throughput, others are not. Legend for results is here.
ips	qps	rps	rmbps	wps	wmbps	rpq	rkbpq	wpi	wkbpi	csps	cpups	cspq	cpupq	dbgb1	dbgb2	rss	maxop	p50	p99	tag
137368	0	138	2.2	6887.5	268.3	0.001	0.016	0.050	2.000	54299	87.4	0.395	95	80.0	230.7	86.9	0.275	17381	13385	160m.my5740_rel_lto.cy10a_gcp_c2s30
142634	0	325	5.1	7327.2	286.3	0.002	0.036	0.051	2.055	69945	87.0	0.490	91	100.5	261.4	86.9	0.231	18087	14085	160m.my5740_rel_lto.cy10a1_gcp_c2s30
137133	0	139	2.2	8472.6	316.1	0.001	0.016	0.062	2.360	57225	87.1	0.417	95	80.1	230.8	86.9	0.285	17331	13336	160m.my5740_rel_lto.cy10a2_gcp_c2s30
135997	0	140	2.2	8419.0	313.9	0.001	0.016	0.062	2.363	56703	87.2	0.417	96	80.2	230.9	86.9	0.830	17231	13336	160m.my5740_rel_lto.cy10a3_gcp_c2s30
132122	0	16	2.5	5741.8	254.6	0.000	0.020	0.043	1.973	54551	84.7	0.413	96	83.0	234.8	86.9	0.305	16773	12586	160m.my5740_rel_lto.cy10a4_gcp_c2s30
q100.1
q100.1: range queries with 100 insert/s per client
Performance metrics for all DBMS, not just the ones listed above. Some are normalized by throughput, others are not. Legend for results is here.
ips	qps	rps	rmbps	wps	wmbps	rpq	rkbpq	wpi	wkbpi	csps	cpups	cspq	cpupq	dbgb1	dbgb2	rss	maxop	p50	p99	tag
793	56095	887	13.9	3595.0	116.6	0.016	0.253	4.532	150.523	184379	72.8	3.287	195	80.0	230.7	86.9	0.020	7080	6713	160m.my5740_rel_lto.cy10a_gcp_c2s30
753	51823	1679	26.2	3825.3	108.0	0.032	0.518	5.082	146.864	193183	71.0	3.728	206	100.5	261.4	86.9	0.078	6569	5402	160m.my5740_rel_lto.cy10a1_gcp_c2s30
794	56577	901	14.1	3886.1	125.6	0.016	0.255	4.896	162.055	183519	73.2	3.244	194	80.1	230.8	86.9	0.024	7144	6731	160m.my5740_rel_lto.cy10a2_gcp_c2s30
793	55898	892	13.9	3824.8	123.5	0.016	0.255	4.821	159.386	182684	72.9	3.268	196	80.2	230.9	86.9	0.024	7064	6697	160m.my5740_rel_lto.cy10a3_gcp_c2s30
792	55121	115	17.9	3245.0	132.2	0.002	0.333	4.099	171.061	179459	74.4	3.256	202	83.0	234.8	86.9	0.038	6987	4987	160m.my5740_rel_lto.cy10a4_gcp_c2s30
q500.1
q500.1: range queries with 500 insert/s per client
Performance metrics for all DBMS, not just the ones listed above. Some are normalized by throughput, others are not. Legend for results is here.
ips	qps	rps	rmbps	wps	wmbps	rpq	rkbpq	wpi	wkbpi	csps	cpups	cspq	cpupq	dbgb1	dbgb2	rss	maxop	p50	p99	tag
3978	60273	336	5.2	2567.6	84.4	0.006	0.089	0.645	21.738	211225	67.3	3.504	167	80.0	230.7	86.9	0.024	7192	6777	160m.my5740_rel_lto.cy10a_gcp_c2s30
3852	53523	1119	17.5	3566.3	113.8	0.021	0.335	0.926	30.262	196809	73.6	3.677	206	100.5	261.4	86.9	0.024	6729	5546	160m.my5740_rel_lto.cy10a1_gcp_c2s30
3978	59765	328	5.1	2730.4	89.2	0.005	0.088	0.686	22.951	212722	66.8	3.559	168	80.1	230.8	86.9	0.024	7064	6728	160m.my5740_rel_lto.cy10a2_gcp_c2s30
3976	59398	340	5.3	2793.0	91.3	0.006	0.092	0.703	23.522	208960	67.5	3.518	170	80.2	230.9	86.9	0.024	7112	6761	160m.my5740_rel_lto.cy10a3_gcp_c2s30
3976	59376	43	4.6	2462.0	98.9	0.001	0.078	0.619	25.461	206246	68.7	3.474	174	83.0	234.8	86.9	0.034	7179	6699	160m.my5740_rel_lto.cy10a4_gcp_c2s30
q1000.1
q1000.1: range queries with 1000 insert/s per client
Performance metrics for all DBMS, not just the ones listed above. Some are normalized by throughput, others are not. Legend for results is here.
ips	qps	rps	rmbps	wps	wmbps	rpq	rkbpq	wpi	wkbpi	csps	cpups	cspq	cpupq	dbgb1	dbgb2	rss	maxop	p50	p99	tag
7956	67691	66	1.0	962.9	32.2	0.001	0.016	0.121	4.149	253197	58.5	3.740	130	80.0	230.7	86.9	0.033	8539	8375	160m.my5740_rel_lto.cy10a_gcp_c2s30
7869	54549	713	11.1	2959.8	97.9	0.013	0.209	0.376	12.741	197375	74.5	3.618	205	100.5	261.4	86.9	0.024	6856	5658	160m.my5740_rel_lto.cy10a1_gcp_c2s30
7960	67755	71	1.1	959.7	32.2	0.001	0.017	0.121	4.137	253711	58.6	3.745	130	80.1	230.8	86.9	0.027	8522	8359	160m.my5740_rel_lto.cy10a2_gcp_c2s30
7960	67402	70	1.1	963.8	32.2	0.001	0.016	0.121	4.140	252160	58.8	3.741	131	80.2	230.9	86.9	0.029	8503	8327	160m.my5740_rel_lto.cy10a3_gcp_c2s30
7956	66695	39	0.9	893.8	43.4	0.001	0.014	0.112	5.584	251230	58.8	3.767	132	83.0	234.8	86.9	0.024	8407	8231	160m.my5740_rel_lto.cy10a4_gcp_c2s30
l.i0
- l.i0: load without secondary indexes
- Legend for results is here.
- Each entry lists the percentage of responses that fit in that bucket (slower than max time for previous bucket, faster than min time for next bucket).
Insert response time histogram
256us	1ms	4ms	16ms	64ms	256ms	1s	4s	16s	gt	max	tag
0.000	97.287	2.650	0.030	0.019	0.015	0.000	0.000	0.000	0.000	0.234	my5740_rel_lto.cy10a_gcp_c2s30
0.000	97.180	2.756	0.031	0.019	0.015	0.000	0.000	0.000	0.000	0.235	my5740_rel_lto.cy10a1_gcp_c2s30
0.000	96.923	3.013	0.033	0.017	0.015	0.000	0.000	0.000	0.000	0.233	my5740_rel_lto.cy10a2_gcp_c2s30
0.000	97.401	2.536	0.032	0.017	0.015	0.000	0.000	0.000	0.000	0.246	my5740_rel_lto.cy10a3_gcp_c2s30
0.000	96.785	2.979	0.196	0.026	0.014	0.000	0.000	0.000	0.000	0.218	my5740_rel_lto.cy10a4_gcp_c2s30
l.x
- l.x: create secondary indexes
- Legend for results is here.
- Each entry lists the percentage of responses that fit in that bucket (slower than max time for previous bucket, faster than min time for next bucket).
TODO - determine whether there is data for create index response time
l.i1
- l.i1: continue load after secondary indexes created
- Legend for results is here.
- Each entry lists the percentage of responses that fit in that bucket (slower than max time for previous bucket, faster than min time for next bucket).
Insert response time histogram
256us	1ms	4ms	16ms	64ms	256ms	1s	4s	16s	gt	max	tag
0.000	0.000	89.239	10.684	0.061	0.016	nonzero	0.000	0.000	0.000	0.275	my5740_rel_lto.cy10a_gcp_c2s30
0.000	0.000	92.057	7.872	0.055	0.016	0.000	0.000	0.000	0.000	0.231	my5740_rel_lto.cy10a1_gcp_c2s30
0.000	0.000	89.033	10.910	0.041	0.016	nonzero	0.000	0.000	0.000	0.285	my5740_rel_lto.cy10a2_gcp_c2s30
0.000	0.000	88.690	11.253	0.041	0.016	nonzero	0.000	0.000	0.000	0.830	my5740_rel_lto.cy10a3_gcp_c2s30
0.000	0.000	85.578	14.336	0.069	0.017	nonzero	0.000	0.000	0.000	0.305	my5740_rel_lto.cy10a4_gcp_c2s30
Delete response time histogram
256us	1ms	4ms	16ms	64ms	256ms	1s	4s	16s	gt	max	tag
0.000	nonzero	88.075	11.844	0.064	0.016	nonzero	0.000	0.000	0.000	0.274	my5740_rel_lto.cy10a_gcp_c2s30
0.000	nonzero	91.541	8.393	0.049	0.016	0.000	0.000	0.000	0.000	0.229	my5740_rel_lto.cy10a1_gcp_c2s30
0.000	nonzero	88.016	11.924	0.044	0.016	nonzero	0.000	0.000	0.000	0.284	my5740_rel_lto.cy10a2_gcp_c2s30
0.000	0.001	87.707	12.231	0.046	0.016	nonzero	0.000	0.000	0.000	0.287	my5740_rel_lto.cy10a3_gcp_c2s30
0.000	0.025	89.089	10.818	0.049	0.018	nonzero	0.000	0.000	0.000	0.278	my5740_rel_lto.cy10a4_gcp_c2s30
q100.1
- q100.1: range queries with 100 insert/s per client
- Legend for results is here.
- Each entry lists the percentage of responses that fit in that bucket (slower than max time for previous bucket, faster than min time for next bucket).
Query response time histogram
256us	1ms	4ms	16ms	64ms	256ms	1s	4s	16s	gt	max	tag
99.727	0.263	0.009	nonzero	nonzero	0.000	0.000	0.000	0.000	0.000	0.020	my5740_rel_lto.cy10a_gcp_c2s30
99.403	0.589	0.008	nonzero	nonzero	nonzero	0.000	0.000	0.000	0.000	0.078	my5740_rel_lto.cy10a1_gcp_c2s30
99.721	0.269	0.010	nonzero	nonzero	0.000	0.000	0.000	0.000	0.000	0.024	my5740_rel_lto.cy10a2_gcp_c2s30
99.706	0.284	0.009	0.001	nonzero	0.000	0.000	0.000	0.000	0.000	0.024	my5740_rel_lto.cy10a3_gcp_c2s30
99.630	0.330	0.034	0.006	nonzero	0.000	0.000	0.000	0.000	0.000	0.038	my5740_rel_lto.cy10a4_gcp_c2s30
Insert response time histogram
256us	1ms	4ms	16ms	64ms	256ms	1s	4s	16s	gt	max	tag
0.000	0.000	92.747	7.219	0.035	0.000	0.000	0.000	0.000	0.000	0.023	my5740_rel_lto.cy10a_gcp_c2s30
0.000	0.000	97.326	2.653	0.021	0.000	0.000	0.000	0.000	0.000	0.021	my5740_rel_lto.cy10a1_gcp_c2s30
0.000	0.000	91.812	8.111	0.076	0.000	0.000	0.000	0.000	0.000	0.026	my5740_rel_lto.cy10a2_gcp_c2s30
0.000	0.000	90.417	9.517	0.066	0.000	0.000	0.000	0.000	0.000	0.026	my5740_rel_lto.cy10a3_gcp_c2s30
0.000	0.000	85.941	13.736	0.319	0.003	0.000	0.000	0.000	0.000	0.067	my5740_rel_lto.cy10a4_gcp_c2s30
Delete response time histogram
256us	1ms	4ms	16ms	64ms	256ms	1s	4s	16s	gt	max	tag
0.000	0.000	94.243	5.740	0.017	0.000	0.000	0.000	0.000	0.000	0.021	my5740_rel_lto.cy10a_gcp_c2s30
0.000	0.000	98.056	1.931	0.014	0.000	0.000	0.000	0.000	0.000	0.023	my5740_rel_lto.cy10a1_gcp_c2s30
0.000	0.000	93.611	6.319	0.069	0.000	0.000	0.000	0.000	0.000	0.026	my5740_rel_lto.cy10a2_gcp_c2s30
0.000	0.000	92.226	7.708	0.066	0.000	0.000	0.000	0.000	0.000	0.026	my5740_rel_lto.cy10a3_gcp_c2s30
0.000	0.000	91.330	8.535	0.135	0.000	0.000	0.000	0.000	0.000	0.029	my5740_rel_lto.cy10a4_gcp_c2s30
q500.1
- q500.1: range queries with 500 insert/s per client
- Legend for results is here.
- Each entry lists the percentage of responses that fit in that bucket (slower than max time for previous bucket, faster than min time for next bucket).
Query response time histogram
256us	1ms	4ms	16ms	64ms	256ms	1s	4s	16s	gt	max	tag
99.785	0.202	0.011	0.001	nonzero	0.000	0.000	0.000	0.000	0.000	0.024	my5740_rel_lto.cy10a_gcp_c2s30
99.549	0.437	0.012	0.001	nonzero	0.000	0.000	0.000	0.000	0.000	0.024	my5740_rel_lto.cy10a1_gcp_c2s30
99.764	0.224	0.011	0.001	nonzero	0.000	0.000	0.000	0.000	0.000	0.024	my5740_rel_lto.cy10a2_gcp_c2s30
99.760	0.228	0.011	0.001	nonzero	0.000	0.000	0.000	0.000	0.000	0.024	my5740_rel_lto.cy10a3_gcp_c2s30
99.759	0.220	0.018	0.002	nonzero	0.000	0.000	0.000	0.000	0.000	0.034	my5740_rel_lto.cy10a4_gcp_c2s30
Insert response time histogram
256us	1ms	4ms	16ms	64ms	256ms	1s	4s	16s	gt	max	tag
0.000	0.000	96.505	3.433	0.062	0.000	0.000	0.000	0.000	0.000	0.034	my5740_rel_lto.cy10a_gcp_c2s30
0.000	0.000	94.877	5.077	0.046	0.000	0.000	0.000	0.000	0.000	0.034	my5740_rel_lto.cy10a1_gcp_c2s30
0.000	0.000	97.132	2.797	0.071	0.000	0.000	0.000	0.000	0.000	0.030	my5740_rel_lto.cy10a2_gcp_c2s30
0.000	0.000	96.747	3.212	0.041	0.000	0.000	0.000	0.000	0.000	0.027	my5740_rel_lto.cy10a3_gcp_c2s30
0.000	0.000	95.422	4.549	0.028	0.000	0.000	0.000	0.000	0.000	0.034	my5740_rel_lto.cy10a4_gcp_c2s30
Delete response time histogram
256us	1ms	4ms	16ms	64ms	256ms	1s	4s	16s	gt	max	tag
0.000	0.085	97.594	2.284	0.036	0.000	0.000	0.000	0.000	0.000	0.029	my5740_rel_lto.cy10a_gcp_c2s30
0.000	0.003	97.765	2.206	0.025	0.000	0.000	0.000	0.000	0.000	0.033	my5740_rel_lto.cy10a1_gcp_c2s30
0.000	0.053	98.099	1.814	0.035	0.000	0.000	0.000	0.000	0.000	0.037	my5740_rel_lto.cy10a2_gcp_c2s30
0.000	0.054	97.879	2.034	0.033	0.000	0.000	0.000	0.000	0.000	0.024	my5740_rel_lto.cy10a3_gcp_c2s30
0.000	0.554	97.756	1.679	0.011	0.000	0.000	0.000	0.000	0.000	0.028	my5740_rel_lto.cy10a4_gcp_c2s30
q1000.1
- q1000.1: range queries with 1000 insert/s per client
- Legend for results is here.
- Each entry lists the percentage of responses that fit in that bucket (slower than max time for previous bucket, faster than min time for next bucket).
Query response time histogram
256us	1ms	4ms	16ms	64ms	256ms	1s	4s	16s	gt	max	tag
99.845	0.123	0.027	0.005	nonzero	0.000	0.000	0.000	0.000	0.000	0.033	my5740_rel_lto.cy10a_gcp_c2s30
99.640	0.341	0.017	0.002	nonzero	0.000	0.000	0.000	0.000	0.000	0.024	my5740_rel_lto.cy10a1_gcp_c2s30
99.833	0.128	0.032	0.007	nonzero	0.000	0.000	0.000	0.000	0.000	0.027	my5740_rel_lto.cy10a2_gcp_c2s30
99.832	0.131	0.030	0.006	nonzero	0.000	0.000	0.000	0.000	0.000	0.029	my5740_rel_lto.cy10a3_gcp_c2s30
99.842	0.136	0.019	0.003	nonzero	0.000	0.000	0.000	0.000	0.000	0.024	my5740_rel_lto.cy10a4_gcp_c2s30
Insert response time histogram
256us	1ms	4ms	16ms	64ms	256ms	1s	4s	16s	gt	max	tag
0.000	0.000	89.897	9.950	0.153	0.000	0.000	0.000	0.000	0.000	0.034	my5740_rel_lto.cy10a_gcp_c2s30
0.000	0.000	96.065	3.890	0.045	0.000	0.000	0.000	0.000	0.000	0.049	my5740_rel_lto.cy10a1_gcp_c2s30
0.000	0.000	86.654	13.111	0.234	0.000	0.000	0.000	0.000	0.000	0.033	my5740_rel_lto.cy10a2_gcp_c2s30
0.000	0.000	88.277	11.517	0.206	0.000	0.000	0.000	0.000	0.000	0.033	my5740_rel_lto.cy10a3_gcp_c2s30
0.000	0.000	93.705	6.206	0.089	0.000	0.000	0.000	0.000	0.000	0.030	my5740_rel_lto.cy10a4_gcp_c2s30
Delete response time histogram
256us	1ms	4ms	16ms	64ms	256ms	1s	4s	16s	gt	max	tag
0.000	0.015	91.653	8.193	0.138	0.000	0.000	0.000	0.000	0.000	0.034	my5740_rel_lto.cy10a_gcp_c2s30
0.000	0.045	97.590	2.332	0.034	0.000	0.000	0.000	0.000	0.000	0.027	my5740_rel_lto.cy10a1_gcp_c2s30
0.000	0.027	88.596	11.183	0.194	0.000	0.000	0.000	0.000	0.000	0.031	my5740_rel_lto.cy10a2_gcp_c2s30
0.000	0.014	90.083	9.718	0.185	0.000	0.000	0.000	0.000	0.000	0.036	my5740_rel_lto.cy10a3_gcp_c2s30
0.000	0.176	95.646	4.107	0.071	0.000	0.000	0.000	0.000	0.000	0.028	my5740_rel_lto.cy10a4_gcp_c2s30