Introduction
This is a report for the insert benchmark with 160M docs and 8 client(s). It is generated by scripts (bash, awk, sed) and Tufte might not be impressed. An overview of the insert benchmark is here and a short update is here. Below, by DBMS, I mean DBMS+version.config. An example is my8020.c10b40 where my means MySQL, 8020 is version 8.0.20 and c10b40 is the name for the configuration file.
The test server is a c2-standard-30 from GCP with 15 cores, hyperthreads disabled, 120G RAM, XFS + SW RAID 0 on 4 NVMe devices (1.5TB). The benchmark was run with 8 client and there were 1 or 3 connections per client (1 for queries or inserts without rate limits, 1+1 for rate limited inserts+deletes). There are 8 tables, client per table. It loads 160M rows without secondary indexes, creates secondary indexes, then inserts 80M rows with a delete per insert to avoid growing the table. It then does 3 read+write tests for 1800s each that do queries as fast as possible with 100, 500 and then 1000 inserts/second/client concurrent with the queries and 1000 deletes/second to avoid growing the table. The database is cached by the OS but not by InnoDB.
The tested DBMS are:
- my5740_rel_lto.cy10a_4g_gcp_c2s30 - InnoDB and MySQL 5.7.40, rel_lto build, cy10a_gcp_c2s30 config, compiled with CMAKE_BUILD_TYPE=Release -O2, base config
- my5740_rel_lto.cy10a1_4g_gcp_c2s30 - InnoDB and MySQL 5.7.40, rel_lto build, cy10a_gcp_c2s30 config, compiled with CMAKE_BUILD_TYPE=Release -O2, adds innodb_use_native_aio=off
- my5740_rel_lto.cy10a2_4g_gcp_c2s30 - InnoDB and MySQL 5.7.40, rel_lto build, cy10a_gcp_c2s30 config, compiled with CMAKE_BUILD_TYPE=Release -O2, adds innodb_io_capacity=20k, innodb_io_capacity_max=40k
- my5740_rel_lto.cy10a3_4g_gcp_c2s30 - InnoDB and MySQL 5.7.40, rel_lto build, cy10a_gcp_c2s30 config, compiled with CMAKE_BUILD_TYPE=Release -O2, adds innodb_io_capacity=20k, innodb_io_capacity_max=40k, innodb_flush_sync=OFF
Contents
- Summary
- l.i0: load without secondary indexes
- l.x: create secondary indexes
- l.i1: continue load after secondary indexes created
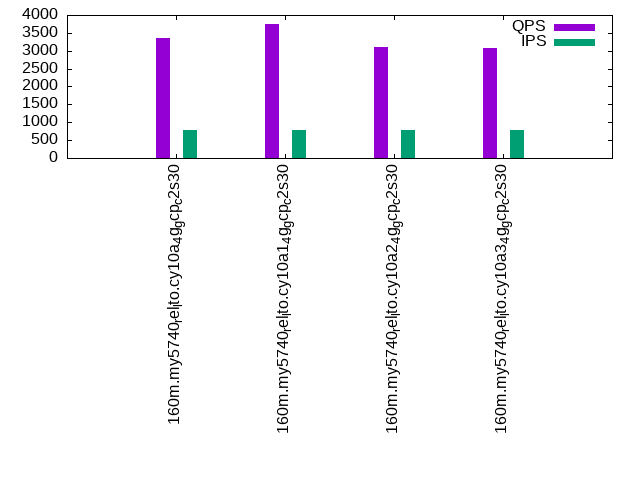
- q100.1: range queries with 100 insert/s per client
- q500.1: range queries with 500 insert/s per client
- q1000.1: range queries with 1000 insert/s per client
Summary
The numbers are inserts/s for l.i0 and l.i1, indexed docs (or rows) /s for l.x and queries/s for q*.2. The values are the average rate over the entire test for inserts (IPS) and queries (QPS). The range of values for IPS and QPS is split into 3 parts: bottom 25%, middle 50%, top 25%. Values in the bottom 25% have a red background, values in the top 25% have a green background and values in the middle have no color. A gray background is used for values that can be ignored because the DBMS did not sustain the target insert rate. Red backgrounds are not used when the minimum value is within 80% of the max value.
| dbms | l.i0 | l.x | l.i1 | q100.1 | q500.1 | q1000.1 |
|---|---|---|---|---|---|---|
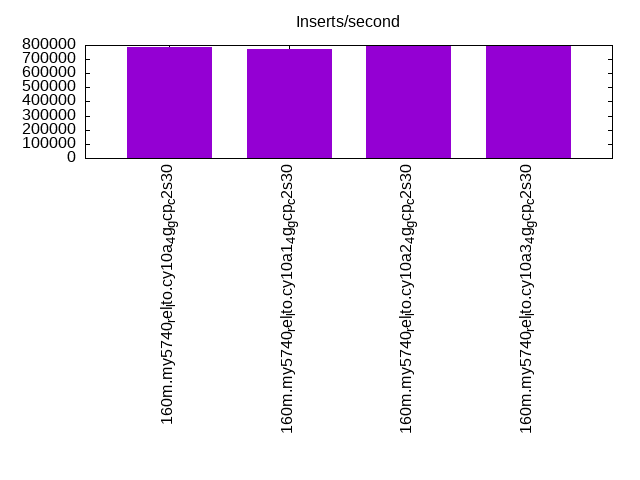
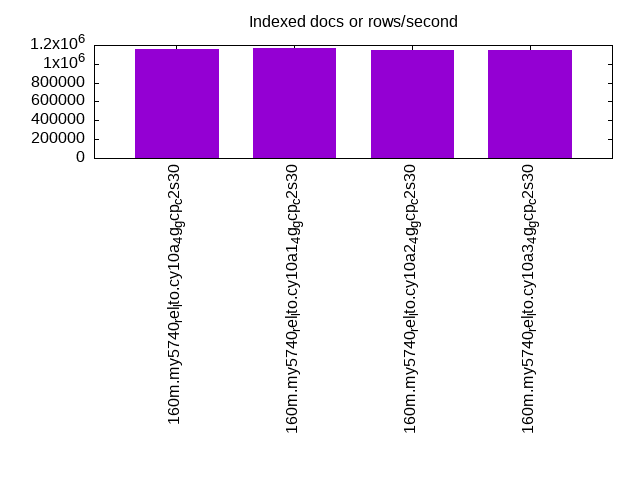
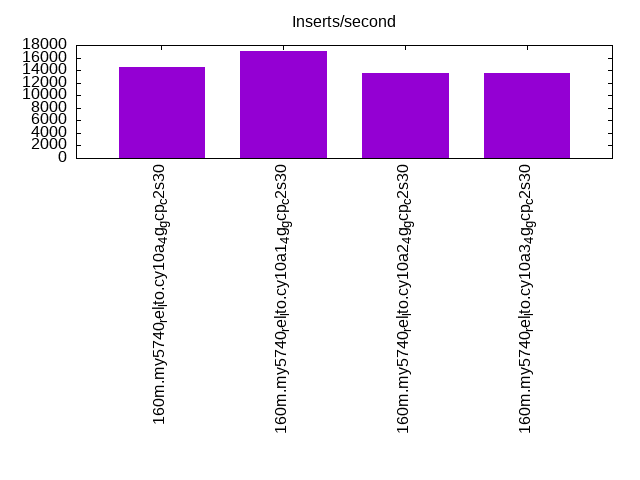
| 160m.my5740_rel_lto.cy10a_4g_gcp_c2s30 | 784314 | 1160145 | 14443 | 3361 | 2479 | 1306 |
| 160m.my5740_rel_lto.cy10a1_4g_gcp_c2s30 | 772947 | 1168613 | 16971 | 3762 | 2780 | 1484 |
| 160m.my5740_rel_lto.cy10a2_4g_gcp_c2s30 | 792079 | 1143571 | 13555 | 3098 | 2440 | 1297 |
| 160m.my5740_rel_lto.cy10a3_4g_gcp_c2s30 | 796020 | 1143571 | 13580 | 3066 | 2423 | 1283 |
This table has relative throughput, throughput for the DBMS relative to the DBMS in the first line, using the absolute throughput from the previous table.
| dbms | l.i0 | l.x | l.i1 | q100.1 | q500.1 | q1000.1 |
|---|---|---|---|---|---|---|
| 160m.my5740_rel_lto.cy10a_4g_gcp_c2s30 | 1.00 | 1.00 | 1.00 | 1.00 | 1.00 | 1.00 |
| 160m.my5740_rel_lto.cy10a1_4g_gcp_c2s30 | 0.99 | 1.01 | 1.18 | 1.12 | 1.12 | 1.14 |
| 160m.my5740_rel_lto.cy10a2_4g_gcp_c2s30 | 1.01 | 0.99 | 0.94 | 0.92 | 0.98 | 0.99 |
| 160m.my5740_rel_lto.cy10a3_4g_gcp_c2s30 | 1.01 | 0.99 | 0.94 | 0.91 | 0.98 | 0.98 |
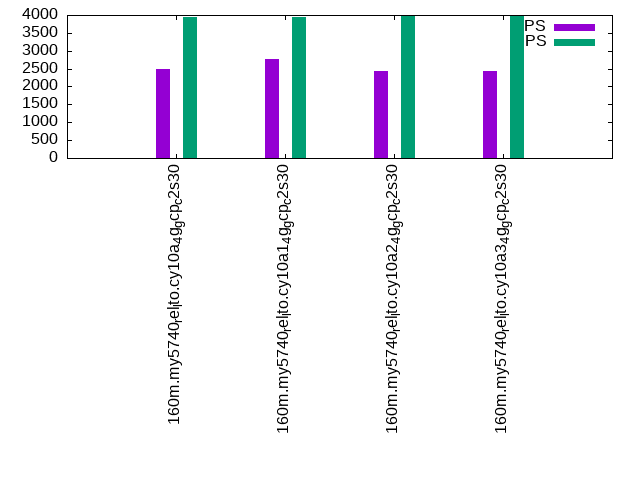
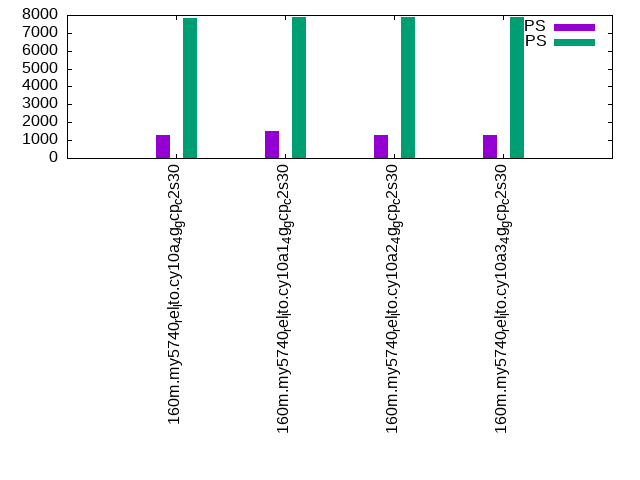
This lists the average rate of inserts/s for the tests that do inserts concurrent with queries. For such tests the query rate is listed in the table above. The read+write tests are setup so that the insert rate should match the target rate every second. Cells that are not at least 95% of the target have a red background to indicate a failure to satisfy the target.
| dbms | q100.1 | q500.1 | q1000.1 |
|---|---|---|---|
| my5740_rel_lto.cy10a_4g_gcp_c2s30 | 780 | 3947 | 7860 |
| my5740_rel_lto.cy10a1_4g_gcp_c2s30 | 782 | 3950 | 7882 |
| my5740_rel_lto.cy10a2_4g_gcp_c2s30 | 785 | 3965 | 7873 |
| my5740_rel_lto.cy10a3_4g_gcp_c2s30 | 783 | 3967 | 7877 |
| target | 800 | 4000 | 8000 |
l.i0
l.i0: load without secondary indexes. Graphs for performance per 1-second interval are here.
Average throughput:
Insert response time histogram: each cell has the percentage of responses that take <= the time in the header and max is the max response time in seconds. For the max column values in the top 25% of the range have a red background and in the bottom 25% of the range have a green background. The red background is not used when the min value is within 80% of the max value.
| dbms | 256us | 1ms | 4ms | 16ms | 64ms | 256ms | 1s | 4s | 16s | gt | max |
|---|---|---|---|---|---|---|---|---|---|---|---|
| my5740_rel_lto.cy10a_4g_gcp_c2s30 | 95.581 | 4.161 | 0.214 | 0.030 | 0.014 | 0.001 | 0.264 | ||||
| my5740_rel_lto.cy10a1_4g_gcp_c2s30 | 93.544 | 6.190 | 0.222 | 0.029 | 0.015 | 0.225 | |||||
| my5740_rel_lto.cy10a2_4g_gcp_c2s30 | 95.688 | 4.051 | 0.218 | 0.028 | 0.015 | 0.254 | |||||
| my5740_rel_lto.cy10a3_4g_gcp_c2s30 | 95.503 | 4.237 | 0.222 | 0.024 | 0.014 | nonzero | 0.259 |
Performance metrics for the DBMS listed above. Some are normalized by throughput, others are not. Legend for results is here.
ips	qps	rps	rmbps	wps	wmbps	rpq	rkbpq	wpi	wkbpi	csps	cpups	cspq	cpupq	dbgb1	dbgb2	rss	maxop	p50	p99	tag
784314	0	0	0.0	766.8	191.8	0.000	0.000	0.001	0.250	82898	69.1	0.106	13	10.6	139.1	4.5	0.264	108220	82710	160m.my5740_rel_lto.cy10a_4g_gcp_c2s30
772947	0	0	0.0	735.9	187.3	0.000	0.000	0.001	0.248	83156	68.7	0.108	13	10.6	139.1	4.5	0.225	105985	82011	160m.my5740_rel_lto.cy10a1_4g_gcp_c2s30
792079	0	0	0.0	756.3	187.7	0.000	0.000	0.001	0.243	82781	68.7	0.105	13	10.6	139.1	4.5	0.254	111079	79113	160m.my5740_rel_lto.cy10a2_4g_gcp_c2s30
796020	0	0	0.0	745.7	192.1	0.000	0.000	0.001	0.247	82677	69.0	0.104	13	10.6	139.1	4.5	0.259	111217	82810	160m.my5740_rel_lto.cy10a3_4g_gcp_c2s30
l.x
l.x: create secondary indexes.
Average throughput:
Performance metrics for the DBMS listed above. Some are normalized by throughput, others are not. Legend for results is here.
ips	qps	rps	rmbps	wps	wmbps	rpq	rkbpq	wpi	wkbpi	csps	cpups	cspq	cpupq	dbgb1	dbgb2	rss	maxop	p50	p99	tag
1160145	0	0	0.0	3541.0	937.8	0.000	0.000	0.003	0.828	37331	34.1	0.032	4	23.6	152.1	4.7	0.030	NA	NA	160m.my5740_rel_lto.cy10a_4g_gcp_c2s30
1168613	0	0	0.0	3581.6	932.2	0.000	0.000	0.003	0.817	44652	34.4	0.038	4	23.6	152.1	4.7	0.030	NA	NA	160m.my5740_rel_lto.cy10a1_4g_gcp_c2s30
1143571	0	0	0.0	3477.2	903.0	0.000	0.000	0.003	0.809	39929	32.9	0.035	4	23.6	152.1	4.7	0.030	NA	NA	160m.my5740_rel_lto.cy10a2_4g_gcp_c2s30
1143571	0	0	0.0	3531.6	906.6	0.000	0.000	0.003	0.812	39937	32.8	0.035	4	23.6	152.1	4.7	0.030	NA	NA	160m.my5740_rel_lto.cy10a3_4g_gcp_c2s30
l.i1
l.i1: continue load after secondary indexes created. Graphs for performance per 1-second interval are here.
Average throughput:
Insert response time histogram: each cell has the percentage of responses that take <= the time in the header and max is the max response time in seconds. For the max column values in the top 25% of the range have a red background and in the bottom 25% of the range have a green background. The red background is not used when the min value is within 80% of the max value.
| dbms | 256us | 1ms | 4ms | 16ms | 64ms | 256ms | 1s | 4s | 16s | gt | max |
|---|---|---|---|---|---|---|---|---|---|---|---|
| my5740_rel_lto.cy10a_4g_gcp_c2s30 | 2.646 | 38.965 | 50.888 | 7.257 | 0.244 | 0.618 | |||||
| my5740_rel_lto.cy10a1_4g_gcp_c2s30 | 1.580 | 53.134 | 40.278 | 4.612 | 0.396 | 0.731 | |||||
| my5740_rel_lto.cy10a2_4g_gcp_c2s30 | 2.726 | 32.981 | 56.625 | 7.387 | 0.280 | 0.723 | |||||
| my5740_rel_lto.cy10a3_4g_gcp_c2s30 | 2.724 | 33.054 | 56.538 | 7.397 | 0.286 | 0.799 |
Delete response time histogram: each cell has the percentage of responses that take <= the time in the header and max is the max response time in seconds. For the max column values in the top 25% of the range have a red background and in the bottom 25% of the range have a green background. The red background is not used when the min value is within 80% of the max value.
| dbms | 256us | 1ms | 4ms | 16ms | 64ms | 256ms | 1s | 4s | 16s | gt | max |
|---|---|---|---|---|---|---|---|---|---|---|---|
| my5740_rel_lto.cy10a_4g_gcp_c2s30 | nonzero | 3.944 | 41.954 | 48.528 | 5.556 | 0.018 | 0.451 | ||||
| my5740_rel_lto.cy10a1_4g_gcp_c2s30 | 0.001 | 2.932 | 56.043 | 37.685 | 3.191 | 0.148 | 0.845 | ||||
| my5740_rel_lto.cy10a2_4g_gcp_c2s30 | nonzero | 4.029 | 35.895 | 54.406 | 5.643 | 0.027 | 0.575 | ||||
| my5740_rel_lto.cy10a3_4g_gcp_c2s30 | 0.001 | 4.013 | 35.935 | 54.384 | 5.640 | 0.028 | 0.696 |
Performance metrics for the DBMS listed above. Some are normalized by throughput, others are not. Legend for results is here.
ips	qps	rps	rmbps	wps	wmbps	rpq	rkbpq	wpi	wkbpi	csps	cpups	cspq	cpupq	dbgb1	dbgb2	rss	maxop	p50	p99	tag
14443	0	2	0.6	15096.0	471.3	0.000	0.040	1.045	33.414	137695	35.8	9.534	372	41.0	175.7	4.7	0.618	1848	200	160m.my5740_rel_lto.cy10a_4g_gcp_c2s30
16971	0	3	0.7	14622.7	472.2	0.000	0.041	0.862	28.493	175228	44.5	10.325	393	40.9	175.6	4.7	0.731	2197	200	160m.my5740_rel_lto.cy10a1_4g_gcp_c2s30
13555	0	2	0.5	15377.4	476.6	0.000	0.038	1.134	36.004	133401	33.7	9.842	373	41.1	176.0	4.7	0.723	1748	200	160m.my5740_rel_lto.cy10a2_4g_gcp_c2s30
13580	0	2	0.5	15354.0	477.8	0.000	0.041	1.131	36.025	133657	33.8	9.842	373	41.1	176.0	4.7	0.799	1748	150	160m.my5740_rel_lto.cy10a3_4g_gcp_c2s30
q100.1
q100.1: range queries with 100 insert/s per client. Graphs for performance per 1-second interval are here.
Average throughput:
Query response time histogram: each cell has the percentage of responses that take <= the time in the header and max is the max response time in seconds. For max values in the top 25% of the range have a red background and in the bottom 25% of the range have a green background. The red background is not used when the min value is within 80% of the max value.
| dbms | 256us | 1ms | 4ms | 16ms | 64ms | 256ms | 1s | 4s | 16s | gt | max |
|---|---|---|---|---|---|---|---|---|---|---|---|
| my5740_rel_lto.cy10a_4g_gcp_c2s30 | 39.625 | 27.285 | 12.729 | 17.863 | 2.488 | 0.010 | nonzero | 0.337 | |||
| my5740_rel_lto.cy10a1_4g_gcp_c2s30 | 39.768 | 30.793 | 11.430 | 15.880 | 2.118 | 0.011 | nonzero | 0.364 | |||
| my5740_rel_lto.cy10a2_4g_gcp_c2s30 | 39.108 | 25.562 | 12.699 | 20.149 | 2.473 | 0.010 | 0.238 | ||||
| my5740_rel_lto.cy10a3_4g_gcp_c2s30 | 39.086 | 25.483 | 12.555 | 20.334 | 2.531 | 0.011 | nonzero | 0.261 |
Insert response time histogram: each cell has the percentage of responses that take <= the time in the header and max is the max response time in seconds. For max values in the top 25% of the range have a red background and in the bottom 25% of the range have a green background. The red background is not used when the min value is within 80% of the max value.
| dbms | 256us | 1ms | 4ms | 16ms | 64ms | 256ms | 1s | 4s | 16s | gt | max |
|---|---|---|---|---|---|---|---|---|---|---|---|
| my5740_rel_lto.cy10a_4g_gcp_c2s30 | 31.712 | 52.691 | 15.545 | 0.052 | 0.084 | ||||||
| my5740_rel_lto.cy10a1_4g_gcp_c2s30 | 30.653 | 48.677 | 20.476 | 0.194 | 0.205 | ||||||
| my5740_rel_lto.cy10a2_4g_gcp_c2s30 | 24.108 | 48.771 | 26.896 | 0.222 | 0.003 | 0.334 | |||||
| my5740_rel_lto.cy10a3_4g_gcp_c2s30 | 23.917 | 47.889 | 27.983 | 0.208 | 0.003 | 0.313 |
Delete response time histogram: each cell has the percentage of responses that take <= the time in the header and max is the max response time in seconds. For max values in the top 25% of the range have a red background and in the bottom 25% of the range have a green background. The red background is not used when the min value is within 80% of the max value.
| dbms | 256us | 1ms | 4ms | 16ms | 64ms | 256ms | 1s | 4s | 16s | gt | max |
|---|---|---|---|---|---|---|---|---|---|---|---|
| my5740_rel_lto.cy10a_4g_gcp_c2s30 | 33.288 | 51.962 | 14.715 | 0.035 | 0.148 | ||||||
| my5740_rel_lto.cy10a1_4g_gcp_c2s30 | 32.927 | 47.785 | 19.111 | 0.177 | 0.210 | ||||||
| my5740_rel_lto.cy10a2_4g_gcp_c2s30 | 25.361 | 48.951 | 25.458 | 0.229 | 0.244 | ||||||
| my5740_rel_lto.cy10a3_4g_gcp_c2s30 | 25.090 | 48.378 | 26.375 | 0.156 | 0.139 |
Performance metrics for the DBMS listed above. Some are normalized by throughput, others are not. Legend for results is here.
ips	qps	rps	rmbps	wps	wmbps	rpq	rkbpq	wpi	wkbpi	csps	cpups	cspq	cpupq	dbgb1	dbgb2	rss	maxop	p50	p99	tag
780	3361	9	0.3	17861.0	432.5	0.003	0.102	22.887	567.440	121306	15.7	36.088	701	41.0	175.7	4.6	0.337	448	80	160m.my5740_rel_lto.cy10a_4g_gcp_c2s30
782	3762	11	0.3	18218.7	451.1	0.003	0.092	23.295	590.583	133573	17.6	35.508	702	40.9	175.6	4.6	0.364	496	64	160m.my5740_rel_lto.cy10a1_4g_gcp_c2s30
785	3098	12	0.3	17993.1	423.6	0.004	0.114	22.930	552.779	119360	15.1	38.523	731	41.1	176.0	4.6	0.238	400	80	160m.my5740_rel_lto.cy10a2_4g_gcp_c2s30
783	3066	12	0.3	17888.3	435.8	0.004	0.103	22.834	569.634	118562	15.0	38.675	734	41.1	176.0	4.6	0.261	400	64	160m.my5740_rel_lto.cy10a3_4g_gcp_c2s30
q500.1
q500.1: range queries with 500 insert/s per client. Graphs for performance per 1-second interval are here.
Average throughput:
Query response time histogram: each cell has the percentage of responses that take <= the time in the header and max is the max response time in seconds. For max values in the top 25% of the range have a red background and in the bottom 25% of the range have a green background. The red background is not used when the min value is within 80% of the max value.
| dbms | 256us | 1ms | 4ms | 16ms | 64ms | 256ms | 1s | 4s | 16s | gt | max |
|---|---|---|---|---|---|---|---|---|---|---|---|
| my5740_rel_lto.cy10a_4g_gcp_c2s30 | 27.698 | 30.180 | 14.587 | 23.586 | 3.931 | 0.017 | 0.150 | ||||
| my5740_rel_lto.cy10a1_4g_gcp_c2s30 | 28.252 | 34.356 | 13.241 | 20.699 | 3.434 | 0.017 | 0.192 | ||||
| my5740_rel_lto.cy10a2_4g_gcp_c2s30 | 28.259 | 29.304 | 14.531 | 23.787 | 4.105 | 0.015 | 0.140 | ||||
| my5740_rel_lto.cy10a3_4g_gcp_c2s30 | 28.346 | 29.248 | 14.242 | 23.987 | 4.163 | 0.014 | 0.168 |
Insert response time histogram: each cell has the percentage of responses that take <= the time in the header and max is the max response time in seconds. For max values in the top 25% of the range have a red background and in the bottom 25% of the range have a green background. The red background is not used when the min value is within 80% of the max value.
| dbms | 256us | 1ms | 4ms | 16ms | 64ms | 256ms | 1s | 4s | 16s | gt | max |
|---|---|---|---|---|---|---|---|---|---|---|---|
| my5740_rel_lto.cy10a_4g_gcp_c2s30 | 26.587 | 55.094 | 18.258 | 0.061 | 0.158 | ||||||
| my5740_rel_lto.cy10a1_4g_gcp_c2s30 | 23.644 | 55.983 | 20.174 | 0.200 | 0.175 | ||||||
| my5740_rel_lto.cy10a2_4g_gcp_c2s30 | 29.180 | 54.645 | 16.142 | 0.033 | 0.116 | ||||||
| my5740_rel_lto.cy10a3_4g_gcp_c2s30 | 31.498 | 54.493 | 13.999 | 0.010 | 0.094 |
Delete response time histogram: each cell has the percentage of responses that take <= the time in the header and max is the max response time in seconds. For max values in the top 25% of the range have a red background and in the bottom 25% of the range have a green background. The red background is not used when the min value is within 80% of the max value.
| dbms | 256us | 1ms | 4ms | 16ms | 64ms | 256ms | 1s | 4s | 16s | gt | max |
|---|---|---|---|---|---|---|---|---|---|---|---|
| my5740_rel_lto.cy10a_4g_gcp_c2s30 | 27.903 | 54.651 | 17.402 | 0.044 | 0.116 | ||||||
| my5740_rel_lto.cy10a1_4g_gcp_c2s30 | 25.269 | 55.633 | 18.929 | 0.168 | 0.187 | ||||||
| my5740_rel_lto.cy10a2_4g_gcp_c2s30 | 30.044 | 54.458 | 15.461 | 0.037 | 0.103 | ||||||
| my5740_rel_lto.cy10a3_4g_gcp_c2s30 | 32.467 | 54.269 | 13.257 | 0.007 | 0.082 |
Performance metrics for the DBMS listed above. Some are normalized by throughput, others are not. Legend for results is here.
ips	qps	rps	rmbps	wps	wmbps	rpq	rkbpq	wpi	wkbpi	csps	cpups	cspq	cpupq	dbgb1	dbgb2	rss	maxop	p50	p99	tag
3947	2479	55	1.1	17396.9	437.9	0.022	0.457	4.407	113.604	119337	17.8	48.143	1077	41.0	175.7	4.6	0.150	319	240	160m.my5740_rel_lto.cy10a_4g_gcp_c2s30
3950	2780	65	1.3	17744.2	458.2	0.024	0.489	4.493	118.787	134056	19.6	48.229	1058	40.9	175.6	4.6	0.192	352	208	160m.my5740_rel_lto.cy10a1_4g_gcp_c2s30
3965	2440	47	1.0	17401.5	422.9	0.019	0.411	4.389	109.229	119877	17.5	49.120	1076	41.1	176.0	4.6	0.140	304	240	160m.my5740_rel_lto.cy10a2_4g_gcp_c2s30
3967	2423	43	0.9	17283.1	438.1	0.018	0.394	4.357	113.089	118534	17.2	48.914	1065	41.1	176.0	4.6	0.168	304	240	160m.my5740_rel_lto.cy10a3_4g_gcp_c2s30
q1000.1
q1000.1: range queries with 1000 insert/s per client. Graphs for performance per 1-second interval are here.
Average throughput:
Query response time histogram: each cell has the percentage of responses that take <= the time in the header and max is the max response time in seconds. For max values in the top 25% of the range have a red background and in the bottom 25% of the range have a green background. The red background is not used when the min value is within 80% of the max value.
| dbms | 256us | 1ms | 4ms | 16ms | 64ms | 256ms | 1s | 4s | 16s | gt | max |
|---|---|---|---|---|---|---|---|---|---|---|---|
| my5740_rel_lto.cy10a_4g_gcp_c2s30 | 15.274 | 27.193 | 16.872 | 29.294 | 11.095 | 0.270 | 0.001 | 0.517 | |||
| my5740_rel_lto.cy10a1_4g_gcp_c2s30 | 15.793 | 31.664 | 17.323 | 25.796 | 9.123 | 0.296 | 0.006 | 0.809 | |||
| my5740_rel_lto.cy10a2_4g_gcp_c2s30 | 15.782 | 25.965 | 15.927 | 30.726 | 11.424 | 0.176 | nonzero | 0.381 | |||
| my5740_rel_lto.cy10a3_4g_gcp_c2s30 | 15.702 | 25.892 | 15.630 | 30.973 | 11.629 | 0.174 | nonzero | 0.315 |
Insert response time histogram: each cell has the percentage of responses that take <= the time in the header and max is the max response time in seconds. For max values in the top 25% of the range have a red background and in the bottom 25% of the range have a green background. The red background is not used when the min value is within 80% of the max value.
| dbms | 256us | 1ms | 4ms | 16ms | 64ms | 256ms | 1s | 4s | 16s | gt | max |
|---|---|---|---|---|---|---|---|---|---|---|---|
| my5740_rel_lto.cy10a_4g_gcp_c2s30 | 12.047 | 41.812 | 44.100 | 2.000 | 0.041 | 0.824 | |||||
| my5740_rel_lto.cy10a1_4g_gcp_c2s30 | 9.643 | 42.473 | 45.134 | 2.645 | 0.106 | 0.825 | |||||
| my5740_rel_lto.cy10a2_4g_gcp_c2s30 | 16.755 | 46.119 | 36.630 | 0.492 | 0.005 | 0.392 | |||||
| my5740_rel_lto.cy10a3_4g_gcp_c2s30 | 17.164 | 46.423 | 35.979 | 0.432 | 0.002 | 0.471 |
Delete response time histogram: each cell has the percentage of responses that take <= the time in the header and max is the max response time in seconds. For max values in the top 25% of the range have a red background and in the bottom 25% of the range have a green background. The red background is not used when the min value is within 80% of the max value.
| dbms | 256us | 1ms | 4ms | 16ms | 64ms | 256ms | 1s | 4s | 16s | gt | max |
|---|---|---|---|---|---|---|---|---|---|---|---|
| my5740_rel_lto.cy10a_4g_gcp_c2s30 | 12.687 | 42.377 | 43.383 | 1.523 | 0.029 | 0.549 | |||||
| my5740_rel_lto.cy10a1_4g_gcp_c2s30 | 10.459 | 43.389 | 43.927 | 2.150 | 0.075 | 0.822 | |||||
| my5740_rel_lto.cy10a2_4g_gcp_c2s30 | 17.550 | 46.528 | 35.591 | 0.328 | 0.003 | 0.398 | |||||
| my5740_rel_lto.cy10a3_4g_gcp_c2s30 | 18.020 | 46.782 | 34.915 | 0.282 | 0.001 | 0.369 |
Performance metrics for the DBMS listed above. Some are normalized by throughput, others are not. Legend for results is here.
ips	qps	rps	rmbps	wps	wmbps	rpq	rkbpq	wpi	wkbpi	csps	cpups	cspq	cpupq	dbgb1	dbgb2	rss	maxop	p50	p99	tag
7860	1306	68	1.4	16873.0	448.2	0.052	1.066	2.147	58.391	132157	23.5	101.177	2699	41.3	176.2	4.6	0.517	160	80	160m.my5740_rel_lto.cy10a_4g_gcp_c2s30
7882	1484	84	1.7	16956.4	467.9	0.056	1.172	2.151	60.790	147246	26.0	99.189	2627	41.2	176.0	4.6	0.809	176	80	160m.my5740_rel_lto.cy10a1_4g_gcp_c2s30
7873	1297	51	1.0	16935.9	427.8	0.040	0.802	2.151	55.641	129669	22.5	99.968	2602	41.4	176.7	4.6	0.381	144	64	160m.my5740_rel_lto.cy10a2_4g_gcp_c2s30
7877	1283	51	1.0	16851.8	448.1	0.040	0.798	2.139	58.255	128697	22.2	100.317	2596	41.5	176.6	4.6	0.315	160	80	160m.my5740_rel_lto.cy10a3_4g_gcp_c2s30
l.i0
l.i0: load without secondary indexes
Performance metrics for all DBMS, not just the ones listed above. Some are normalized by throughput, others are not. Legend for results is here.
ips	qps	rps	rmbps	wps	wmbps	rpq	rkbpq	wpi	wkbpi	csps	cpups	cspq	cpupq	dbgb1	dbgb2	rss	maxop	p50	p99	tag
784314	0	0	0.0	766.8	191.8	0.000	0.000	0.001	0.250	82898	69.1	0.106	13	10.6	139.1	4.5	0.264	108220	82710	160m.my5740_rel_lto.cy10a_4g_gcp_c2s30
772947	0	0	0.0	735.9	187.3	0.000	0.000	0.001	0.248	83156	68.7	0.108	13	10.6	139.1	4.5	0.225	105985	82011	160m.my5740_rel_lto.cy10a1_4g_gcp_c2s30
792079	0	0	0.0	756.3	187.7	0.000	0.000	0.001	0.243	82781	68.7	0.105	13	10.6	139.1	4.5	0.254	111079	79113	160m.my5740_rel_lto.cy10a2_4g_gcp_c2s30
796020	0	0	0.0	745.7	192.1	0.000	0.000	0.001	0.247	82677	69.0	0.104	13	10.6	139.1	4.5	0.259	111217	82810	160m.my5740_rel_lto.cy10a3_4g_gcp_c2s30
l.x
l.x: create secondary indexes
Performance metrics for all DBMS, not just the ones listed above. Some are normalized by throughput, others are not. Legend for results is here.
ips	qps	rps	rmbps	wps	wmbps	rpq	rkbpq	wpi	wkbpi	csps	cpups	cspq	cpupq	dbgb1	dbgb2	rss	maxop	p50	p99	tag
1160145	0	0	0.0	3541.0	937.8	0.000	0.000	0.003	0.828	37331	34.1	0.032	4	23.6	152.1	4.7	0.030	NA	NA	160m.my5740_rel_lto.cy10a_4g_gcp_c2s30
1168613	0	0	0.0	3581.6	932.2	0.000	0.000	0.003	0.817	44652	34.4	0.038	4	23.6	152.1	4.7	0.030	NA	NA	160m.my5740_rel_lto.cy10a1_4g_gcp_c2s30
1143571	0	0	0.0	3477.2	903.0	0.000	0.000	0.003	0.809	39929	32.9	0.035	4	23.6	152.1	4.7	0.030	NA	NA	160m.my5740_rel_lto.cy10a2_4g_gcp_c2s30
1143571	0	0	0.0	3531.6	906.6	0.000	0.000	0.003	0.812	39937	32.8	0.035	4	23.6	152.1	4.7	0.030	NA	NA	160m.my5740_rel_lto.cy10a3_4g_gcp_c2s30
l.i1
l.i1: continue load after secondary indexes created
Performance metrics for all DBMS, not just the ones listed above. Some are normalized by throughput, others are not. Legend for results is here.
ips	qps	rps	rmbps	wps	wmbps	rpq	rkbpq	wpi	wkbpi	csps	cpups	cspq	cpupq	dbgb1	dbgb2	rss	maxop	p50	p99	tag
14443	0	2	0.6	15096.0	471.3	0.000	0.040	1.045	33.414	137695	35.8	9.534	372	41.0	175.7	4.7	0.618	1848	200	160m.my5740_rel_lto.cy10a_4g_gcp_c2s30
16971	0	3	0.7	14622.7	472.2	0.000	0.041	0.862	28.493	175228	44.5	10.325	393	40.9	175.6	4.7	0.731	2197	200	160m.my5740_rel_lto.cy10a1_4g_gcp_c2s30
13555	0	2	0.5	15377.4	476.6	0.000	0.038	1.134	36.004	133401	33.7	9.842	373	41.1	176.0	4.7	0.723	1748	200	160m.my5740_rel_lto.cy10a2_4g_gcp_c2s30
13580	0	2	0.5	15354.0	477.8	0.000	0.041	1.131	36.025	133657	33.8	9.842	373	41.1	176.0	4.7	0.799	1748	150	160m.my5740_rel_lto.cy10a3_4g_gcp_c2s30
q100.1
q100.1: range queries with 100 insert/s per client
Performance metrics for all DBMS, not just the ones listed above. Some are normalized by throughput, others are not. Legend for results is here.
ips	qps	rps	rmbps	wps	wmbps	rpq	rkbpq	wpi	wkbpi	csps	cpups	cspq	cpupq	dbgb1	dbgb2	rss	maxop	p50	p99	tag
780	3361	9	0.3	17861.0	432.5	0.003	0.102	22.887	567.440	121306	15.7	36.088	701	41.0	175.7	4.6	0.337	448	80	160m.my5740_rel_lto.cy10a_4g_gcp_c2s30
782	3762	11	0.3	18218.7	451.1	0.003	0.092	23.295	590.583	133573	17.6	35.508	702	40.9	175.6	4.6	0.364	496	64	160m.my5740_rel_lto.cy10a1_4g_gcp_c2s30
785	3098	12	0.3	17993.1	423.6	0.004	0.114	22.930	552.779	119360	15.1	38.523	731	41.1	176.0	4.6	0.238	400	80	160m.my5740_rel_lto.cy10a2_4g_gcp_c2s30
783	3066	12	0.3	17888.3	435.8	0.004	0.103	22.834	569.634	118562	15.0	38.675	734	41.1	176.0	4.6	0.261	400	64	160m.my5740_rel_lto.cy10a3_4g_gcp_c2s30
q500.1
q500.1: range queries with 500 insert/s per client
Performance metrics for all DBMS, not just the ones listed above. Some are normalized by throughput, others are not. Legend for results is here.
ips	qps	rps	rmbps	wps	wmbps	rpq	rkbpq	wpi	wkbpi	csps	cpups	cspq	cpupq	dbgb1	dbgb2	rss	maxop	p50	p99	tag
3947	2479	55	1.1	17396.9	437.9	0.022	0.457	4.407	113.604	119337	17.8	48.143	1077	41.0	175.7	4.6	0.150	319	240	160m.my5740_rel_lto.cy10a_4g_gcp_c2s30
3950	2780	65	1.3	17744.2	458.2	0.024	0.489	4.493	118.787	134056	19.6	48.229	1058	40.9	175.6	4.6	0.192	352	208	160m.my5740_rel_lto.cy10a1_4g_gcp_c2s30
3965	2440	47	1.0	17401.5	422.9	0.019	0.411	4.389	109.229	119877	17.5	49.120	1076	41.1	176.0	4.6	0.140	304	240	160m.my5740_rel_lto.cy10a2_4g_gcp_c2s30
3967	2423	43	0.9	17283.1	438.1	0.018	0.394	4.357	113.089	118534	17.2	48.914	1065	41.1	176.0	4.6	0.168	304	240	160m.my5740_rel_lto.cy10a3_4g_gcp_c2s30
q1000.1
q1000.1: range queries with 1000 insert/s per client
Performance metrics for all DBMS, not just the ones listed above. Some are normalized by throughput, others are not. Legend for results is here.
ips	qps	rps	rmbps	wps	wmbps	rpq	rkbpq	wpi	wkbpi	csps	cpups	cspq	cpupq	dbgb1	dbgb2	rss	maxop	p50	p99	tag
7860	1306	68	1.4	16873.0	448.2	0.052	1.066	2.147	58.391	132157	23.5	101.177	2699	41.3	176.2	4.6	0.517	160	80	160m.my5740_rel_lto.cy10a_4g_gcp_c2s30
7882	1484	84	1.7	16956.4	467.9	0.056	1.172	2.151	60.790	147246	26.0	99.189	2627	41.2	176.0	4.6	0.809	176	80	160m.my5740_rel_lto.cy10a1_4g_gcp_c2s30
7873	1297	51	1.0	16935.9	427.8	0.040	0.802	2.151	55.641	129669	22.5	99.968	2602	41.4	176.7	4.6	0.381	144	64	160m.my5740_rel_lto.cy10a2_4g_gcp_c2s30
7877	1283	51	1.0	16851.8	448.1	0.040	0.798	2.139	58.255	128697	22.2	100.317	2596	41.5	176.6	4.6	0.315	160	80	160m.my5740_rel_lto.cy10a3_4g_gcp_c2s30
l.i0
- l.i0: load without secondary indexes
- Legend for results is here.
- Each entry lists the percentage of responses that fit in that bucket (slower than max time for previous bucket, faster than min time for next bucket).
Insert response time histogram
256us	1ms	4ms	16ms	64ms	256ms	1s	4s	16s	gt	max	tag
0.000	95.581	4.161	0.214	0.030	0.014	0.001	0.000	0.000	0.000	0.264	my5740_rel_lto.cy10a_4g_gcp_c2s30
0.000	93.544	6.190	0.222	0.029	0.015	0.000	0.000	0.000	0.000	0.225	my5740_rel_lto.cy10a1_4g_gcp_c2s30
0.000	95.688	4.051	0.218	0.028	0.015	0.000	0.000	0.000	0.000	0.254	my5740_rel_lto.cy10a2_4g_gcp_c2s30
0.000	95.503	4.237	0.222	0.024	0.014	nonzero	0.000	0.000	0.000	0.259	my5740_rel_lto.cy10a3_4g_gcp_c2s30
l.x
- l.x: create secondary indexes
- Legend for results is here.
- Each entry lists the percentage of responses that fit in that bucket (slower than max time for previous bucket, faster than min time for next bucket).
TODO - determine whether there is data for create index response time
l.i1
- l.i1: continue load after secondary indexes created
- Legend for results is here.
- Each entry lists the percentage of responses that fit in that bucket (slower than max time for previous bucket, faster than min time for next bucket).
Insert response time histogram
256us	1ms	4ms	16ms	64ms	256ms	1s	4s	16s	gt	max	tag
0.000	0.000	2.646	38.965	50.888	7.257	0.244	0.000	0.000	0.000	0.618	my5740_rel_lto.cy10a_4g_gcp_c2s30
0.000	0.000	1.580	53.134	40.278	4.612	0.396	0.000	0.000	0.000	0.731	my5740_rel_lto.cy10a1_4g_gcp_c2s30
0.000	0.000	2.726	32.981	56.625	7.387	0.280	0.000	0.000	0.000	0.723	my5740_rel_lto.cy10a2_4g_gcp_c2s30
0.000	0.000	2.724	33.054	56.538	7.397	0.286	0.000	0.000	0.000	0.799	my5740_rel_lto.cy10a3_4g_gcp_c2s30
Delete response time histogram
256us	1ms	4ms	16ms	64ms	256ms	1s	4s	16s	gt	max	tag
0.000	nonzero	3.944	41.954	48.528	5.556	0.018	0.000	0.000	0.000	0.451	my5740_rel_lto.cy10a_4g_gcp_c2s30
0.000	0.001	2.932	56.043	37.685	3.191	0.148	0.000	0.000	0.000	0.845	my5740_rel_lto.cy10a1_4g_gcp_c2s30
0.000	nonzero	4.029	35.895	54.406	5.643	0.027	0.000	0.000	0.000	0.575	my5740_rel_lto.cy10a2_4g_gcp_c2s30
0.000	0.001	4.013	35.935	54.384	5.640	0.028	0.000	0.000	0.000	0.696	my5740_rel_lto.cy10a3_4g_gcp_c2s30
q100.1
- q100.1: range queries with 100 insert/s per client
- Legend for results is here.
- Each entry lists the percentage of responses that fit in that bucket (slower than max time for previous bucket, faster than min time for next bucket).
Query response time histogram
256us	1ms	4ms	16ms	64ms	256ms	1s	4s	16s	gt	max	tag
39.625	27.285	12.729	17.863	2.488	0.010	nonzero	0.000	0.000	0.000	0.337	my5740_rel_lto.cy10a_4g_gcp_c2s30
39.768	30.793	11.430	15.880	2.118	0.011	nonzero	0.000	0.000	0.000	0.364	my5740_rel_lto.cy10a1_4g_gcp_c2s30
39.108	25.562	12.699	20.149	2.473	0.010	0.000	0.000	0.000	0.000	0.238	my5740_rel_lto.cy10a2_4g_gcp_c2s30
39.086	25.483	12.555	20.334	2.531	0.011	nonzero	0.000	0.000	0.000	0.261	my5740_rel_lto.cy10a3_4g_gcp_c2s30
Insert response time histogram
256us	1ms	4ms	16ms	64ms	256ms	1s	4s	16s	gt	max	tag
0.000	0.000	31.712	52.691	15.545	0.052	0.000	0.000	0.000	0.000	0.084	my5740_rel_lto.cy10a_4g_gcp_c2s30
0.000	0.000	30.653	48.677	20.476	0.194	0.000	0.000	0.000	0.000	0.205	my5740_rel_lto.cy10a1_4g_gcp_c2s30
0.000	0.000	24.108	48.771	26.896	0.222	0.003	0.000	0.000	0.000	0.334	my5740_rel_lto.cy10a2_4g_gcp_c2s30
0.000	0.000	23.917	47.889	27.983	0.208	0.003	0.000	0.000	0.000	0.313	my5740_rel_lto.cy10a3_4g_gcp_c2s30
Delete response time histogram
256us	1ms	4ms	16ms	64ms	256ms	1s	4s	16s	gt	max	tag
0.000	0.000	33.288	51.962	14.715	0.035	0.000	0.000	0.000	0.000	0.148	my5740_rel_lto.cy10a_4g_gcp_c2s30
0.000	0.000	32.927	47.785	19.111	0.177	0.000	0.000	0.000	0.000	0.210	my5740_rel_lto.cy10a1_4g_gcp_c2s30
0.000	0.000	25.361	48.951	25.458	0.229	0.000	0.000	0.000	0.000	0.244	my5740_rel_lto.cy10a2_4g_gcp_c2s30
0.000	0.000	25.090	48.378	26.375	0.156	0.000	0.000	0.000	0.000	0.139	my5740_rel_lto.cy10a3_4g_gcp_c2s30
q500.1
- q500.1: range queries with 500 insert/s per client
- Legend for results is here.
- Each entry lists the percentage of responses that fit in that bucket (slower than max time for previous bucket, faster than min time for next bucket).
Query response time histogram
256us	1ms	4ms	16ms	64ms	256ms	1s	4s	16s	gt	max	tag
27.698	30.180	14.587	23.586	3.931	0.017	0.000	0.000	0.000	0.000	0.150	my5740_rel_lto.cy10a_4g_gcp_c2s30
28.252	34.356	13.241	20.699	3.434	0.017	0.000	0.000	0.000	0.000	0.192	my5740_rel_lto.cy10a1_4g_gcp_c2s30
28.259	29.304	14.531	23.787	4.105	0.015	0.000	0.000	0.000	0.000	0.140	my5740_rel_lto.cy10a2_4g_gcp_c2s30
28.346	29.248	14.242	23.987	4.163	0.014	0.000	0.000	0.000	0.000	0.168	my5740_rel_lto.cy10a3_4g_gcp_c2s30
Insert response time histogram
256us	1ms	4ms	16ms	64ms	256ms	1s	4s	16s	gt	max	tag
0.000	0.000	26.587	55.094	18.258	0.061	0.000	0.000	0.000	0.000	0.158	my5740_rel_lto.cy10a_4g_gcp_c2s30
0.000	0.000	23.644	55.983	20.174	0.200	0.000	0.000	0.000	0.000	0.175	my5740_rel_lto.cy10a1_4g_gcp_c2s30
0.000	0.000	29.180	54.645	16.142	0.033	0.000	0.000	0.000	0.000	0.116	my5740_rel_lto.cy10a2_4g_gcp_c2s30
0.000	0.000	31.498	54.493	13.999	0.010	0.000	0.000	0.000	0.000	0.094	my5740_rel_lto.cy10a3_4g_gcp_c2s30
Delete response time histogram
256us	1ms	4ms	16ms	64ms	256ms	1s	4s	16s	gt	max	tag
0.000	0.000	27.903	54.651	17.402	0.044	0.000	0.000	0.000	0.000	0.116	my5740_rel_lto.cy10a_4g_gcp_c2s30
0.000	0.000	25.269	55.633	18.929	0.168	0.000	0.000	0.000	0.000	0.187	my5740_rel_lto.cy10a1_4g_gcp_c2s30
0.000	0.000	30.044	54.458	15.461	0.037	0.000	0.000	0.000	0.000	0.103	my5740_rel_lto.cy10a2_4g_gcp_c2s30
0.000	0.000	32.467	54.269	13.257	0.007	0.000	0.000	0.000	0.000	0.082	my5740_rel_lto.cy10a3_4g_gcp_c2s30
q1000.1
- q1000.1: range queries with 1000 insert/s per client
- Legend for results is here.
- Each entry lists the percentage of responses that fit in that bucket (slower than max time for previous bucket, faster than min time for next bucket).
Query response time histogram
256us	1ms	4ms	16ms	64ms	256ms	1s	4s	16s	gt	max	tag
15.274	27.193	16.872	29.294	11.095	0.270	0.001	0.000	0.000	0.000	0.517	my5740_rel_lto.cy10a_4g_gcp_c2s30
15.793	31.664	17.323	25.796	9.123	0.296	0.006	0.000	0.000	0.000	0.809	my5740_rel_lto.cy10a1_4g_gcp_c2s30
15.782	25.965	15.927	30.726	11.424	0.176	nonzero	0.000	0.000	0.000	0.381	my5740_rel_lto.cy10a2_4g_gcp_c2s30
15.702	25.892	15.630	30.973	11.629	0.174	nonzero	0.000	0.000	0.000	0.315	my5740_rel_lto.cy10a3_4g_gcp_c2s30
Insert response time histogram
256us	1ms	4ms	16ms	64ms	256ms	1s	4s	16s	gt	max	tag
0.000	0.000	12.047	41.812	44.100	2.000	0.041	0.000	0.000	0.000	0.824	my5740_rel_lto.cy10a_4g_gcp_c2s30
0.000	0.000	9.643	42.473	45.134	2.645	0.106	0.000	0.000	0.000	0.825	my5740_rel_lto.cy10a1_4g_gcp_c2s30
0.000	0.000	16.755	46.119	36.630	0.492	0.005	0.000	0.000	0.000	0.392	my5740_rel_lto.cy10a2_4g_gcp_c2s30
0.000	0.000	17.164	46.423	35.979	0.432	0.002	0.000	0.000	0.000	0.471	my5740_rel_lto.cy10a3_4g_gcp_c2s30
Delete response time histogram
256us	1ms	4ms	16ms	64ms	256ms	1s	4s	16s	gt	max	tag
0.000	0.000	12.687	42.377	43.383	1.523	0.029	0.000	0.000	0.000	0.549	my5740_rel_lto.cy10a_4g_gcp_c2s30
0.000	0.000	10.459	43.389	43.927	2.150	0.075	0.000	0.000	0.000	0.822	my5740_rel_lto.cy10a1_4g_gcp_c2s30
0.000	0.000	17.550	46.528	35.591	0.328	0.003	0.000	0.000	0.000	0.398	my5740_rel_lto.cy10a2_4g_gcp_c2s30
0.000	0.000	18.020	46.782	34.915	0.282	0.001	0.000	0.000	0.000	0.369	my5740_rel_lto.cy10a3_4g_gcp_c2s30