Introduction
This is a report for the insert benchmark with 3200M docs and 8 client(s). It is generated by scripts (bash, awk, sed) and Tufte might not be impressed. An overview of the insert benchmark is here and a short update is here. Below, by DBMS, I mean DBMS+version.config. An example is my8020.c10b40 where my means MySQL, 8020 is version 8.0.20 and c10b40 is the name for the configuration file.
The test server is a c2-standard-30 from GCP with 15 cores, hyperthreads disabled, 120G RAM, XFS + SW RAID 0 on 4 NVMe devices (1.5TB). The benchmark was run with 8 client and there were 1 or 3 connections per client (1 for queries or inserts without rate limits, 1+1 for rate limited inserts+deletes). There are 8 tables, client per table. It loads 400M rows per table without secondary indexes, creates secondary indexes, then inserts 10M rows per table with a delete per insert to avoid growing the table. It then does 3 read+write tests for 1800s each that do queries as fast as possible with 100, 500 and then 1000 inserts/second/client concurrent with the queries and 1000 deletes/second to avoid growing the table. The database is larger than memory.
The tested DBMS are:
- my5651_rel.cy10a_gcp_c2s30 - InnoDB and MySQL 5.6.51, rel build, cy10a_gcp_c2s30 config, compiled with CMAKE_BUILD_TYPE=Release -O2, base config
- my5651_rel.cy10a1_gcp_c2s30 - InnoDB and MySQL 5.6.51, rel build, cy10a_gcp_c2s30 config, compiled with CMAKE_BUILD_TYPE=Release -O2, adds innodb_use_native_aio=off
- my5651_rel.cy10a2_gcp_c2s30 - InnoDB and MySQL 5.6.51, rel build, cy10a_gcp_c2s30 config, compiled with CMAKE_BUILD_TYPE=Release -O2, adds innodb_io_capacity=20k, innodb_io_capacity_max=40k
- my5651_rel.cy10a4_gcp_c2s30 - InnoDB and MySQL 5.6.51, rel build, cy10a_gcp_c2s30 config, compiled with CMAKE_BUILD_TYPE=Release -O2, adds innodb_flush_method=fsync
Contents
- Summary
- l.i0: load without secondary indexes
- l.x: create secondary indexes
- l.i1: continue load after secondary indexes created
- q100.1: range queries with 100 insert/s per client
- q500.1: range queries with 500 insert/s per client
- q1000.1: range queries with 1000 insert/s per client
Summary
The numbers are inserts/s for l.i0 and l.i1, indexed docs (or rows) /s for l.x and queries/s for q*.2. The values are the average rate over the entire test for inserts (IPS) and queries (QPS). The range of values for IPS and QPS is split into 3 parts: bottom 25%, middle 50%, top 25%. Values in the bottom 25% have a red background, values in the top 25% have a green background and values in the middle have no color. A gray background is used for values that can be ignored because the DBMS did not sustain the target insert rate. Red backgrounds are not used when the minimum value is within 80% of the max value.
| dbms | l.i0 | l.x | l.i1 | q100.1 | q500.1 | q1000.1 |
|---|---|---|---|---|---|---|
| 3200m.my5651_rel.cy10a_gcp_c2s30 | 432199 | 446007 | 17252 | 3535 | 3877 | 3770 |
| 3200m.my5651_rel.cy10a1_gcp_c2s30 | 427065 | 439997 | 16996 | 3563 | 3898 | 3795 |
| 3200m.my5651_rel.cy10a2_gcp_c2s30 | 426439 | 435981 | 16320 | 3537 | 3789 | 3717 |
| 3200m.my5651_rel.cy10a4_gcp_c2s30 | 424459 | 447191 | 9324 | 1972 | 2493 | 2108 |
This table has relative throughput, throughput for the DBMS relative to the DBMS in the first line, using the absolute throughput from the previous table.
| dbms | l.i0 | l.x | l.i1 | q100.1 | q500.1 | q1000.1 |
|---|---|---|---|---|---|---|
| 3200m.my5651_rel.cy10a_gcp_c2s30 | 1.00 | 1.00 | 1.00 | 1.00 | 1.00 | 1.00 |
| 3200m.my5651_rel.cy10a1_gcp_c2s30 | 0.99 | 0.99 | 0.99 | 1.01 | 1.01 | 1.01 |
| 3200m.my5651_rel.cy10a2_gcp_c2s30 | 0.99 | 0.98 | 0.95 | 1.00 | 0.98 | 0.99 |
| 3200m.my5651_rel.cy10a4_gcp_c2s30 | 0.98 | 1.00 | 0.54 | 0.56 | 0.64 | 0.56 |
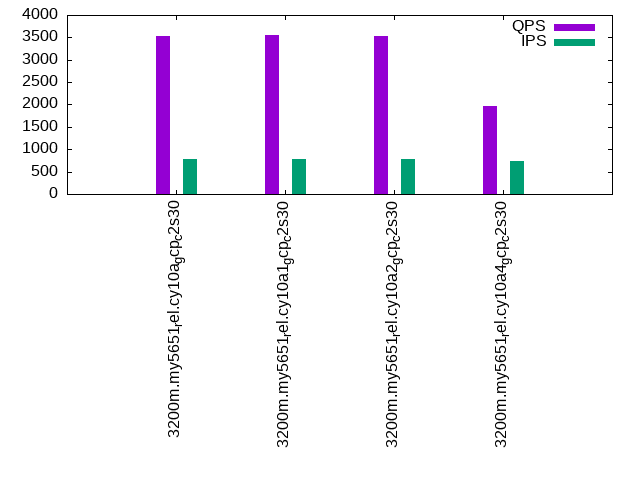
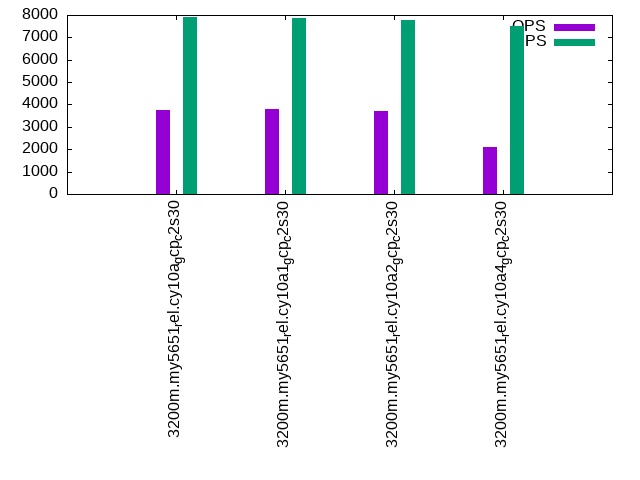
This lists the average rate of inserts/s for the tests that do inserts concurrent with queries. For such tests the query rate is listed in the table above. The read+write tests are setup so that the insert rate should match the target rate every second. Cells that are not at least 95% of the target have a red background to indicate a failure to satisfy the target.
| dbms | q100.1 | q500.1 | q1000.1 |
|---|---|---|---|
| my5651_rel.cy10a_gcp_c2s30 | 786 | 3928 | 7908 |
| my5651_rel.cy10a1_gcp_c2s30 | 786 | 3894 | 7856 |
| my5651_rel.cy10a2_gcp_c2s30 | 787 | 3852 | 7792 |
| my5651_rel.cy10a4_gcp_c2s30 | 737 | 3820 | 7520 |
| target | 800 | 4000 | 8000 |
l.i0
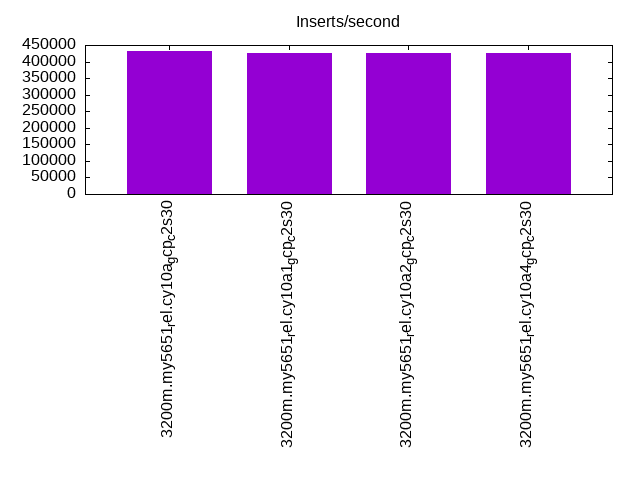
l.i0: load without secondary indexes. Graphs for performance per 1-second interval are here.
Average throughput:
Insert response time histogram: each cell has the percentage of responses that take <= the time in the header and max is the max response time in seconds. For the max column values in the top 25% of the range have a red background and in the bottom 25% of the range have a green background. The red background is not used when the min value is within 80% of the max value.
| dbms | 256us | 1ms | 4ms | 16ms | 64ms | 256ms | 1s | 4s | 16s | gt | max |
|---|---|---|---|---|---|---|---|---|---|---|---|
| my5651_rel.cy10a_gcp_c2s30 | 0.198 | 99.507 | 0.113 | 0.168 | 0.014 | nonzero | 0.268 | ||||
| my5651_rel.cy10a1_gcp_c2s30 | 0.218 | 99.483 | 0.115 | 0.169 | 0.015 | nonzero | 0.272 | ||||
| my5651_rel.cy10a2_gcp_c2s30 | 0.145 | 99.543 | 0.129 | 0.169 | 0.014 | nonzero | 0.271 | ||||
| my5651_rel.cy10a4_gcp_c2s30 | 0.236 | 99.350 | 0.229 | 0.171 | 0.015 | 0.239 |
Performance metrics for the DBMS listed above. Some are normalized by throughput, others are not. Legend for results is here.
ips	qps	rps	rmbps	wps	wmbps	rpq	rkbpq	wpi	wkbpi	csps	cpups	cspq	cpupq	dbgb1	dbgb2	rss	maxop	p50	p99	tag
432199	0	3400	13.3	2024.3	120.2	0.008	0.031	0.005	0.285	91575	43.6	0.212	15	210.5	339.0	85.7	0.268	54641	43553	3200m.my5651_rel.cy10a_gcp_c2s30
427065	0	3360	13.1	389.2	115.6	0.008	0.031	0.001	0.277	89317	43.6	0.209	15	210.5	339.0	85.7	0.272	53942	43553	3200m.my5651_rel.cy10a1_gcp_c2s30
426439	0	3354	13.1	2051.5	120.1	0.008	0.031	0.005	0.288	90462	43.5	0.212	15	210.5	339.0	85.7	0.271	53942	42854	3200m.my5651_rel.cy10a2_gcp_c2s30
424459	0	3338	13.0	429.4	111.6	0.008	0.031	0.001	0.269	92964	43.5	0.219	15	210.5	339.0	85.7	0.239	53642	43353	3200m.my5651_rel.cy10a4_gcp_c2s30
l.x
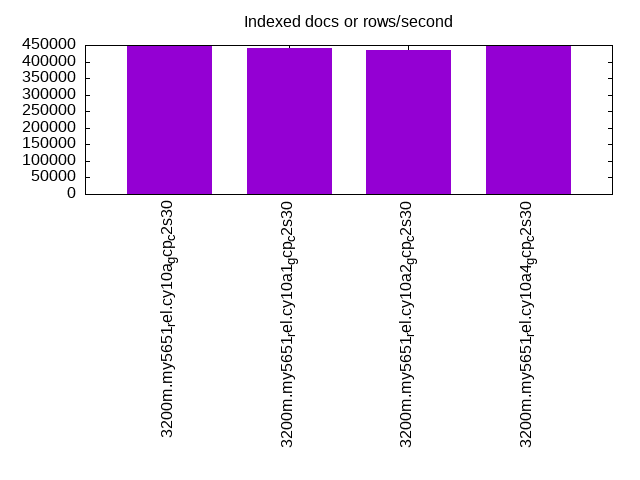
l.x: create secondary indexes.
Average throughput:
Performance metrics for the DBMS listed above. Some are normalized by throughput, others are not. Legend for results is here.
ips	qps	rps	rmbps	wps	wmbps	rpq	rkbpq	wpi	wkbpi	csps	cpups	cspq	cpupq	dbgb1	dbgb2	rss	maxop	p50	p99	tag
446007	0	2588	349.1	5443.1	556.9	0.006	0.802	0.012	1.279	17368	33.2	0.039	11	433.7	562.2	85.7	0.001	NA	NA	3200m.my5651_rel.cy10a_gcp_c2s30
439997	0	1179	352.5	2914.2	537.7	0.003	0.820	0.007	1.251	13983	33.7	0.032	11	433.7	562.2	85.7	0.002	NA	NA	3200m.my5651_rel.cy10a1_gcp_c2s30
435981	0	2549	350.2	5344.9	543.0	0.006	0.822	0.012	1.275	17523	33.7	0.040	12	433.7	562.2	85.7	0.002	NA	NA	3200m.my5651_rel.cy10a2_gcp_c2s30
447191	0	1114	349.9	2953.6	536.1	0.002	0.801	0.007	1.228	23197	34.3	0.052	12	433.7	562.2	85.7	0.002	NA	NA	3200m.my5651_rel.cy10a4_gcp_c2s30
l.i1
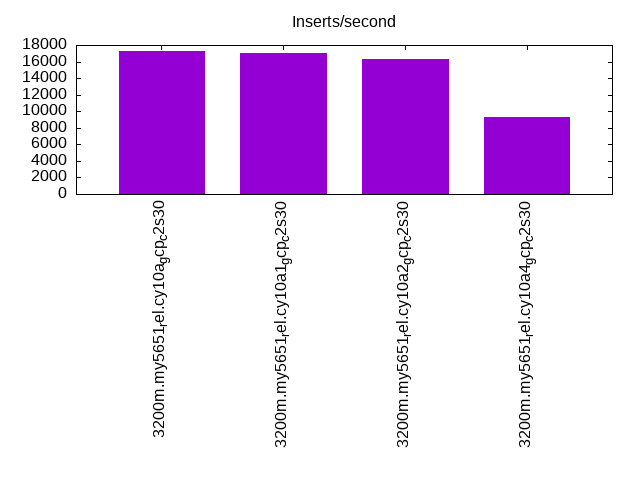
l.i1: continue load after secondary indexes created. Graphs for performance per 1-second interval are here.
Average throughput:
Insert response time histogram: each cell has the percentage of responses that take <= the time in the header and max is the max response time in seconds. For the max column values in the top 25% of the range have a red background and in the bottom 25% of the range have a green background. The red background is not used when the min value is within 80% of the max value.
| dbms | 256us | 1ms | 4ms | 16ms | 64ms | 256ms | 1s | 4s | 16s | gt | max |
|---|---|---|---|---|---|---|---|---|---|---|---|
| my5651_rel.cy10a_gcp_c2s30 | 1.341 | 68.493 | 21.074 | 9.048 | 0.043 | nonzero | nonzero | 4.018 | |||
| my5651_rel.cy10a1_gcp_c2s30 | 1.348 | 67.697 | 21.820 | 9.096 | 0.039 | nonzero | nonzero | 4.117 | |||
| my5651_rel.cy10a2_gcp_c2s30 | 1.892 | 64.564 | 24.131 | 9.354 | 0.060 | nonzero | 3.994 | ||||
| my5651_rel.cy10a4_gcp_c2s30 | 3.346 | 55.077 | 26.017 | 11.954 | 3.605 | nonzero | 3.006 |
Delete response time histogram: each cell has the percentage of responses that take <= the time in the header and max is the max response time in seconds. For the max column values in the top 25% of the range have a red background and in the bottom 25% of the range have a green background. The red background is not used when the min value is within 80% of the max value.
| dbms | 256us | 1ms | 4ms | 16ms | 64ms | 256ms | 1s | 4s | 16s | gt | max |
|---|---|---|---|---|---|---|---|---|---|---|---|
| my5651_rel.cy10a_gcp_c2s30 | 7.000 | 83.090 | 9.776 | 0.133 | nonzero | nonzero | 3.326 | ||||
| my5651_rel.cy10a1_gcp_c2s30 | 7.212 | 82.743 | 9.963 | 0.081 | nonzero | nonzero | 3.288 | ||||
| my5651_rel.cy10a2_gcp_c2s30 | 7.525 | 79.735 | 12.598 | 0.141 | nonzero | nonzero | 3.316 | ||||
| my5651_rel.cy10a4_gcp_c2s30 | 10.849 | 67.639 | 20.448 | 1.063 | 0.001 | nonzero | 2.228 |
Performance metrics for the DBMS listed above. Some are normalized by throughput, others are not. Legend for results is here.
ips	qps	rps	rmbps	wps	wmbps	rpq	rkbpq	wpi	wkbpi	csps	cpups	cspq	cpupq	dbgb1	dbgb2	rss	maxop	p50	p99	tag
17252	0	13882	210.3	26652.1	680.5	0.805	12.483	1.545	40.388	117947	27.5	6.836	239	654.1	820.1	85.7	4.018	1049	250	3200m.my5651_rel.cy10a_gcp_c2s30
16996	0	13332	209.3	24924.6	658.6	0.784	12.607	1.467	39.682	125478	27.8	7.383	245	654.1	820.6	85.7	4.117	999	250	3200m.my5651_rel.cy10a1_gcp_c2s30
16320	0	13544	205.4	28179.3	686.2	0.830	12.886	1.727	43.059	117582	26.5	7.205	244	654.2	818.5	85.7	3.994	949	200	3200m.my5651_rel.cy10a2_gcp_c2s30
9324	0	7270	204.8	12000.6	344.7	0.780	22.494	1.287	37.857	109329	18.3	11.726	294	654.1	822.1	85.7	3.006	350	100	3200m.my5651_rel.cy10a4_gcp_c2s30
q100.1
q100.1: range queries with 100 insert/s per client. Graphs for performance per 1-second interval are here.
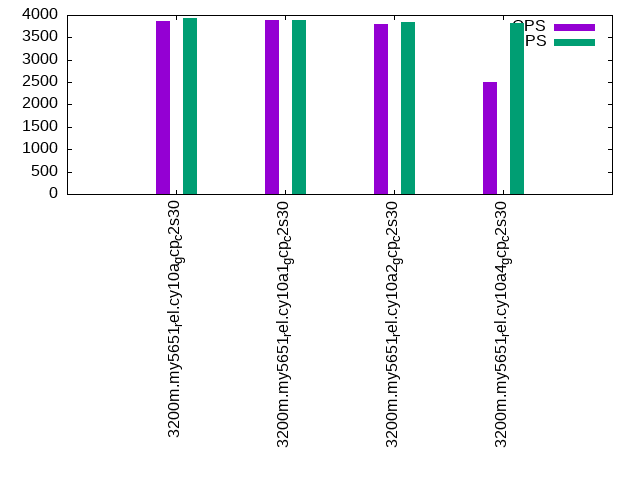
Average throughput:
Query response time histogram: each cell has the percentage of responses that take <= the time in the header and max is the max response time in seconds. For max values in the top 25% of the range have a red background and in the bottom 25% of the range have a green background. The red background is not used when the min value is within 80% of the max value.
| dbms | 256us | 1ms | 4ms | 16ms | 64ms | 256ms | 1s | 4s | 16s | gt | max |
|---|---|---|---|---|---|---|---|---|---|---|---|
| my5651_rel.cy10a_gcp_c2s30 | 38.643 | 3.211 | 38.750 | 19.308 | 0.089 | nonzero | 0.094 | ||||
| my5651_rel.cy10a1_gcp_c2s30 | 38.660 | 3.122 | 39.236 | 18.902 | 0.080 | nonzero | 0.076 | ||||
| my5651_rel.cy10a2_gcp_c2s30 | 38.505 | 3.261 | 38.753 | 19.397 | 0.084 | nonzero | 0.105 | ||||
| my5651_rel.cy10a4_gcp_c2s30 | 38.637 | 4.172 | 28.092 | 23.605 | 5.331 | 0.163 | 0.158 |
Insert response time histogram: each cell has the percentage of responses that take <= the time in the header and max is the max response time in seconds. For max values in the top 25% of the range have a red background and in the bottom 25% of the range have a green background. The red background is not used when the min value is within 80% of the max value.
| dbms | 256us | 1ms | 4ms | 16ms | 64ms | 256ms | 1s | 4s | 16s | gt | max |
|---|---|---|---|---|---|---|---|---|---|---|---|
| my5651_rel.cy10a_gcp_c2s30 | 16.010 | 75.840 | 8.146 | 0.003 | 0.097 | ||||||
| my5651_rel.cy10a1_gcp_c2s30 | 15.458 | 76.399 | 8.132 | 0.010 | 0.089 | ||||||
| my5651_rel.cy10a2_gcp_c2s30 | 22.302 | 70.740 | 6.944 | 0.014 | 0.109 | ||||||
| my5651_rel.cy10a4_gcp_c2s30 | 11.184 | 63.601 | 24.691 | 0.524 | 0.194 |
Delete response time histogram: each cell has the percentage of responses that take <= the time in the header and max is the max response time in seconds. For max values in the top 25% of the range have a red background and in the bottom 25% of the range have a green background. The red background is not used when the min value is within 80% of the max value.
| dbms | 256us | 1ms | 4ms | 16ms | 64ms | 256ms | 1s | 4s | 16s | gt | max |
|---|---|---|---|---|---|---|---|---|---|---|---|
| my5651_rel.cy10a_gcp_c2s30 | 17.552 | 74.639 | 7.806 | 0.003 | 0.133 | ||||||
| my5651_rel.cy10a1_gcp_c2s30 | 17.149 | 75.128 | 7.715 | 0.007 | 0.077 | ||||||
| my5651_rel.cy10a2_gcp_c2s30 | 24.101 | 69.031 | 6.854 | 0.014 | 0.105 | ||||||
| my5651_rel.cy10a4_gcp_c2s30 | 12.253 | 63.267 | 23.983 | 0.497 | 0.207 |
Performance metrics for the DBMS listed above. Some are normalized by throughput, others are not. Legend for results is here.
ips	qps	rps	rmbps	wps	wmbps	rpq	rkbpq	wpi	wkbpi	csps	cpups	cspq	cpupq	dbgb1	dbgb2	rss	maxop	p50	p99	tag
786	3535	24368	380.4	21033.0	432.7	6.893	110.188	26.760	563.733	112640	18.6	31.861	789	654.1	820.1	85.7	0.094	463	128	3200m.my5651_rel.cy10a_gcp_c2s30
786	3563	23966	384.5	20449.6	435.5	6.727	110.498	26.017	567.388	116041	19.0	32.569	800	654.1	820.6	85.7	0.076	464	128	3200m.my5651_rel.cy10a1_gcp_c2s30
787	3537	24816	387.4	21534.1	437.2	7.016	112.155	27.369	569.028	114629	19.1	32.407	810	654.2	818.5	85.7	0.105	464	112	3200m.my5651_rel.cy10a2_gcp_c2s30
737	1972	12066	746.4	10501.1	258.6	6.118	387.565	14.250	359.353	106776	16.8	54.140	1278	654.1	822.1	85.7	0.158	256	16	3200m.my5651_rel.cy10a4_gcp_c2s30
q500.1
q500.1: range queries with 500 insert/s per client. Graphs for performance per 1-second interval are here.
Average throughput:
Query response time histogram: each cell has the percentage of responses that take <= the time in the header and max is the max response time in seconds. For max values in the top 25% of the range have a red background and in the bottom 25% of the range have a green background. The red background is not used when the min value is within 80% of the max value.
| dbms | 256us | 1ms | 4ms | 16ms | 64ms | 256ms | 1s | 4s | 16s | gt | max |
|---|---|---|---|---|---|---|---|---|---|---|---|
| my5651_rel.cy10a_gcp_c2s30 | 39.032 | 3.538 | 42.024 | 15.351 | 0.048 | 0.008 | 0.234 | ||||
| my5651_rel.cy10a1_gcp_c2s30 | 39.134 | 3.431 | 42.931 | 14.414 | 0.073 | 0.017 | nonzero | 0.440 | |||
| my5651_rel.cy10a2_gcp_c2s30 | 38.857 | 3.664 | 41.757 | 15.597 | 0.098 | 0.027 | nonzero | 0.428 | |||
| my5651_rel.cy10a4_gcp_c2s30 | 39.986 | 4.702 | 31.383 | 20.543 | 3.350 | 0.036 | 0.181 |
Insert response time histogram: each cell has the percentage of responses that take <= the time in the header and max is the max response time in seconds. For max values in the top 25% of the range have a red background and in the bottom 25% of the range have a green background. The red background is not used when the min value is within 80% of the max value.
| dbms | 256us | 1ms | 4ms | 16ms | 64ms | 256ms | 1s | 4s | 16s | gt | max |
|---|---|---|---|---|---|---|---|---|---|---|---|
| my5651_rel.cy10a_gcp_c2s30 | 53.603 | 44.378 | 2.002 | 0.014 | 0.003 | 0.444 | |||||
| my5651_rel.cy10a1_gcp_c2s30 | 51.465 | 46.302 | 2.115 | 0.084 | 0.034 | 0.811 | |||||
| my5651_rel.cy10a2_gcp_c2s30 | 57.053 | 40.871 | 1.949 | 0.080 | 0.047 | 0.697 | |||||
| my5651_rel.cy10a4_gcp_c2s30 | 41.928 | 51.254 | 6.701 | 0.116 | 0.199 |
Delete response time histogram: each cell has the percentage of responses that take <= the time in the header and max is the max response time in seconds. For max values in the top 25% of the range have a red background and in the bottom 25% of the range have a green background. The red background is not used when the min value is within 80% of the max value.
| dbms | 256us | 1ms | 4ms | 16ms | 64ms | 256ms | 1s | 4s | 16s | gt | max |
|---|---|---|---|---|---|---|---|---|---|---|---|
| my5651_rel.cy10a_gcp_c2s30 | 58.276 | 39.947 | 1.762 | 0.013 | 0.003 | 0.370 | |||||
| my5651_rel.cy10a1_gcp_c2s30 | 57.196 | 40.863 | 1.818 | 0.097 | 0.026 | 0.779 | |||||
| my5651_rel.cy10a2_gcp_c2s30 | 61.089 | 37.057 | 1.726 | 0.082 | 0.046 | 0.720 | |||||
| my5651_rel.cy10a4_gcp_c2s30 | 45.253 | 48.409 | 6.217 | 0.120 | 0.247 |
Performance metrics for the DBMS listed above. Some are normalized by throughput, others are not. Legend for results is here.
ips	qps	rps	rmbps	wps	wmbps	rpq	rkbpq	wpi	wkbpi	csps	cpups	cspq	cpupq	dbgb1	dbgb2	rss	maxop	p50	p99	tag
3928	3877	25307	393.9	19145.6	388.4	6.527	104.031	4.874	101.244	112313	20.5	28.968	793	654.1	820.1	85.7	0.234	495	112	3200m.my5651_rel.cy10a_gcp_c2s30
3894	3898	25078	396.7	18806.6	390.7	6.434	104.220	4.830	102.748	115378	20.8	29.601	800	654.1	820.6	85.7	0.440	495	64	3200m.my5651_rel.cy10a1_gcp_c2s30
3852	3789	25177	391.9	19784.8	393.5	6.645	105.913	5.136	104.596	113011	20.6	29.826	816	654.2	818.5	85.7	0.428	495	32	3200m.my5651_rel.cy10a2_gcp_c2s30
3820	2493	14030	826.0	10237.7	242.7	5.627	339.231	2.680	65.067	111008	19.7	44.521	1185	654.2	822.4	85.7	0.181	320	48	3200m.my5651_rel.cy10a4_gcp_c2s30
q1000.1
q1000.1: range queries with 1000 insert/s per client. Graphs for performance per 1-second interval are here.
Average throughput:
Query response time histogram: each cell has the percentage of responses that take <= the time in the header and max is the max response time in seconds. For max values in the top 25% of the range have a red background and in the bottom 25% of the range have a green background. The red background is not used when the min value is within 80% of the max value.
| dbms | 256us | 1ms | 4ms | 16ms | 64ms | 256ms | 1s | 4s | 16s | gt | max |
|---|---|---|---|---|---|---|---|---|---|---|---|
| my5651_rel.cy10a_gcp_c2s30 | 38.836 | 2.946 | 41.652 | 16.535 | 0.031 | nonzero | 0.084 | ||||
| my5651_rel.cy10a1_gcp_c2s30 | 38.839 | 2.890 | 42.372 | 15.832 | 0.059 | 0.007 | 0.210 | ||||
| my5651_rel.cy10a2_gcp_c2s30 | 38.552 | 3.184 | 41.605 | 16.560 | 0.083 | 0.016 | nonzero | 0.474 | |||
| my5651_rel.cy10a4_gcp_c2s30 | 39.161 | 4.426 | 29.538 | 21.621 | 5.195 | 0.059 | nonzero | 0.282 |
Insert response time histogram: each cell has the percentage of responses that take <= the time in the header and max is the max response time in seconds. For max values in the top 25% of the range have a red background and in the bottom 25% of the range have a green background. The red background is not used when the min value is within 80% of the max value.
| dbms | 256us | 1ms | 4ms | 16ms | 64ms | 256ms | 1s | 4s | 16s | gt | max |
|---|---|---|---|---|---|---|---|---|---|---|---|
| my5651_rel.cy10a_gcp_c2s30 | 58.648 | 39.913 | 1.439 | 0.064 | |||||||
| my5651_rel.cy10a1_gcp_c2s30 | 57.854 | 40.594 | 1.523 | 0.028 | 0.002 | 0.559 | |||||
| my5651_rel.cy10a2_gcp_c2s30 | 48.048 | 49.671 | 2.274 | 0.003 | 0.004 | 0.814 | |||||
| my5651_rel.cy10a4_gcp_c2s30 | 34.883 | 55.246 | 9.620 | 0.251 | nonzero | 0.271 |
Delete response time histogram: each cell has the percentage of responses that take <= the time in the header and max is the max response time in seconds. For max values in the top 25% of the range have a red background and in the bottom 25% of the range have a green background. The red background is not used when the min value is within 80% of the max value.
| dbms | 256us | 1ms | 4ms | 16ms | 64ms | 256ms | 1s | 4s | 16s | gt | max |
|---|---|---|---|---|---|---|---|---|---|---|---|
| my5651_rel.cy10a_gcp_c2s30 | 63.200 | 35.496 | 1.302 | 0.002 | 0.090 | ||||||
| my5651_rel.cy10a1_gcp_c2s30 | 63.130 | 35.509 | 1.332 | 0.028 | 0.002 | 0.530 | |||||
| my5651_rel.cy10a2_gcp_c2s30 | 53.598 | 44.428 | 1.963 | 0.007 | 0.003 | 0.994 | |||||
| my5651_rel.cy10a4_gcp_c2s30 | 37.584 | 53.114 | 9.066 | 0.237 | nonzero | 0.295 |
Performance metrics for the DBMS listed above. Some are normalized by throughput, others are not. Legend for results is here.
ips	qps	rps	rmbps	wps	wmbps	rpq	rkbpq	wpi	wkbpi	csps	cpups	cspq	cpupq	dbgb1	dbgb2	rss	maxop	p50	p99	tag
7908	3770	24589	381.1	21951.6	443.9	6.522	103.520	2.776	57.481	118302	22.2	31.380	883	654.6	821.2	85.7	0.084	479	368	3200m.my5651_rel.cy10a_gcp_c2s30
7856	3795	24334	384.0	21631.2	446.5	6.412	103.593	2.753	58.199	121592	22.5	32.037	889	654.5	821.7	85.7	0.210	479	112	3200m.my5651_rel.cy10a1_gcp_c2s30
7792	3717	24550	380.6	22482.5	451.2	6.605	104.866	2.885	59.287	120583	22.9	32.444	924	654.7	819.6	85.7	0.474	479	48	3200m.my5651_rel.cy10a2_gcp_c2s30
7520	2108	12124	714.6	11060.2	262.7	5.750	347.032	1.471	35.771	113998	21.1	54.066	1501	655.1	824.2	85.7	0.282	272	48	3200m.my5651_rel.cy10a4_gcp_c2s30
l.i0
l.i0: load without secondary indexes
Performance metrics for all DBMS, not just the ones listed above. Some are normalized by throughput, others are not. Legend for results is here.
ips	qps	rps	rmbps	wps	wmbps	rpq	rkbpq	wpi	wkbpi	csps	cpups	cspq	cpupq	dbgb1	dbgb2	rss	maxop	p50	p99	tag
432199	0	3400	13.3	2024.3	120.2	0.008	0.031	0.005	0.285	91575	43.6	0.212	15	210.5	339.0	85.7	0.268	54641	43553	3200m.my5651_rel.cy10a_gcp_c2s30
427065	0	3360	13.1	389.2	115.6	0.008	0.031	0.001	0.277	89317	43.6	0.209	15	210.5	339.0	85.7	0.272	53942	43553	3200m.my5651_rel.cy10a1_gcp_c2s30
426439	0	3354	13.1	2051.5	120.1	0.008	0.031	0.005	0.288	90462	43.5	0.212	15	210.5	339.0	85.7	0.271	53942	42854	3200m.my5651_rel.cy10a2_gcp_c2s30
424459	0	3338	13.0	429.4	111.6	0.008	0.031	0.001	0.269	92964	43.5	0.219	15	210.5	339.0	85.7	0.239	53642	43353	3200m.my5651_rel.cy10a4_gcp_c2s30
l.x
l.x: create secondary indexes
Performance metrics for all DBMS, not just the ones listed above. Some are normalized by throughput, others are not. Legend for results is here.
ips	qps	rps	rmbps	wps	wmbps	rpq	rkbpq	wpi	wkbpi	csps	cpups	cspq	cpupq	dbgb1	dbgb2	rss	maxop	p50	p99	tag
446007	0	2588	349.1	5443.1	556.9	0.006	0.802	0.012	1.279	17368	33.2	0.039	11	433.7	562.2	85.7	0.001	NA	NA	3200m.my5651_rel.cy10a_gcp_c2s30
439997	0	1179	352.5	2914.2	537.7	0.003	0.820	0.007	1.251	13983	33.7	0.032	11	433.7	562.2	85.7	0.002	NA	NA	3200m.my5651_rel.cy10a1_gcp_c2s30
435981	0	2549	350.2	5344.9	543.0	0.006	0.822	0.012	1.275	17523	33.7	0.040	12	433.7	562.2	85.7	0.002	NA	NA	3200m.my5651_rel.cy10a2_gcp_c2s30
447191	0	1114	349.9	2953.6	536.1	0.002	0.801	0.007	1.228	23197	34.3	0.052	12	433.7	562.2	85.7	0.002	NA	NA	3200m.my5651_rel.cy10a4_gcp_c2s30
l.i1
l.i1: continue load after secondary indexes created
Performance metrics for all DBMS, not just the ones listed above. Some are normalized by throughput, others are not. Legend for results is here.
ips	qps	rps	rmbps	wps	wmbps	rpq	rkbpq	wpi	wkbpi	csps	cpups	cspq	cpupq	dbgb1	dbgb2	rss	maxop	p50	p99	tag
17252	0	13882	210.3	26652.1	680.5	0.805	12.483	1.545	40.388	117947	27.5	6.836	239	654.1	820.1	85.7	4.018	1049	250	3200m.my5651_rel.cy10a_gcp_c2s30
16996	0	13332	209.3	24924.6	658.6	0.784	12.607	1.467	39.682	125478	27.8	7.383	245	654.1	820.6	85.7	4.117	999	250	3200m.my5651_rel.cy10a1_gcp_c2s30
16320	0	13544	205.4	28179.3	686.2	0.830	12.886	1.727	43.059	117582	26.5	7.205	244	654.2	818.5	85.7	3.994	949	200	3200m.my5651_rel.cy10a2_gcp_c2s30
9324	0	7270	204.8	12000.6	344.7	0.780	22.494	1.287	37.857	109329	18.3	11.726	294	654.1	822.1	85.7	3.006	350	100	3200m.my5651_rel.cy10a4_gcp_c2s30
q100.1
q100.1: range queries with 100 insert/s per client
Performance metrics for all DBMS, not just the ones listed above. Some are normalized by throughput, others are not. Legend for results is here.
ips	qps	rps	rmbps	wps	wmbps	rpq	rkbpq	wpi	wkbpi	csps	cpups	cspq	cpupq	dbgb1	dbgb2	rss	maxop	p50	p99	tag
786	3535	24368	380.4	21033.0	432.7	6.893	110.188	26.760	563.733	112640	18.6	31.861	789	654.1	820.1	85.7	0.094	463	128	3200m.my5651_rel.cy10a_gcp_c2s30
786	3563	23966	384.5	20449.6	435.5	6.727	110.498	26.017	567.388	116041	19.0	32.569	800	654.1	820.6	85.7	0.076	464	128	3200m.my5651_rel.cy10a1_gcp_c2s30
787	3537	24816	387.4	21534.1	437.2	7.016	112.155	27.369	569.028	114629	19.1	32.407	810	654.2	818.5	85.7	0.105	464	112	3200m.my5651_rel.cy10a2_gcp_c2s30
737	1972	12066	746.4	10501.1	258.6	6.118	387.565	14.250	359.353	106776	16.8	54.140	1278	654.1	822.1	85.7	0.158	256	16	3200m.my5651_rel.cy10a4_gcp_c2s30
q500.1
q500.1: range queries with 500 insert/s per client
Performance metrics for all DBMS, not just the ones listed above. Some are normalized by throughput, others are not. Legend for results is here.
ips	qps	rps	rmbps	wps	wmbps	rpq	rkbpq	wpi	wkbpi	csps	cpups	cspq	cpupq	dbgb1	dbgb2	rss	maxop	p50	p99	tag
3928	3877	25307	393.9	19145.6	388.4	6.527	104.031	4.874	101.244	112313	20.5	28.968	793	654.1	820.1	85.7	0.234	495	112	3200m.my5651_rel.cy10a_gcp_c2s30
3894	3898	25078	396.7	18806.6	390.7	6.434	104.220	4.830	102.748	115378	20.8	29.601	800	654.1	820.6	85.7	0.440	495	64	3200m.my5651_rel.cy10a1_gcp_c2s30
3852	3789	25177	391.9	19784.8	393.5	6.645	105.913	5.136	104.596	113011	20.6	29.826	816	654.2	818.5	85.7	0.428	495	32	3200m.my5651_rel.cy10a2_gcp_c2s30
3820	2493	14030	826.0	10237.7	242.7	5.627	339.231	2.680	65.067	111008	19.7	44.521	1185	654.2	822.4	85.7	0.181	320	48	3200m.my5651_rel.cy10a4_gcp_c2s30
q1000.1
q1000.1: range queries with 1000 insert/s per client
Performance metrics for all DBMS, not just the ones listed above. Some are normalized by throughput, others are not. Legend for results is here.
ips	qps	rps	rmbps	wps	wmbps	rpq	rkbpq	wpi	wkbpi	csps	cpups	cspq	cpupq	dbgb1	dbgb2	rss	maxop	p50	p99	tag
7908	3770	24589	381.1	21951.6	443.9	6.522	103.520	2.776	57.481	118302	22.2	31.380	883	654.6	821.2	85.7	0.084	479	368	3200m.my5651_rel.cy10a_gcp_c2s30
7856	3795	24334	384.0	21631.2	446.5	6.412	103.593	2.753	58.199	121592	22.5	32.037	889	654.5	821.7	85.7	0.210	479	112	3200m.my5651_rel.cy10a1_gcp_c2s30
7792	3717	24550	380.6	22482.5	451.2	6.605	104.866	2.885	59.287	120583	22.9	32.444	924	654.7	819.6	85.7	0.474	479	48	3200m.my5651_rel.cy10a2_gcp_c2s30
7520	2108	12124	714.6	11060.2	262.7	5.750	347.032	1.471	35.771	113998	21.1	54.066	1501	655.1	824.2	85.7	0.282	272	48	3200m.my5651_rel.cy10a4_gcp_c2s30
l.i0
- l.i0: load without secondary indexes
- Legend for results is here.
- Each entry lists the percentage of responses that fit in that bucket (slower than max time for previous bucket, faster than min time for next bucket).
Insert response time histogram
256us	1ms	4ms	16ms	64ms	256ms	1s	4s	16s	gt	max	tag
0.000	0.198	99.507	0.113	0.168	0.014	nonzero	0.000	0.000	0.000	0.268	my5651_rel.cy10a_gcp_c2s30
0.000	0.218	99.483	0.115	0.169	0.015	nonzero	0.000	0.000	0.000	0.272	my5651_rel.cy10a1_gcp_c2s30
0.000	0.145	99.543	0.129	0.169	0.014	nonzero	0.000	0.000	0.000	0.271	my5651_rel.cy10a2_gcp_c2s30
0.000	0.236	99.350	0.229	0.171	0.015	0.000	0.000	0.000	0.000	0.239	my5651_rel.cy10a4_gcp_c2s30
l.x
- l.x: create secondary indexes
- Legend for results is here.
- Each entry lists the percentage of responses that fit in that bucket (slower than max time for previous bucket, faster than min time for next bucket).
TODO - determine whether there is data for create index response time
l.i1
- l.i1: continue load after secondary indexes created
- Legend for results is here.
- Each entry lists the percentage of responses that fit in that bucket (slower than max time for previous bucket, faster than min time for next bucket).
Insert response time histogram
256us	1ms	4ms	16ms	64ms	256ms	1s	4s	16s	gt	max	tag
0.000	0.000	1.341	68.493	21.074	9.048	0.043	nonzero	nonzero	0.000	4.018	my5651_rel.cy10a_gcp_c2s30
0.000	0.000	1.348	67.697	21.820	9.096	0.039	nonzero	nonzero	0.000	4.117	my5651_rel.cy10a1_gcp_c2s30
0.000	0.000	1.892	64.564	24.131	9.354	0.060	nonzero	0.000	0.000	3.994	my5651_rel.cy10a2_gcp_c2s30
0.000	0.000	3.346	55.077	26.017	11.954	3.605	nonzero	0.000	0.000	3.006	my5651_rel.cy10a4_gcp_c2s30
Delete response time histogram
256us	1ms	4ms	16ms	64ms	256ms	1s	4s	16s	gt	max	tag
0.000	0.000	7.000	83.090	9.776	0.133	nonzero	nonzero	0.000	0.000	3.326	my5651_rel.cy10a_gcp_c2s30
0.000	0.000	7.212	82.743	9.963	0.081	nonzero	nonzero	0.000	0.000	3.288	my5651_rel.cy10a1_gcp_c2s30
0.000	0.000	7.525	79.735	12.598	0.141	nonzero	nonzero	0.000	0.000	3.316	my5651_rel.cy10a2_gcp_c2s30
0.000	0.000	10.849	67.639	20.448	1.063	0.001	nonzero	0.000	0.000	2.228	my5651_rel.cy10a4_gcp_c2s30
q100.1
- q100.1: range queries with 100 insert/s per client
- Legend for results is here.
- Each entry lists the percentage of responses that fit in that bucket (slower than max time for previous bucket, faster than min time for next bucket).
Query response time histogram
256us	1ms	4ms	16ms	64ms	256ms	1s	4s	16s	gt	max	tag
38.643	3.211	38.750	19.308	0.089	nonzero	0.000	0.000	0.000	0.000	0.094	my5651_rel.cy10a_gcp_c2s30
38.660	3.122	39.236	18.902	0.080	nonzero	0.000	0.000	0.000	0.000	0.076	my5651_rel.cy10a1_gcp_c2s30
38.505	3.261	38.753	19.397	0.084	nonzero	0.000	0.000	0.000	0.000	0.105	my5651_rel.cy10a2_gcp_c2s30
38.637	4.172	28.092	23.605	5.331	0.163	0.000	0.000	0.000	0.000	0.158	my5651_rel.cy10a4_gcp_c2s30
Insert response time histogram
256us	1ms	4ms	16ms	64ms	256ms	1s	4s	16s	gt	max	tag
0.000	0.000	16.010	75.840	8.146	0.003	0.000	0.000	0.000	0.000	0.097	my5651_rel.cy10a_gcp_c2s30
0.000	0.000	15.458	76.399	8.132	0.010	0.000	0.000	0.000	0.000	0.089	my5651_rel.cy10a1_gcp_c2s30
0.000	0.000	22.302	70.740	6.944	0.014	0.000	0.000	0.000	0.000	0.109	my5651_rel.cy10a2_gcp_c2s30
0.000	0.000	11.184	63.601	24.691	0.524	0.000	0.000	0.000	0.000	0.194	my5651_rel.cy10a4_gcp_c2s30
Delete response time histogram
256us	1ms	4ms	16ms	64ms	256ms	1s	4s	16s	gt	max	tag
0.000	0.000	17.552	74.639	7.806	0.003	0.000	0.000	0.000	0.000	0.133	my5651_rel.cy10a_gcp_c2s30
0.000	0.000	17.149	75.128	7.715	0.007	0.000	0.000	0.000	0.000	0.077	my5651_rel.cy10a1_gcp_c2s30
0.000	0.000	24.101	69.031	6.854	0.014	0.000	0.000	0.000	0.000	0.105	my5651_rel.cy10a2_gcp_c2s30
0.000	0.000	12.253	63.267	23.983	0.497	0.000	0.000	0.000	0.000	0.207	my5651_rel.cy10a4_gcp_c2s30
q500.1
- q500.1: range queries with 500 insert/s per client
- Legend for results is here.
- Each entry lists the percentage of responses that fit in that bucket (slower than max time for previous bucket, faster than min time for next bucket).
Query response time histogram
256us	1ms	4ms	16ms	64ms	256ms	1s	4s	16s	gt	max	tag
39.032	3.538	42.024	15.351	0.048	0.008	0.000	0.000	0.000	0.000	0.234	my5651_rel.cy10a_gcp_c2s30
39.134	3.431	42.931	14.414	0.073	0.017	nonzero	0.000	0.000	0.000	0.440	my5651_rel.cy10a1_gcp_c2s30
38.857	3.664	41.757	15.597	0.098	0.027	nonzero	0.000	0.000	0.000	0.428	my5651_rel.cy10a2_gcp_c2s30
39.986	4.702	31.383	20.543	3.350	0.036	0.000	0.000	0.000	0.000	0.181	my5651_rel.cy10a4_gcp_c2s30
Insert response time histogram
256us	1ms	4ms	16ms	64ms	256ms	1s	4s	16s	gt	max	tag
0.000	0.000	53.603	44.378	2.002	0.014	0.003	0.000	0.000	0.000	0.444	my5651_rel.cy10a_gcp_c2s30
0.000	0.000	51.465	46.302	2.115	0.084	0.034	0.000	0.000	0.000	0.811	my5651_rel.cy10a1_gcp_c2s30
0.000	0.000	57.053	40.871	1.949	0.080	0.047	0.000	0.000	0.000	0.697	my5651_rel.cy10a2_gcp_c2s30
0.000	0.000	41.928	51.254	6.701	0.116	0.000	0.000	0.000	0.000	0.199	my5651_rel.cy10a4_gcp_c2s30
Delete response time histogram
256us	1ms	4ms	16ms	64ms	256ms	1s	4s	16s	gt	max	tag
0.000	0.000	58.276	39.947	1.762	0.013	0.003	0.000	0.000	0.000	0.370	my5651_rel.cy10a_gcp_c2s30
0.000	0.000	57.196	40.863	1.818	0.097	0.026	0.000	0.000	0.000	0.779	my5651_rel.cy10a1_gcp_c2s30
0.000	0.000	61.089	37.057	1.726	0.082	0.046	0.000	0.000	0.000	0.720	my5651_rel.cy10a2_gcp_c2s30
0.000	0.000	45.253	48.409	6.217	0.120	0.000	0.000	0.000	0.000	0.247	my5651_rel.cy10a4_gcp_c2s30
q1000.1
- q1000.1: range queries with 1000 insert/s per client
- Legend for results is here.
- Each entry lists the percentage of responses that fit in that bucket (slower than max time for previous bucket, faster than min time for next bucket).
Query response time histogram
256us	1ms	4ms	16ms	64ms	256ms	1s	4s	16s	gt	max	tag
38.836	2.946	41.652	16.535	0.031	nonzero	0.000	0.000	0.000	0.000	0.084	my5651_rel.cy10a_gcp_c2s30
38.839	2.890	42.372	15.832	0.059	0.007	0.000	0.000	0.000	0.000	0.210	my5651_rel.cy10a1_gcp_c2s30
38.552	3.184	41.605	16.560	0.083	0.016	nonzero	0.000	0.000	0.000	0.474	my5651_rel.cy10a2_gcp_c2s30
39.161	4.426	29.538	21.621	5.195	0.059	nonzero	0.000	0.000	0.000	0.282	my5651_rel.cy10a4_gcp_c2s30
Insert response time histogram
256us	1ms	4ms	16ms	64ms	256ms	1s	4s	16s	gt	max	tag
0.000	0.000	58.648	39.913	1.439	0.000	0.000	0.000	0.000	0.000	0.064	my5651_rel.cy10a_gcp_c2s30
0.000	0.000	57.854	40.594	1.523	0.028	0.002	0.000	0.000	0.000	0.559	my5651_rel.cy10a1_gcp_c2s30
0.000	0.000	48.048	49.671	2.274	0.003	0.004	0.000	0.000	0.000	0.814	my5651_rel.cy10a2_gcp_c2s30
0.000	0.000	34.883	55.246	9.620	0.251	nonzero	0.000	0.000	0.000	0.271	my5651_rel.cy10a4_gcp_c2s30
Delete response time histogram
256us	1ms	4ms	16ms	64ms	256ms	1s	4s	16s	gt	max	tag
0.000	0.000	63.200	35.496	1.302	0.002	0.000	0.000	0.000	0.000	0.090	my5651_rel.cy10a_gcp_c2s30
0.000	0.000	63.130	35.509	1.332	0.028	0.002	0.000	0.000	0.000	0.530	my5651_rel.cy10a1_gcp_c2s30
0.000	0.000	53.598	44.428	1.963	0.007	0.003	0.000	0.000	0.000	0.994	my5651_rel.cy10a2_gcp_c2s30
0.000	0.000	37.584	53.114	9.066	0.237	nonzero	0.000	0.000	0.000	0.295	my5651_rel.cy10a4_gcp_c2s30