Introduction
This is a report for the insert benchmark with 160M docs and 8 client(s). It is generated by scripts (bash, awk, sed) and Tufte might not be impressed. An overview of the insert benchmark is here and a short update is here. Below, by DBMS, I mean DBMS+version.config. An example is my8020.c10b40 where my means MySQL, 8020 is version 8.0.20 and c10b40 is the name for the configuration file.
The test server is a c2-standard-30 from GCP with 15 cores, hyperthreads disabled, 120G RAM, XFS + SW RAID 0 on 4 NVMe devices (1.5TB). The benchmark was run with 8 client and there were 1 or 3 connections per client (1 for queries or inserts without rate limits, 1+1 for rate limited inserts+deletes). There are 8 tables, client per table. It loads 160M rows without secondary indexes, creates secondary indexes, then inserts 80M rows with a delete per insert to avoid growing the table. It then does 3 read+write tests for 1800s each that do queries as fast as possible with 100, 500 and then 1000 inserts/second/client concurrent with the queries and 1000 deletes/second to avoid growing the table. The database is cached by InnoDB and the only IO is for writes.
The tested DBMS are:
- my5651_rel.cy10a_gcp_c2s30 - InnoDB and MySQL 5.6.51, rel build, cy10a_gcp_c2s30 config, compiled with CMAKE_BUILD_TYPE=Release -O2, base config
- my5651_rel.cy10a1_gcp_c2s30 - InnoDB and MySQL 5.6.51, rel build, cy10a_gcp_c2s30 config, compiled with CMAKE_BUILD_TYPE=Release -O2, adds innodb_use_native_aio=off
- my5651_rel.cy10a2_gcp_c2s30 - InnoDB and MySQL 5.6.51, rel build, cy10a_gcp_c2s30 config, compiled with CMAKE_BUILD_TYPE=Release -O2, adds innodb_io_capacity=20k, innodb_io_capacity_max=40k
- my5651_rel.cy10a4_gcp_c2s30 - InnoDB and MySQL 5.6.51, rel build, cy10a_gcp_c2s30 config, compiled with CMAKE_BUILD_TYPE=Release -O2, adds innodb_flush_method=fsync
Contents
- Summary
- l.i0: load without secondary indexes
- l.x: create secondary indexes
- l.i1: continue load after secondary indexes created
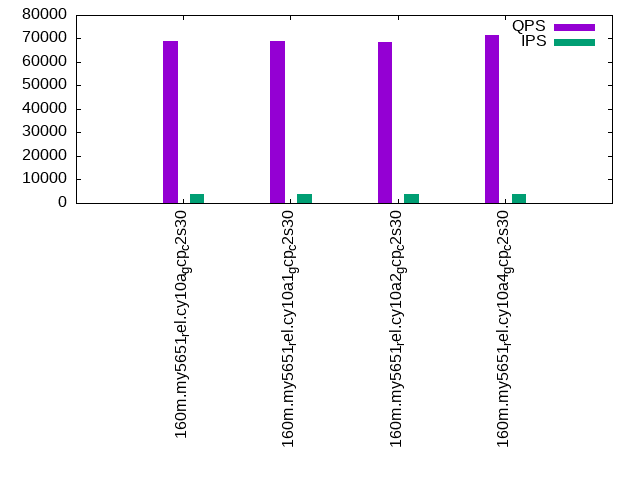
- q100.1: range queries with 100 insert/s per client
- q500.1: range queries with 500 insert/s per client
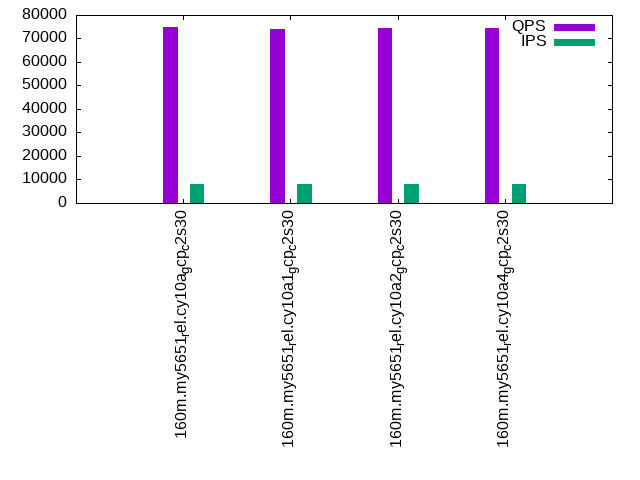
- q1000.1: range queries with 1000 insert/s per client
Summary
The numbers are inserts/s for l.i0 and l.i1, indexed docs (or rows) /s for l.x and queries/s for q*.2. The values are the average rate over the entire test for inserts (IPS) and queries (QPS). The range of values for IPS and QPS is split into 3 parts: bottom 25%, middle 50%, top 25%. Values in the bottom 25% have a red background, values in the top 25% have a green background and values in the middle have no color. A gray background is used for values that can be ignored because the DBMS did not sustain the target insert rate. Red backgrounds are not used when the minimum value is within 80% of the max value.
| dbms | l.i0 | l.x | l.i1 | q100.1 | q500.1 | q1000.1 |
|---|---|---|---|---|---|---|
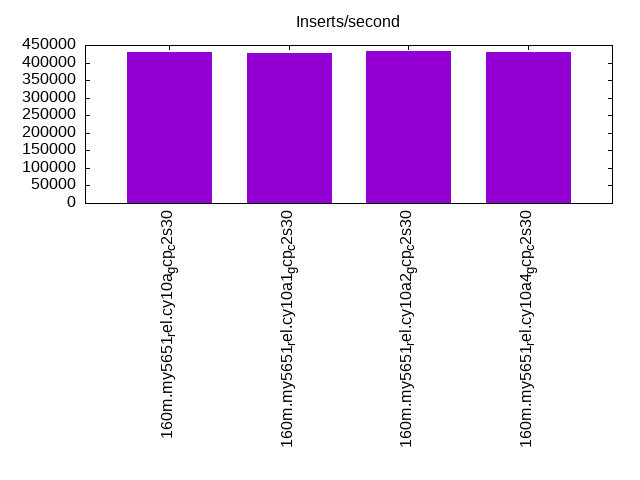
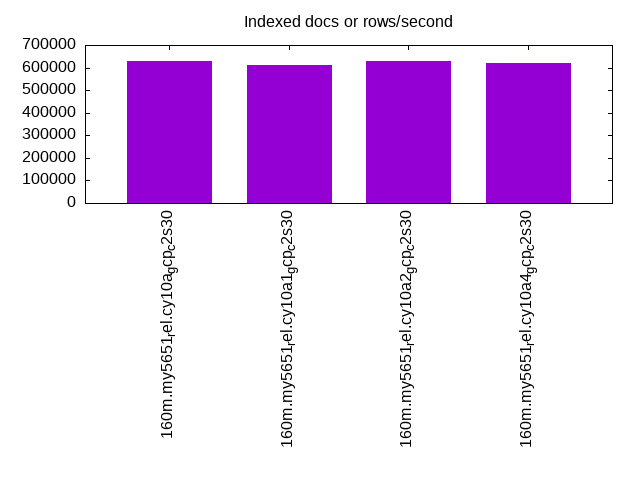
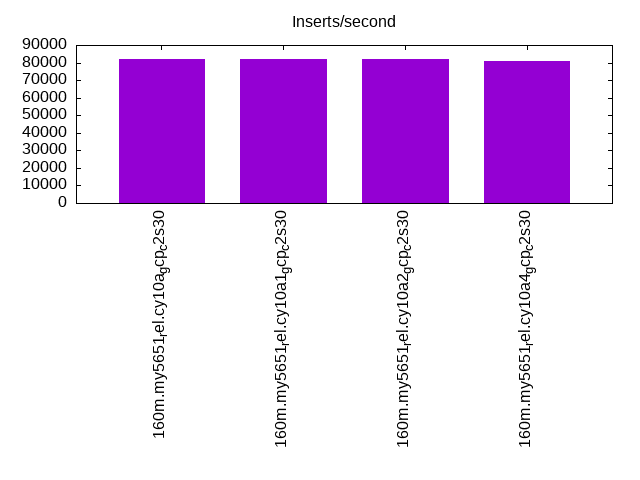
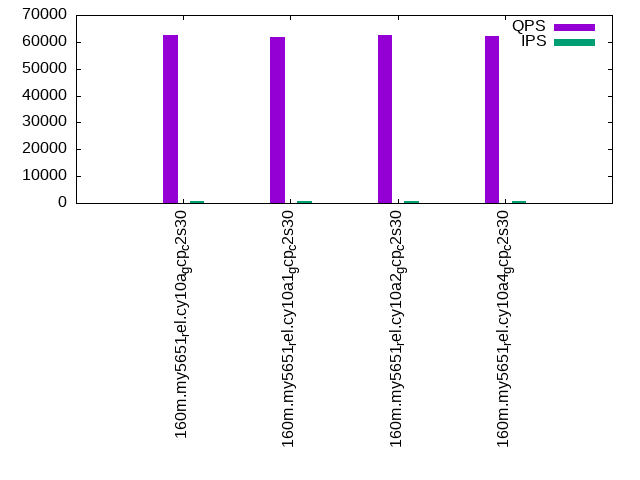
| 160m.my5651_rel.cy10a_gcp_c2s30 | 430108 | 627843 | 82051 | 62559 | 69065 | 74719 |
| 160m.my5651_rel.cy10a1_gcp_c2s30 | 427807 | 613410 | 82062 | 61645 | 68725 | 73900 |
| 160m.my5651_rel.cy10a2_gcp_c2s30 | 432432 | 630315 | 81841 | 62414 | 68501 | 74522 |
| 160m.my5651_rel.cy10a4_gcp_c2s30 | 430108 | 620543 | 81043 | 62307 | 71411 | 74438 |
This table has relative throughput, throughput for the DBMS relative to the DBMS in the first line, using the absolute throughput from the previous table.
| dbms | l.i0 | l.x | l.i1 | q100.1 | q500.1 | q1000.1 |
|---|---|---|---|---|---|---|
| 160m.my5651_rel.cy10a_gcp_c2s30 | 1.00 | 1.00 | 1.00 | 1.00 | 1.00 | 1.00 |
| 160m.my5651_rel.cy10a1_gcp_c2s30 | 0.99 | 0.98 | 1.00 | 0.99 | 1.00 | 0.99 |
| 160m.my5651_rel.cy10a2_gcp_c2s30 | 1.01 | 1.00 | 1.00 | 1.00 | 0.99 | 1.00 |
| 160m.my5651_rel.cy10a4_gcp_c2s30 | 1.00 | 0.99 | 0.99 | 1.00 | 1.03 | 1.00 |
This lists the average rate of inserts/s for the tests that do inserts concurrent with queries. For such tests the query rate is listed in the table above. The read+write tests are setup so that the insert rate should match the target rate every second. Cells that are not at least 95% of the target have a red background to indicate a failure to satisfy the target.
| dbms | q100.1 | q500.1 | q1000.1 |
|---|---|---|---|
| my5651_rel.cy10a_gcp_c2s30 | 793 | 3976 | 7965 |
| my5651_rel.cy10a1_gcp_c2s30 | 792 | 3974 | 7960 |
| my5651_rel.cy10a2_gcp_c2s30 | 794 | 3976 | 7960 |
| my5651_rel.cy10a4_gcp_c2s30 | 792 | 3978 | 7960 |
| target | 800 | 4000 | 8000 |
l.i0
l.i0: load without secondary indexes. Graphs for performance per 1-second interval are here.
Average throughput:
Insert response time histogram: each cell has the percentage of responses that take <= the time in the header and max is the max response time in seconds. For the max column values in the top 25% of the range have a red background and in the bottom 25% of the range have a green background. The red background is not used when the min value is within 80% of the max value.
| dbms | 256us | 1ms | 4ms | 16ms | 64ms | 256ms | 1s | 4s | 16s | gt | max |
|---|---|---|---|---|---|---|---|---|---|---|---|
| my5651_rel.cy10a_gcp_c2s30 | 2.145 | 97.614 | 0.067 | 0.160 | 0.014 | 0.202 | |||||
| my5651_rel.cy10a1_gcp_c2s30 | 2.424 | 97.333 | 0.068 | 0.161 | 0.014 | 0.206 | |||||
| my5651_rel.cy10a2_gcp_c2s30 | 2.194 | 97.565 | 0.068 | 0.158 | 0.014 | 0.212 | |||||
| my5651_rel.cy10a4_gcp_c2s30 | 2.378 | 97.252 | 0.198 | 0.158 | 0.014 | 0.204 |
Performance metrics for the DBMS listed above. Some are normalized by throughput, others are not. Legend for results is here.
ips	qps	rps	rmbps	wps	wmbps	rpq	rkbpq	wpi	wkbpi	csps	cpups	cspq	cpupq	dbgb1	dbgb2	rss	maxop	p50	p99	tag
430108	0	3384	13.2	551.9	77.2	0.008	0.031	0.001	0.184	87664	42.8	0.204	15	10.6	139.1	16.1	0.202	55440	45251	160m.my5651_rel.cy10a_gcp_c2s30
427807	0	3363	13.1	249.5	76.3	0.008	0.031	0.001	0.183	86972	42.9	0.203	15	10.6	139.1	16.1	0.206	55041	44752	160m.my5651_rel.cy10a1_gcp_c2s30
432432	0	3402	13.3	749.5	83.0	0.008	0.031	0.002	0.197	87955	42.6	0.203	15	10.6	139.1	16.1	0.212	55758	45194	160m.my5651_rel.cy10a2_gcp_c2s30
430108	0	3382	13.2	267.9	76.2	0.008	0.031	0.001	0.181	88506	42.8	0.206	15	10.6	139.1	16.1	0.204	55439	44966	160m.my5651_rel.cy10a4_gcp_c2s30
l.x
l.x: create secondary indexes.
Average throughput:
Performance metrics for the DBMS listed above. Some are normalized by throughput, others are not. Legend for results is here.
ips	qps	rps	rmbps	wps	wmbps	rpq	rkbpq	wpi	wkbpi	csps	cpups	cspq	cpupq	dbgb1	dbgb2	rss	maxop	p50	p99	tag
627843	0	293	1.1	7945.7	648.5	0.000	0.002	0.013	1.058	17492	38.9	0.028	9	21.7	150.2	27.3	0.001	NA	NA	160m.my5651_rel.cy10a_gcp_c2s30
613410	0	296	1.2	3107.8	630.0	0.000	0.002	0.005	1.052	14478	39.0	0.024	10	21.7	150.2	27.4	0.003	NA	NA	160m.my5651_rel.cy10a1_gcp_c2s30
630315	0	311	1.2	7839.2	651.6	0.000	0.002	0.012	1.059	18398	39.0	0.029	9	21.7	150.2	27.4	0.002	NA	NA	160m.my5651_rel.cy10a2_gcp_c2s30
620543	0	272	1.1	3326.2	635.9	0.000	0.002	0.005	1.049	28569	39.9	0.046	10	21.7	150.2	27.3	0.003	NA	NA	160m.my5651_rel.cy10a4_gcp_c2s30
l.i1
l.i1: continue load after secondary indexes created. Graphs for performance per 1-second interval are here.
Average throughput:
Insert response time histogram: each cell has the percentage of responses that take <= the time in the header and max is the max response time in seconds. For the max column values in the top 25% of the range have a red background and in the bottom 25% of the range have a green background. The red background is not used when the min value is within 80% of the max value.
| dbms | 256us | 1ms | 4ms | 16ms | 64ms | 256ms | 1s | 4s | 16s | gt | max |
|---|---|---|---|---|---|---|---|---|---|---|---|
| my5651_rel.cy10a_gcp_c2s30 | nonzero | 30.066 | 69.451 | 0.465 | 0.018 | 0.228 | |||||
| my5651_rel.cy10a1_gcp_c2s30 | nonzero | 29.390 | 70.130 | 0.462 | 0.018 | 0.207 | |||||
| my5651_rel.cy10a2_gcp_c2s30 | nonzero | 29.818 | 69.715 | 0.449 | 0.018 | 0.227 | |||||
| my5651_rel.cy10a4_gcp_c2s30 | nonzero | 29.716 | 69.802 | 0.464 | 0.018 | 0.221 |
Delete response time histogram: each cell has the percentage of responses that take <= the time in the header and max is the max response time in seconds. For the max column values in the top 25% of the range have a red background and in the bottom 25% of the range have a green background. The red background is not used when the min value is within 80% of the max value.
| dbms | 256us | 1ms | 4ms | 16ms | 64ms | 256ms | 1s | 4s | 16s | gt | max |
|---|---|---|---|---|---|---|---|---|---|---|---|
| my5651_rel.cy10a_gcp_c2s30 | 0.001 | 56.306 | 43.271 | 0.406 | 0.015 | 0.228 | |||||
| my5651_rel.cy10a1_gcp_c2s30 | 0.001 | 55.186 | 44.392 | 0.406 | 0.015 | 0.211 | |||||
| my5651_rel.cy10a2_gcp_c2s30 | 0.002 | 55.533 | 44.058 | 0.393 | 0.015 | 0.228 | |||||
| my5651_rel.cy10a4_gcp_c2s30 | 0.003 | 56.464 | 43.125 | 0.390 | 0.018 | 0.217 |
Performance metrics for the DBMS listed above. Some are normalized by throughput, others are not. Legend for results is here.
ips	qps	rps	rmbps	wps	wmbps	rpq	rkbpq	wpi	wkbpi	csps	cpups	cspq	cpupq	dbgb1	dbgb2	rss	maxop	p50	p99	tag
82051	0	2575	11.2	4261.1	164.5	0.031	0.140	0.052	2.052	172465	62.7	2.102	115	83.8	235.9	85.7	0.228	10392	8341	160m.my5651_rel.cy10a_gcp_c2s30
82062	0	2584	11.3	3231.6	162.8	0.031	0.141	0.039	2.032	173538	63.2	2.115	116	84.9	237.3	85.7	0.207	10392	8391	160m.my5651_rel.cy10a1_gcp_c2s30
81841	0	2550	11.1	5432.0	200.0	0.031	0.139	0.066	2.502	173283	62.6	2.117	115	84.1	236.3	85.7	0.227	10389	8341	160m.my5651_rel.cy10a2_gcp_c2s30
81043	0	2451	10.8	3311.8	158.8	0.030	0.137	0.041	2.007	171924	63.0	2.121	117	82.7	234.4	85.6	0.221	10292	8240	160m.my5651_rel.cy10a4_gcp_c2s30
q100.1
q100.1: range queries with 100 insert/s per client. Graphs for performance per 1-second interval are here.
Average throughput:
Query response time histogram: each cell has the percentage of responses that take <= the time in the header and max is the max response time in seconds. For max values in the top 25% of the range have a red background and in the bottom 25% of the range have a green background. The red background is not used when the min value is within 80% of the max value.
| dbms | 256us | 1ms | 4ms | 16ms | 64ms | 256ms | 1s | 4s | 16s | gt | max |
|---|---|---|---|---|---|---|---|---|---|---|---|
| my5651_rel.cy10a_gcp_c2s30 | 99.737 | 0.192 | 0.062 | 0.009 | nonzero | 0.024 | |||||
| my5651_rel.cy10a1_gcp_c2s30 | 99.724 | 0.207 | 0.057 | 0.011 | nonzero | 0.025 | |||||
| my5651_rel.cy10a2_gcp_c2s30 | 99.725 | 0.205 | 0.061 | 0.009 | nonzero | 0.030 | |||||
| my5651_rel.cy10a4_gcp_c2s30 | 99.629 | 0.271 | 0.090 | 0.011 | nonzero | nonzero | 0.109 |
Insert response time histogram: each cell has the percentage of responses that take <= the time in the header and max is the max response time in seconds. For max values in the top 25% of the range have a red background and in the bottom 25% of the range have a green background. The red background is not used when the min value is within 80% of the max value.
| dbms | 256us | 1ms | 4ms | 16ms | 64ms | 256ms | 1s | 4s | 16s | gt | max |
|---|---|---|---|---|---|---|---|---|---|---|---|
| my5651_rel.cy10a_gcp_c2s30 | 84.042 | 15.951 | 0.007 | 0.021 | |||||||
| my5651_rel.cy10a1_gcp_c2s30 | 83.969 | 16.017 | 0.014 | 0.032 | |||||||
| my5651_rel.cy10a2_gcp_c2s30 | 82.868 | 17.118 | 0.014 | 0.020 | |||||||
| my5651_rel.cy10a4_gcp_c2s30 | 82.910 | 17.045 | 0.045 | 0.030 |
Delete response time histogram: each cell has the percentage of responses that take <= the time in the header and max is the max response time in seconds. For max values in the top 25% of the range have a red background and in the bottom 25% of the range have a green background. The red background is not used when the min value is within 80% of the max value.
| dbms | 256us | 1ms | 4ms | 16ms | 64ms | 256ms | 1s | 4s | 16s | gt | max |
|---|---|---|---|---|---|---|---|---|---|---|---|
| my5651_rel.cy10a_gcp_c2s30 | 0.170 | 88.431 | 11.389 | 0.010 | 0.027 | ||||||
| my5651_rel.cy10a1_gcp_c2s30 | 0.087 | 87.083 | 12.826 | 0.003 | 0.017 | ||||||
| my5651_rel.cy10a2_gcp_c2s30 | 0.170 | 86.646 | 13.170 | 0.014 | 0.026 | ||||||
| my5651_rel.cy10a4_gcp_c2s30 | 0.010 | 88.826 | 11.142 | 0.021 | 0.018 |
Performance metrics for the DBMS listed above. Some are normalized by throughput, others are not. Legend for results is here.
ips	qps	rps	rmbps	wps	wmbps	rpq	rkbpq	wpi	wkbpi	csps	cpups	cspq	cpupq	dbgb1	dbgb2	rss	maxop	p50	p99	tag
793	62559	1201	18.4	3500.9	115.3	0.019	0.300	4.413	148.767	212454	70.3	3.396	169	83.8	235.9	85.8	0.024	7847	7416	160m.my5651_rel.cy10a_gcp_c2s30
792	61645	810	18.9	2748.3	112.3	0.013	0.314	3.468	145.077	210173	70.1	3.409	171	84.9	237.3	85.8	0.025	7722	7355	160m.my5651_rel.cy10a1_gcp_c2s30
794	62414	1218	18.6	4451.2	144.0	0.020	0.305	5.607	185.745	213432	70.2	3.420	169	84.1	236.3	85.8	0.030	7816	7432	160m.my5651_rel.cy10a2_gcp_c2s30
792	62307	167	17.7	2998.2	118.6	0.003	0.291	3.783	153.305	208353	72.3	3.344	174	82.7	234.4	85.7	0.109	7834	6425	160m.my5651_rel.cy10a4_gcp_c2s30
q500.1
q500.1: range queries with 500 insert/s per client. Graphs for performance per 1-second interval are here.
Average throughput:
Query response time histogram: each cell has the percentage of responses that take <= the time in the header and max is the max response time in seconds. For max values in the top 25% of the range have a red background and in the bottom 25% of the range have a green background. The red background is not used when the min value is within 80% of the max value.
| dbms | 256us | 1ms | 4ms | 16ms | 64ms | 256ms | 1s | 4s | 16s | gt | max |
|---|---|---|---|---|---|---|---|---|---|---|---|
| my5651_rel.cy10a_gcp_c2s30 | 99.756 | 0.202 | 0.034 | 0.008 | nonzero | 0.024 | |||||
| my5651_rel.cy10a1_gcp_c2s30 | 99.766 | 0.193 | 0.036 | 0.005 | nonzero | 0.024 | |||||
| my5651_rel.cy10a2_gcp_c2s30 | 99.769 | 0.190 | 0.034 | 0.006 | nonzero | 0.024 | |||||
| my5651_rel.cy10a4_gcp_c2s30 | 99.766 | 0.195 | 0.033 | 0.006 | nonzero | 0.024 |
Insert response time histogram: each cell has the percentage of responses that take <= the time in the header and max is the max response time in seconds. For max values in the top 25% of the range have a red background and in the bottom 25% of the range have a green background. The red background is not used when the min value is within 80% of the max value.
| dbms | 256us | 1ms | 4ms | 16ms | 64ms | 256ms | 1s | 4s | 16s | gt | max |
|---|---|---|---|---|---|---|---|---|---|---|---|
| my5651_rel.cy10a_gcp_c2s30 | 0.062 | 94.517 | 5.401 | 0.019 | 0.029 | ||||||
| my5651_rel.cy10a1_gcp_c2s30 | 0.071 | 97.697 | 2.225 | 0.007 | 0.019 | ||||||
| my5651_rel.cy10a2_gcp_c2s30 | 0.099 | 97.834 | 2.060 | 0.007 | 0.025 | ||||||
| my5651_rel.cy10a4_gcp_c2s30 | 0.070 | 92.821 | 7.072 | 0.037 | 0.025 |
Delete response time histogram: each cell has the percentage of responses that take <= the time in the header and max is the max response time in seconds. For max values in the top 25% of the range have a red background and in the bottom 25% of the range have a green background. The red background is not used when the min value is within 80% of the max value.
| dbms | 256us | 1ms | 4ms | 16ms | 64ms | 256ms | 1s | 4s | 16s | gt | max |
|---|---|---|---|---|---|---|---|---|---|---|---|
| my5651_rel.cy10a_gcp_c2s30 | 0.565 | 96.232 | 3.190 | 0.013 | 0.026 | ||||||
| my5651_rel.cy10a1_gcp_c2s30 | 0.649 | 97.801 | 1.545 | 0.006 | 0.028 | ||||||
| my5651_rel.cy10a2_gcp_c2s30 | 0.955 | 97.661 | 1.378 | 0.006 | 0.024 | ||||||
| my5651_rel.cy10a4_gcp_c2s30 | 0.713 | 96.123 | 3.149 | 0.015 | 0.023 |
Performance metrics for the DBMS listed above. Some are normalized by throughput, others are not. Legend for results is here.
ips	qps	rps	rmbps	wps	wmbps	rpq	rkbpq	wpi	wkbpi	csps	cpups	cspq	cpupq	dbgb1	dbgb2	rss	maxop	p50	p99	tag
3976	69065	644	8.5	2588.0	84.4	0.009	0.126	0.651	21.745	253740	62.6	3.674	136	83.8	235.9	85.7	0.024	9222	7464	160m.my5651_rel.cy10a_gcp_c2s30
3974	68725	472	8.8	2071.6	86.3	0.007	0.131	0.521	22.243	249069	63.7	3.624	139	84.9	237.3	85.8	0.024	8311	7546	160m.my5651_rel.cy10a1_gcp_c2s30
3976	68501	658	8.7	4172.6	132.5	0.010	0.130	1.050	34.117	252391	63.0	3.684	138	84.1	236.3	85.7	0.024	8662	7528	160m.my5651_rel.cy10a2_gcp_c2s30
3978	71411	180	5.1	1716.3	71.8	0.003	0.073	0.431	18.492	266814	60.8	3.736	128	82.7	234.4	85.7	0.024	9510	7512	160m.my5651_rel.cy10a4_gcp_c2s30
q1000.1
q1000.1: range queries with 1000 insert/s per client. Graphs for performance per 1-second interval are here.
Average throughput:
Query response time histogram: each cell has the percentage of responses that take <= the time in the header and max is the max response time in seconds. For max values in the top 25% of the range have a red background and in the bottom 25% of the range have a green background. The red background is not used when the min value is within 80% of the max value.
| dbms | 256us | 1ms | 4ms | 16ms | 64ms | 256ms | 1s | 4s | 16s | gt | max |
|---|---|---|---|---|---|---|---|---|---|---|---|
| my5651_rel.cy10a_gcp_c2s30 | 99.502 | 0.448 | 0.045 | 0.004 | nonzero | 0.018 | |||||
| my5651_rel.cy10a1_gcp_c2s30 | 99.499 | 0.452 | 0.045 | 0.004 | nonzero | 0.026 | |||||
| my5651_rel.cy10a2_gcp_c2s30 | 99.509 | 0.443 | 0.044 | 0.004 | nonzero | 0.023 | |||||
| my5651_rel.cy10a4_gcp_c2s30 | 99.490 | 0.453 | 0.052 | 0.005 | nonzero | 0.023 |
Insert response time histogram: each cell has the percentage of responses that take <= the time in the header and max is the max response time in seconds. For max values in the top 25% of the range have a red background and in the bottom 25% of the range have a green background. The red background is not used when the min value is within 80% of the max value.
| dbms | 256us | 1ms | 4ms | 16ms | 64ms | 256ms | 1s | 4s | 16s | gt | max |
|---|---|---|---|---|---|---|---|---|---|---|---|
| my5651_rel.cy10a_gcp_c2s30 | 44.701 | 54.622 | 0.677 | 0.036 | |||||||
| my5651_rel.cy10a1_gcp_c2s30 | 0.001 | 46.011 | 53.380 | 0.608 | 0.031 | ||||||
| my5651_rel.cy10a2_gcp_c2s30 | 0.001 | 45.556 | 53.823 | 0.620 | 0.034 | ||||||
| my5651_rel.cy10a4_gcp_c2s30 | 0.001 | 42.505 | 56.607 | 0.887 | 0.037 |
Delete response time histogram: each cell has the percentage of responses that take <= the time in the header and max is the max response time in seconds. For max values in the top 25% of the range have a red background and in the bottom 25% of the range have a green background. The red background is not used when the min value is within 80% of the max value.
| dbms | 256us | 1ms | 4ms | 16ms | 64ms | 256ms | 1s | 4s | 16s | gt | max |
|---|---|---|---|---|---|---|---|---|---|---|---|
| my5651_rel.cy10a_gcp_c2s30 | 0.028 | 52.001 | 47.565 | 0.406 | 0.037 | ||||||
| my5651_rel.cy10a1_gcp_c2s30 | 0.022 | 53.663 | 45.985 | 0.330 | 0.030 | ||||||
| my5651_rel.cy10a2_gcp_c2s30 | 0.027 | 52.835 | 46.784 | 0.354 | 0.031 | ||||||
| my5651_rel.cy10a4_gcp_c2s30 | 0.217 | 51.903 | 47.409 | 0.470 | 0.036 |
Performance metrics for the DBMS listed above. Some are normalized by throughput, others are not. Legend for results is here.
ips	qps	rps	rmbps	wps	wmbps	rpq	rkbpq	wpi	wkbpi	csps	cpups	cspq	cpupq	dbgb1	dbgb2	rss	maxop	p50	p99	tag
7965	74719	332	2.5	1443.7	46.8	0.004	0.034	0.181	6.018	286578	57.3	3.835	115	83.8	235.9	85.7	0.018	9414	8950	160m.my5651_rel.cy10a_gcp_c2s30
7960	73900	333	2.5	1137.7	44.6	0.005	0.035	0.143	5.732	283474	57.5	3.836	117	84.9	237.3	85.7	0.026	9353	8663	160m.my5651_rel.cy10a1_gcp_c2s30
7960	74522	335	2.5	192.7	9.0	0.004	0.035	0.024	1.161	284372	57.2	3.816	115	84.1	236.3	85.7	0.023	9366	9129	160m.my5651_rel.cy10a2_gcp_c2s30
7960	74438	328	2.7	886.7	35.0	0.004	0.037	0.111	4.497	286543	57.3	3.849	115	82.7	234.4	85.7	0.023	9398	8535	160m.my5651_rel.cy10a4_gcp_c2s30
l.i0
l.i0: load without secondary indexes
Performance metrics for all DBMS, not just the ones listed above. Some are normalized by throughput, others are not. Legend for results is here.
ips	qps	rps	rmbps	wps	wmbps	rpq	rkbpq	wpi	wkbpi	csps	cpups	cspq	cpupq	dbgb1	dbgb2	rss	maxop	p50	p99	tag
430108	0	3384	13.2	551.9	77.2	0.008	0.031	0.001	0.184	87664	42.8	0.204	15	10.6	139.1	16.1	0.202	55440	45251	160m.my5651_rel.cy10a_gcp_c2s30
427807	0	3363	13.1	249.5	76.3	0.008	0.031	0.001	0.183	86972	42.9	0.203	15	10.6	139.1	16.1	0.206	55041	44752	160m.my5651_rel.cy10a1_gcp_c2s30
432432	0	3402	13.3	749.5	83.0	0.008	0.031	0.002	0.197	87955	42.6	0.203	15	10.6	139.1	16.1	0.212	55758	45194	160m.my5651_rel.cy10a2_gcp_c2s30
430108	0	3382	13.2	267.9	76.2	0.008	0.031	0.001	0.181	88506	42.8	0.206	15	10.6	139.1	16.1	0.204	55439	44966	160m.my5651_rel.cy10a4_gcp_c2s30
l.x
l.x: create secondary indexes
Performance metrics for all DBMS, not just the ones listed above. Some are normalized by throughput, others are not. Legend for results is here.
ips	qps	rps	rmbps	wps	wmbps	rpq	rkbpq	wpi	wkbpi	csps	cpups	cspq	cpupq	dbgb1	dbgb2	rss	maxop	p50	p99	tag
627843	0	293	1.1	7945.7	648.5	0.000	0.002	0.013	1.058	17492	38.9	0.028	9	21.7	150.2	27.3	0.001	NA	NA	160m.my5651_rel.cy10a_gcp_c2s30
613410	0	296	1.2	3107.8	630.0	0.000	0.002	0.005	1.052	14478	39.0	0.024	10	21.7	150.2	27.4	0.003	NA	NA	160m.my5651_rel.cy10a1_gcp_c2s30
630315	0	311	1.2	7839.2	651.6	0.000	0.002	0.012	1.059	18398	39.0	0.029	9	21.7	150.2	27.4	0.002	NA	NA	160m.my5651_rel.cy10a2_gcp_c2s30
620543	0	272	1.1	3326.2	635.9	0.000	0.002	0.005	1.049	28569	39.9	0.046	10	21.7	150.2	27.3	0.003	NA	NA	160m.my5651_rel.cy10a4_gcp_c2s30
l.i1
l.i1: continue load after secondary indexes created
Performance metrics for all DBMS, not just the ones listed above. Some are normalized by throughput, others are not. Legend for results is here.
ips	qps	rps	rmbps	wps	wmbps	rpq	rkbpq	wpi	wkbpi	csps	cpups	cspq	cpupq	dbgb1	dbgb2	rss	maxop	p50	p99	tag
82051	0	2575	11.2	4261.1	164.5	0.031	0.140	0.052	2.052	172465	62.7	2.102	115	83.8	235.9	85.7	0.228	10392	8341	160m.my5651_rel.cy10a_gcp_c2s30
82062	0	2584	11.3	3231.6	162.8	0.031	0.141	0.039	2.032	173538	63.2	2.115	116	84.9	237.3	85.7	0.207	10392	8391	160m.my5651_rel.cy10a1_gcp_c2s30
81841	0	2550	11.1	5432.0	200.0	0.031	0.139	0.066	2.502	173283	62.6	2.117	115	84.1	236.3	85.7	0.227	10389	8341	160m.my5651_rel.cy10a2_gcp_c2s30
81043	0	2451	10.8	3311.8	158.8	0.030	0.137	0.041	2.007	171924	63.0	2.121	117	82.7	234.4	85.6	0.221	10292	8240	160m.my5651_rel.cy10a4_gcp_c2s30
q100.1
q100.1: range queries with 100 insert/s per client
Performance metrics for all DBMS, not just the ones listed above. Some are normalized by throughput, others are not. Legend for results is here.
ips	qps	rps	rmbps	wps	wmbps	rpq	rkbpq	wpi	wkbpi	csps	cpups	cspq	cpupq	dbgb1	dbgb2	rss	maxop	p50	p99	tag
793	62559	1201	18.4	3500.9	115.3	0.019	0.300	4.413	148.767	212454	70.3	3.396	169	83.8	235.9	85.8	0.024	7847	7416	160m.my5651_rel.cy10a_gcp_c2s30
792	61645	810	18.9	2748.3	112.3	0.013	0.314	3.468	145.077	210173	70.1	3.409	171	84.9	237.3	85.8	0.025	7722	7355	160m.my5651_rel.cy10a1_gcp_c2s30
794	62414	1218	18.6	4451.2	144.0	0.020	0.305	5.607	185.745	213432	70.2	3.420	169	84.1	236.3	85.8	0.030	7816	7432	160m.my5651_rel.cy10a2_gcp_c2s30
792	62307	167	17.7	2998.2	118.6	0.003	0.291	3.783	153.305	208353	72.3	3.344	174	82.7	234.4	85.7	0.109	7834	6425	160m.my5651_rel.cy10a4_gcp_c2s30
q500.1
q500.1: range queries with 500 insert/s per client
Performance metrics for all DBMS, not just the ones listed above. Some are normalized by throughput, others are not. Legend for results is here.
ips	qps	rps	rmbps	wps	wmbps	rpq	rkbpq	wpi	wkbpi	csps	cpups	cspq	cpupq	dbgb1	dbgb2	rss	maxop	p50	p99	tag
3976	69065	644	8.5	2588.0	84.4	0.009	0.126	0.651	21.745	253740	62.6	3.674	136	83.8	235.9	85.7	0.024	9222	7464	160m.my5651_rel.cy10a_gcp_c2s30
3974	68725	472	8.8	2071.6	86.3	0.007	0.131	0.521	22.243	249069	63.7	3.624	139	84.9	237.3	85.8	0.024	8311	7546	160m.my5651_rel.cy10a1_gcp_c2s30
3976	68501	658	8.7	4172.6	132.5	0.010	0.130	1.050	34.117	252391	63.0	3.684	138	84.1	236.3	85.7	0.024	8662	7528	160m.my5651_rel.cy10a2_gcp_c2s30
3978	71411	180	5.1	1716.3	71.8	0.003	0.073	0.431	18.492	266814	60.8	3.736	128	82.7	234.4	85.7	0.024	9510	7512	160m.my5651_rel.cy10a4_gcp_c2s30
q1000.1
q1000.1: range queries with 1000 insert/s per client
Performance metrics for all DBMS, not just the ones listed above. Some are normalized by throughput, others are not. Legend for results is here.
ips	qps	rps	rmbps	wps	wmbps	rpq	rkbpq	wpi	wkbpi	csps	cpups	cspq	cpupq	dbgb1	dbgb2	rss	maxop	p50	p99	tag
7965	74719	332	2.5	1443.7	46.8	0.004	0.034	0.181	6.018	286578	57.3	3.835	115	83.8	235.9	85.7	0.018	9414	8950	160m.my5651_rel.cy10a_gcp_c2s30
7960	73900	333	2.5	1137.7	44.6	0.005	0.035	0.143	5.732	283474	57.5	3.836	117	84.9	237.3	85.7	0.026	9353	8663	160m.my5651_rel.cy10a1_gcp_c2s30
7960	74522	335	2.5	192.7	9.0	0.004	0.035	0.024	1.161	284372	57.2	3.816	115	84.1	236.3	85.7	0.023	9366	9129	160m.my5651_rel.cy10a2_gcp_c2s30
7960	74438	328	2.7	886.7	35.0	0.004	0.037	0.111	4.497	286543	57.3	3.849	115	82.7	234.4	85.7	0.023	9398	8535	160m.my5651_rel.cy10a4_gcp_c2s30
l.i0
- l.i0: load without secondary indexes
- Legend for results is here.
- Each entry lists the percentage of responses that fit in that bucket (slower than max time for previous bucket, faster than min time for next bucket).
Insert response time histogram
256us	1ms	4ms	16ms	64ms	256ms	1s	4s	16s	gt	max	tag
0.000	2.145	97.614	0.067	0.160	0.014	0.000	0.000	0.000	0.000	0.202	my5651_rel.cy10a_gcp_c2s30
0.000	2.424	97.333	0.068	0.161	0.014	0.000	0.000	0.000	0.000	0.206	my5651_rel.cy10a1_gcp_c2s30
0.000	2.194	97.565	0.068	0.158	0.014	0.000	0.000	0.000	0.000	0.212	my5651_rel.cy10a2_gcp_c2s30
0.000	2.378	97.252	0.198	0.158	0.014	0.000	0.000	0.000	0.000	0.204	my5651_rel.cy10a4_gcp_c2s30
l.x
- l.x: create secondary indexes
- Legend for results is here.
- Each entry lists the percentage of responses that fit in that bucket (slower than max time for previous bucket, faster than min time for next bucket).
TODO - determine whether there is data for create index response time
l.i1
- l.i1: continue load after secondary indexes created
- Legend for results is here.
- Each entry lists the percentage of responses that fit in that bucket (slower than max time for previous bucket, faster than min time for next bucket).
Insert response time histogram
256us	1ms	4ms	16ms	64ms	256ms	1s	4s	16s	gt	max	tag
0.000	nonzero	30.066	69.451	0.465	0.018	0.000	0.000	0.000	0.000	0.228	my5651_rel.cy10a_gcp_c2s30
0.000	nonzero	29.390	70.130	0.462	0.018	0.000	0.000	0.000	0.000	0.207	my5651_rel.cy10a1_gcp_c2s30
0.000	nonzero	29.818	69.715	0.449	0.018	0.000	0.000	0.000	0.000	0.227	my5651_rel.cy10a2_gcp_c2s30
0.000	nonzero	29.716	69.802	0.464	0.018	0.000	0.000	0.000	0.000	0.221	my5651_rel.cy10a4_gcp_c2s30
Delete response time histogram
256us	1ms	4ms	16ms	64ms	256ms	1s	4s	16s	gt	max	tag
0.000	0.001	56.306	43.271	0.406	0.015	0.000	0.000	0.000	0.000	0.228	my5651_rel.cy10a_gcp_c2s30
0.000	0.001	55.186	44.392	0.406	0.015	0.000	0.000	0.000	0.000	0.211	my5651_rel.cy10a1_gcp_c2s30
0.000	0.002	55.533	44.058	0.393	0.015	0.000	0.000	0.000	0.000	0.228	my5651_rel.cy10a2_gcp_c2s30
0.000	0.003	56.464	43.125	0.390	0.018	0.000	0.000	0.000	0.000	0.217	my5651_rel.cy10a4_gcp_c2s30
q100.1
- q100.1: range queries with 100 insert/s per client
- Legend for results is here.
- Each entry lists the percentage of responses that fit in that bucket (slower than max time for previous bucket, faster than min time for next bucket).
Query response time histogram
256us	1ms	4ms	16ms	64ms	256ms	1s	4s	16s	gt	max	tag
99.737	0.192	0.062	0.009	nonzero	0.000	0.000	0.000	0.000	0.000	0.024	my5651_rel.cy10a_gcp_c2s30
99.724	0.207	0.057	0.011	nonzero	0.000	0.000	0.000	0.000	0.000	0.025	my5651_rel.cy10a1_gcp_c2s30
99.725	0.205	0.061	0.009	nonzero	0.000	0.000	0.000	0.000	0.000	0.030	my5651_rel.cy10a2_gcp_c2s30
99.629	0.271	0.090	0.011	nonzero	nonzero	0.000	0.000	0.000	0.000	0.109	my5651_rel.cy10a4_gcp_c2s30
Insert response time histogram
256us	1ms	4ms	16ms	64ms	256ms	1s	4s	16s	gt	max	tag
0.000	0.000	84.042	15.951	0.007	0.000	0.000	0.000	0.000	0.000	0.021	my5651_rel.cy10a_gcp_c2s30
0.000	0.000	83.969	16.017	0.014	0.000	0.000	0.000	0.000	0.000	0.032	my5651_rel.cy10a1_gcp_c2s30
0.000	0.000	82.868	17.118	0.014	0.000	0.000	0.000	0.000	0.000	0.020	my5651_rel.cy10a2_gcp_c2s30
0.000	0.000	82.910	17.045	0.045	0.000	0.000	0.000	0.000	0.000	0.030	my5651_rel.cy10a4_gcp_c2s30
Delete response time histogram
256us	1ms	4ms	16ms	64ms	256ms	1s	4s	16s	gt	max	tag
0.000	0.170	88.431	11.389	0.010	0.000	0.000	0.000	0.000	0.000	0.027	my5651_rel.cy10a_gcp_c2s30
0.000	0.087	87.083	12.826	0.003	0.000	0.000	0.000	0.000	0.000	0.017	my5651_rel.cy10a1_gcp_c2s30
0.000	0.170	86.646	13.170	0.014	0.000	0.000	0.000	0.000	0.000	0.026	my5651_rel.cy10a2_gcp_c2s30
0.000	0.010	88.826	11.142	0.021	0.000	0.000	0.000	0.000	0.000	0.018	my5651_rel.cy10a4_gcp_c2s30
q500.1
- q500.1: range queries with 500 insert/s per client
- Legend for results is here.
- Each entry lists the percentage of responses that fit in that bucket (slower than max time for previous bucket, faster than min time for next bucket).
Query response time histogram
256us	1ms	4ms	16ms	64ms	256ms	1s	4s	16s	gt	max	tag
99.756	0.202	0.034	0.008	nonzero	0.000	0.000	0.000	0.000	0.000	0.024	my5651_rel.cy10a_gcp_c2s30
99.766	0.193	0.036	0.005	nonzero	0.000	0.000	0.000	0.000	0.000	0.024	my5651_rel.cy10a1_gcp_c2s30
99.769	0.190	0.034	0.006	nonzero	0.000	0.000	0.000	0.000	0.000	0.024	my5651_rel.cy10a2_gcp_c2s30
99.766	0.195	0.033	0.006	nonzero	0.000	0.000	0.000	0.000	0.000	0.024	my5651_rel.cy10a4_gcp_c2s30
Insert response time histogram
256us	1ms	4ms	16ms	64ms	256ms	1s	4s	16s	gt	max	tag
0.000	0.062	94.517	5.401	0.019	0.000	0.000	0.000	0.000	0.000	0.029	my5651_rel.cy10a_gcp_c2s30
0.000	0.071	97.697	2.225	0.007	0.000	0.000	0.000	0.000	0.000	0.019	my5651_rel.cy10a1_gcp_c2s30
0.000	0.099	97.834	2.060	0.007	0.000	0.000	0.000	0.000	0.000	0.025	my5651_rel.cy10a2_gcp_c2s30
0.000	0.070	92.821	7.072	0.037	0.000	0.000	0.000	0.000	0.000	0.025	my5651_rel.cy10a4_gcp_c2s30
Delete response time histogram
256us	1ms	4ms	16ms	64ms	256ms	1s	4s	16s	gt	max	tag
0.000	0.565	96.232	3.190	0.013	0.000	0.000	0.000	0.000	0.000	0.026	my5651_rel.cy10a_gcp_c2s30
0.000	0.649	97.801	1.545	0.006	0.000	0.000	0.000	0.000	0.000	0.028	my5651_rel.cy10a1_gcp_c2s30
0.000	0.955	97.661	1.378	0.006	0.000	0.000	0.000	0.000	0.000	0.024	my5651_rel.cy10a2_gcp_c2s30
0.000	0.713	96.123	3.149	0.015	0.000	0.000	0.000	0.000	0.000	0.023	my5651_rel.cy10a4_gcp_c2s30
q1000.1
- q1000.1: range queries with 1000 insert/s per client
- Legend for results is here.
- Each entry lists the percentage of responses that fit in that bucket (slower than max time for previous bucket, faster than min time for next bucket).
Query response time histogram
256us	1ms	4ms	16ms	64ms	256ms	1s	4s	16s	gt	max	tag
99.502	0.448	0.045	0.004	nonzero	0.000	0.000	0.000	0.000	0.000	0.018	my5651_rel.cy10a_gcp_c2s30
99.499	0.452	0.045	0.004	nonzero	0.000	0.000	0.000	0.000	0.000	0.026	my5651_rel.cy10a1_gcp_c2s30
99.509	0.443	0.044	0.004	nonzero	0.000	0.000	0.000	0.000	0.000	0.023	my5651_rel.cy10a2_gcp_c2s30
99.490	0.453	0.052	0.005	nonzero	0.000	0.000	0.000	0.000	0.000	0.023	my5651_rel.cy10a4_gcp_c2s30
Insert response time histogram
256us	1ms	4ms	16ms	64ms	256ms	1s	4s	16s	gt	max	tag
0.000	0.000	44.701	54.622	0.677	0.000	0.000	0.000	0.000	0.000	0.036	my5651_rel.cy10a_gcp_c2s30
0.000	0.001	46.011	53.380	0.608	0.000	0.000	0.000	0.000	0.000	0.031	my5651_rel.cy10a1_gcp_c2s30
0.000	0.001	45.556	53.823	0.620	0.000	0.000	0.000	0.000	0.000	0.034	my5651_rel.cy10a2_gcp_c2s30
0.000	0.001	42.505	56.607	0.887	0.000	0.000	0.000	0.000	0.000	0.037	my5651_rel.cy10a4_gcp_c2s30
Delete response time histogram
256us	1ms	4ms	16ms	64ms	256ms	1s	4s	16s	gt	max	tag
0.000	0.028	52.001	47.565	0.406	0.000	0.000	0.000	0.000	0.000	0.037	my5651_rel.cy10a_gcp_c2s30
0.000	0.022	53.663	45.985	0.330	0.000	0.000	0.000	0.000	0.000	0.030	my5651_rel.cy10a1_gcp_c2s30
0.000	0.027	52.835	46.784	0.354	0.000	0.000	0.000	0.000	0.000	0.031	my5651_rel.cy10a2_gcp_c2s30
0.000	0.217	51.903	47.409	0.470	0.000	0.000	0.000	0.000	0.000	0.036	my5651_rel.cy10a4_gcp_c2s30