Introduction
This is a report for the insert benchmark with 160M docs and 8 client(s). It is generated by scripts (bash, awk, sed) and Tufte might not be impressed. An overview of the insert benchmark is here and a short update is here. Below, by DBMS, I mean DBMS+version.config. An example is my8020.c10b40 where my means MySQL, 8020 is version 8.0.20 and c10b40 is the name for the configuration file.
The test server is a c2-standard-30 from GCP with 15 cores, hyperthreads disabled, 120G RAM, XFS + SW RAID 0 on 4 NVMe devices (1.5TB). The benchmark was run with 8 client and there were 1 or 3 connections per client (1 for queries or inserts without rate limits, 1+1 for rate limited inserts+deletes). There are 8 tables, client per table. It loads 160M rows without secondary indexes, creates secondary indexes, then inserts 80M rows with a delete per insert to avoid growing the table. It then does 3 read+write tests for 1800s each that do queries as fast as possible with 100, 500 and then 1000 inserts/second/client concurrent with the queries and 1000 deletes/second to avoid growing the table. The database is cached by the OS but not by InnoDB.
The tested DBMS are:
- my5651_rel.cy10a_4g_gcp_c2s30 - InnoDB and MySQL 5.6.51, rel build, cy10a_4g_gcp_c2s30 config, compiled with CMAKE_BUILD_TYPE=Release -O2, base config
- my5651_rel.cy10a1_4g_gcp_c2s30 - InnoDB and MySQL 5.6.51, rel build, cy10a_4g_gcp_c2s30 config, compiled with CMAKE_BUILD_TYPE=Release -O2, adds innodb_use_native_aio=off
- my5651_rel.cy10a2_4g_gcp_c2s30 - InnoDB and MySQL 5.6.51, rel build, cy10a_4g_gcp_c2s30 config, compiled with CMAKE_BUILD_TYPE=Release -O2, adds innodb_io_capacity=20k, innodb_io_capacity_max=40k
Contents
- Summary
- l.i0: load without secondary indexes
- l.x: create secondary indexes
- l.i1: continue load after secondary indexes created
- q100.1: range queries with 100 insert/s per client
- q500.1: range queries with 500 insert/s per client
- q1000.1: range queries with 1000 insert/s per client
Summary
The numbers are inserts/s for l.i0 and l.i1, indexed docs (or rows) /s for l.x and queries/s for q*.2. The values are the average rate over the entire test for inserts (IPS) and queries (QPS). The range of values for IPS and QPS is split into 3 parts: bottom 25%, middle 50%, top 25%. Values in the bottom 25% have a red background, values in the top 25% have a green background and values in the middle have no color. A gray background is used for values that can be ignored because the DBMS did not sustain the target insert rate. Red backgrounds are not used when the minimum value is within 80% of the max value.
| dbms | l.i0 | l.x | l.i1 | q100.1 | q500.1 | q1000.1 |
|---|---|---|---|---|---|---|
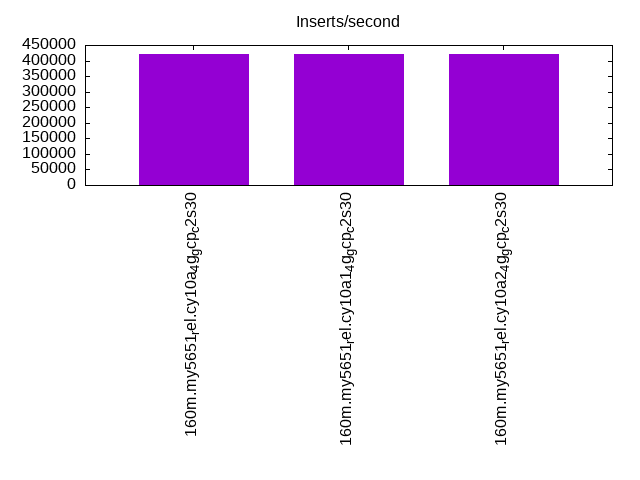
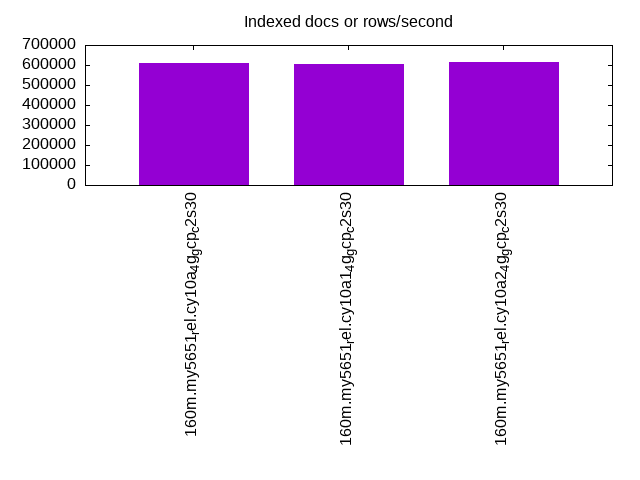
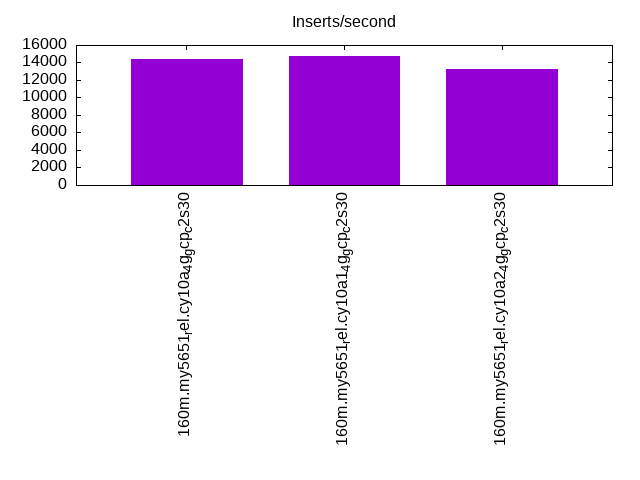
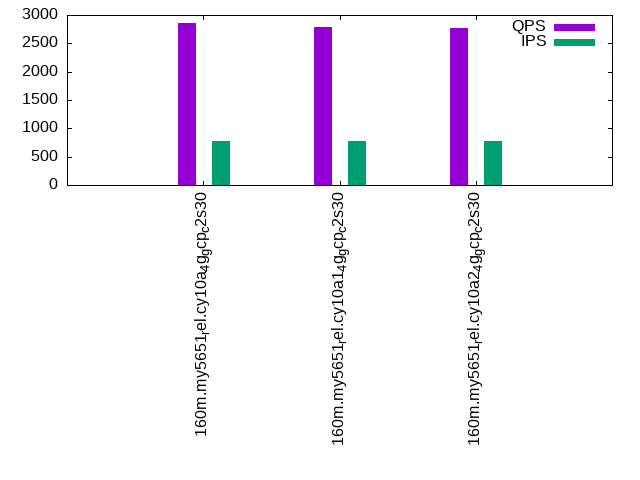
| 160m.my5651_rel.cy10a_4g_gcp_c2s30 | 422164 | 608745 | 14388 | 2850 | 1893 | 1155 |
| 160m.my5651_rel.cy10a1_4g_gcp_c2s30 | 421053 | 604151 | 14785 | 2790 | 1841 | 1157 |
| 160m.my5651_rel.cy10a2_4g_gcp_c2s30 | 422164 | 613410 | 13212 | 2775 | 1873 | 1142 |
This table has relative throughput, throughput for the DBMS relative to the DBMS in the first line, using the absolute throughput from the previous table.
| dbms | l.i0 | l.x | l.i1 | q100.1 | q500.1 | q1000.1 |
|---|---|---|---|---|---|---|
| 160m.my5651_rel.cy10a_4g_gcp_c2s30 | 1.00 | 1.00 | 1.00 | 1.00 | 1.00 | 1.00 |
| 160m.my5651_rel.cy10a1_4g_gcp_c2s30 | 1.00 | 0.99 | 1.03 | 0.98 | 0.97 | 1.00 |
| 160m.my5651_rel.cy10a2_4g_gcp_c2s30 | 1.00 | 1.01 | 0.92 | 0.97 | 0.99 | 0.99 |
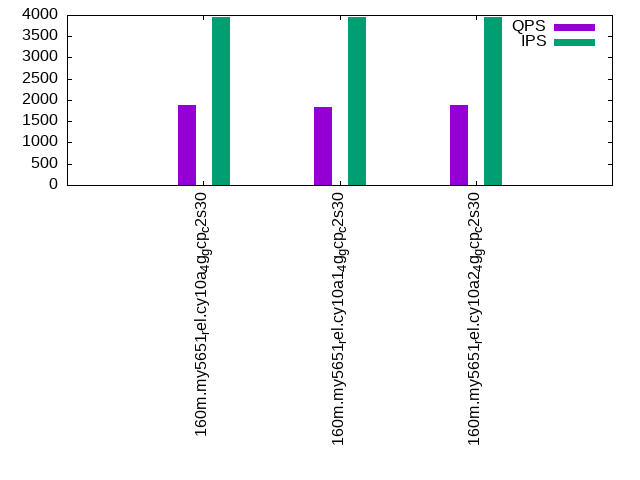
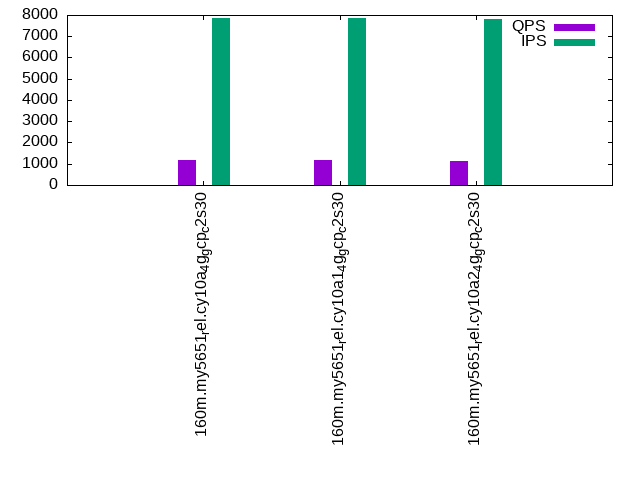
This lists the average rate of inserts/s for the tests that do inserts concurrent with queries. For such tests the query rate is listed in the table above. The read+write tests are setup so that the insert rate should match the target rate every second. Cells that are not at least 95% of the target have a red background to indicate a failure to satisfy the target.
| dbms | q100.1 | q500.1 | q1000.1 |
|---|---|---|---|
| my5651_rel.cy10a_4g_gcp_c2s30 | 780 | 3943 | 7843 |
| my5651_rel.cy10a1_4g_gcp_c2s30 | 782 | 3945 | 7856 |
| my5651_rel.cy10a2_4g_gcp_c2s30 | 775 | 3943 | 7826 |
| target | 800 | 4000 | 8000 |
l.i0
l.i0: load without secondary indexes. Graphs for performance per 1-second interval are here.
Average throughput:
Insert response time histogram: each cell has the percentage of responses that take <= the time in the header and max is the max response time in seconds. For the max column values in the top 25% of the range have a red background and in the bottom 25% of the range have a green background. The red background is not used when the min value is within 80% of the max value.
| dbms | 256us | 1ms | 4ms | 16ms | 64ms | 256ms | 1s | 4s | 16s | gt | max |
|---|---|---|---|---|---|---|---|---|---|---|---|
| my5651_rel.cy10a_4g_gcp_c2s30 | 2.307 | 97.300 | 0.216 | 0.163 | 0.014 | 0.206 | |||||
| my5651_rel.cy10a1_4g_gcp_c2s30 | 2.213 | 97.386 | 0.221 | 0.165 | 0.014 | 0.227 | |||||
| my5651_rel.cy10a2_4g_gcp_c2s30 | 2.270 | 97.335 | 0.221 | 0.161 | 0.014 | 0.211 |
Performance metrics for the DBMS listed above. Some are normalized by throughput, others are not. Legend for results is here.
ips	qps	rps	rmbps	wps	wmbps	rpq	rkbpq	wpi	wkbpi	csps	cpups	cspq	cpupq	dbgb1	dbgb2	rss	maxop	p50	p99	tag
422164	0	3331	13.0	354.5	101.7	0.008	0.032	0.001	0.247	89623	42.6	0.212	15	10.6	139.1	4.3	0.206	54440	43053	160m.my5651_rel.cy10a_4g_gcp_c2s30
421053	0	3313	12.9	355.7	102.1	0.008	0.031	0.001	0.248	86875	42.4	0.206	15	10.6	139.1	4.3	0.227	54341	41854	160m.my5651_rel.cy10a1_4g_gcp_c2s30
422164	0	3306	12.9	359.3	103.0	0.008	0.031	0.001	0.250	88940	42.3	0.211	15	10.6	139.1	4.3	0.211	54441	43453	160m.my5651_rel.cy10a2_4g_gcp_c2s30
l.x
l.x: create secondary indexes.
Average throughput:
Performance metrics for the DBMS listed above. Some are normalized by throughput, others are not. Legend for results is here.
ips	qps	rps	rmbps	wps	wmbps	rpq	rkbpq	wpi	wkbpi	csps	cpups	cspq	cpupq	dbgb1	dbgb2	rss	maxop	p50	p99	tag
608745	0	277	1.1	3217.0	574.5	0.000	0.002	0.005	0.966	27489	39.8	0.045	10	21.7	150.2	4.3	0.002	NA	NA	160m.my5651_rel.cy10a_4g_gcp_c2s30
604151	0	275	1.1	3187.4	565.9	0.000	0.002	0.005	0.959	19301	39.1	0.032	10	21.7	150.2	4.4	0.003	NA	NA	160m.my5651_rel.cy10a1_4g_gcp_c2s30
613410	0	269	1.1	3141.1	570.8	0.000	0.002	0.005	0.953	26662	39.6	0.043	10	21.7	150.2	4.3	0.003	NA	NA	160m.my5651_rel.cy10a2_4g_gcp_c2s30
l.i1
l.i1: continue load after secondary indexes created. Graphs for performance per 1-second interval are here.
Average throughput:
Insert response time histogram: each cell has the percentage of responses that take <= the time in the header and max is the max response time in seconds. For the max column values in the top 25% of the range have a red background and in the bottom 25% of the range have a green background. The red background is not used when the min value is within 80% of the max value.
| dbms | 256us | 1ms | 4ms | 16ms | 64ms | 256ms | 1s | 4s | 16s | gt | max |
|---|---|---|---|---|---|---|---|---|---|---|---|
| my5651_rel.cy10a_4g_gcp_c2s30 | 0.742 | 27.644 | 67.640 | 3.737 | 0.237 | 0.791 | |||||
| my5651_rel.cy10a1_4g_gcp_c2s30 | 0.669 | 32.602 | 62.987 | 3.302 | 0.440 | 0.837 | |||||
| my5651_rel.cy10a2_4g_gcp_c2s30 | 1.084 | 26.263 | 65.578 | 6.802 | 0.273 | nonzero | 1.024 |
Delete response time histogram: each cell has the percentage of responses that take <= the time in the header and max is the max response time in seconds. For the max column values in the top 25% of the range have a red background and in the bottom 25% of the range have a green background. The red background is not used when the min value is within 80% of the max value.
| dbms | 256us | 1ms | 4ms | 16ms | 64ms | 256ms | 1s | 4s | 16s | gt | max |
|---|---|---|---|---|---|---|---|---|---|---|---|
| my5651_rel.cy10a_4g_gcp_c2s30 | 0.001 | 1.172 | 30.721 | 65.338 | 2.748 | 0.019 | 0.469 | ||||
| my5651_rel.cy10a1_4g_gcp_c2s30 | 0.001 | 1.134 | 35.854 | 60.411 | 2.417 | 0.183 | 0.561 | ||||
| my5651_rel.cy10a2_4g_gcp_c2s30 | 0.001 | 1.467 | 29.084 | 63.768 | 5.640 | 0.039 | 0.541 |
Performance metrics for the DBMS listed above. Some are normalized by throughput, others are not. Legend for results is here.
ips	qps	rps	rmbps	wps	wmbps	rpq	rkbpq	wpi	wkbpi	csps	cpups	cspq	cpupq	dbgb1	dbgb2	rss	maxop	p50	p99	tag
14388	0	482	2.4	14977.2	458.3	0.034	0.171	1.041	32.616	150649	34.0	10.470	354	40.9	175.5	4.3	0.791	1848	200	160m.my5651_rel.cy10a_4g_gcp_c2s30
14785	0	494	2.5	14870.2	472.3	0.033	0.171	1.006	32.710	132686	35.3	8.975	358	41.0	175.6	4.3	0.837	1898	200	160m.my5651_rel.cy10a1_4g_gcp_c2s30
13212	0	448	2.3	14979.5	455.1	0.034	0.175	1.134	35.274	148685	31.9	11.254	362	40.9	175.6	4.3	1.024	1699	200	160m.my5651_rel.cy10a2_4g_gcp_c2s30
q100.1
q100.1: range queries with 100 insert/s per client. Graphs for performance per 1-second interval are here.
Average throughput:
Query response time histogram: each cell has the percentage of responses that take <= the time in the header and max is the max response time in seconds. For max values in the top 25% of the range have a red background and in the bottom 25% of the range have a green background. The red background is not used when the min value is within 80% of the max value.
| dbms | 256us | 1ms | 4ms | 16ms | 64ms | 256ms | 1s | 4s | 16s | gt | max |
|---|---|---|---|---|---|---|---|---|---|---|---|
| my5651_rel.cy10a_4g_gcp_c2s30 | 27.041 | 23.203 | 27.740 | 19.571 | 2.439 | 0.006 | 0.180 | ||||
| my5651_rel.cy10a1_4g_gcp_c2s30 | 26.955 | 24.081 | 27.440 | 18.660 | 2.856 | 0.008 | nonzero | 0.328 | |||
| my5651_rel.cy10a2_4g_gcp_c2s30 | 27.044 | 23.654 | 27.543 | 18.925 | 2.828 | 0.007 | 0.236 |
Insert response time histogram: each cell has the percentage of responses that take <= the time in the header and max is the max response time in seconds. For max values in the top 25% of the range have a red background and in the bottom 25% of the range have a green background. The red background is not used when the min value is within 80% of the max value.
| dbms | 256us | 1ms | 4ms | 16ms | 64ms | 256ms | 1s | 4s | 16s | gt | max |
|---|---|---|---|---|---|---|---|---|---|---|---|
| my5651_rel.cy10a_4g_gcp_c2s30 | 38.715 | 57.142 | 4.135 | 0.007 | 0.075 | ||||||
| my5651_rel.cy10a1_4g_gcp_c2s30 | 38.847 | 56.580 | 4.566 | 0.007 | 0.067 | ||||||
| my5651_rel.cy10a2_4g_gcp_c2s30 | 40.448 | 54.802 | 4.712 | 0.038 | 0.220 |
Delete response time histogram: each cell has the percentage of responses that take <= the time in the header and max is the max response time in seconds. For max values in the top 25% of the range have a red background and in the bottom 25% of the range have a green background. The red background is not used when the min value is within 80% of the max value.
| dbms | 256us | 1ms | 4ms | 16ms | 64ms | 256ms | 1s | 4s | 16s | gt | max |
|---|---|---|---|---|---|---|---|---|---|---|---|
| my5651_rel.cy10a_4g_gcp_c2s30 | 39.788 | 56.306 | 3.882 | 0.024 | 0.209 | ||||||
| my5651_rel.cy10a1_4g_gcp_c2s30 | 0.003 | 39.622 | 55.851 | 4.521 | 0.003 | 0.076 | |||||
| my5651_rel.cy10a2_4g_gcp_c2s30 | 0.003 | 40.979 | 54.438 | 4.542 | 0.038 | 0.228 |
Performance metrics for the DBMS listed above. Some are normalized by throughput, others are not. Legend for results is here.
ips	qps	rps	rmbps	wps	wmbps	rpq	rkbpq	wpi	wkbpi	csps	cpups	cspq	cpupq	dbgb1	dbgb2	rss	maxop	p50	p99	tag
780	2850	33	0.3	14371.1	314.4	0.012	0.107	18.415	412.596	143645	22.9	50.400	1205	40.9	175.5	4.3	0.180	368	80	160m.my5651_rel.cy10a_4g_gcp_c2s30
782	2790	33	0.3	13915.8	304.2	0.012	0.110	17.793	398.231	128930	22.7	46.208	1220	41.0	175.6	4.3	0.328	352	64	160m.my5651_rel.cy10a1_4g_gcp_c2s30
775	2775	34	0.3	14328.2	315.2	0.012	0.122	18.478	416.192	139846	22.1	50.388	1194	40.9	175.6	4.3	0.236	352	96	160m.my5651_rel.cy10a2_4g_gcp_c2s30
q500.1
q500.1: range queries with 500 insert/s per client. Graphs for performance per 1-second interval are here.
Average throughput:
Query response time histogram: each cell has the percentage of responses that take <= the time in the header and max is the max response time in seconds. For max values in the top 25% of the range have a red background and in the bottom 25% of the range have a green background. The red background is not used when the min value is within 80% of the max value.
| dbms | 256us | 1ms | 4ms | 16ms | 64ms | 256ms | 1s | 4s | 16s | gt | max |
|---|---|---|---|---|---|---|---|---|---|---|---|
| my5651_rel.cy10a_4g_gcp_c2s30 | 24.995 | 22.166 | 20.396 | 26.252 | 6.175 | 0.016 | nonzero | 0.268 | |||
| my5651_rel.cy10a1_4g_gcp_c2s30 | 23.952 | 24.142 | 20.873 | 24.120 | 6.872 | 0.041 | 0.231 | ||||
| my5651_rel.cy10a2_4g_gcp_c2s30 | 25.773 | 21.619 | 20.101 | 26.137 | 6.350 | 0.020 | nonzero | 0.268 |
Insert response time histogram: each cell has the percentage of responses that take <= the time in the header and max is the max response time in seconds. For max values in the top 25% of the range have a red background and in the bottom 25% of the range have a green background. The red background is not used when the min value is within 80% of the max value.
| dbms | 256us | 1ms | 4ms | 16ms | 64ms | 256ms | 1s | 4s | 16s | gt | max |
|---|---|---|---|---|---|---|---|---|---|---|---|
| my5651_rel.cy10a_4g_gcp_c2s30 | 40.314 | 50.576 | 9.108 | 0.002 | 0.069 | ||||||
| my5651_rel.cy10a1_4g_gcp_c2s30 | 12.097 | 57.088 | 30.561 | 0.253 | 0.142 | ||||||
| my5651_rel.cy10a2_4g_gcp_c2s30 | 40.447 | 50.994 | 8.553 | 0.006 | 0.084 |
Delete response time histogram: each cell has the percentage of responses that take <= the time in the header and max is the max response time in seconds. For max values in the top 25% of the range have a red background and in the bottom 25% of the range have a green background. The red background is not used when the min value is within 80% of the max value.
| dbms | 256us | 1ms | 4ms | 16ms | 64ms | 256ms | 1s | 4s | 16s | gt | max |
|---|---|---|---|---|---|---|---|---|---|---|---|
| my5651_rel.cy10a_4g_gcp_c2s30 | 0.003 | 39.629 | 51.115 | 9.250 | 0.003 | 0.086 | |||||
| my5651_rel.cy10a1_4g_gcp_c2s30 | 12.492 | 57.163 | 30.141 | 0.204 | 0.142 | ||||||
| my5651_rel.cy10a2_4g_gcp_c2s30 | 0.002 | 39.789 | 51.478 | 8.728 | 0.003 | 0.084 |
Performance metrics for the DBMS listed above. Some are normalized by throughput, others are not. Legend for results is here.
ips	qps	rps	rmbps	wps	wmbps	rpq	rkbpq	wpi	wkbpi	csps	cpups	cspq	cpupq	dbgb1	dbgb2	rss	maxop	p50	p99	tag
3943	1893	151	1.0	16096.6	356.5	0.080	0.558	4.082	92.586	143967	16.4	76.048	1299	40.9	175.5	4.3	0.268	240	176	160m.my5651_rel.cy10a_4g_gcp_c2s30
3945	1841	176	1.5	15311.9	344.0	0.095	0.811	3.881	89.299	129591	18.2	70.376	1483	41.0	175.6	4.4	0.231	224	160	160m.my5651_rel.cy10a1_4g_gcp_c2s30
3943	1873	148	1.0	15583.6	350.4	0.079	0.545	3.952	90.989	133608	16.2	71.345	1298	40.9	175.6	4.3	0.268	240	160	160m.my5651_rel.cy10a2_4g_gcp_c2s30
q1000.1
q1000.1: range queries with 1000 insert/s per client. Graphs for performance per 1-second interval are here.
Average throughput:
Query response time histogram: each cell has the percentage of responses that take <= the time in the header and max is the max response time in seconds. For max values in the top 25% of the range have a red background and in the bottom 25% of the range have a green background. The red background is not used when the min value is within 80% of the max value.
| dbms | 256us | 1ms | 4ms | 16ms | 64ms | 256ms | 1s | 4s | 16s | gt | max |
|---|---|---|---|---|---|---|---|---|---|---|---|
| my5651_rel.cy10a_4g_gcp_c2s30 | 14.353 | 19.626 | 19.268 | 32.650 | 14.004 | 0.098 | nonzero | 0.381 | |||
| my5651_rel.cy10a1_4g_gcp_c2s30 | 14.169 | 21.001 | 20.133 | 31.012 | 13.468 | 0.215 | 0.003 | 0.903 | |||
| my5651_rel.cy10a2_4g_gcp_c2s30 | 15.066 | 19.645 | 18.961 | 32.072 | 14.139 | 0.115 | 0.001 | 0.530 |
Insert response time histogram: each cell has the percentage of responses that take <= the time in the header and max is the max response time in seconds. For max values in the top 25% of the range have a red background and in the bottom 25% of the range have a green background. The red background is not used when the min value is within 80% of the max value.
| dbms | 256us | 1ms | 4ms | 16ms | 64ms | 256ms | 1s | 4s | 16s | gt | max |
|---|---|---|---|---|---|---|---|---|---|---|---|
| my5651_rel.cy10a_4g_gcp_c2s30 | 14.494 | 45.655 | 39.311 | 0.529 | 0.012 | 0.659 | |||||
| my5651_rel.cy10a1_4g_gcp_c2s30 | 3.377 | 35.315 | 59.009 | 2.158 | 0.141 | 0.708 | |||||
| my5651_rel.cy10a2_4g_gcp_c2s30 | 21.233 | 48.276 | 29.952 | 0.534 | 0.004 | 0.737 |
Delete response time histogram: each cell has the percentage of responses that take <= the time in the header and max is the max response time in seconds. For max values in the top 25% of the range have a red background and in the bottom 25% of the range have a green background. The red background is not used when the min value is within 80% of the max value.
| dbms | 256us | 1ms | 4ms | 16ms | 64ms | 256ms | 1s | 4s | 16s | gt | max |
|---|---|---|---|---|---|---|---|---|---|---|---|
| my5651_rel.cy10a_4g_gcp_c2s30 | 14.830 | 45.956 | 38.808 | 0.400 | 0.006 | 0.443 | |||||
| my5651_rel.cy10a1_4g_gcp_c2s30 | 3.348 | 36.404 | 58.316 | 1.842 | 0.090 | 0.770 | |||||
| my5651_rel.cy10a2_4g_gcp_c2s30 | 21.290 | 48.396 | 29.874 | 0.435 | 0.004 | 0.940 |
Performance metrics for the DBMS listed above. Some are normalized by throughput, others are not. Legend for results is here.
ips	qps	rps	rmbps	wps	wmbps	rpq	rkbpq	wpi	wkbpi	csps	cpups	cspq	cpupq	dbgb1	dbgb2	rss	maxop	p50	p99	tag
7843	1155	320	2.0	16634.9	414.8	0.277	1.809	2.121	54.157	136518	22.2	118.197	2883	41.4	176.5	4.3	0.381	144	64	160m.my5651_rel.cy10a_4g_gcp_c2s30
7856	1157	338	2.4	15994.2	401.1	0.292	2.147	2.036	52.279	128818	24.5	111.319	3176	41.5	176.8	4.3	0.903	144	48	160m.my5651_rel.cy10a1_4g_gcp_c2s30
7826	1142	310	1.9	16118.8	414.0	0.272	1.725	2.060	54.173	128996	21.3	113.006	2799	41.5	176.6	4.3	0.530	144	48	160m.my5651_rel.cy10a2_4g_gcp_c2s30
l.i0
l.i0: load without secondary indexes
Performance metrics for all DBMS, not just the ones listed above. Some are normalized by throughput, others are not. Legend for results is here.
ips	qps	rps	rmbps	wps	wmbps	rpq	rkbpq	wpi	wkbpi	csps	cpups	cspq	cpupq	dbgb1	dbgb2	rss	maxop	p50	p99	tag
422164	0	3331	13.0	354.5	101.7	0.008	0.032	0.001	0.247	89623	42.6	0.212	15	10.6	139.1	4.3	0.206	54440	43053	160m.my5651_rel.cy10a_4g_gcp_c2s30
421053	0	3313	12.9	355.7	102.1	0.008	0.031	0.001	0.248	86875	42.4	0.206	15	10.6	139.1	4.3	0.227	54341	41854	160m.my5651_rel.cy10a1_4g_gcp_c2s30
422164	0	3306	12.9	359.3	103.0	0.008	0.031	0.001	0.250	88940	42.3	0.211	15	10.6	139.1	4.3	0.211	54441	43453	160m.my5651_rel.cy10a2_4g_gcp_c2s30
l.x
l.x: create secondary indexes
Performance metrics for all DBMS, not just the ones listed above. Some are normalized by throughput, others are not. Legend for results is here.
ips	qps	rps	rmbps	wps	wmbps	rpq	rkbpq	wpi	wkbpi	csps	cpups	cspq	cpupq	dbgb1	dbgb2	rss	maxop	p50	p99	tag
608745	0	277	1.1	3217.0	574.5	0.000	0.002	0.005	0.966	27489	39.8	0.045	10	21.7	150.2	4.3	0.002	NA	NA	160m.my5651_rel.cy10a_4g_gcp_c2s30
604151	0	275	1.1	3187.4	565.9	0.000	0.002	0.005	0.959	19301	39.1	0.032	10	21.7	150.2	4.4	0.003	NA	NA	160m.my5651_rel.cy10a1_4g_gcp_c2s30
613410	0	269	1.1	3141.1	570.8	0.000	0.002	0.005	0.953	26662	39.6	0.043	10	21.7	150.2	4.3	0.003	NA	NA	160m.my5651_rel.cy10a2_4g_gcp_c2s30
l.i1
l.i1: continue load after secondary indexes created
Performance metrics for all DBMS, not just the ones listed above. Some are normalized by throughput, others are not. Legend for results is here.
ips	qps	rps	rmbps	wps	wmbps	rpq	rkbpq	wpi	wkbpi	csps	cpups	cspq	cpupq	dbgb1	dbgb2	rss	maxop	p50	p99	tag
14388	0	482	2.4	14977.2	458.3	0.034	0.171	1.041	32.616	150649	34.0	10.470	354	40.9	175.5	4.3	0.791	1848	200	160m.my5651_rel.cy10a_4g_gcp_c2s30
14785	0	494	2.5	14870.2	472.3	0.033	0.171	1.006	32.710	132686	35.3	8.975	358	41.0	175.6	4.3	0.837	1898	200	160m.my5651_rel.cy10a1_4g_gcp_c2s30
13212	0	448	2.3	14979.5	455.1	0.034	0.175	1.134	35.274	148685	31.9	11.254	362	40.9	175.6	4.3	1.024	1699	200	160m.my5651_rel.cy10a2_4g_gcp_c2s30
q100.1
q100.1: range queries with 100 insert/s per client
Performance metrics for all DBMS, not just the ones listed above. Some are normalized by throughput, others are not. Legend for results is here.
ips	qps	rps	rmbps	wps	wmbps	rpq	rkbpq	wpi	wkbpi	csps	cpups	cspq	cpupq	dbgb1	dbgb2	rss	maxop	p50	p99	tag
780	2850	33	0.3	14371.1	314.4	0.012	0.107	18.415	412.596	143645	22.9	50.400	1205	40.9	175.5	4.3	0.180	368	80	160m.my5651_rel.cy10a_4g_gcp_c2s30
782	2790	33	0.3	13915.8	304.2	0.012	0.110	17.793	398.231	128930	22.7	46.208	1220	41.0	175.6	4.3	0.328	352	64	160m.my5651_rel.cy10a1_4g_gcp_c2s30
775	2775	34	0.3	14328.2	315.2	0.012	0.122	18.478	416.192	139846	22.1	50.388	1194	40.9	175.6	4.3	0.236	352	96	160m.my5651_rel.cy10a2_4g_gcp_c2s30
q500.1
q500.1: range queries with 500 insert/s per client
Performance metrics for all DBMS, not just the ones listed above. Some are normalized by throughput, others are not. Legend for results is here.
ips	qps	rps	rmbps	wps	wmbps	rpq	rkbpq	wpi	wkbpi	csps	cpups	cspq	cpupq	dbgb1	dbgb2	rss	maxop	p50	p99	tag
3943	1893	151	1.0	16096.6	356.5	0.080	0.558	4.082	92.586	143967	16.4	76.048	1299	40.9	175.5	4.3	0.268	240	176	160m.my5651_rel.cy10a_4g_gcp_c2s30
3945	1841	176	1.5	15311.9	344.0	0.095	0.811	3.881	89.299	129591	18.2	70.376	1483	41.0	175.6	4.4	0.231	224	160	160m.my5651_rel.cy10a1_4g_gcp_c2s30
3943	1873	148	1.0	15583.6	350.4	0.079	0.545	3.952	90.989	133608	16.2	71.345	1298	40.9	175.6	4.3	0.268	240	160	160m.my5651_rel.cy10a2_4g_gcp_c2s30
q1000.1
q1000.1: range queries with 1000 insert/s per client
Performance metrics for all DBMS, not just the ones listed above. Some are normalized by throughput, others are not. Legend for results is here.
ips	qps	rps	rmbps	wps	wmbps	rpq	rkbpq	wpi	wkbpi	csps	cpups	cspq	cpupq	dbgb1	dbgb2	rss	maxop	p50	p99	tag
7843	1155	320	2.0	16634.9	414.8	0.277	1.809	2.121	54.157	136518	22.2	118.197	2883	41.4	176.5	4.3	0.381	144	64	160m.my5651_rel.cy10a_4g_gcp_c2s30
7856	1157	338	2.4	15994.2	401.1	0.292	2.147	2.036	52.279	128818	24.5	111.319	3176	41.5	176.8	4.3	0.903	144	48	160m.my5651_rel.cy10a1_4g_gcp_c2s30
7826	1142	310	1.9	16118.8	414.0	0.272	1.725	2.060	54.173	128996	21.3	113.006	2799	41.5	176.6	4.3	0.530	144	48	160m.my5651_rel.cy10a2_4g_gcp_c2s30
l.i0
- l.i0: load without secondary indexes
- Legend for results is here.
- Each entry lists the percentage of responses that fit in that bucket (slower than max time for previous bucket, faster than min time for next bucket).
Insert response time histogram
256us	1ms	4ms	16ms	64ms	256ms	1s	4s	16s	gt	max	tag
0.000	2.307	97.300	0.216	0.163	0.014	0.000	0.000	0.000	0.000	0.206	my5651_rel.cy10a_4g_gcp_c2s30
0.000	2.213	97.386	0.221	0.165	0.014	0.000	0.000	0.000	0.000	0.227	my5651_rel.cy10a1_4g_gcp_c2s30
0.000	2.270	97.335	0.221	0.161	0.014	0.000	0.000	0.000	0.000	0.211	my5651_rel.cy10a2_4g_gcp_c2s30
l.x
- l.x: create secondary indexes
- Legend for results is here.
- Each entry lists the percentage of responses that fit in that bucket (slower than max time for previous bucket, faster than min time for next bucket).
TODO - determine whether there is data for create index response time
l.i1
- l.i1: continue load after secondary indexes created
- Legend for results is here.
- Each entry lists the percentage of responses that fit in that bucket (slower than max time for previous bucket, faster than min time for next bucket).
Insert response time histogram
256us	1ms	4ms	16ms	64ms	256ms	1s	4s	16s	gt	max	tag
0.000	0.000	0.742	27.644	67.640	3.737	0.237	0.000	0.000	0.000	0.791	my5651_rel.cy10a_4g_gcp_c2s30
0.000	0.000	0.669	32.602	62.987	3.302	0.440	0.000	0.000	0.000	0.837	my5651_rel.cy10a1_4g_gcp_c2s30
0.000	0.000	1.084	26.263	65.578	6.802	0.273	nonzero	0.000	0.000	1.024	my5651_rel.cy10a2_4g_gcp_c2s30
Delete response time histogram
256us	1ms	4ms	16ms	64ms	256ms	1s	4s	16s	gt	max	tag
0.000	0.001	1.172	30.721	65.338	2.748	0.019	0.000	0.000	0.000	0.469	my5651_rel.cy10a_4g_gcp_c2s30
0.000	0.001	1.134	35.854	60.411	2.417	0.183	0.000	0.000	0.000	0.561	my5651_rel.cy10a1_4g_gcp_c2s30
0.000	0.001	1.467	29.084	63.768	5.640	0.039	0.000	0.000	0.000	0.541	my5651_rel.cy10a2_4g_gcp_c2s30
q100.1
- q100.1: range queries with 100 insert/s per client
- Legend for results is here.
- Each entry lists the percentage of responses that fit in that bucket (slower than max time for previous bucket, faster than min time for next bucket).
Query response time histogram
256us	1ms	4ms	16ms	64ms	256ms	1s	4s	16s	gt	max	tag
27.041	23.203	27.740	19.571	2.439	0.006	0.000	0.000	0.000	0.000	0.180	my5651_rel.cy10a_4g_gcp_c2s30
26.955	24.081	27.440	18.660	2.856	0.008	nonzero	0.000	0.000	0.000	0.328	my5651_rel.cy10a1_4g_gcp_c2s30
27.044	23.654	27.543	18.925	2.828	0.007	0.000	0.000	0.000	0.000	0.236	my5651_rel.cy10a2_4g_gcp_c2s30
Insert response time histogram
256us	1ms	4ms	16ms	64ms	256ms	1s	4s	16s	gt	max	tag
0.000	0.000	38.715	57.142	4.135	0.007	0.000	0.000	0.000	0.000	0.075	my5651_rel.cy10a_4g_gcp_c2s30
0.000	0.000	38.847	56.580	4.566	0.007	0.000	0.000	0.000	0.000	0.067	my5651_rel.cy10a1_4g_gcp_c2s30
0.000	0.000	40.448	54.802	4.712	0.038	0.000	0.000	0.000	0.000	0.220	my5651_rel.cy10a2_4g_gcp_c2s30
Delete response time histogram
256us	1ms	4ms	16ms	64ms	256ms	1s	4s	16s	gt	max	tag
0.000	0.000	39.788	56.306	3.882	0.024	0.000	0.000	0.000	0.000	0.209	my5651_rel.cy10a_4g_gcp_c2s30
0.000	0.003	39.622	55.851	4.521	0.003	0.000	0.000	0.000	0.000	0.076	my5651_rel.cy10a1_4g_gcp_c2s30
0.000	0.003	40.979	54.438	4.542	0.038	0.000	0.000	0.000	0.000	0.228	my5651_rel.cy10a2_4g_gcp_c2s30
q500.1
- q500.1: range queries with 500 insert/s per client
- Legend for results is here.
- Each entry lists the percentage of responses that fit in that bucket (slower than max time for previous bucket, faster than min time for next bucket).
Query response time histogram
256us	1ms	4ms	16ms	64ms	256ms	1s	4s	16s	gt	max	tag
24.995	22.166	20.396	26.252	6.175	0.016	nonzero	0.000	0.000	0.000	0.268	my5651_rel.cy10a_4g_gcp_c2s30
23.952	24.142	20.873	24.120	6.872	0.041	0.000	0.000	0.000	0.000	0.231	my5651_rel.cy10a1_4g_gcp_c2s30
25.773	21.619	20.101	26.137	6.350	0.020	nonzero	0.000	0.000	0.000	0.268	my5651_rel.cy10a2_4g_gcp_c2s30
Insert response time histogram
256us	1ms	4ms	16ms	64ms	256ms	1s	4s	16s	gt	max	tag
0.000	0.000	40.314	50.576	9.108	0.002	0.000	0.000	0.000	0.000	0.069	my5651_rel.cy10a_4g_gcp_c2s30
0.000	0.000	12.097	57.088	30.561	0.253	0.000	0.000	0.000	0.000	0.142	my5651_rel.cy10a1_4g_gcp_c2s30
0.000	0.000	40.447	50.994	8.553	0.006	0.000	0.000	0.000	0.000	0.084	my5651_rel.cy10a2_4g_gcp_c2s30
Delete response time histogram
256us	1ms	4ms	16ms	64ms	256ms	1s	4s	16s	gt	max	tag
0.000	0.003	39.629	51.115	9.250	0.003	0.000	0.000	0.000	0.000	0.086	my5651_rel.cy10a_4g_gcp_c2s30
0.000	0.000	12.492	57.163	30.141	0.204	0.000	0.000	0.000	0.000	0.142	my5651_rel.cy10a1_4g_gcp_c2s30
0.000	0.002	39.789	51.478	8.728	0.003	0.000	0.000	0.000	0.000	0.084	my5651_rel.cy10a2_4g_gcp_c2s30
q1000.1
- q1000.1: range queries with 1000 insert/s per client
- Legend for results is here.
- Each entry lists the percentage of responses that fit in that bucket (slower than max time for previous bucket, faster than min time for next bucket).
Query response time histogram
256us	1ms	4ms	16ms	64ms	256ms	1s	4s	16s	gt	max	tag
14.353	19.626	19.268	32.650	14.004	0.098	nonzero	0.000	0.000	0.000	0.381	my5651_rel.cy10a_4g_gcp_c2s30
14.169	21.001	20.133	31.012	13.468	0.215	0.003	0.000	0.000	0.000	0.903	my5651_rel.cy10a1_4g_gcp_c2s30
15.066	19.645	18.961	32.072	14.139	0.115	0.001	0.000	0.000	0.000	0.530	my5651_rel.cy10a2_4g_gcp_c2s30
Insert response time histogram
256us	1ms	4ms	16ms	64ms	256ms	1s	4s	16s	gt	max	tag
0.000	0.000	14.494	45.655	39.311	0.529	0.012	0.000	0.000	0.000	0.659	my5651_rel.cy10a_4g_gcp_c2s30
0.000	0.000	3.377	35.315	59.009	2.158	0.141	0.000	0.000	0.000	0.708	my5651_rel.cy10a1_4g_gcp_c2s30
0.000	0.000	21.233	48.276	29.952	0.534	0.004	0.000	0.000	0.000	0.737	my5651_rel.cy10a2_4g_gcp_c2s30
Delete response time histogram
256us	1ms	4ms	16ms	64ms	256ms	1s	4s	16s	gt	max	tag
0.000	0.000	14.830	45.956	38.808	0.400	0.006	0.000	0.000	0.000	0.443	my5651_rel.cy10a_4g_gcp_c2s30
0.000	0.000	3.348	36.404	58.316	1.842	0.090	0.000	0.000	0.000	0.770	my5651_rel.cy10a1_4g_gcp_c2s30
0.000	0.000	21.290	48.396	29.874	0.435	0.004	0.000	0.000	0.000	0.940	my5651_rel.cy10a2_4g_gcp_c2s30