Introduction
This is a report for the insert benchmark with 800M docs and 4 client(s). It is generated by scripts (bash, awk, sed) and Tufte might not be impressed. An overview of the insert benchmark is here and a short update is here. Below, by DBMS, I mean DBMS+version.config. An example is my8020.c10b40 where my means MySQL, 8020 is version 8.0.20 and c10b40 is the name for the configuration file.
The test server has 8 AMD cores, 16G RAM and an NVMe SSD. It is described here as the Beelink. The benchmark was run with 4 clients and there were 1 or 3 connections per client (1 for queries or inserts without rate limits, 1+1 for rate limited inserts+deletes). It uses 4 tables, with a client per table. It loads 200M rows per table without secondary indexes, creates secondary indexes, then inserts 50M rows per table with a delete per insert to avoid growing the table. It then does 3 read+write tests for 1800s each that do queries as fast as possible with 100, 500 and then 1000 inserts/second/client concurrent with the queries and 1000 deletes/second to avoid growing the table. The database is larger than memory. Clients and the DBMS share one server. The per-database configs are in the per-database subdirectories here.
The tested DBMS are:
- fbmy5635_rel.cy10a_bee - MyRocks 5.6.35, the cy10a_bee config and compiled with CMAKE_BUILD_TYPE=Release: -O3
- fbmy8028_rel_native_lto.cy10a_bee - MyRocks 8.0.28, the cy10a_bee config and compiled with CMAKE_BUILD_TYPE=Release: -O3 -flto -march=native -mtune=native
Contents
- Summary
- l.i0: load without secondary indexes
- l.x: create secondary indexes
- l.i1: continue load after secondary indexes created
- q100.1: range queries with 100 insert/s per client
- q500.1: range queries with 500 insert/s per client
- q1000.1: range queries with 1000 insert/s per client
Summary
The numbers are inserts/s for l.i0 and l.i1, indexed docs (or rows) /s for l.x and queries/s for q*.2. The values are the average rate over the entire test for inserts (IPS) and queries (QPS). The range of values for IPS and QPS is split into 3 parts: bottom 25%, middle 50%, top 25%. Values in the bottom 25% have a red background, values in the top 25% have a green background and values in the middle have no color. A gray background is used for values that can be ignored because the DBMS did not sustain the target insert rate. Red backgrounds are not used when the minimum value is within 80% of the max value.
| dbms | l.i0 | l.x | l.i1 | q100.1 | q500.1 | q1000.1 |
|---|---|---|---|---|---|---|
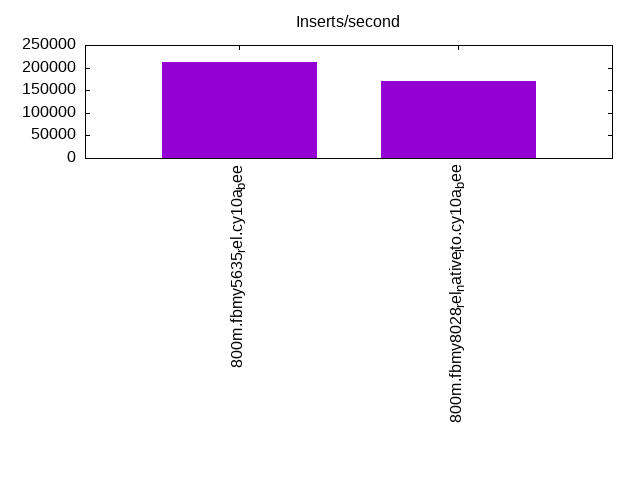
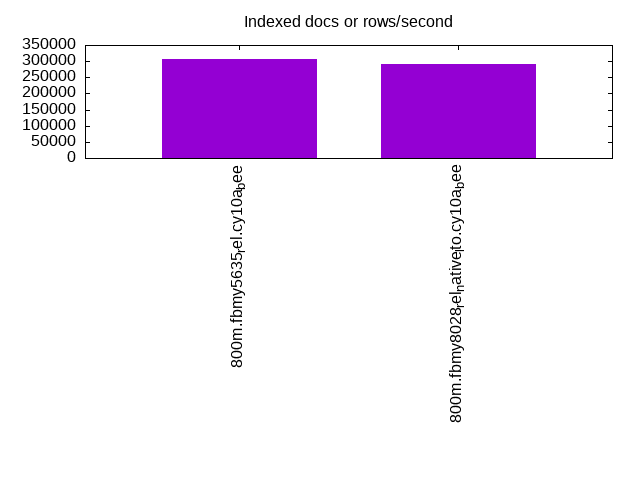
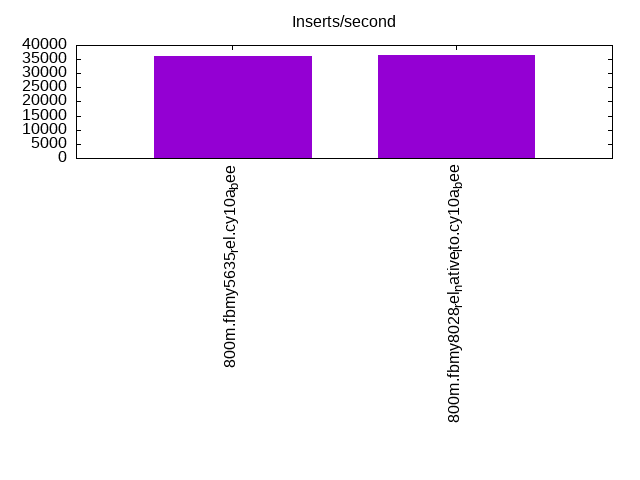
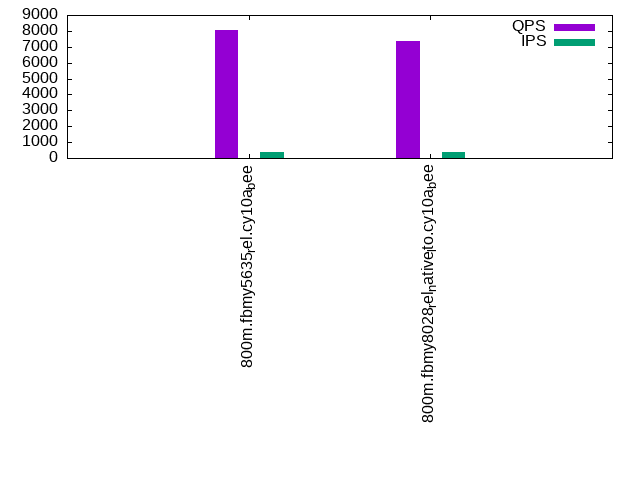
| 800m.fbmy5635_rel.cy10a_bee | 212427 | 307494 | 36062 | 8044 | 8322 | 8302 |
| 800m.fbmy8028_rel_native_lto.cy10a_bee | 169635 | 291794 | 36298 | 7369 | 7466 | 7457 |
This table has relative throughput, throughput for the DBMS relative to the DBMS in the first line, using the absolute throughput from the previous table.
| dbms | l.i0 | l.x | l.i1 | q100.1 | q500.1 | q1000.1 |
|---|---|---|---|---|---|---|
| 800m.fbmy5635_rel.cy10a_bee | 1.00 | 1.00 | 1.00 | 1.00 | 1.00 | 1.00 |
| 800m.fbmy8028_rel_native_lto.cy10a_bee | 0.80 | 0.95 | 1.01 | 0.92 | 0.90 | 0.90 |
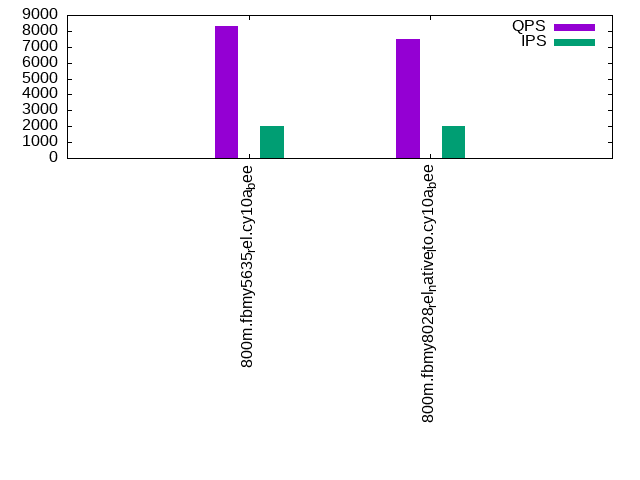
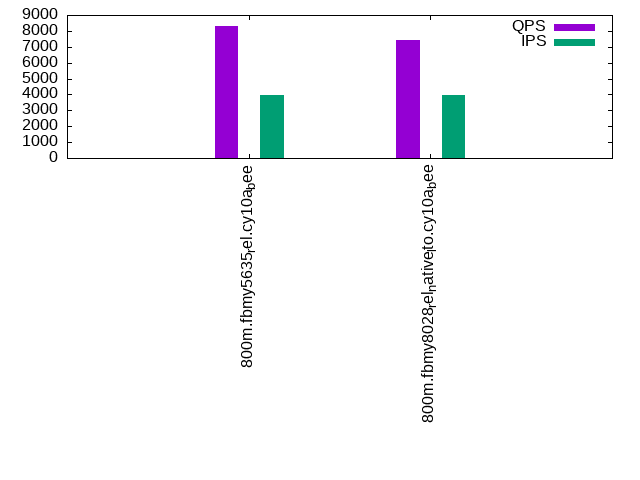
This lists the average rate of inserts/s for the tests that do inserts concurrent with queries. For such tests the query rate is listed in the table above. The read+write tests are setup so that the insert rate should match the target rate every second. Cells that are not at least 95% of the target have a red background to indicate a failure to satisfy the target.
| dbms | q100.1 | q500.1 | q1000.1 |
|---|---|---|---|
| fbmy5635_rel.cy10a_bee | 397 | 1984 | 3969 |
| fbmy8028_rel_native_lto.cy10a_bee | 398 | 1989 | 3978 |
| target | 400 | 2000 | 4000 |
l.i0
l.i0: load without secondary indexes. Graphs for performance per 1-second interval are here.
Average throughput:
Insert response time histogram: each cell has the percentage of responses that take <= the time in the header and max is the max response time in seconds. For the max column values in the top 25% of the range have a red background and in the bottom 25% of the range have a green background. The red background is not used when the min value is within 80% of the max value.
| dbms | 256us | 1ms | 4ms | 16ms | 64ms | 256ms | 1s | 4s | 16s | gt | max |
|---|---|---|---|---|---|---|---|---|---|---|---|
| fbmy5635_rel.cy10a_bee | 99.715 | 0.267 | 0.004 | 0.014 | 0.149 | ||||||
| fbmy8028_rel_native_lto.cy10a_bee | 99.227 | 0.564 | 0.194 | 0.014 | 0.148 |
Performance metrics for the DBMS listed above. Some are normalized by throughput, others are not. Legend for results is here.
ips	qps	rps	rmbps	wps	wmbps	rpq	rkbpq	wpi	wkbpi	csps	cpups	cspq	cpupq	dbgb1	dbgb2	rss	maxop	p50	p99	tag
212427	0	8	1.0	189.9	71.5	0.000	0.005	0.001	0.345	21149	79.9	0.100	30	25.0	25.7	5.0	0.149	53742	43752	800m.fbmy5635_rel.cy10a_bee
169635	0	9	1.0	172.8	62.0	0.000	0.006	0.001	0.374	17490	75.1	0.103	35	24.9	25.8	5.5	0.148	42557	35761	800m.fbmy8028_rel_native_lto.cy10a_bee
l.x
l.x: create secondary indexes.
Average throughput:
Performance metrics for the DBMS listed above. Some are normalized by throughput, others are not. Legend for results is here.
ips	qps	rps	rmbps	wps	wmbps	rpq	rkbpq	wpi	wkbpi	csps	cpups	cspq	cpupq	dbgb1	dbgb2	rss	maxop	p50	p99	tag
307494	0	255	64.5	127.0	45.9	0.001	0.215	0.000	0.153	868	47.9	0.003	12	52.9	53.6	8.8	0.004	NA	NA	800m.fbmy5635_rel.cy10a_bee
291794	0	272	75.8	128.4	43.7	0.001	0.266	0.000	0.153	955	48.3	0.003	13	52.8	53.7	10.6	0.010	NA	NA	800m.fbmy8028_rel_native_lto.cy10a_bee
l.i1
l.i1: continue load after secondary indexes created. Graphs for performance per 1-second interval are here.
Average throughput:
Insert response time histogram: each cell has the percentage of responses that take <= the time in the header and max is the max response time in seconds. For the max column values in the top 25% of the range have a red background and in the bottom 25% of the range have a green background. The red background is not used when the min value is within 80% of the max value.
| dbms | 256us | 1ms | 4ms | 16ms | 64ms | 256ms | 1s | 4s | 16s | gt | max |
|---|---|---|---|---|---|---|---|---|---|---|---|
| fbmy5635_rel.cy10a_bee | 18.719 | 81.106 | 0.161 | 0.014 | 0.173 | ||||||
| fbmy8028_rel_native_lto.cy10a_bee | 20.906 | 78.847 | 0.232 | 0.015 | 0.220 |
Delete response time histogram: each cell has the percentage of responses that take <= the time in the header and max is the max response time in seconds. For the max column values in the top 25% of the range have a red background and in the bottom 25% of the range have a green background. The red background is not used when the min value is within 80% of the max value.
| dbms | 256us | 1ms | 4ms | 16ms | 64ms | 256ms | 1s | 4s | 16s | gt | max |
|---|---|---|---|---|---|---|---|---|---|---|---|
| fbmy5635_rel.cy10a_bee | 13.998 | 85.779 | 0.209 | 0.015 | 0.174 | ||||||
| fbmy8028_rel_native_lto.cy10a_bee | 17.998 | 81.718 | 0.269 | 0.015 | 0.220 |
Performance metrics for the DBMS listed above. Some are normalized by throughput, others are not. Legend for results is here.
ips	qps	rps	rmbps	wps	wmbps	rpq	rkbpq	wpi	wkbpi	csps	cpups	cspq	cpupq	dbgb1	dbgb2	rss	maxop	p50	p99	tag
36062	0	608	50.1	232.2	84.8	0.017	1.423	0.006	2.409	15191	77.9	0.421	173	62.4	63.9	8.4	0.173	8940	7987	800m.fbmy5635_rel.cy10a_bee
36298	0	640	53.6	243.8	85.3	0.018	1.513	0.007	2.407	13730	81.7	0.378	180	62.1	63.8	8.7	0.220	8990	7748	800m.fbmy8028_rel_native_lto.cy10a_bee
q100.1
q100.1: range queries with 100 insert/s per client. Graphs for performance per 1-second interval are here.
Average throughput:
Query response time histogram: each cell has the percentage of responses that take <= the time in the header and max is the max response time in seconds. For max values in the top 25% of the range have a red background and in the bottom 25% of the range have a green background. The red background is not used when the min value is within 80% of the max value.
| dbms | 256us | 1ms | 4ms | 16ms | 64ms | 256ms | 1s | 4s | 16s | gt | max |
|---|---|---|---|---|---|---|---|---|---|---|---|
| fbmy5635_rel.cy10a_bee | 1.896 | 96.677 | 1.410 | 0.017 | nonzero | 0.050 | |||||
| fbmy8028_rel_native_lto.cy10a_bee | 0.423 | 97.026 | 2.530 | 0.021 | nonzero | nonzero | 0.067 |
Insert response time histogram: each cell has the percentage of responses that take <= the time in the header and max is the max response time in seconds. For max values in the top 25% of the range have a red background and in the bottom 25% of the range have a green background. The red background is not used when the min value is within 80% of the max value.
| dbms | 256us | 1ms | 4ms | 16ms | 64ms | 256ms | 1s | 4s | 16s | gt | max |
|---|---|---|---|---|---|---|---|---|---|---|---|
| fbmy5635_rel.cy10a_bee | 98.056 | 1.944 | 0.016 | ||||||||
| fbmy8028_rel_native_lto.cy10a_bee | 98.028 | 1.965 | 0.007 | 0.019 |
Delete response time histogram: each cell has the percentage of responses that take <= the time in the header and max is the max response time in seconds. For max values in the top 25% of the range have a red background and in the bottom 25% of the range have a green background. The red background is not used when the min value is within 80% of the max value.
| dbms | 256us | 1ms | 4ms | 16ms | 64ms | 256ms | 1s | 4s | 16s | gt | max |
|---|---|---|---|---|---|---|---|---|---|---|---|
| fbmy5635_rel.cy10a_bee | 97.319 | 2.681 | 0.016 | ||||||||
| fbmy8028_rel_native_lto.cy10a_bee | 97.326 | 2.667 | 0.007 | 0.029 |
Performance metrics for the DBMS listed above. Some are normalized by throughput, others are not. Legend for results is here.
ips	qps	rps	rmbps	wps	wmbps	rpq	rkbpq	wpi	wkbpi	csps	cpups	cspq	cpupq	dbgb1	dbgb2	rss	maxop	p50	p99	tag
397	8044	3494	34.5	25.0	7.5	0.434	4.394	0.063	19.289	36119	48.6	4.490	483	58.0	59.7	8.7	0.050	2030	1416	800m.fbmy5635_rel.cy10a_bee
398	7369	3489	34.8	25.1	7.5	0.473	4.840	0.063	19.419	33795	49.1	4.586	533	58.4	60.2	9.0	0.067	1838	1151	800m.fbmy8028_rel_native_lto.cy10a_bee
q500.1
q500.1: range queries with 500 insert/s per client. Graphs for performance per 1-second interval are here.
Average throughput:
Query response time histogram: each cell has the percentage of responses that take <= the time in the header and max is the max response time in seconds. For max values in the top 25% of the range have a red background and in the bottom 25% of the range have a green background. The red background is not used when the min value is within 80% of the max value.
| dbms | 256us | 1ms | 4ms | 16ms | 64ms | 256ms | 1s | 4s | 16s | gt | max |
|---|---|---|---|---|---|---|---|---|---|---|---|
| fbmy5635_rel.cy10a_bee | 1.953 | 97.159 | 0.880 | 0.008 | nonzero | 0.040 | |||||
| fbmy8028_rel_native_lto.cy10a_bee | 0.294 | 97.770 | 1.919 | 0.016 | nonzero | 0.052 |
Insert response time histogram: each cell has the percentage of responses that take <= the time in the header and max is the max response time in seconds. For max values in the top 25% of the range have a red background and in the bottom 25% of the range have a green background. The red background is not used when the min value is within 80% of the max value.
| dbms | 256us | 1ms | 4ms | 16ms | 64ms | 256ms | 1s | 4s | 16s | gt | max |
|---|---|---|---|---|---|---|---|---|---|---|---|
| fbmy5635_rel.cy10a_bee | 99.240 | 0.749 | 0.010 | 0.001 | 0.066 | ||||||
| fbmy8028_rel_native_lto.cy10a_bee | 95.088 | 4.876 | 0.033 | 0.003 | 0.105 |
Delete response time histogram: each cell has the percentage of responses that take <= the time in the header and max is the max response time in seconds. For max values in the top 25% of the range have a red background and in the bottom 25% of the range have a green background. The red background is not used when the min value is within 80% of the max value.
| dbms | 256us | 1ms | 4ms | 16ms | 64ms | 256ms | 1s | 4s | 16s | gt | max |
|---|---|---|---|---|---|---|---|---|---|---|---|
| fbmy5635_rel.cy10a_bee | 99.149 | 0.840 | 0.010 | 0.001 | 0.065 | ||||||
| fbmy8028_rel_native_lto.cy10a_bee | 95.132 | 4.829 | 0.037 | 0.001 | 0.090 |
Performance metrics for the DBMS listed above. Some are normalized by throughput, others are not. Legend for results is here.
ips	qps	rps	rmbps	wps	wmbps	rpq	rkbpq	wpi	wkbpi	csps	cpups	cspq	cpupq	dbgb1	dbgb2	rss	maxop	p50	p99	tag
1984	8322	2883	25.6	18.5	5.4	0.346	3.151	0.009	2.777	36370	49.1	4.371	472	58.2	58.6	8.7	0.040	2094	1902	800m.fbmy5635_rel.cy10a_bee
1989	7466	3022	27.4	21.6	6.3	0.405	3.755	0.011	3.243	33361	49.8	4.468	534	58.1	58.7	9.1	0.052	1838	1679	800m.fbmy8028_rel_native_lto.cy10a_bee
q1000.1
q1000.1: range queries with 1000 insert/s per client. Graphs for performance per 1-second interval are here.
Average throughput:
Query response time histogram: each cell has the percentage of responses that take <= the time in the header and max is the max response time in seconds. For max values in the top 25% of the range have a red background and in the bottom 25% of the range have a green background. The red background is not used when the min value is within 80% of the max value.
| dbms | 256us | 1ms | 4ms | 16ms | 64ms | 256ms | 1s | 4s | 16s | gt | max |
|---|---|---|---|---|---|---|---|---|---|---|---|
| fbmy5635_rel.cy10a_bee | 1.358 | 97.715 | 0.906 | 0.020 | nonzero | 0.056 | |||||
| fbmy8028_rel_native_lto.cy10a_bee | 0.161 | 97.960 | 1.854 | 0.025 | nonzero | 0.039 |
Insert response time histogram: each cell has the percentage of responses that take <= the time in the header and max is the max response time in seconds. For max values in the top 25% of the range have a red background and in the bottom 25% of the range have a green background. The red background is not used when the min value is within 80% of the max value.
| dbms | 256us | 1ms | 4ms | 16ms | 64ms | 256ms | 1s | 4s | 16s | gt | max |
|---|---|---|---|---|---|---|---|---|---|---|---|
| fbmy5635_rel.cy10a_bee | 98.238 | 1.739 | 0.020 | 0.003 | 0.077 | ||||||
| fbmy8028_rel_native_lto.cy10a_bee | 92.558 | 7.388 | 0.047 | 0.007 | 0.146 |
Delete response time histogram: each cell has the percentage of responses that take <= the time in the header and max is the max response time in seconds. For max values in the top 25% of the range have a red background and in the bottom 25% of the range have a green background. The red background is not used when the min value is within 80% of the max value.
| dbms | 256us | 1ms | 4ms | 16ms | 64ms | 256ms | 1s | 4s | 16s | gt | max |
|---|---|---|---|---|---|---|---|---|---|---|---|
| fbmy5635_rel.cy10a_bee | 98.155 | 1.815 | 0.027 | 0.003 | 0.078 | ||||||
| fbmy8028_rel_native_lto.cy10a_bee | 92.431 | 7.505 | 0.057 | 0.007 | 0.102 |
Performance metrics for the DBMS listed above. Some are normalized by throughput, others are not. Legend for results is here.
ips	qps	rps	rmbps	wps	wmbps	rpq	rkbpq	wpi	wkbpi	csps	cpups	cspq	cpupq	dbgb1	dbgb2	rss	maxop	p50	p99	tag
3969	8302	3256	31.7	40.1	12.6	0.392	3.911	0.010	3.244	35709	53.6	4.301	516	58.2	60.2	8.8	0.056	2078	1886	800m.fbmy5635_rel.cy10a_bee
3978	7457	3310	31.7	40.1	12.4	0.444	4.348	0.010	3.185	32937	54.1	4.417	580	58.2	60.3	9.2	0.039	1838	1694	800m.fbmy8028_rel_native_lto.cy10a_bee
l.i0
l.i0: load without secondary indexes
Performance metrics for all DBMS, not just the ones listed above. Some are normalized by throughput, others are not. Legend for results is here.
ips	qps	rps	rmbps	wps	wmbps	rpq	rkbpq	wpi	wkbpi	csps	cpups	cspq	cpupq	dbgb1	dbgb2	rss	maxop	p50	p99	tag
212427	0	8	1.0	189.9	71.5	0.000	0.005	0.001	0.345	21149	79.9	0.100	30	25.0	25.7	5.0	0.149	53742	43752	800m.fbmy5635_rel.cy10a_bee
169635	0	9	1.0	172.8	62.0	0.000	0.006	0.001	0.374	17490	75.1	0.103	35	24.9	25.8	5.5	0.148	42557	35761	800m.fbmy8028_rel_native_lto.cy10a_bee
l.x
l.x: create secondary indexes
Performance metrics for all DBMS, not just the ones listed above. Some are normalized by throughput, others are not. Legend for results is here.
ips	qps	rps	rmbps	wps	wmbps	rpq	rkbpq	wpi	wkbpi	csps	cpups	cspq	cpupq	dbgb1	dbgb2	rss	maxop	p50	p99	tag
307494	0	255	64.5	127.0	45.9	0.001	0.215	0.000	0.153	868	47.9	0.003	12	52.9	53.6	8.8	0.004	NA	NA	800m.fbmy5635_rel.cy10a_bee
291794	0	272	75.8	128.4	43.7	0.001	0.266	0.000	0.153	955	48.3	0.003	13	52.8	53.7	10.6	0.010	NA	NA	800m.fbmy8028_rel_native_lto.cy10a_bee
l.i1
l.i1: continue load after secondary indexes created
Performance metrics for all DBMS, not just the ones listed above. Some are normalized by throughput, others are not. Legend for results is here.
ips	qps	rps	rmbps	wps	wmbps	rpq	rkbpq	wpi	wkbpi	csps	cpups	cspq	cpupq	dbgb1	dbgb2	rss	maxop	p50	p99	tag
36062	0	608	50.1	232.2	84.8	0.017	1.423	0.006	2.409	15191	77.9	0.421	173	62.4	63.9	8.4	0.173	8940	7987	800m.fbmy5635_rel.cy10a_bee
36298	0	640	53.6	243.8	85.3	0.018	1.513	0.007	2.407	13730	81.7	0.378	180	62.1	63.8	8.7	0.220	8990	7748	800m.fbmy8028_rel_native_lto.cy10a_bee
q100.1
q100.1: range queries with 100 insert/s per client
Performance metrics for all DBMS, not just the ones listed above. Some are normalized by throughput, others are not. Legend for results is here.
ips	qps	rps	rmbps	wps	wmbps	rpq	rkbpq	wpi	wkbpi	csps	cpups	cspq	cpupq	dbgb1	dbgb2	rss	maxop	p50	p99	tag
397	8044	3494	34.5	25.0	7.5	0.434	4.394	0.063	19.289	36119	48.6	4.490	483	58.0	59.7	8.7	0.050	2030	1416	800m.fbmy5635_rel.cy10a_bee
398	7369	3489	34.8	25.1	7.5	0.473	4.840	0.063	19.419	33795	49.1	4.586	533	58.4	60.2	9.0	0.067	1838	1151	800m.fbmy8028_rel_native_lto.cy10a_bee
q500.1
q500.1: range queries with 500 insert/s per client
Performance metrics for all DBMS, not just the ones listed above. Some are normalized by throughput, others are not. Legend for results is here.
ips	qps	rps	rmbps	wps	wmbps	rpq	rkbpq	wpi	wkbpi	csps	cpups	cspq	cpupq	dbgb1	dbgb2	rss	maxop	p50	p99	tag
1984	8322	2883	25.6	18.5	5.4	0.346	3.151	0.009	2.777	36370	49.1	4.371	472	58.2	58.6	8.7	0.040	2094	1902	800m.fbmy5635_rel.cy10a_bee
1989	7466	3022	27.4	21.6	6.3	0.405	3.755	0.011	3.243	33361	49.8	4.468	534	58.1	58.7	9.1	0.052	1838	1679	800m.fbmy8028_rel_native_lto.cy10a_bee
q1000.1
q1000.1: range queries with 1000 insert/s per client
Performance metrics for all DBMS, not just the ones listed above. Some are normalized by throughput, others are not. Legend for results is here.
ips	qps	rps	rmbps	wps	wmbps	rpq	rkbpq	wpi	wkbpi	csps	cpups	cspq	cpupq	dbgb1	dbgb2	rss	maxop	p50	p99	tag
3969	8302	3256	31.7	40.1	12.6	0.392	3.911	0.010	3.244	35709	53.6	4.301	516	58.2	60.2	8.8	0.056	2078	1886	800m.fbmy5635_rel.cy10a_bee
3978	7457	3310	31.7	40.1	12.4	0.444	4.348	0.010	3.185	32937	54.1	4.417	580	58.2	60.3	9.2	0.039	1838	1694	800m.fbmy8028_rel_native_lto.cy10a_bee
l.i0
- l.i0: load without secondary indexes
- Legend for results is here.
- Each entry lists the percentage of responses that fit in that bucket (slower than max time for previous bucket, faster than min time for next bucket).
Insert response time histogram
256us	1ms	4ms	16ms	64ms	256ms	1s	4s	16s	gt	max	tag
0.000	0.000	99.715	0.267	0.004	0.014	0.000	0.000	0.000	0.000	0.149	fbmy5635_rel.cy10a_bee
0.000	0.000	99.227	0.564	0.194	0.014	0.000	0.000	0.000	0.000	0.148	fbmy8028_rel_native_lto.cy10a_bee
l.x
- l.x: create secondary indexes
- Legend for results is here.
- Each entry lists the percentage of responses that fit in that bucket (slower than max time for previous bucket, faster than min time for next bucket).
TODO - determine whether there is data for create index response time
l.i1
- l.i1: continue load after secondary indexes created
- Legend for results is here.
- Each entry lists the percentage of responses that fit in that bucket (slower than max time for previous bucket, faster than min time for next bucket).
Insert response time histogram
256us	1ms	4ms	16ms	64ms	256ms	1s	4s	16s	gt	max	tag
0.000	0.000	18.719	81.106	0.161	0.014	0.000	0.000	0.000	0.000	0.173	fbmy5635_rel.cy10a_bee
0.000	0.000	20.906	78.847	0.232	0.015	0.000	0.000	0.000	0.000	0.220	fbmy8028_rel_native_lto.cy10a_bee
Delete response time histogram
256us	1ms	4ms	16ms	64ms	256ms	1s	4s	16s	gt	max	tag
0.000	0.000	13.998	85.779	0.209	0.015	0.000	0.000	0.000	0.000	0.174	fbmy5635_rel.cy10a_bee
0.000	0.000	17.998	81.718	0.269	0.015	0.000	0.000	0.000	0.000	0.220	fbmy8028_rel_native_lto.cy10a_bee
q100.1
- q100.1: range queries with 100 insert/s per client
- Legend for results is here.
- Each entry lists the percentage of responses that fit in that bucket (slower than max time for previous bucket, faster than min time for next bucket).
Query response time histogram
256us	1ms	4ms	16ms	64ms	256ms	1s	4s	16s	gt	max	tag
1.896	96.677	1.410	0.017	nonzero	0.000	0.000	0.000	0.000	0.000	0.050	fbmy5635_rel.cy10a_bee
0.423	97.026	2.530	0.021	nonzero	nonzero	0.000	0.000	0.000	0.000	0.067	fbmy8028_rel_native_lto.cy10a_bee
Insert response time histogram
256us	1ms	4ms	16ms	64ms	256ms	1s	4s	16s	gt	max	tag
0.000	0.000	98.056	1.944	0.000	0.000	0.000	0.000	0.000	0.000	0.016	fbmy5635_rel.cy10a_bee
0.000	0.000	98.028	1.965	0.007	0.000	0.000	0.000	0.000	0.000	0.019	fbmy8028_rel_native_lto.cy10a_bee
Delete response time histogram
256us	1ms	4ms	16ms	64ms	256ms	1s	4s	16s	gt	max	tag
0.000	0.000	97.319	2.681	0.000	0.000	0.000	0.000	0.000	0.000	0.016	fbmy5635_rel.cy10a_bee
0.000	0.000	97.326	2.667	0.007	0.000	0.000	0.000	0.000	0.000	0.029	fbmy8028_rel_native_lto.cy10a_bee
q500.1
- q500.1: range queries with 500 insert/s per client
- Legend for results is here.
- Each entry lists the percentage of responses that fit in that bucket (slower than max time for previous bucket, faster than min time for next bucket).
Query response time histogram
256us	1ms	4ms	16ms	64ms	256ms	1s	4s	16s	gt	max	tag
1.953	97.159	0.880	0.008	nonzero	0.000	0.000	0.000	0.000	0.000	0.040	fbmy5635_rel.cy10a_bee
0.294	97.770	1.919	0.016	nonzero	0.000	0.000	0.000	0.000	0.000	0.052	fbmy8028_rel_native_lto.cy10a_bee
Insert response time histogram
256us	1ms	4ms	16ms	64ms	256ms	1s	4s	16s	gt	max	tag
0.000	0.000	99.240	0.749	0.010	0.001	0.000	0.000	0.000	0.000	0.066	fbmy5635_rel.cy10a_bee
0.000	0.000	95.088	4.876	0.033	0.003	0.000	0.000	0.000	0.000	0.105	fbmy8028_rel_native_lto.cy10a_bee
Delete response time histogram
256us	1ms	4ms	16ms	64ms	256ms	1s	4s	16s	gt	max	tag
0.000	0.000	99.149	0.840	0.010	0.001	0.000	0.000	0.000	0.000	0.065	fbmy5635_rel.cy10a_bee
0.000	0.000	95.132	4.829	0.037	0.001	0.000	0.000	0.000	0.000	0.090	fbmy8028_rel_native_lto.cy10a_bee
q1000.1
- q1000.1: range queries with 1000 insert/s per client
- Legend for results is here.
- Each entry lists the percentage of responses that fit in that bucket (slower than max time for previous bucket, faster than min time for next bucket).
Query response time histogram
256us	1ms	4ms	16ms	64ms	256ms	1s	4s	16s	gt	max	tag
1.358	97.715	0.906	0.020	nonzero	0.000	0.000	0.000	0.000	0.000	0.056	fbmy5635_rel.cy10a_bee
0.161	97.960	1.854	0.025	nonzero	0.000	0.000	0.000	0.000	0.000	0.039	fbmy8028_rel_native_lto.cy10a_bee
Insert response time histogram
256us	1ms	4ms	16ms	64ms	256ms	1s	4s	16s	gt	max	tag
0.000	0.000	98.238	1.739	0.020	0.003	0.000	0.000	0.000	0.000	0.077	fbmy5635_rel.cy10a_bee
0.000	0.000	92.558	7.388	0.047	0.007	0.000	0.000	0.000	0.000	0.146	fbmy8028_rel_native_lto.cy10a_bee
Delete response time histogram
256us	1ms	4ms	16ms	64ms	256ms	1s	4s	16s	gt	max	tag
0.000	0.000	98.155	1.815	0.027	0.003	0.000	0.000	0.000	0.000	0.078	fbmy5635_rel.cy10a_bee
0.000	0.000	92.431	7.505	0.057	0.007	0.000	0.000	0.000	0.000	0.102	fbmy8028_rel_native_lto.cy10a_bee