Introduction
This is a report for the insert benchmark with 800M docs and 1 client(s). It is generated by scripts (bash, awk, sed) and Tufte might not be impressed. An overview of the insert benchmark is here and a short update is here. Below, by DBMS, I mean DBMS+version.config. An example is my8020.c10b40 where my means MySQL, 8020 is version 8.0.20 and c10b40 is the name for the configuration file.
The test server has 8 AMD cores, 16G RAM and an NVMe SSD. It is described here as the Beelink. The benchmark was run with 1 client and there were 1 or 3 connections per client (1 for queries or inserts without rate limits, 1+1 for rate limited inserts+deletes). It uses 1 table. It loads 800M rows per table without secondary indexes, creates secondary indexes, then inserts 50M rows per table with a delete per insert to avoid growing the table. It then does 3 read+write tests for 1800s each that do queries as fast as possible with 100, 500 and then 1000 inserts/second/client concurrent with the queries and 1000 deletes/second to avoid growing the table. The database is larger than memory. Clients and the DBMS share one server. The per-database configs are in the per-database subdirectories here.
The tested DBMS are:
- fbmy5635_rel.cy10a_bee - MyRocks 5.6.35, the cy10a_bee config and compiled with CMAKE_BUILD_TYPE=Release: -O3
- fbmy8028_rel_native_lto.cy10a_bee - MyRocks 8.0.28, the cy10a_bee config and compiled with CMAKE_BUILD_TYPE=Release: -O3 -flto -march=native -mtune=native
Contents
- Summary
- l.i0: load without secondary indexes
- l.x: create secondary indexes
- l.i1: continue load after secondary indexes created
- q100.1: range queries with 100 insert/s per client
- q500.1: range queries with 500 insert/s per client
- q1000.1: range queries with 1000 insert/s per client
Summary
The numbers are inserts/s for l.i0 and l.i1, indexed docs (or rows) /s for l.x and queries/s for q*.2. The values are the average rate over the entire test for inserts (IPS) and queries (QPS). The range of values for IPS and QPS is split into 3 parts: bottom 25%, middle 50%, top 25%. Values in the bottom 25% have a red background, values in the top 25% have a green background and values in the middle have no color. A gray background is used for values that can be ignored because the DBMS did not sustain the target insert rate. Red backgrounds are not used when the minimum value is within 80% of the max value.
| dbms | l.i0 | l.x | l.i1 | q100.1 | q500.1 | q1000.1 |
|---|---|---|---|---|---|---|
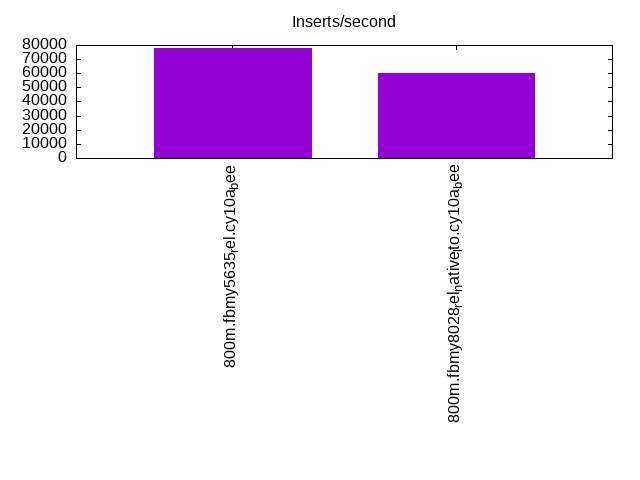
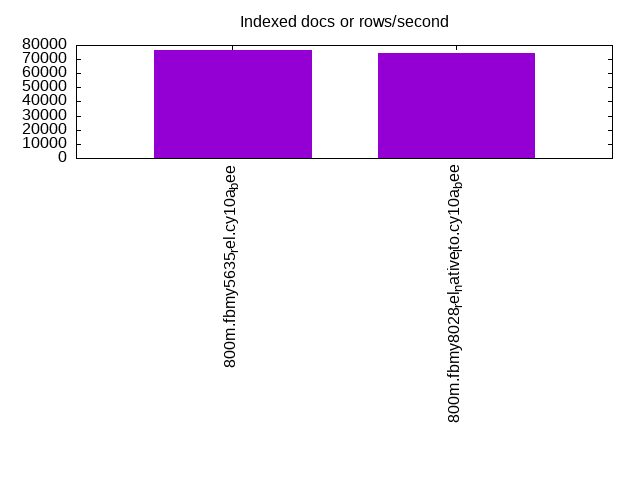
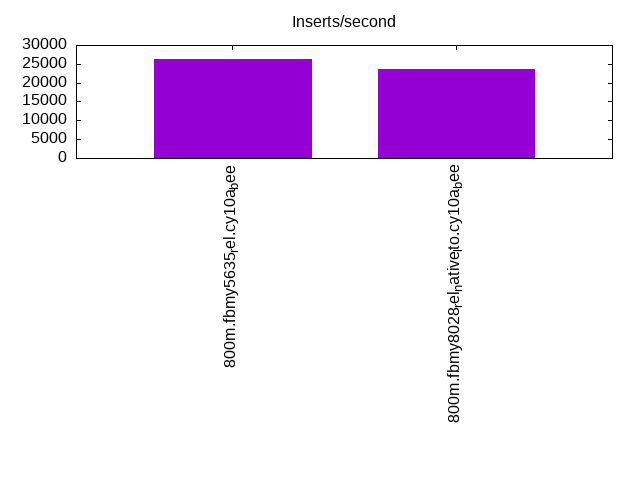
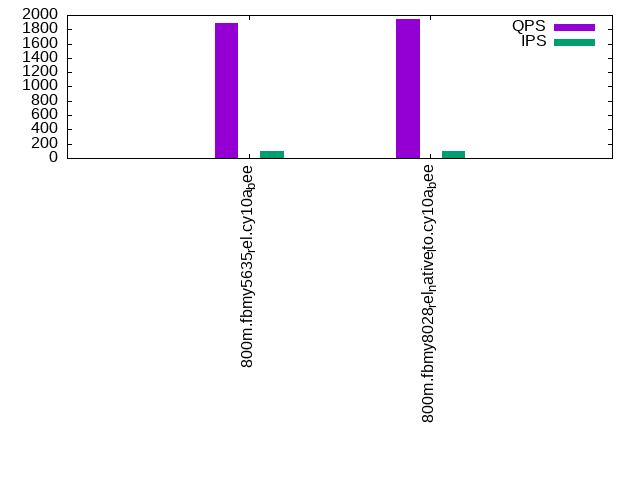
| 800m.fbmy5635_rel.cy10a_bee | 77527 | 76528 | 26288 | 1887 | 1839 | 1881 |
| 800m.fbmy8028_rel_native_lto.cy10a_bee | 60469 | 74138 | 23719 | 1938 | 1820 | 1850 |
This table has relative throughput, throughput for the DBMS relative to the DBMS in the first line, using the absolute throughput from the previous table.
| dbms | l.i0 | l.x | l.i1 | q100.1 | q500.1 | q1000.1 |
|---|---|---|---|---|---|---|
| 800m.fbmy5635_rel.cy10a_bee | 1.00 | 1.00 | 1.00 | 1.00 | 1.00 | 1.00 |
| 800m.fbmy8028_rel_native_lto.cy10a_bee | 0.78 | 0.97 | 0.90 | 1.03 | 0.99 | 0.98 |
This lists the average rate of inserts/s for the tests that do inserts concurrent with queries. For such tests the query rate is listed in the table above. The read+write tests are setup so that the insert rate should match the target rate every second. Cells that are not at least 95% of the target have a red background to indicate a failure to satisfy the target.
| dbms | q100.1 | q500.1 | q1000.1 |
|---|---|---|---|
| fbmy5635_rel.cy10a_bee | 100 | 499 | 998 |
| fbmy8028_rel_native_lto.cy10a_bee | 100 | 499 | 998 |
| target | 100 | 500 | 1000 |
l.i0
l.i0: load without secondary indexes. Graphs for performance per 1-second interval are here.
Average throughput:
Insert response time histogram: each cell has the percentage of responses that take <= the time in the header and max is the max response time in seconds. For the max column values in the top 25% of the range have a red background and in the bottom 25% of the range have a green background. The red background is not used when the min value is within 80% of the max value.
| dbms | 256us | 1ms | 4ms | 16ms | 64ms | 256ms | 1s | 4s | 16s | gt | max |
|---|---|---|---|---|---|---|---|---|---|---|---|
| fbmy5635_rel.cy10a_bee | 99.868 | 0.128 | 0.004 | nonzero | 0.089 | ||||||
| fbmy8028_rel_native_lto.cy10a_bee | 99.731 | 0.193 | 0.073 | 0.003 | 0.105 |
Performance metrics for the DBMS listed above. Some are normalized by throughput, others are not. Legend for results is here.
ips	qps	rps	rmbps	wps	wmbps	rpq	rkbpq	wpi	wkbpi	csps	cpups	cspq	cpupq	dbgb1	dbgb2	rss	maxop	p50	p99	tag
77527	0	0	0.0	42.3	13.9	0.000	0.000	0.001	0.184	7682	22.5	0.099	23	25.1	25.7	1.5	0.089	77810	72018	800m.fbmy5635_rel.cy10a_bee
60469	0	0	0.0	47.2	13.9	0.000	0.000	0.001	0.236	6368	22.7	0.105	30	25.1	25.9	2.0	0.105	60531	54838	800m.fbmy8028_rel_native_lto.cy10a_bee
l.x
l.x: create secondary indexes.
Average throughput:
Performance metrics for the DBMS listed above. Some are normalized by throughput, others are not. Legend for results is here.
ips	qps	rps	rmbps	wps	wmbps	rpq	rkbpq	wpi	wkbpi	csps	cpups	cspq	cpupq	dbgb1	dbgb2	rss	maxop	p50	p99	tag
76528	0	96	16.0	30.9	11.4	0.001	0.214	0.000	0.153	346	11.7	0.005	12	51.0	51.6	8.6	0.008	NA	NA	800m.fbmy5635_rel.cy10a_bee
74138	0	93	15.5	29.7	10.8	0.001	0.215	0.000	0.150	501	11.7	0.007	13	51.0	51.8	10.4	0.013	NA	NA	800m.fbmy8028_rel_native_lto.cy10a_bee
l.i1
l.i1: continue load after secondary indexes created. Graphs for performance per 1-second interval are here.
Average throughput:
Insert response time histogram: each cell has the percentage of responses that take <= the time in the header and max is the max response time in seconds. For the max column values in the top 25% of the range have a red background and in the bottom 25% of the range have a green background. The red background is not used when the min value is within 80% of the max value.
| dbms | 256us | 1ms | 4ms | 16ms | 64ms | 256ms | 1s | 4s | 16s | gt | max |
|---|---|---|---|---|---|---|---|---|---|---|---|
| fbmy5635_rel.cy10a_bee | 99.796 | 0.199 | 0.005 | 0.001 | 0.078 | ||||||
| fbmy8028_rel_native_lto.cy10a_bee | 99.667 | 0.327 | 0.003 | 0.002 | 0.084 |
Delete response time histogram: each cell has the percentage of responses that take <= the time in the header and max is the max response time in seconds. For the max column values in the top 25% of the range have a red background and in the bottom 25% of the range have a green background. The red background is not used when the min value is within 80% of the max value.
| dbms | 256us | 1ms | 4ms | 16ms | 64ms | 256ms | 1s | 4s | 16s | gt | max |
|---|---|---|---|---|---|---|---|---|---|---|---|
| fbmy5635_rel.cy10a_bee | 99.763 | 0.228 | 0.009 | 0.001 | 0.077 | ||||||
| fbmy8028_rel_native_lto.cy10a_bee | 99.655 | 0.335 | 0.009 | 0.002 | 0.097 |
Performance metrics for the DBMS listed above. Some are normalized by throughput, others are not. Legend for results is here.
ips	qps	rps	rmbps	wps	wmbps	rpq	rkbpq	wpi	wkbpi	csps	cpups	cspq	cpupq	dbgb1	dbgb2	rss	maxop	p50	p99	tag
26288	0	268	12.2	138.8	53.4	0.010	0.473	0.005	2.082	11658	47.9	0.443	146	57.0	58.4	8.4	0.078	26371	22524	800m.fbmy5635_rel.cy10a_bee
23719	0	236	10.9	136.5	48.6	0.010	0.472	0.006	2.097	10768	46.3	0.454	156	57.4	58.9	8.9	0.084	23824	20777	800m.fbmy8028_rel_native_lto.cy10a_bee
q100.1
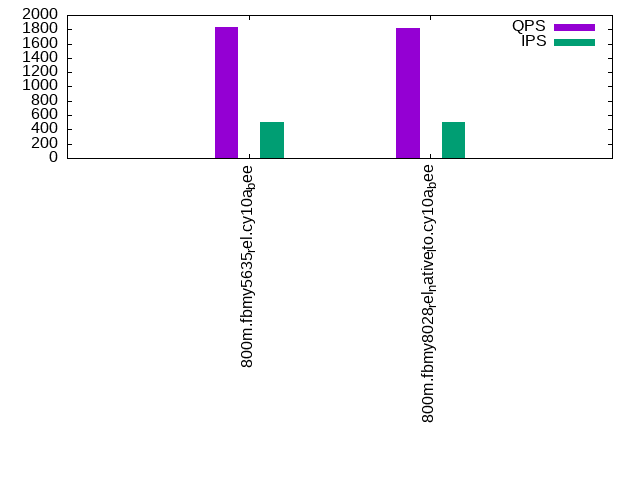
q100.1: range queries with 100 insert/s per client. Graphs for performance per 1-second interval are here.
Average throughput:
Query response time histogram: each cell has the percentage of responses that take <= the time in the header and max is the max response time in seconds. For max values in the top 25% of the range have a red background and in the bottom 25% of the range have a green background. The red background is not used when the min value is within 80% of the max value.
| dbms | 256us | 1ms | 4ms | 16ms | 64ms | 256ms | 1s | 4s | 16s | gt | max |
|---|---|---|---|---|---|---|---|---|---|---|---|
| fbmy5635_rel.cy10a_bee | 3.005 | 94.401 | 2.577 | 0.016 | nonzero | nonzero | 0.067 | ||||
| fbmy8028_rel_native_lto.cy10a_bee | 1.416 | 95.411 | 3.172 | 0.001 | nonzero | 0.057 |
Insert response time histogram: each cell has the percentage of responses that take <= the time in the header and max is the max response time in seconds. For max values in the top 25% of the range have a red background and in the bottom 25% of the range have a green background. The red background is not used when the min value is within 80% of the max value.
| dbms | 256us | 1ms | 4ms | 16ms | 64ms | 256ms | 1s | 4s | 16s | gt | max |
|---|---|---|---|---|---|---|---|---|---|---|---|
| fbmy5635_rel.cy10a_bee | 99.417 | 0.583 | 0.009 | ||||||||
| fbmy8028_rel_native_lto.cy10a_bee | 99.444 | 0.556 | 0.012 |
Delete response time histogram: each cell has the percentage of responses that take <= the time in the header and max is the max response time in seconds. For max values in the top 25% of the range have a red background and in the bottom 25% of the range have a green background. The red background is not used when the min value is within 80% of the max value.
| dbms | 256us | 1ms | 4ms | 16ms | 64ms | 256ms | 1s | 4s | 16s | gt | max |
|---|---|---|---|---|---|---|---|---|---|---|---|
| fbmy5635_rel.cy10a_bee | 90.778 | 9.111 | 0.111 | 0.017 | |||||||
| fbmy8028_rel_native_lto.cy10a_bee | 99.111 | 0.889 | 0.014 |
Performance metrics for the DBMS listed above. Some are normalized by throughput, others are not. Legend for results is here.
ips	qps	rps	rmbps	wps	wmbps	rpq	rkbpq	wpi	wkbpi	csps	cpups	cspq	cpupq	dbgb1	dbgb2	rss	maxop	p50	p99	tag
100	1887	559	8.0	12.8	3.5	0.296	4.319	0.128	35.924	8284	14.7	4.389	623	55.7	57.0	8.6	0.067	1854	1342	800m.fbmy5635_rel.cy10a_bee
100	1938	619	8.9	12.9	3.5	0.319	4.695	0.129	35.952	8652	14.7	4.464	607	55.6	57.2	9.5	0.057	1998	1151	800m.fbmy8028_rel_native_lto.cy10a_bee
q500.1
q500.1: range queries with 500 insert/s per client. Graphs for performance per 1-second interval are here.
Average throughput:
Query response time histogram: each cell has the percentage of responses that take <= the time in the header and max is the max response time in seconds. For max values in the top 25% of the range have a red background and in the bottom 25% of the range have a green background. The red background is not used when the min value is within 80% of the max value.
| dbms | 256us | 1ms | 4ms | 16ms | 64ms | 256ms | 1s | 4s | 16s | gt | max |
|---|---|---|---|---|---|---|---|---|---|---|---|
| fbmy5635_rel.cy10a_bee | 0.737 | 99.170 | 0.078 | 0.016 | nonzero | 0.030 | |||||
| fbmy8028_rel_native_lto.cy10a_bee | 0.215 | 99.364 | 0.416 | 0.004 | 0.010 |
Insert response time histogram: each cell has the percentage of responses that take <= the time in the header and max is the max response time in seconds. For max values in the top 25% of the range have a red background and in the bottom 25% of the range have a green background. The red background is not used when the min value is within 80% of the max value.
| dbms | 256us | 1ms | 4ms | 16ms | 64ms | 256ms | 1s | 4s | 16s | gt | max |
|---|---|---|---|---|---|---|---|---|---|---|---|
| fbmy5635_rel.cy10a_bee | 99.722 | 0.278 | 0.009 | ||||||||
| fbmy8028_rel_native_lto.cy10a_bee | 99.600 | 0.394 | 0.006 | 0.017 |
Delete response time histogram: each cell has the percentage of responses that take <= the time in the header and max is the max response time in seconds. For max values in the top 25% of the range have a red background and in the bottom 25% of the range have a green background. The red background is not used when the min value is within 80% of the max value.
| dbms | 256us | 1ms | 4ms | 16ms | 64ms | 256ms | 1s | 4s | 16s | gt | max |
|---|---|---|---|---|---|---|---|---|---|---|---|
| fbmy5635_rel.cy10a_bee | 97.289 | 2.694 | 0.017 | 0.017 | |||||||
| fbmy8028_rel_native_lto.cy10a_bee | 98.739 | 1.256 | 0.006 | 0.017 |
Performance metrics for the DBMS listed above. Some are normalized by throughput, others are not. Legend for results is here.
ips	qps	rps	rmbps	wps	wmbps	rpq	rkbpq	wpi	wkbpi	csps	cpups	cspq	cpupq	dbgb1	dbgb2	rss	maxop	p50	p99	tag
499	1839	62	1.5	7.5	1.6	0.034	0.832	0.015	3.281	7310	13.5	3.976	587	55.7	57.2	8.6	0.030	1806	1662	800m.fbmy5635_rel.cy10a_bee
499	1820	65	1.2	7.0	1.4	0.036	0.696	0.014	2.831	7411	13.8	4.072	607	55.7	57.4	9.2	0.010	1790	1534	800m.fbmy8028_rel_native_lto.cy10a_bee
q1000.1
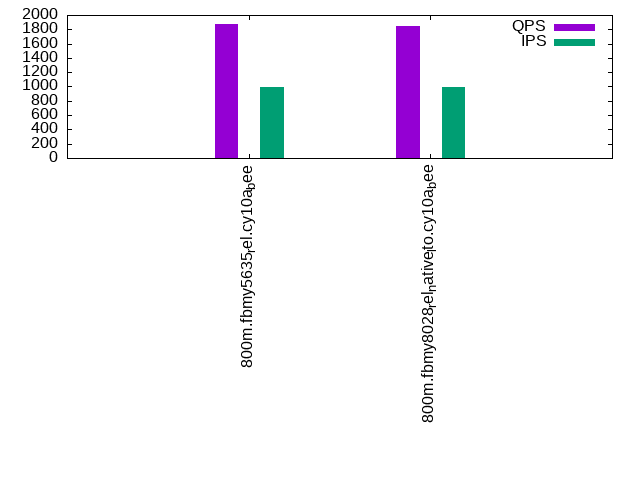
q1000.1: range queries with 1000 insert/s per client. Graphs for performance per 1-second interval are here.
Average throughput:
Query response time histogram: each cell has the percentage of responses that take <= the time in the header and max is the max response time in seconds. For max values in the top 25% of the range have a red background and in the bottom 25% of the range have a green background. The red background is not used when the min value is within 80% of the max value.
| dbms | 256us | 1ms | 4ms | 16ms | 64ms | 256ms | 1s | 4s | 16s | gt | max |
|---|---|---|---|---|---|---|---|---|---|---|---|
| fbmy5635_rel.cy10a_bee | 0.966 | 98.918 | 0.112 | 0.004 | 0.012 | ||||||
| fbmy8028_rel_native_lto.cy10a_bee | 0.285 | 98.964 | 0.748 | 0.003 | 0.010 |
Insert response time histogram: each cell has the percentage of responses that take <= the time in the header and max is the max response time in seconds. For max values in the top 25% of the range have a red background and in the bottom 25% of the range have a green background. The red background is not used when the min value is within 80% of the max value.
| dbms | 256us | 1ms | 4ms | 16ms | 64ms | 256ms | 1s | 4s | 16s | gt | max |
|---|---|---|---|---|---|---|---|---|---|---|---|
| fbmy5635_rel.cy10a_bee | 99.733 | 0.264 | 0.003 | 0.045 | |||||||
| fbmy8028_rel_native_lto.cy10a_bee | 99.619 | 0.372 | 0.006 | 0.003 | 0.082 |
Delete response time histogram: each cell has the percentage of responses that take <= the time in the header and max is the max response time in seconds. For max values in the top 25% of the range have a red background and in the bottom 25% of the range have a green background. The red background is not used when the min value is within 80% of the max value.
| dbms | 256us | 1ms | 4ms | 16ms | 64ms | 256ms | 1s | 4s | 16s | gt | max |
|---|---|---|---|---|---|---|---|---|---|---|---|
| fbmy5635_rel.cy10a_bee | 99.411 | 0.583 | 0.006 | 0.046 | |||||||
| fbmy8028_rel_native_lto.cy10a_bee | 99.569 | 0.422 | 0.006 | 0.003 | 0.094 |
Performance metrics for the DBMS listed above. Some are normalized by throughput, others are not. Legend for results is here.
ips	qps	rps	rmbps	wps	wmbps	rpq	rkbpq	wpi	wkbpi	csps	cpups	cspq	cpupq	dbgb1	dbgb2	rss	maxop	p50	p99	tag
998	1881	107	2.6	13.0	3.5	0.057	1.435	0.013	3.641	7679	15.1	4.083	642	55.7	57.6	8.6	0.012	1902	1662	800m.fbmy5635_rel.cy10a_bee
998	1850	200	3.7	12.2	3.2	0.108	2.028	0.012	3.293	7779	15.7	4.206	679	55.6	57.8	9.1	0.010	1902	1534	800m.fbmy8028_rel_native_lto.cy10a_bee
l.i0
l.i0: load without secondary indexes
Performance metrics for all DBMS, not just the ones listed above. Some are normalized by throughput, others are not. Legend for results is here.
ips	qps	rps	rmbps	wps	wmbps	rpq	rkbpq	wpi	wkbpi	csps	cpups	cspq	cpupq	dbgb1	dbgb2	rss	maxop	p50	p99	tag
77527	0	0	0.0	42.3	13.9	0.000	0.000	0.001	0.184	7682	22.5	0.099	23	25.1	25.7	1.5	0.089	77810	72018	800m.fbmy5635_rel.cy10a_bee
60469	0	0	0.0	47.2	13.9	0.000	0.000	0.001	0.236	6368	22.7	0.105	30	25.1	25.9	2.0	0.105	60531	54838	800m.fbmy8028_rel_native_lto.cy10a_bee
l.x
l.x: create secondary indexes
Performance metrics for all DBMS, not just the ones listed above. Some are normalized by throughput, others are not. Legend for results is here.
ips	qps	rps	rmbps	wps	wmbps	rpq	rkbpq	wpi	wkbpi	csps	cpups	cspq	cpupq	dbgb1	dbgb2	rss	maxop	p50	p99	tag
76528	0	96	16.0	30.9	11.4	0.001	0.214	0.000	0.153	346	11.7	0.005	12	51.0	51.6	8.6	0.008	NA	NA	800m.fbmy5635_rel.cy10a_bee
74138	0	93	15.5	29.7	10.8	0.001	0.215	0.000	0.150	501	11.7	0.007	13	51.0	51.8	10.4	0.013	NA	NA	800m.fbmy8028_rel_native_lto.cy10a_bee
l.i1
l.i1: continue load after secondary indexes created
Performance metrics for all DBMS, not just the ones listed above. Some are normalized by throughput, others are not. Legend for results is here.
ips	qps	rps	rmbps	wps	wmbps	rpq	rkbpq	wpi	wkbpi	csps	cpups	cspq	cpupq	dbgb1	dbgb2	rss	maxop	p50	p99	tag
26288	0	268	12.2	138.8	53.4	0.010	0.473	0.005	2.082	11658	47.9	0.443	146	57.0	58.4	8.4	0.078	26371	22524	800m.fbmy5635_rel.cy10a_bee
23719	0	236	10.9	136.5	48.6	0.010	0.472	0.006	2.097	10768	46.3	0.454	156	57.4	58.9	8.9	0.084	23824	20777	800m.fbmy8028_rel_native_lto.cy10a_bee
q100.1
q100.1: range queries with 100 insert/s per client
Performance metrics for all DBMS, not just the ones listed above. Some are normalized by throughput, others are not. Legend for results is here.
ips	qps	rps	rmbps	wps	wmbps	rpq	rkbpq	wpi	wkbpi	csps	cpups	cspq	cpupq	dbgb1	dbgb2	rss	maxop	p50	p99	tag
100	1887	559	8.0	12.8	3.5	0.296	4.319	0.128	35.924	8284	14.7	4.389	623	55.7	57.0	8.6	0.067	1854	1342	800m.fbmy5635_rel.cy10a_bee
100	1938	619	8.9	12.9	3.5	0.319	4.695	0.129	35.952	8652	14.7	4.464	607	55.6	57.2	9.5	0.057	1998	1151	800m.fbmy8028_rel_native_lto.cy10a_bee
q500.1
q500.1: range queries with 500 insert/s per client
Performance metrics for all DBMS, not just the ones listed above. Some are normalized by throughput, others are not. Legend for results is here.
ips	qps	rps	rmbps	wps	wmbps	rpq	rkbpq	wpi	wkbpi	csps	cpups	cspq	cpupq	dbgb1	dbgb2	rss	maxop	p50	p99	tag
499	1839	62	1.5	7.5	1.6	0.034	0.832	0.015	3.281	7310	13.5	3.976	587	55.7	57.2	8.6	0.030	1806	1662	800m.fbmy5635_rel.cy10a_bee
499	1820	65	1.2	7.0	1.4	0.036	0.696	0.014	2.831	7411	13.8	4.072	607	55.7	57.4	9.2	0.010	1790	1534	800m.fbmy8028_rel_native_lto.cy10a_bee
q1000.1
q1000.1: range queries with 1000 insert/s per client
Performance metrics for all DBMS, not just the ones listed above. Some are normalized by throughput, others are not. Legend for results is here.
ips	qps	rps	rmbps	wps	wmbps	rpq	rkbpq	wpi	wkbpi	csps	cpups	cspq	cpupq	dbgb1	dbgb2	rss	maxop	p50	p99	tag
998	1881	107	2.6	13.0	3.5	0.057	1.435	0.013	3.641	7679	15.1	4.083	642	55.7	57.6	8.6	0.012	1902	1662	800m.fbmy5635_rel.cy10a_bee
998	1850	200	3.7	12.2	3.2	0.108	2.028	0.012	3.293	7779	15.7	4.206	679	55.6	57.8	9.1	0.010	1902	1534	800m.fbmy8028_rel_native_lto.cy10a_bee
l.i0
- l.i0: load without secondary indexes
- Legend for results is here.
- Each entry lists the percentage of responses that fit in that bucket (slower than max time for previous bucket, faster than min time for next bucket).
Insert response time histogram
256us	1ms	4ms	16ms	64ms	256ms	1s	4s	16s	gt	max	tag
0.000	0.000	99.868	0.128	0.004	nonzero	0.000	0.000	0.000	0.000	0.089	fbmy5635_rel.cy10a_bee
0.000	0.000	99.731	0.193	0.073	0.003	0.000	0.000	0.000	0.000	0.105	fbmy8028_rel_native_lto.cy10a_bee
l.x
- l.x: create secondary indexes
- Legend for results is here.
- Each entry lists the percentage of responses that fit in that bucket (slower than max time for previous bucket, faster than min time for next bucket).
TODO - determine whether there is data for create index response time
l.i1
- l.i1: continue load after secondary indexes created
- Legend for results is here.
- Each entry lists the percentage of responses that fit in that bucket (slower than max time for previous bucket, faster than min time for next bucket).
Insert response time histogram
256us	1ms	4ms	16ms	64ms	256ms	1s	4s	16s	gt	max	tag
0.000	0.000	99.796	0.199	0.005	0.001	0.000	0.000	0.000	0.000	0.078	fbmy5635_rel.cy10a_bee
0.000	0.000	99.667	0.327	0.003	0.002	0.000	0.000	0.000	0.000	0.084	fbmy8028_rel_native_lto.cy10a_bee
Delete response time histogram
256us	1ms	4ms	16ms	64ms	256ms	1s	4s	16s	gt	max	tag
0.000	0.000	99.763	0.228	0.009	0.001	0.000	0.000	0.000	0.000	0.077	fbmy5635_rel.cy10a_bee
0.000	0.000	99.655	0.335	0.009	0.002	0.000	0.000	0.000	0.000	0.097	fbmy8028_rel_native_lto.cy10a_bee
q100.1
- q100.1: range queries with 100 insert/s per client
- Legend for results is here.
- Each entry lists the percentage of responses that fit in that bucket (slower than max time for previous bucket, faster than min time for next bucket).
Query response time histogram
256us	1ms	4ms	16ms	64ms	256ms	1s	4s	16s	gt	max	tag
3.005	94.401	2.577	0.016	nonzero	nonzero	0.000	0.000	0.000	0.000	0.067	fbmy5635_rel.cy10a_bee
1.416	95.411	3.172	0.001	nonzero	0.000	0.000	0.000	0.000	0.000	0.057	fbmy8028_rel_native_lto.cy10a_bee
Insert response time histogram
256us	1ms	4ms	16ms	64ms	256ms	1s	4s	16s	gt	max	tag
0.000	0.000	99.417	0.583	0.000	0.000	0.000	0.000	0.000	0.000	0.009	fbmy5635_rel.cy10a_bee
0.000	0.000	99.444	0.556	0.000	0.000	0.000	0.000	0.000	0.000	0.012	fbmy8028_rel_native_lto.cy10a_bee
Delete response time histogram
256us	1ms	4ms	16ms	64ms	256ms	1s	4s	16s	gt	max	tag
0.000	0.000	90.778	9.111	0.111	0.000	0.000	0.000	0.000	0.000	0.017	fbmy5635_rel.cy10a_bee
0.000	0.000	99.111	0.889	0.000	0.000	0.000	0.000	0.000	0.000	0.014	fbmy8028_rel_native_lto.cy10a_bee
q500.1
- q500.1: range queries with 500 insert/s per client
- Legend for results is here.
- Each entry lists the percentage of responses that fit in that bucket (slower than max time for previous bucket, faster than min time for next bucket).
Query response time histogram
256us	1ms	4ms	16ms	64ms	256ms	1s	4s	16s	gt	max	tag
0.737	99.170	0.078	0.016	nonzero	0.000	0.000	0.000	0.000	0.000	0.030	fbmy5635_rel.cy10a_bee
0.215	99.364	0.416	0.004	0.000	0.000	0.000	0.000	0.000	0.000	0.010	fbmy8028_rel_native_lto.cy10a_bee
Insert response time histogram
256us	1ms	4ms	16ms	64ms	256ms	1s	4s	16s	gt	max	tag
0.000	0.000	99.722	0.278	0.000	0.000	0.000	0.000	0.000	0.000	0.009	fbmy5635_rel.cy10a_bee
0.000	0.000	99.600	0.394	0.006	0.000	0.000	0.000	0.000	0.000	0.017	fbmy8028_rel_native_lto.cy10a_bee
Delete response time histogram
256us	1ms	4ms	16ms	64ms	256ms	1s	4s	16s	gt	max	tag
0.000	0.000	97.289	2.694	0.017	0.000	0.000	0.000	0.000	0.000	0.017	fbmy5635_rel.cy10a_bee
0.000	0.000	98.739	1.256	0.006	0.000	0.000	0.000	0.000	0.000	0.017	fbmy8028_rel_native_lto.cy10a_bee
q1000.1
- q1000.1: range queries with 1000 insert/s per client
- Legend for results is here.
- Each entry lists the percentage of responses that fit in that bucket (slower than max time for previous bucket, faster than min time for next bucket).
Query response time histogram
256us	1ms	4ms	16ms	64ms	256ms	1s	4s	16s	gt	max	tag
0.966	98.918	0.112	0.004	0.000	0.000	0.000	0.000	0.000	0.000	0.012	fbmy5635_rel.cy10a_bee
0.285	98.964	0.748	0.003	0.000	0.000	0.000	0.000	0.000	0.000	0.010	fbmy8028_rel_native_lto.cy10a_bee
Insert response time histogram
256us	1ms	4ms	16ms	64ms	256ms	1s	4s	16s	gt	max	tag
0.000	0.000	99.733	0.264	0.003	0.000	0.000	0.000	0.000	0.000	0.045	fbmy5635_rel.cy10a_bee
0.000	0.000	99.619	0.372	0.006	0.003	0.000	0.000	0.000	0.000	0.082	fbmy8028_rel_native_lto.cy10a_bee
Delete response time histogram
256us	1ms	4ms	16ms	64ms	256ms	1s	4s	16s	gt	max	tag
0.000	0.000	99.411	0.583	0.006	0.000	0.000	0.000	0.000	0.000	0.046	fbmy5635_rel.cy10a_bee
0.000	0.000	99.569	0.422	0.006	0.003	0.000	0.000	0.000	0.000	0.094	fbmy8028_rel_native_lto.cy10a_bee