Introduction
This is a report for the insert benchmark with 20M docs and 4 client(s). It is generated by scripts (bash, awk, sed) and Tufte might not be impressed. An overview of the insert benchmark is here and a short update is here. Below, by DBMS, I mean DBMS+version.config. An example is my8020.c10b40 where my means MySQL, 8020 is version 8.0.20 and c10b40 is the name for the configuration file.
The test server has 8 AMD cores, 16G RAM and an NVMe SSD. It is described here as the Beelink. The benchmark was run with 4 clients and there were 1 or 3 connections per client (1 for queries or inserts without rate limits, 1+1 for rate limited inserts+deletes). It uses 4 tables, 1 per client. It loads 20M rows per table without secondary indexes, creates secondary indexes, then inserts 50M rows per table with a delete per insert to avoid growing the table. It then does 3 read+write tests for 1800s each that do queries as fast as possible with 100, 500 and then 1000 inserts/second/client concurrent with the queries and 1000 deletes/second to avoid growing the table. The database is cached by the storage engine and the only IO is for writes. Clients and the DBMS share one server. The per-database configs are in the per-database subdirectories here.
The tested DBMS are:
- fbmy5635_rel.cy10_1g_bee - - MyRocks 5.6.35, the cy10_1g_bee config and compiled with CMAKE_BUILD_TYPE=Release: -O3
- fbmy8028_rel_native_lto.cy10_1g_bee - MyRocks 8.0.28, the cy10_1g_bee config and compiled with CMAKE_BUILD_TYPE=Release: -O3 -flto -march=native -mtune=native
Contents
- Summary
- l.i0: load without secondary indexes
- l.x: create secondary indexes
- l.i1: continue load after secondary indexes created
- q100.1: range queries with 100 insert/s per client
- q500.1: range queries with 500 insert/s per client
- q1000.1: range queries with 1000 insert/s per client
Summary
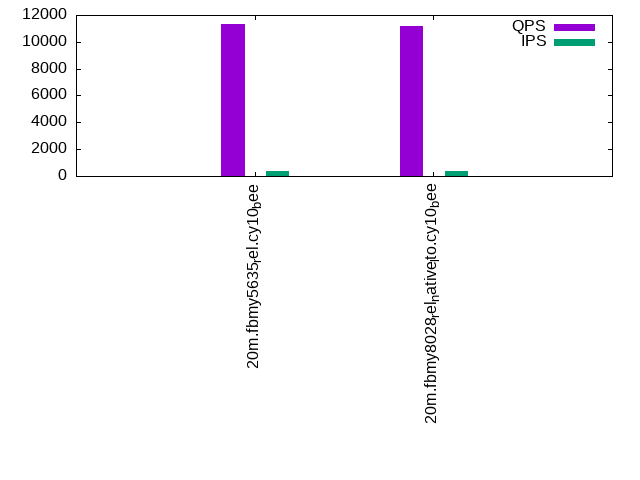
The numbers are inserts/s for l.i0 and l.i1, indexed docs (or rows) /s for l.x and queries/s for q*.2. The values are the average rate over the entire test for inserts (IPS) and queries (QPS). The range of values for IPS and QPS is split into 3 parts: bottom 25%, middle 50%, top 25%. Values in the bottom 25% have a red background, values in the top 25% have a green background and values in the middle have no color. A gray background is used for values that can be ignored because the DBMS did not sustain the target insert rate. Red backgrounds are not used when the minimum value is within 80% of the max value.
| dbms | l.i0 | l.x | l.i1 | q100.1 | q500.1 | q1000.1 |
|---|---|---|---|---|---|---|
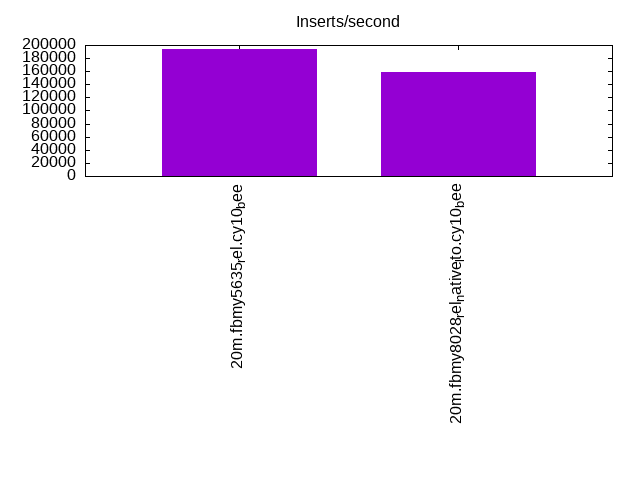
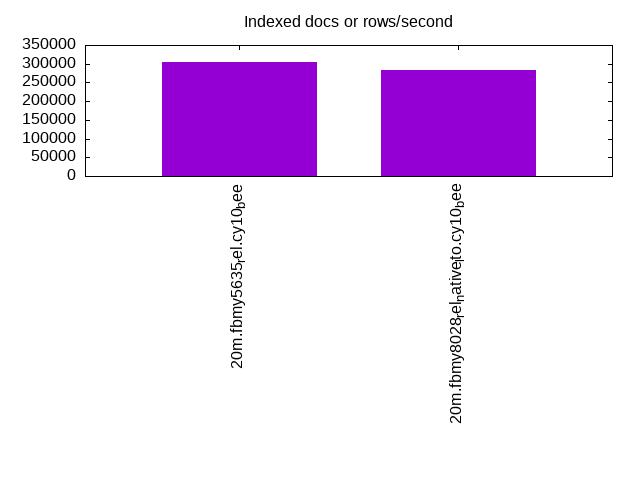
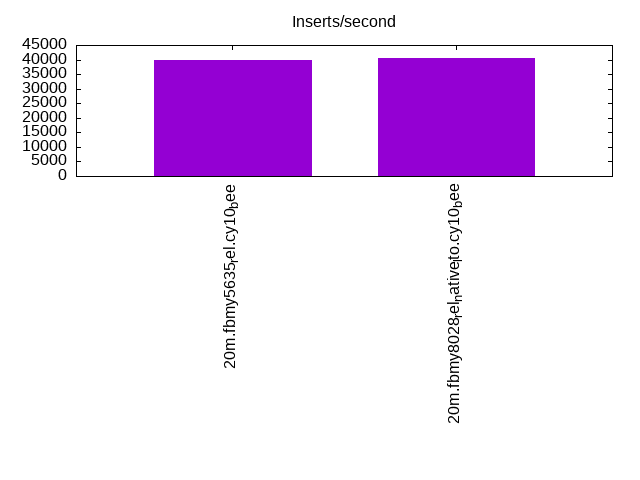
| 20m.fbmy5635_rel.cy10_bee | 194175 | 304545 | 39877 | 11298 | 11497 | 11557 |
| 20m.fbmy8028_rel_native_lto.cy10_bee | 158730 | 283098 | 40530 | 11146 | 11010 | 10949 |
This table has relative throughput, throughput for the DBMS relative to the DBMS in the first line, using the absolute throughput from the previous table.
| dbms | l.i0 | l.x | l.i1 | q100.1 | q500.1 | q1000.1 |
|---|---|---|---|---|---|---|
| 20m.fbmy5635_rel.cy10_bee | 1.00 | 1.00 | 1.00 | 1.00 | 1.00 | 1.00 |
| 20m.fbmy8028_rel_native_lto.cy10_bee | 0.82 | 0.93 | 1.02 | 0.99 | 0.96 | 0.95 |
This lists the average rate of inserts/s for the tests that do inserts concurrent with queries. For such tests the query rate is listed in the table above. The read+write tests are setup so that the insert rate should match the target rate every second. Cells that are not at least 95% of the target have a red background to indicate a failure to satisfy the target.
| dbms | q100.1 | q500.1 | q1000.1 |
|---|---|---|---|
| fbmy5635_rel.cy10_bee | 398 | 1993 | 3989 |
| fbmy8028_rel_native_lto.cy10_bee | 397 | 1993 | 3987 |
| target | 400 | 2000 | 4000 |
l.i0
l.i0: load without secondary indexes. Graphs for performance per 1-second interval are here.
Average throughput:
Insert response time histogram: each cell has the percentage of responses that take <= the time in the header and max is the max response time in seconds. For the max column values in the top 25% of the range have a red background and in the bottom 25% of the range have a green background. The red background is not used when the min value is within 80% of the max value.
| dbms | 256us | 1ms | 4ms | 16ms | 64ms | 256ms | 1s | 4s | 16s | gt | max |
|---|---|---|---|---|---|---|---|---|---|---|---|
| fbmy5635_rel.cy10_bee | 99.763 | 0.223 | 0.002 | 0.013 | 0.108 | ||||||
| fbmy8028_rel_native_lto.cy10_bee | 99.305 | 0.473 | 0.209 | 0.013 | 0.119 |
Performance metrics for the DBMS listed above. Some are normalized by throughput, others are not. Legend for results is here.
ips	qps	rps	rmbps	wps	wmbps	rpq	rkbpq	wpi	wkbpi	csps	cpups	cspq	cpupq	dbgb1	dbgb2	rss	maxop	p50	p99	tag
194175	0	0	0.0	123.2	51.3	0.000	0.000	0.001	0.270	20104	71.7	0.104	30	0.9	1.9	0.4	0.108	54540	3496	20m.fbmy5635_rel.cy10_bee
158730	0	0	0.0	112.4	44.3	0.000	0.000	0.001	0.286	16144	65.9	0.102	33	0.7	1.9	0.7	0.119	43052	35573	20m.fbmy8028_rel_native_lto.cy10_bee
l.x
l.x: create secondary indexes.
Average throughput:
Performance metrics for the DBMS listed above. Some are normalized by throughput, others are not. Legend for results is here.
ips	qps	rps	rmbps	wps	wmbps	rpq	rkbpq	wpi	wkbpi	csps	cpups	cspq	cpupq	dbgb1	dbgb2	rss	maxop	p50	p99	tag
304545	0	1	0.0	135.7	56.2	0.000	0.000	0.000	0.189	666	46.9	0.002	12	1.4	2.4	2.1	0.004	NA	NA	20m.fbmy5635_rel.cy10_bee
283098	0	1	0.0	114.3	47.4	0.000	0.000	0.000	0.171	872	45.2	0.003	13	1.4	2.7	2.2	0.013	NA	NA	20m.fbmy8028_rel_native_lto.cy10_bee
l.i1
l.i1: continue load after secondary indexes created. Graphs for performance per 1-second interval are here.
Average throughput:
Insert response time histogram: each cell has the percentage of responses that take <= the time in the header and max is the max response time in seconds. For the max column values in the top 25% of the range have a red background and in the bottom 25% of the range have a green background. The red background is not used when the min value is within 80% of the max value.
| dbms | 256us | 1ms | 4ms | 16ms | 64ms | 256ms | 1s | 4s | 16s | gt | max |
|---|---|---|---|---|---|---|---|---|---|---|---|
| fbmy5635_rel.cy10_bee | 24.317 | 75.658 | 0.017 | 0.008 | 0.126 | ||||||
| fbmy8028_rel_native_lto.cy10_bee | 29.020 | 70.845 | 0.123 | 0.012 | 0.128 |
Delete response time histogram: each cell has the percentage of responses that take <= the time in the header and max is the max response time in seconds. For the max column values in the top 25% of the range have a red background and in the bottom 25% of the range have a green background. The red background is not used when the min value is within 80% of the max value.
| dbms | 256us | 1ms | 4ms | 16ms | 64ms | 256ms | 1s | 4s | 16s | gt | max |
|---|---|---|---|---|---|---|---|---|---|---|---|
| fbmy5635_rel.cy10_bee | 22.001 | 77.970 | 0.020 | 0.009 | 0.126 | ||||||
| fbmy8028_rel_native_lto.cy10_bee | 27.319 | 72.543 | 0.126 | 0.012 | 0.174 |
Performance metrics for the DBMS listed above. Some are normalized by throughput, others are not. Legend for results is here.
ips	qps	rps	rmbps	wps	wmbps	rpq	rkbpq	wpi	wkbpi	csps	cpups	cspq	cpupq	dbgb1	dbgb2	rss	maxop	p50	p99	tag
39877	0	140	2.4	145.7	57.5	0.004	0.062	0.004	1.478	18782	68.2	0.471	137	5.5	5.8	6.5	0.126	10039	8790	20m.fbmy5635_rel.cy10_bee
40530	0	185	5.6	156.6	59.3	0.005	0.143	0.004	1.498	16939	73.4	0.418	145	4.9	5.3	7.4	0.128	10143	8790	20m.fbmy8028_rel_native_lto.cy10_bee
q100.1
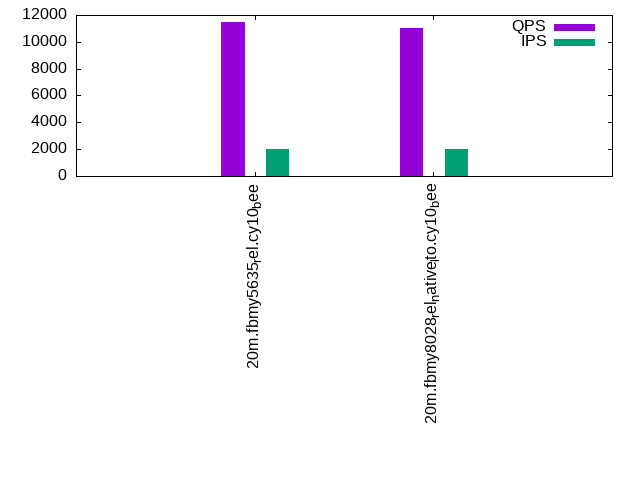
q100.1: range queries with 100 insert/s per client. Graphs for performance per 1-second interval are here.
Average throughput:
Query response time histogram: each cell has the percentage of responses that take <= the time in the header and max is the max response time in seconds. For max values in the top 25% of the range have a red background and in the bottom 25% of the range have a green background. The red background is not used when the min value is within 80% of the max value.
| dbms | 256us | 1ms | 4ms | 16ms | 64ms | 256ms | 1s | 4s | 16s | gt | max |
|---|---|---|---|---|---|---|---|---|---|---|---|
| fbmy5635_rel.cy10_bee | 16.766 | 83.214 | 0.018 | 0.001 | nonzero | 0.020 | |||||
| fbmy8028_rel_native_lto.cy10_bee | 17.423 | 82.552 | 0.024 | 0.002 | nonzero | 0.016 |
Insert response time histogram: each cell has the percentage of responses that take <= the time in the header and max is the max response time in seconds. For max values in the top 25% of the range have a red background and in the bottom 25% of the range have a green background. The red background is not used when the min value is within 80% of the max value.
| dbms | 256us | 1ms | 4ms | 16ms | 64ms | 256ms | 1s | 4s | 16s | gt | max |
|---|---|---|---|---|---|---|---|---|---|---|---|
| fbmy5635_rel.cy10_bee | 98.764 | 1.236 | 0.014 | ||||||||
| fbmy8028_rel_native_lto.cy10_bee | 98.840 | 1.118 | 0.042 | 0.022 |
Delete response time histogram: each cell has the percentage of responses that take <= the time in the header and max is the max response time in seconds. For max values in the top 25% of the range have a red background and in the bottom 25% of the range have a green background. The red background is not used when the min value is within 80% of the max value.
| dbms | 256us | 1ms | 4ms | 16ms | 64ms | 256ms | 1s | 4s | 16s | gt | max |
|---|---|---|---|---|---|---|---|---|---|---|---|
| fbmy5635_rel.cy10_bee | 87.951 | 12.014 | 0.035 | 0.031 | |||||||
| fbmy8028_rel_native_lto.cy10_bee | 83.431 | 16.389 | 0.181 | 0.022 |
Performance metrics for the DBMS listed above. Some are normalized by throughput, others are not. Legend for results is here.
ips	qps	rps	rmbps	wps	wmbps	rpq	rkbpq	wpi	wkbpi	csps	cpups	cspq	cpupq	dbgb1	dbgb2	rss	maxop	p50	p99	tag
398	11298	59	1.5	8.0	1.9	0.005	0.135	0.020	4.802	42768	50.5	3.785	358	1.6	2.0	10.3	0.020	2765	2397	20m.fbmy5635_rel.cy10_bee
397	11146	131	3.1	8.9	2.2	0.012	0.284	0.022	5.556	42439	51.2	3.807	367	1.6	2.2	10.9	0.016	2813	1998	20m.fbmy8028_rel_native_lto.cy10_bee
q500.1
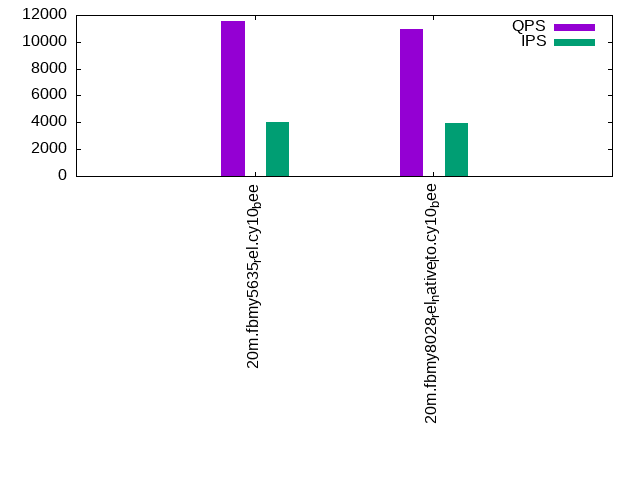
q500.1: range queries with 500 insert/s per client. Graphs for performance per 1-second interval are here.
Average throughput:
Query response time histogram: each cell has the percentage of responses that take <= the time in the header and max is the max response time in seconds. For max values in the top 25% of the range have a red background and in the bottom 25% of the range have a green background. The red background is not used when the min value is within 80% of the max value.
| dbms | 256us | 1ms | 4ms | 16ms | 64ms | 256ms | 1s | 4s | 16s | gt | max |
|---|---|---|---|---|---|---|---|---|---|---|---|
| fbmy5635_rel.cy10_bee | 19.018 | 80.913 | 0.065 | 0.005 | nonzero | 0.019 | |||||
| fbmy8028_rel_native_lto.cy10_bee | 13.961 | 85.962 | 0.068 | 0.009 | nonzero | 0.024 |
Insert response time histogram: each cell has the percentage of responses that take <= the time in the header and max is the max response time in seconds. For max values in the top 25% of the range have a red background and in the bottom 25% of the range have a green background. The red background is not used when the min value is within 80% of the max value.
| dbms | 256us | 1ms | 4ms | 16ms | 64ms | 256ms | 1s | 4s | 16s | gt | max |
|---|---|---|---|---|---|---|---|---|---|---|---|
| fbmy5635_rel.cy10_bee | 96.497 | 3.478 | 0.025 | 0.047 | |||||||
| fbmy8028_rel_native_lto.cy10_bee | 91.926 | 8.024 | 0.046 | 0.004 | 0.084 |
Delete response time histogram: each cell has the percentage of responses that take <= the time in the header and max is the max response time in seconds. For max values in the top 25% of the range have a red background and in the bottom 25% of the range have a green background. The red background is not used when the min value is within 80% of the max value.
| dbms | 256us | 1ms | 4ms | 16ms | 64ms | 256ms | 1s | 4s | 16s | gt | max |
|---|---|---|---|---|---|---|---|---|---|---|---|
| fbmy5635_rel.cy10_bee | 94.463 | 5.496 | 0.042 | 0.048 | |||||||
| fbmy8028_rel_native_lto.cy10_bee | 89.826 | 10.131 | 0.037 | 0.006 | 0.090 |
Performance metrics for the DBMS listed above. Some are normalized by throughput, others are not. Legend for results is here.
ips	qps	rps	rmbps	wps	wmbps	rpq	rkbpq	wpi	wkbpi	csps	cpups	cspq	cpupq	dbgb1	dbgb2	rss	maxop	p50	p99	tag
1993	11497	25	1.2	12.4	3.7	0.002	0.102	0.006	1.910	42843	52.2	3.726	363	1.7	2.8	10.8	0.019	2861	2526	20m.fbmy5635_rel.cy10_bee
1993	11010	133	2.1	12.3	3.5	0.012	0.198	0.006	1.815	41488	52.6	3.768	382	1.7	3.0	11.0	0.024	2749	2269	20m.fbmy8028_rel_native_lto.cy10_bee
q1000.1
q1000.1: range queries with 1000 insert/s per client. Graphs for performance per 1-second interval are here.
Average throughput:
Query response time histogram: each cell has the percentage of responses that take <= the time in the header and max is the max response time in seconds. For max values in the top 25% of the range have a red background and in the bottom 25% of the range have a green background. The red background is not used when the min value is within 80% of the max value.
| dbms | 256us | 1ms | 4ms | 16ms | 64ms | 256ms | 1s | 4s | 16s | gt | max |
|---|---|---|---|---|---|---|---|---|---|---|---|
| fbmy5635_rel.cy10_bee | 18.029 | 81.783 | 0.175 | 0.013 | nonzero | 0.017 | |||||
| fbmy8028_rel_native_lto.cy10_bee | 12.016 | 87.859 | 0.112 | 0.012 | nonzero | 0.017 |
Insert response time histogram: each cell has the percentage of responses that take <= the time in the header and max is the max response time in seconds. For max values in the top 25% of the range have a red background and in the bottom 25% of the range have a green background. The red background is not used when the min value is within 80% of the max value.
| dbms | 256us | 1ms | 4ms | 16ms | 64ms | 256ms | 1s | 4s | 16s | gt | max |
|---|---|---|---|---|---|---|---|---|---|---|---|
| fbmy5635_rel.cy10_bee | 93.663 | 6.314 | 0.024 | 0.057 | |||||||
| fbmy8028_rel_native_lto.cy10_bee | 98.383 | 1.606 | 0.008 | 0.003 | 0.094 |
Delete response time histogram: each cell has the percentage of responses that take <= the time in the header and max is the max response time in seconds. For max values in the top 25% of the range have a red background and in the bottom 25% of the range have a green background. The red background is not used when the min value is within 80% of the max value.
| dbms | 256us | 1ms | 4ms | 16ms | 64ms | 256ms | 1s | 4s | 16s | gt | max |
|---|---|---|---|---|---|---|---|---|---|---|---|
| fbmy5635_rel.cy10_bee | 92.652 | 7.316 | 0.032 | 0.057 | |||||||
| fbmy8028_rel_native_lto.cy10_bee | 97.936 | 2.051 | 0.010 | 0.003 | 0.088 |
Performance metrics for the DBMS listed above. Some are normalized by throughput, others are not. Legend for results is here.
ips	qps	rps	rmbps	wps	wmbps	rpq	rkbpq	wpi	wkbpi	csps	cpups	cspq	cpupq	dbgb1	dbgb2	rss	maxop	p50	p99	tag
3989	11557	54	2.2	23.6	7.5	0.005	0.199	0.006	1.935	42320	55.2	3.662	382	1.7	2.4	10.7	0.017	2845	2494	20m.fbmy5635_rel.cy10_bee
3987	10949	193	3.9	25.4	7.7	0.018	0.363	0.006	1.971	40098	56.1	3.662	410	1.7	2.6	11.0	0.017	2719	2238	20m.fbmy8028_rel_native_lto.cy10_bee
l.i0
l.i0: load without secondary indexes
Performance metrics for all DBMS, not just the ones listed above. Some are normalized by throughput, others are not. Legend for results is here.
ips	qps	rps	rmbps	wps	wmbps	rpq	rkbpq	wpi	wkbpi	csps	cpups	cspq	cpupq	dbgb1	dbgb2	rss	maxop	p50	p99	tag
194175	0	0	0.0	123.2	51.3	0.000	0.000	0.001	0.270	20104	71.7	0.104	30	0.9	1.9	0.4	0.108	54540	3496	20m.fbmy5635_rel.cy10_bee
158730	0	0	0.0	112.4	44.3	0.000	0.000	0.001	0.286	16144	65.9	0.102	33	0.7	1.9	0.7	0.119	43052	35573	20m.fbmy8028_rel_native_lto.cy10_bee
l.x
l.x: create secondary indexes
Performance metrics for all DBMS, not just the ones listed above. Some are normalized by throughput, others are not. Legend for results is here.
ips	qps	rps	rmbps	wps	wmbps	rpq	rkbpq	wpi	wkbpi	csps	cpups	cspq	cpupq	dbgb1	dbgb2	rss	maxop	p50	p99	tag
304545	0	1	0.0	135.7	56.2	0.000	0.000	0.000	0.189	666	46.9	0.002	12	1.4	2.4	2.1	0.004	NA	NA	20m.fbmy5635_rel.cy10_bee
283098	0	1	0.0	114.3	47.4	0.000	0.000	0.000	0.171	872	45.2	0.003	13	1.4	2.7	2.2	0.013	NA	NA	20m.fbmy8028_rel_native_lto.cy10_bee
l.i1
l.i1: continue load after secondary indexes created
Performance metrics for all DBMS, not just the ones listed above. Some are normalized by throughput, others are not. Legend for results is here.
ips	qps	rps	rmbps	wps	wmbps	rpq	rkbpq	wpi	wkbpi	csps	cpups	cspq	cpupq	dbgb1	dbgb2	rss	maxop	p50	p99	tag
39877	0	140	2.4	145.7	57.5	0.004	0.062	0.004	1.478	18782	68.2	0.471	137	5.5	5.8	6.5	0.126	10039	8790	20m.fbmy5635_rel.cy10_bee
40530	0	185	5.6	156.6	59.3	0.005	0.143	0.004	1.498	16939	73.4	0.418	145	4.9	5.3	7.4	0.128	10143	8790	20m.fbmy8028_rel_native_lto.cy10_bee
q100.1
q100.1: range queries with 100 insert/s per client
Performance metrics for all DBMS, not just the ones listed above. Some are normalized by throughput, others are not. Legend for results is here.
ips	qps	rps	rmbps	wps	wmbps	rpq	rkbpq	wpi	wkbpi	csps	cpups	cspq	cpupq	dbgb1	dbgb2	rss	maxop	p50	p99	tag
398	11298	59	1.5	8.0	1.9	0.005	0.135	0.020	4.802	42768	50.5	3.785	358	1.6	2.0	10.3	0.020	2765	2397	20m.fbmy5635_rel.cy10_bee
397	11146	131	3.1	8.9	2.2	0.012	0.284	0.022	5.556	42439	51.2	3.807	367	1.6	2.2	10.9	0.016	2813	1998	20m.fbmy8028_rel_native_lto.cy10_bee
q500.1
q500.1: range queries with 500 insert/s per client
Performance metrics for all DBMS, not just the ones listed above. Some are normalized by throughput, others are not. Legend for results is here.
ips	qps	rps	rmbps	wps	wmbps	rpq	rkbpq	wpi	wkbpi	csps	cpups	cspq	cpupq	dbgb1	dbgb2	rss	maxop	p50	p99	tag
1993	11497	25	1.2	12.4	3.7	0.002	0.102	0.006	1.910	42843	52.2	3.726	363	1.7	2.8	10.8	0.019	2861	2526	20m.fbmy5635_rel.cy10_bee
1993	11010	133	2.1	12.3	3.5	0.012	0.198	0.006	1.815	41488	52.6	3.768	382	1.7	3.0	11.0	0.024	2749	2269	20m.fbmy8028_rel_native_lto.cy10_bee
q1000.1
q1000.1: range queries with 1000 insert/s per client
Performance metrics for all DBMS, not just the ones listed above. Some are normalized by throughput, others are not. Legend for results is here.
ips	qps	rps	rmbps	wps	wmbps	rpq	rkbpq	wpi	wkbpi	csps	cpups	cspq	cpupq	dbgb1	dbgb2	rss	maxop	p50	p99	tag
3989	11557	54	2.2	23.6	7.5	0.005	0.199	0.006	1.935	42320	55.2	3.662	382	1.7	2.4	10.7	0.017	2845	2494	20m.fbmy5635_rel.cy10_bee
3987	10949	193	3.9	25.4	7.7	0.018	0.363	0.006	1.971	40098	56.1	3.662	410	1.7	2.6	11.0	0.017	2719	2238	20m.fbmy8028_rel_native_lto.cy10_bee
l.i0
- l.i0: load without secondary indexes
- Legend for results is here.
- Each entry lists the percentage of responses that fit in that bucket (slower than max time for previous bucket, faster than min time for next bucket).
Insert response time histogram
256us	1ms	4ms	16ms	64ms	256ms	1s	4s	16s	gt	max	tag
0.000	0.000	99.763	0.223	0.002	0.013	0.000	0.000	0.000	0.000	0.108	fbmy5635_rel.cy10_bee
0.000	0.000	99.305	0.473	0.209	0.013	0.000	0.000	0.000	0.000	0.119	fbmy8028_rel_native_lto.cy10_bee
l.x
- l.x: create secondary indexes
- Legend for results is here.
- Each entry lists the percentage of responses that fit in that bucket (slower than max time for previous bucket, faster than min time for next bucket).
TODO - determine whether there is data for create index response time
l.i1
- l.i1: continue load after secondary indexes created
- Legend for results is here.
- Each entry lists the percentage of responses that fit in that bucket (slower than max time for previous bucket, faster than min time for next bucket).
Insert response time histogram
256us	1ms	4ms	16ms	64ms	256ms	1s	4s	16s	gt	max	tag
0.000	0.000	24.317	75.658	0.017	0.008	0.000	0.000	0.000	0.000	0.126	fbmy5635_rel.cy10_bee
0.000	0.000	29.020	70.845	0.123	0.012	0.000	0.000	0.000	0.000	0.128	fbmy8028_rel_native_lto.cy10_bee
Delete response time histogram
256us	1ms	4ms	16ms	64ms	256ms	1s	4s	16s	gt	max	tag
0.000	0.000	22.001	77.970	0.020	0.009	0.000	0.000	0.000	0.000	0.126	fbmy5635_rel.cy10_bee
0.000	0.000	27.319	72.543	0.126	0.012	0.000	0.000	0.000	0.000	0.174	fbmy8028_rel_native_lto.cy10_bee
q100.1
- q100.1: range queries with 100 insert/s per client
- Legend for results is here.
- Each entry lists the percentage of responses that fit in that bucket (slower than max time for previous bucket, faster than min time for next bucket).
Query response time histogram
256us	1ms	4ms	16ms	64ms	256ms	1s	4s	16s	gt	max	tag
16.766	83.214	0.018	0.001	nonzero	0.000	0.000	0.000	0.000	0.000	0.020	fbmy5635_rel.cy10_bee
17.423	82.552	0.024	0.002	nonzero	0.000	0.000	0.000	0.000	0.000	0.016	fbmy8028_rel_native_lto.cy10_bee
Insert response time histogram
256us	1ms	4ms	16ms	64ms	256ms	1s	4s	16s	gt	max	tag
0.000	0.000	98.764	1.236	0.000	0.000	0.000	0.000	0.000	0.000	0.014	fbmy5635_rel.cy10_bee
0.000	0.000	98.840	1.118	0.042	0.000	0.000	0.000	0.000	0.000	0.022	fbmy8028_rel_native_lto.cy10_bee
Delete response time histogram
256us	1ms	4ms	16ms	64ms	256ms	1s	4s	16s	gt	max	tag
0.000	0.000	87.951	12.014	0.035	0.000	0.000	0.000	0.000	0.000	0.031	fbmy5635_rel.cy10_bee
0.000	0.000	83.431	16.389	0.181	0.000	0.000	0.000	0.000	0.000	0.022	fbmy8028_rel_native_lto.cy10_bee
q500.1
- q500.1: range queries with 500 insert/s per client
- Legend for results is here.
- Each entry lists the percentage of responses that fit in that bucket (slower than max time for previous bucket, faster than min time for next bucket).
Query response time histogram
256us	1ms	4ms	16ms	64ms	256ms	1s	4s	16s	gt	max	tag
19.018	80.913	0.065	0.005	nonzero	0.000	0.000	0.000	0.000	0.000	0.019	fbmy5635_rel.cy10_bee
13.961	85.962	0.068	0.009	nonzero	0.000	0.000	0.000	0.000	0.000	0.024	fbmy8028_rel_native_lto.cy10_bee
Insert response time histogram
256us	1ms	4ms	16ms	64ms	256ms	1s	4s	16s	gt	max	tag
0.000	0.000	96.497	3.478	0.025	0.000	0.000	0.000	0.000	0.000	0.047	fbmy5635_rel.cy10_bee
0.000	0.000	91.926	8.024	0.046	0.004	0.000	0.000	0.000	0.000	0.084	fbmy8028_rel_native_lto.cy10_bee
Delete response time histogram
256us	1ms	4ms	16ms	64ms	256ms	1s	4s	16s	gt	max	tag
0.000	0.000	94.463	5.496	0.042	0.000	0.000	0.000	0.000	0.000	0.048	fbmy5635_rel.cy10_bee
0.000	0.000	89.826	10.131	0.037	0.006	0.000	0.000	0.000	0.000	0.090	fbmy8028_rel_native_lto.cy10_bee
q1000.1
- q1000.1: range queries with 1000 insert/s per client
- Legend for results is here.
- Each entry lists the percentage of responses that fit in that bucket (slower than max time for previous bucket, faster than min time for next bucket).
Query response time histogram
256us	1ms	4ms	16ms	64ms	256ms	1s	4s	16s	gt	max	tag
18.029	81.783	0.175	0.013	nonzero	0.000	0.000	0.000	0.000	0.000	0.017	fbmy5635_rel.cy10_bee
12.016	87.859	0.112	0.012	nonzero	0.000	0.000	0.000	0.000	0.000	0.017	fbmy8028_rel_native_lto.cy10_bee
Insert response time histogram
256us	1ms	4ms	16ms	64ms	256ms	1s	4s	16s	gt	max	tag
0.000	0.000	93.663	6.314	0.024	0.000	0.000	0.000	0.000	0.000	0.057	fbmy5635_rel.cy10_bee
0.000	0.000	98.383	1.606	0.008	0.003	0.000	0.000	0.000	0.000	0.094	fbmy8028_rel_native_lto.cy10_bee
Delete response time histogram
256us	1ms	4ms	16ms	64ms	256ms	1s	4s	16s	gt	max	tag
0.000	0.000	92.652	7.316	0.032	0.000	0.000	0.000	0.000	0.000	0.057	fbmy5635_rel.cy10_bee
0.000	0.000	97.936	2.051	0.010	0.003	0.000	0.000	0.000	0.000	0.088	fbmy8028_rel_native_lto.cy10_bee