Introduction
This is a report for the insert benchmark with 20M docs and 1 client(s). It is generated by scripts (bash, awk, sed) and Tufte might not be impressed. An overview of the insert benchmark is here and a short update is here. Below, by DBMS, I mean DBMS+version.config. An example is my8020.c10b40 where my means MySQL, 8020 is version 8.0.20 and c10b40 is the name for the configuration file.
The test server has 8 AMD cores, 16G RAM and an NVMe SSD. It is described here as the Beelink. The benchmark was run with 1 client and there were 1 or 3 connections per client (1 for queries or inserts without rate limits, 1+1 for rate limited inserts+deletes). It uses 1 table. It loads 20M rows per table without secondary indexes, creates secondary indexes, then inserts 50M rows per table with a delete per insert to avoid growing the table. It then does 3 read+write tests for 1800s each that do queries as fast as possible with 100, 500 and then 1000 inserts/second/client concurrent with the queries and 1000 deletes/second to avoid growing the table. The database is cached by the storage engine and the only IO is for writes. Clients and the DBMS share one server. The per-database configs are in the per-database subdirectories here.
The tested DBMS are:
- fbmy5635_rel.cy10_1g_bee - - MyRocks 5.6.35, the cy10_1g_bee config and compiled with CMAKE_BUILD_TYPE=Release: -O3
- fbmy8028_rel_native_lto.cy10_1g_bee - MyRocks 8.0.28, the cy10_1g_bee config and compiled with CMAKE_BUILD_TYPE=Release: -O3 -flto -march=native -mtune=native
Contents
- Summary
- l.i0: load without secondary indexes
- l.x: create secondary indexes
- l.i1: continue load after secondary indexes created
- q100.1: range queries with 100 insert/s per client
- q500.1: range queries with 500 insert/s per client
- q1000.1: range queries with 1000 insert/s per client
Summary
The numbers are inserts/s for l.i0 and l.i1, indexed docs (or rows) /s for l.x and queries/s for q*.2. The values are the average rate over the entire test for inserts (IPS) and queries (QPS). The range of values for IPS and QPS is split into 3 parts: bottom 25%, middle 50%, top 25%. Values in the bottom 25% have a red background, values in the top 25% have a green background and values in the middle have no color. A gray background is used for values that can be ignored because the DBMS did not sustain the target insert rate. Red backgrounds are not used when the minimum value is within 80% of the max value.
| dbms | l.i0 | l.x | l.i1 | q100.1 | q500.1 | q1000.1 |
|---|---|---|---|---|---|---|
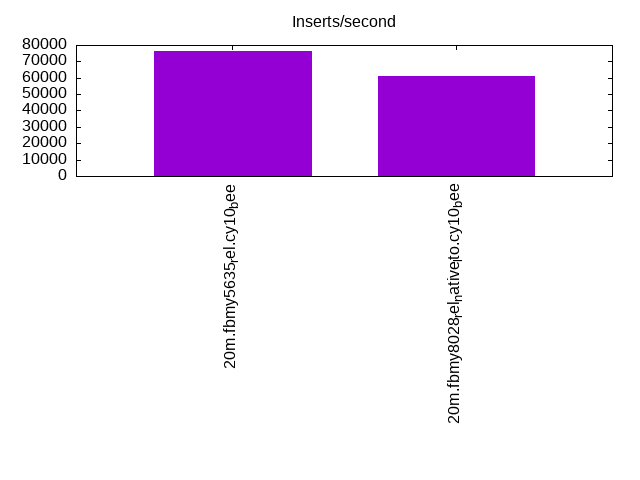
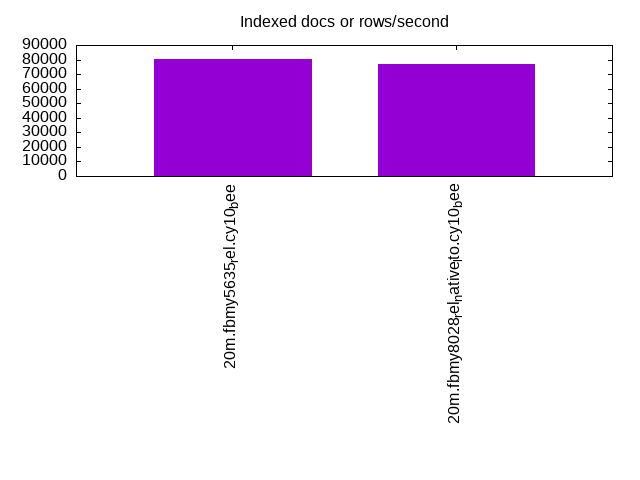
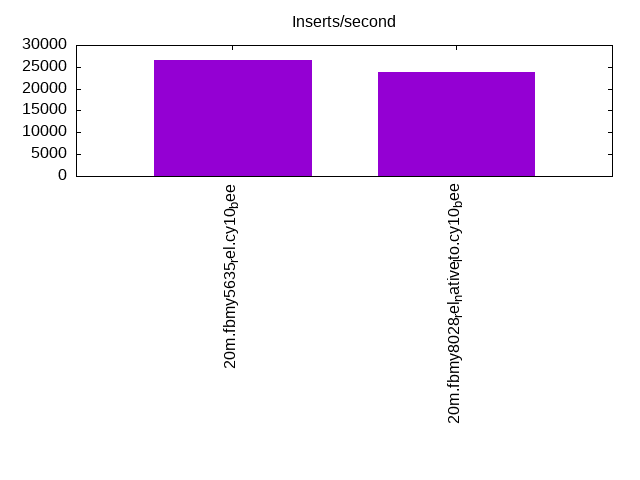
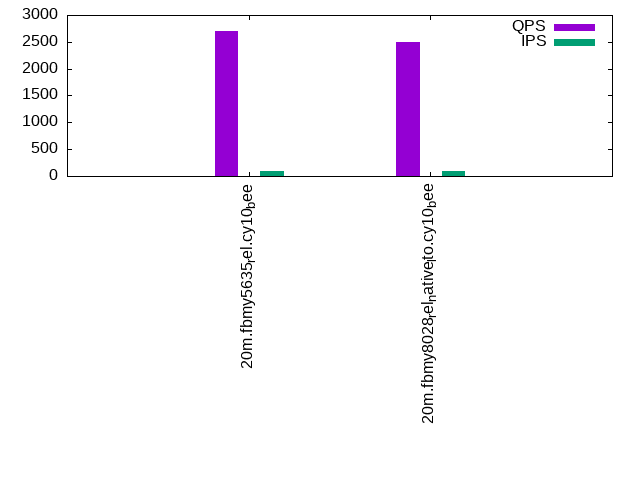
| 20m.fbmy5635_rel.cy10_bee | 76628 | 80723 | 26667 | 2703 | 2634 | 2595 |
| 20m.fbmy8028_rel_native_lto.cy10_bee | 61162 | 77011 | 23866 | 2501 | 2423 | 2387 |
This table has relative throughput, throughput for the DBMS relative to the DBMS in the first line, using the absolute throughput from the previous table.
| dbms | l.i0 | l.x | l.i1 | q100.1 | q500.1 | q1000.1 |
|---|---|---|---|---|---|---|
| 20m.fbmy5635_rel.cy10_bee | 1.00 | 1.00 | 1.00 | 1.00 | 1.00 | 1.00 |
| 20m.fbmy8028_rel_native_lto.cy10_bee | 0.80 | 0.95 | 0.89 | 0.93 | 0.92 | 0.92 |
This lists the average rate of inserts/s for the tests that do inserts concurrent with queries. For such tests the query rate is listed in the table above. The read+write tests are setup so that the insert rate should match the target rate every second. Cells that are not at least 95% of the target have a red background to indicate a failure to satisfy the target.
| dbms | q100.1 | q500.1 | q1000.1 |
|---|---|---|---|
| fbmy5635_rel.cy10_bee | 100 | 498 | 997 |
| fbmy8028_rel_native_lto.cy10_bee | 99 | 498 | 996 |
| target | 100 | 500 | 1000 |
l.i0
l.i0: load without secondary indexes. Graphs for performance per 1-second interval are here.
Average throughput:
Insert response time histogram: each cell has the percentage of responses that take <= the time in the header and max is the max response time in seconds. For the max column values in the top 25% of the range have a red background and in the bottom 25% of the range have a green background. The red background is not used when the min value is within 80% of the max value.
| dbms | 256us | 1ms | 4ms | 16ms | 64ms | 256ms | 1s | 4s | 16s | gt | max |
|---|---|---|---|---|---|---|---|---|---|---|---|
| fbmy5635_rel.cy10_bee | 99.866 | 0.130 | 0.004 | 0.001 | 0.071 | ||||||
| fbmy8028_rel_native_lto.cy10_bee | 99.732 | 0.194 | 0.072 | 0.002 | 0.084 |
Performance metrics for the DBMS listed above. Some are normalized by throughput, others are not. Legend for results is here.
ips	qps	rps	rmbps	wps	wmbps	rpq	rkbpq	wpi	wkbpi	csps	cpups	cspq	cpupq	dbgb1	dbgb2	rss	maxop	p50	p99	tag
76628	0	0	0.0	36.6	13.0	0.000	0.000	0.000	0.174	7565	21.8	0.099	23	0.7	1.8	0.2	0.071	77312	70419	20m.fbmy5635_rel.cy10_bee
61162	0	0	0.0	37.4	11.9	0.000	0.000	0.001	0.199	6323	21.5	0.103	28	0.7	1.9	0.6	0.084	61430	55163	20m.fbmy8028_rel_native_lto.cy10_bee
l.x
l.x: create secondary indexes.
Average throughput:
Performance metrics for the DBMS listed above. Some are normalized by throughput, others are not. Legend for results is here.
ips	qps	rps	rmbps	wps	wmbps	rpq	rkbpq	wpi	wkbpi	csps	cpups	cspq	cpupq	dbgb1	dbgb2	rss	maxop	p50	p99	tag
80723	0	0	0.0	31.7	12.3	0.000	0.000	0.000	0.156	252	11.6	0.003	11	1.5	2.5	1.3	0.009	NA	NA	20m.fbmy5635_rel.cy10_bee
77011	0	0	0.0	29.9	11.7	0.000	0.000	0.000	0.156	427	11.6	0.006	12	1.4	2.7	1.9	0.010	NA	NA	20m.fbmy8028_rel_native_lto.cy10_bee
l.i1
l.i1: continue load after secondary indexes created. Graphs for performance per 1-second interval are here.
Average throughput:
Insert response time histogram: each cell has the percentage of responses that take <= the time in the header and max is the max response time in seconds. For the max column values in the top 25% of the range have a red background and in the bottom 25% of the range have a green background. The red background is not used when the min value is within 80% of the max value.
| dbms | 256us | 1ms | 4ms | 16ms | 64ms | 256ms | 1s | 4s | 16s | gt | max |
|---|---|---|---|---|---|---|---|---|---|---|---|
| fbmy5635_rel.cy10_bee | 99.807 | 0.188 | 0.003 | 0.002 | 0.077 | ||||||
| fbmy8028_rel_native_lto.cy10_bee | 99.680 | 0.255 | 0.061 | 0.003 | 0.103 |
Delete response time histogram: each cell has the percentage of responses that take <= the time in the header and max is the max response time in seconds. For the max column values in the top 25% of the range have a red background and in the bottom 25% of the range have a green background. The red background is not used when the min value is within 80% of the max value.
| dbms | 256us | 1ms | 4ms | 16ms | 64ms | 256ms | 1s | 4s | 16s | gt | max |
|---|---|---|---|---|---|---|---|---|---|---|---|
| fbmy5635_rel.cy10_bee | 99.800 | 0.192 | 0.007 | 0.002 | 0.077 | ||||||
| fbmy8028_rel_native_lto.cy10_bee | 99.670 | 0.260 | 0.067 | 0.003 | 0.111 |
Performance metrics for the DBMS listed above. Some are normalized by throughput, others are not. Legend for results is here.
ips	qps	rps	rmbps	wps	wmbps	rpq	rkbpq	wpi	wkbpi	csps	cpups	cspq	cpupq	dbgb1	dbgb2	rss	maxop	p50	p99	tag
26667	0	18	0.5	101.2	39.2	0.001	0.019	0.004	1.507	11177	44.0	0.419	132	2.4	4.2	5.3	0.077	26620	23973	20m.fbmy5635_rel.cy10_bee
23866	0	18	0.4	98.8	36.4	0.001	0.019	0.004	1.562	10354	43.1	0.434	144	2.3	4.3	5.7	0.103	23786	21433	20m.fbmy8028_rel_native_lto.cy10_bee
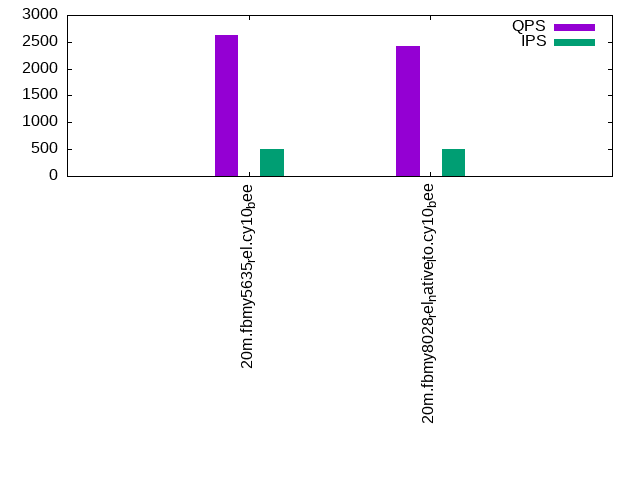
q100.1
q100.1: range queries with 100 insert/s per client. Graphs for performance per 1-second interval are here.
Average throughput:
Query response time histogram: each cell has the percentage of responses that take <= the time in the header and max is the max response time in seconds. For max values in the top 25% of the range have a red background and in the bottom 25% of the range have a green background. The red background is not used when the min value is within 80% of the max value.
| dbms | 256us | 1ms | 4ms | 16ms | 64ms | 256ms | 1s | 4s | 16s | gt | max |
|---|---|---|---|---|---|---|---|---|---|---|---|
| fbmy5635_rel.cy10_bee | 2.513 | 97.485 | 0.002 | 0.003 | |||||||
| fbmy8028_rel_native_lto.cy10_bee | 3.053 | 96.945 | 0.002 | 0.003 |
Insert response time histogram: each cell has the percentage of responses that take <= the time in the header and max is the max response time in seconds. For max values in the top 25% of the range have a red background and in the bottom 25% of the range have a green background. The red background is not used when the min value is within 80% of the max value.
| dbms | 256us | 1ms | 4ms | 16ms | 64ms | 256ms | 1s | 4s | 16s | gt | max |
|---|---|---|---|---|---|---|---|---|---|---|---|
| fbmy5635_rel.cy10_bee | 99.472 | 0.528 | 0.015 | ||||||||
| fbmy8028_rel_native_lto.cy10_bee | 99.361 | 0.583 | 0.056 | 0.023 |
Delete response time histogram: each cell has the percentage of responses that take <= the time in the header and max is the max response time in seconds. For max values in the top 25% of the range have a red background and in the bottom 25% of the range have a green background. The red background is not used when the min value is within 80% of the max value.
| dbms | 256us | 1ms | 4ms | 16ms | 64ms | 256ms | 1s | 4s | 16s | gt | max |
|---|---|---|---|---|---|---|---|---|---|---|---|
| fbmy5635_rel.cy10_bee | 71.944 | 27.639 | 0.417 | 0.023 | |||||||
| fbmy8028_rel_native_lto.cy10_bee | 99.056 | 0.917 | 0.028 | 0.018 |
Performance metrics for the DBMS listed above. Some are normalized by throughput, others are not. Legend for results is here.
ips	qps	rps	rmbps	wps	wmbps	rpq	rkbpq	wpi	wkbpi	csps	cpups	cspq	cpupq	dbgb1	dbgb2	rss	maxop	p50	p99	tag
100	2703	2	0.2	5.2	0.8	0.001	0.062	0.052	7.924	10483	13.1	3.878	388	1.8	3.6	7.1	0.003	2701	2253	20m.fbmy5635_rel.cy10_bee
99	2501	1	0.2	4.7	0.5	0.000	0.091	0.047	5.414	9856	12.9	3.941	413	1.8	3.9	7.4	0.003	2477	2253	20m.fbmy8028_rel_native_lto.cy10_bee
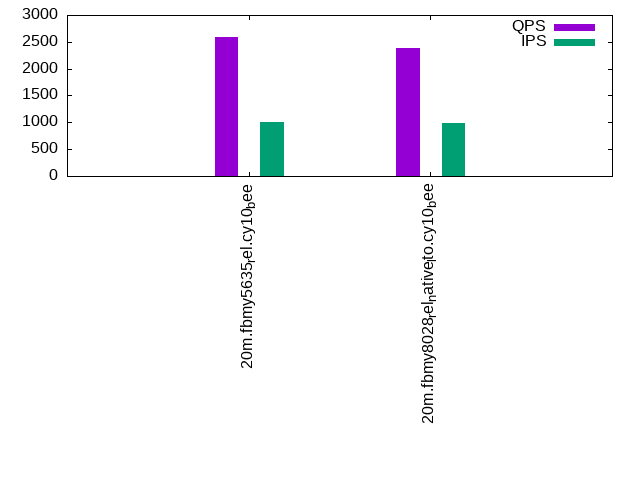
q500.1
q500.1: range queries with 500 insert/s per client. Graphs for performance per 1-second interval are here.
Average throughput:
Query response time histogram: each cell has the percentage of responses that take <= the time in the header and max is the max response time in seconds. For max values in the top 25% of the range have a red background and in the bottom 25% of the range have a green background. The red background is not used when the min value is within 80% of the max value.
| dbms | 256us | 1ms | 4ms | 16ms | 64ms | 256ms | 1s | 4s | 16s | gt | max |
|---|---|---|---|---|---|---|---|---|---|---|---|
| fbmy5635_rel.cy10_bee | 1.903 | 98.097 | nonzero | 0.002 | |||||||
| fbmy8028_rel_native_lto.cy10_bee | 1.924 | 98.075 | 0.001 | 0.003 |
Insert response time histogram: each cell has the percentage of responses that take <= the time in the header and max is the max response time in seconds. For max values in the top 25% of the range have a red background and in the bottom 25% of the range have a green background. The red background is not used when the min value is within 80% of the max value.
| dbms | 256us | 1ms | 4ms | 16ms | 64ms | 256ms | 1s | 4s | 16s | gt | max |
|---|---|---|---|---|---|---|---|---|---|---|---|
| fbmy5635_rel.cy10_bee | 99.556 | 0.444 | 0.009 | ||||||||
| fbmy8028_rel_native_lto.cy10_bee | 99.478 | 0.511 | 0.011 | 0.017 |
Delete response time histogram: each cell has the percentage of responses that take <= the time in the header and max is the max response time in seconds. For max values in the top 25% of the range have a red background and in the bottom 25% of the range have a green background. The red background is not used when the min value is within 80% of the max value.
| dbms | 256us | 1ms | 4ms | 16ms | 64ms | 256ms | 1s | 4s | 16s | gt | max |
|---|---|---|---|---|---|---|---|---|---|---|---|
| fbmy5635_rel.cy10_bee | 90.956 | 8.906 | 0.139 | 0.018 | |||||||
| fbmy8028_rel_native_lto.cy10_bee | 91.378 | 8.506 | 0.117 | 0.018 |
Performance metrics for the DBMS listed above. Some are normalized by throughput, others are not. Legend for results is here.
ips	qps	rps	rmbps	wps	wmbps	rpq	rkbpq	wpi	wkbpi	csps	cpups	cspq	cpupq	dbgb1	dbgb2	rss	maxop	p50	p99	tag
498	2634	3	0.0	5.2	0.9	0.001	0.014	0.010	1.768	10322	13.5	3.919	410	1.7	1.8	8.4	0.002	2637	2429	20m.fbmy5635_rel.cy10_bee
498	2423	3	0.0	5.8	1.1	0.001	0.006	0.012	2.168	9672	13.9	3.992	459	1.8	2.1	8.9	0.003	2413	2221	20m.fbmy8028_rel_native_lto.cy10_bee
q1000.1
q1000.1: range queries with 1000 insert/s per client. Graphs for performance per 1-second interval are here.
Average throughput:
Query response time histogram: each cell has the percentage of responses that take <= the time in the header and max is the max response time in seconds. For max values in the top 25% of the range have a red background and in the bottom 25% of the range have a green background. The red background is not used when the min value is within 80% of the max value.
| dbms | 256us | 1ms | 4ms | 16ms | 64ms | 256ms | 1s | 4s | 16s | gt | max |
|---|---|---|---|---|---|---|---|---|---|---|---|
| fbmy5635_rel.cy10_bee | 1.736 | 98.251 | 0.002 | 0.011 | 0.010 | ||||||
| fbmy8028_rel_native_lto.cy10_bee | 2.342 | 97.649 | 0.002 | 0.007 | 0.010 |
Insert response time histogram: each cell has the percentage of responses that take <= the time in the header and max is the max response time in seconds. For max values in the top 25% of the range have a red background and in the bottom 25% of the range have a green background. The red background is not used when the min value is within 80% of the max value.
| dbms | 256us | 1ms | 4ms | 16ms | 64ms | 256ms | 1s | 4s | 16s | gt | max |
|---|---|---|---|---|---|---|---|---|---|---|---|
| fbmy5635_rel.cy10_bee | 99.683 | 0.314 | 0.003 | 0.045 | |||||||
| fbmy8028_rel_native_lto.cy10_bee | 99.558 | 0.436 | 0.006 | 0.052 |
Delete response time histogram: each cell has the percentage of responses that take <= the time in the header and max is the max response time in seconds. For max values in the top 25% of the range have a red background and in the bottom 25% of the range have a green background. The red background is not used when the min value is within 80% of the max value.
| dbms | 256us | 1ms | 4ms | 16ms | 64ms | 256ms | 1s | 4s | 16s | gt | max |
|---|---|---|---|---|---|---|---|---|---|---|---|
| fbmy5635_rel.cy10_bee | 95.658 | 4.303 | 0.039 | 0.045 | |||||||
| fbmy8028_rel_native_lto.cy10_bee | 95.336 | 4.597 | 0.064 | 0.003 | 0.067 |
Performance metrics for the DBMS listed above. Some are normalized by throughput, others are not. Legend for results is here.
ips	qps	rps	rmbps	wps	wmbps	rpq	rkbpq	wpi	wkbpi	csps	cpups	cspq	cpupq	dbgb1	dbgb2	rss	maxop	p50	p99	tag
997	2595	9	0.3	7.7	1.9	0.004	0.107	0.008	1.911	10375	14.8	3.998	456	1.7	2.2	10.5	0.010	2590	2397	20m.fbmy5635_rel.cy10_bee
996	2387	8	0.2	7.5	1.7	0.003	0.097	0.008	1.766	9770	14.8	4.093	496	1.7	2.3	10.7	0.010	2349	2173	20m.fbmy8028_rel_native_lto.cy10_bee
l.i0
l.i0: load without secondary indexes
Performance metrics for all DBMS, not just the ones listed above. Some are normalized by throughput, others are not. Legend for results is here.
ips	qps	rps	rmbps	wps	wmbps	rpq	rkbpq	wpi	wkbpi	csps	cpups	cspq	cpupq	dbgb1	dbgb2	rss	maxop	p50	p99	tag
76628	0	0	0.0	36.6	13.0	0.000	0.000	0.000	0.174	7565	21.8	0.099	23	0.7	1.8	0.2	0.071	77312	70419	20m.fbmy5635_rel.cy10_bee
61162	0	0	0.0	37.4	11.9	0.000	0.000	0.001	0.199	6323	21.5	0.103	28	0.7	1.9	0.6	0.084	61430	55163	20m.fbmy8028_rel_native_lto.cy10_bee
l.x
l.x: create secondary indexes
Performance metrics for all DBMS, not just the ones listed above. Some are normalized by throughput, others are not. Legend for results is here.
ips	qps	rps	rmbps	wps	wmbps	rpq	rkbpq	wpi	wkbpi	csps	cpups	cspq	cpupq	dbgb1	dbgb2	rss	maxop	p50	p99	tag
80723	0	0	0.0	31.7	12.3	0.000	0.000	0.000	0.156	252	11.6	0.003	11	1.5	2.5	1.3	0.009	NA	NA	20m.fbmy5635_rel.cy10_bee
77011	0	0	0.0	29.9	11.7	0.000	0.000	0.000	0.156	427	11.6	0.006	12	1.4	2.7	1.9	0.010	NA	NA	20m.fbmy8028_rel_native_lto.cy10_bee
l.i1
l.i1: continue load after secondary indexes created
Performance metrics for all DBMS, not just the ones listed above. Some are normalized by throughput, others are not. Legend for results is here.
ips	qps	rps	rmbps	wps	wmbps	rpq	rkbpq	wpi	wkbpi	csps	cpups	cspq	cpupq	dbgb1	dbgb2	rss	maxop	p50	p99	tag
26667	0	18	0.5	101.2	39.2	0.001	0.019	0.004	1.507	11177	44.0	0.419	132	2.4	4.2	5.3	0.077	26620	23973	20m.fbmy5635_rel.cy10_bee
23866	0	18	0.4	98.8	36.4	0.001	0.019	0.004	1.562	10354	43.1	0.434	144	2.3	4.3	5.7	0.103	23786	21433	20m.fbmy8028_rel_native_lto.cy10_bee
q100.1
q100.1: range queries with 100 insert/s per client
Performance metrics for all DBMS, not just the ones listed above. Some are normalized by throughput, others are not. Legend for results is here.
ips	qps	rps	rmbps	wps	wmbps	rpq	rkbpq	wpi	wkbpi	csps	cpups	cspq	cpupq	dbgb1	dbgb2	rss	maxop	p50	p99	tag
100	2703	2	0.2	5.2	0.8	0.001	0.062	0.052	7.924	10483	13.1	3.878	388	1.8	3.6	7.1	0.003	2701	2253	20m.fbmy5635_rel.cy10_bee
99	2501	1	0.2	4.7	0.5	0.000	0.091	0.047	5.414	9856	12.9	3.941	413	1.8	3.9	7.4	0.003	2477	2253	20m.fbmy8028_rel_native_lto.cy10_bee
q500.1
q500.1: range queries with 500 insert/s per client
Performance metrics for all DBMS, not just the ones listed above. Some are normalized by throughput, others are not. Legend for results is here.
ips	qps	rps	rmbps	wps	wmbps	rpq	rkbpq	wpi	wkbpi	csps	cpups	cspq	cpupq	dbgb1	dbgb2	rss	maxop	p50	p99	tag
498	2634	3	0.0	5.2	0.9	0.001	0.014	0.010	1.768	10322	13.5	3.919	410	1.7	1.8	8.4	0.002	2637	2429	20m.fbmy5635_rel.cy10_bee
498	2423	3	0.0	5.8	1.1	0.001	0.006	0.012	2.168	9672	13.9	3.992	459	1.8	2.1	8.9	0.003	2413	2221	20m.fbmy8028_rel_native_lto.cy10_bee
q1000.1
q1000.1: range queries with 1000 insert/s per client
Performance metrics for all DBMS, not just the ones listed above. Some are normalized by throughput, others are not. Legend for results is here.
ips	qps	rps	rmbps	wps	wmbps	rpq	rkbpq	wpi	wkbpi	csps	cpups	cspq	cpupq	dbgb1	dbgb2	rss	maxop	p50	p99	tag
997	2595	9	0.3	7.7	1.9	0.004	0.107	0.008	1.911	10375	14.8	3.998	456	1.7	2.2	10.5	0.010	2590	2397	20m.fbmy5635_rel.cy10_bee
996	2387	8	0.2	7.5	1.7	0.003	0.097	0.008	1.766	9770	14.8	4.093	496	1.7	2.3	10.7	0.010	2349	2173	20m.fbmy8028_rel_native_lto.cy10_bee
l.i0
- l.i0: load without secondary indexes
- Legend for results is here.
- Each entry lists the percentage of responses that fit in that bucket (slower than max time for previous bucket, faster than min time for next bucket).
Insert response time histogram
256us	1ms	4ms	16ms	64ms	256ms	1s	4s	16s	gt	max	tag
0.000	0.000	99.866	0.130	0.004	0.001	0.000	0.000	0.000	0.000	0.071	fbmy5635_rel.cy10_bee
0.000	0.000	99.732	0.194	0.072	0.002	0.000	0.000	0.000	0.000	0.084	fbmy8028_rel_native_lto.cy10_bee
l.x
- l.x: create secondary indexes
- Legend for results is here.
- Each entry lists the percentage of responses that fit in that bucket (slower than max time for previous bucket, faster than min time for next bucket).
TODO - determine whether there is data for create index response time
l.i1
- l.i1: continue load after secondary indexes created
- Legend for results is here.
- Each entry lists the percentage of responses that fit in that bucket (slower than max time for previous bucket, faster than min time for next bucket).
Insert response time histogram
256us	1ms	4ms	16ms	64ms	256ms	1s	4s	16s	gt	max	tag
0.000	0.000	99.807	0.188	0.003	0.002	0.000	0.000	0.000	0.000	0.077	fbmy5635_rel.cy10_bee
0.000	0.000	99.680	0.255	0.061	0.003	0.000	0.000	0.000	0.000	0.103	fbmy8028_rel_native_lto.cy10_bee
Delete response time histogram
256us	1ms	4ms	16ms	64ms	256ms	1s	4s	16s	gt	max	tag
0.000	0.000	99.800	0.192	0.007	0.002	0.000	0.000	0.000	0.000	0.077	fbmy5635_rel.cy10_bee
0.000	0.000	99.670	0.260	0.067	0.003	0.000	0.000	0.000	0.000	0.111	fbmy8028_rel_native_lto.cy10_bee
q100.1
- q100.1: range queries with 100 insert/s per client
- Legend for results is here.
- Each entry lists the percentage of responses that fit in that bucket (slower than max time for previous bucket, faster than min time for next bucket).
Query response time histogram
256us	1ms	4ms	16ms	64ms	256ms	1s	4s	16s	gt	max	tag
2.513	97.485	0.002	0.000	0.000	0.000	0.000	0.000	0.000	0.000	0.003	fbmy5635_rel.cy10_bee
3.053	96.945	0.002	0.000	0.000	0.000	0.000	0.000	0.000	0.000	0.003	fbmy8028_rel_native_lto.cy10_bee
Insert response time histogram
256us	1ms	4ms	16ms	64ms	256ms	1s	4s	16s	gt	max	tag
0.000	0.000	99.472	0.528	0.000	0.000	0.000	0.000	0.000	0.000	0.015	fbmy5635_rel.cy10_bee
0.000	0.000	99.361	0.583	0.056	0.000	0.000	0.000	0.000	0.000	0.023	fbmy8028_rel_native_lto.cy10_bee
Delete response time histogram
256us	1ms	4ms	16ms	64ms	256ms	1s	4s	16s	gt	max	tag
0.000	0.000	71.944	27.639	0.417	0.000	0.000	0.000	0.000	0.000	0.023	fbmy5635_rel.cy10_bee
0.000	0.000	99.056	0.917	0.028	0.000	0.000	0.000	0.000	0.000	0.018	fbmy8028_rel_native_lto.cy10_bee
q500.1
- q500.1: range queries with 500 insert/s per client
- Legend for results is here.
- Each entry lists the percentage of responses that fit in that bucket (slower than max time for previous bucket, faster than min time for next bucket).
Query response time histogram
256us	1ms	4ms	16ms	64ms	256ms	1s	4s	16s	gt	max	tag
1.903	98.097	nonzero	0.000	0.000	0.000	0.000	0.000	0.000	0.000	0.002	fbmy5635_rel.cy10_bee
1.924	98.075	0.001	0.000	0.000	0.000	0.000	0.000	0.000	0.000	0.003	fbmy8028_rel_native_lto.cy10_bee
Insert response time histogram
256us	1ms	4ms	16ms	64ms	256ms	1s	4s	16s	gt	max	tag
0.000	0.000	99.556	0.444	0.000	0.000	0.000	0.000	0.000	0.000	0.009	fbmy5635_rel.cy10_bee
0.000	0.000	99.478	0.511	0.011	0.000	0.000	0.000	0.000	0.000	0.017	fbmy8028_rel_native_lto.cy10_bee
Delete response time histogram
256us	1ms	4ms	16ms	64ms	256ms	1s	4s	16s	gt	max	tag
0.000	0.000	90.956	8.906	0.139	0.000	0.000	0.000	0.000	0.000	0.018	fbmy5635_rel.cy10_bee
0.000	0.000	91.378	8.506	0.117	0.000	0.000	0.000	0.000	0.000	0.018	fbmy8028_rel_native_lto.cy10_bee
q1000.1
- q1000.1: range queries with 1000 insert/s per client
- Legend for results is here.
- Each entry lists the percentage of responses that fit in that bucket (slower than max time for previous bucket, faster than min time for next bucket).
Query response time histogram
256us	1ms	4ms	16ms	64ms	256ms	1s	4s	16s	gt	max	tag
1.736	98.251	0.002	0.011	0.000	0.000	0.000	0.000	0.000	0.000	0.010	fbmy5635_rel.cy10_bee
2.342	97.649	0.002	0.007	0.000	0.000	0.000	0.000	0.000	0.000	0.010	fbmy8028_rel_native_lto.cy10_bee
Insert response time histogram
256us	1ms	4ms	16ms	64ms	256ms	1s	4s	16s	gt	max	tag
0.000	0.000	99.683	0.314	0.003	0.000	0.000	0.000	0.000	0.000	0.045	fbmy5635_rel.cy10_bee
0.000	0.000	99.558	0.436	0.006	0.000	0.000	0.000	0.000	0.000	0.052	fbmy8028_rel_native_lto.cy10_bee
Delete response time histogram
256us	1ms	4ms	16ms	64ms	256ms	1s	4s	16s	gt	max	tag
0.000	0.000	95.658	4.303	0.039	0.000	0.000	0.000	0.000	0.000	0.045	fbmy5635_rel.cy10_bee
0.000	0.000	95.336	4.597	0.064	0.003	0.000	0.000	0.000	0.000	0.067	fbmy8028_rel_native_lto.cy10_bee