Introduction
This is a report for the insert benchmark with 20M docs and 1 client(s). It is generated by scripts (bash, awk, sed) and Tufte might not be impressed. An overview of the insert benchmark is here and a short update is here. Below, by DBMS, I mean DBMS+version.config. An example is my8020.c10b40 where my means MySQL, 8020 is version 8.0.20 and c10b40 is the name for the configuration file.
The test server has 8 AMD cores, 16G RAM and an NVMe SSD. It is described here as the Beelink. The benchmark was run with 1 client and there were 1 or 3 connections per client (1 for queries or inserts without rate limits, 1+1 for rate limited inserts+deletes). It uses 1 table. It loads 20M rows per table without secondary indexes, creates secondary indexes, then inserts 50M rows per table with a delete per insert to avoid growing the table. It then does 3 read+write tests for 1800s each that do queries as fast as possible with 100, 500 and then 1000 inserts/second/client concurrent with the queries and 1000 deletes/second to avoid growing the table. The database is cached by the OS page cache but not by the storage engine. Clients and the DBMS share one server. The per-database configs are in the per-database subdirectories here.
The tested DBMS are:
- fbmy5635_rel.cy10_1g_bee - - MyRocks 5.6.35, the cy10_1g_bee config and compiled with CMAKE_BUILD_TYPE=Release: -O3
- fbmy8028_rel_native_lto.cy10_1g_bee - MyRocks 8.0.28, the cy10_1g_bee config and compiled with CMAKE_BUILD_TYPE=Release: -O3 -flto -march=native -mtune=native
Contents
- Summary
- l.i0: load without secondary indexes
- l.x: create secondary indexes
- l.i1: continue load after secondary indexes created
- q100.1: range queries with 100 insert/s per client
- q500.1: range queries with 500 insert/s per client
- q1000.1: range queries with 1000 insert/s per client
Summary
The numbers are inserts/s for l.i0 and l.i1, indexed docs (or rows) /s for l.x and queries/s for q*.2. The values are the average rate over the entire test for inserts (IPS) and queries (QPS). The range of values for IPS and QPS is split into 3 parts: bottom 25%, middle 50%, top 25%. Values in the bottom 25% have a red background, values in the top 25% have a green background and values in the middle have no color. A gray background is used for values that can be ignored because the DBMS did not sustain the target insert rate. Red backgrounds are not used when the minimum value is within 80% of the max value.
| dbms | l.i0 | l.x | l.i1 | q100.1 | q500.1 | q1000.1 |
|---|---|---|---|---|---|---|
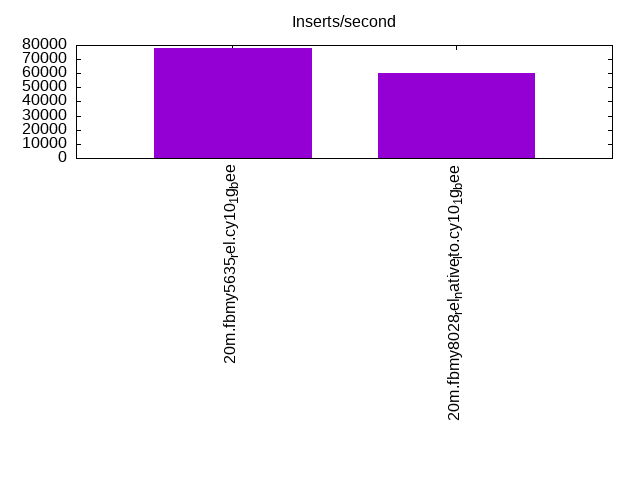
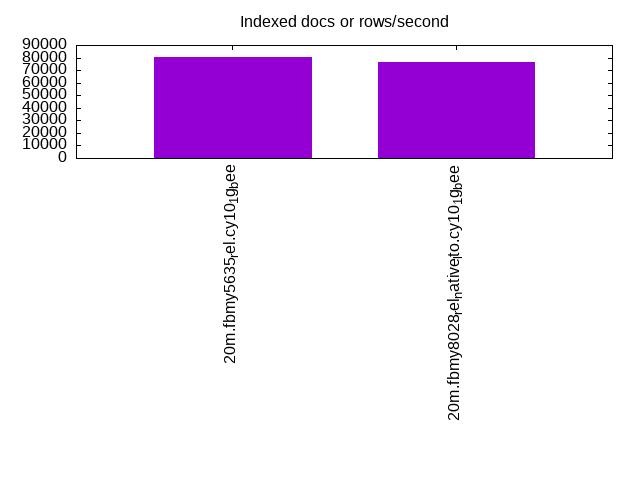
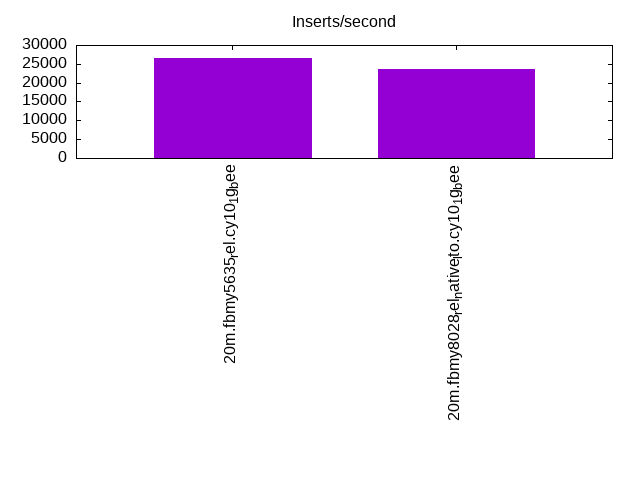
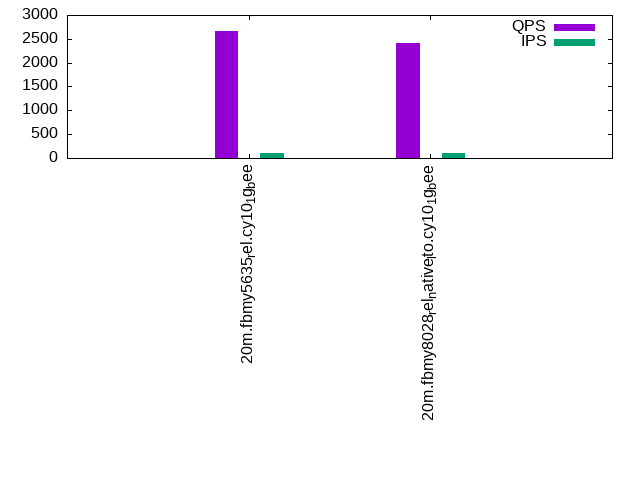
| 20m.fbmy5635_rel.cy10_1g_bee | 78125 | 80723 | 26652 | 2658 | 2607 | 2575 |
| 20m.fbmy8028_rel_native_lto.cy10_1g_bee | 60241 | 76136 | 23585 | 2407 | 2388 | 2378 |
This table has relative throughput, throughput for the DBMS relative to the DBMS in the first line, using the absolute throughput from the previous table.
| dbms | l.i0 | l.x | l.i1 | q100.1 | q500.1 | q1000.1 |
|---|---|---|---|---|---|---|
| 20m.fbmy5635_rel.cy10_1g_bee | 1.00 | 1.00 | 1.00 | 1.00 | 1.00 | 1.00 |
| 20m.fbmy8028_rel_native_lto.cy10_1g_bee | 0.77 | 0.94 | 0.88 | 0.91 | 0.92 | 0.92 |
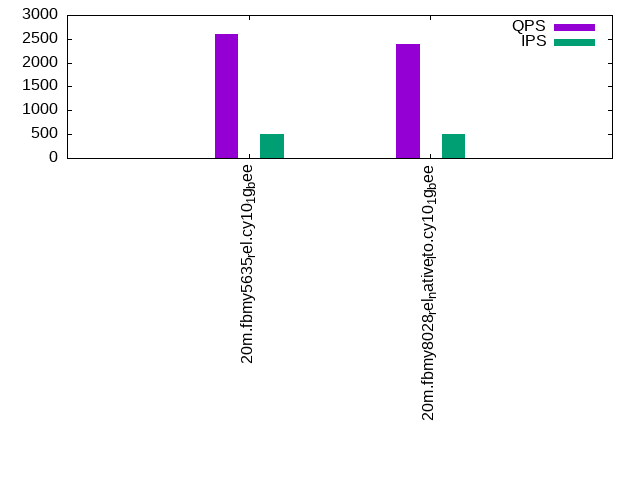
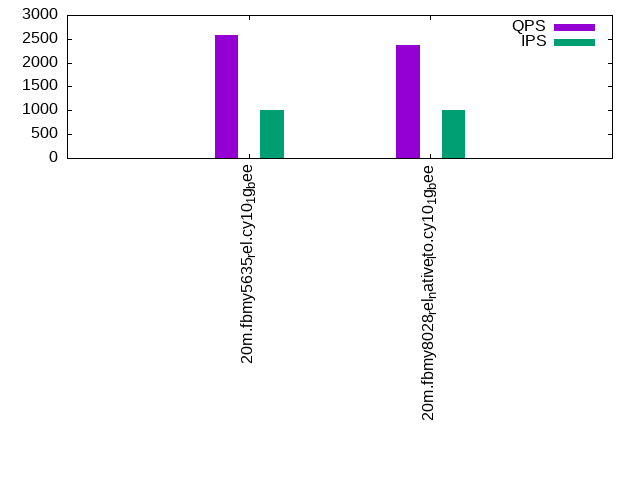
This lists the average rate of inserts/s for the tests that do inserts concurrent with queries. For such tests the query rate is listed in the table above. The read+write tests are setup so that the insert rate should match the target rate every second. Cells that are not at least 95% of the target have a red background to indicate a failure to satisfy the target.
| dbms | q100.1 | q500.1 | q1000.1 |
|---|---|---|---|
| fbmy5635_rel.cy10_1g_bee | 100 | 498 | 997 |
| fbmy8028_rel_native_lto.cy10_1g_bee | 100 | 499 | 997 |
| target | 100 | 500 | 1000 |
l.i0
l.i0: load without secondary indexes. Graphs for performance per 1-second interval are here.
Average throughput:
Insert response time histogram: each cell has the percentage of responses that take <= the time in the header and max is the max response time in seconds. For the max column values in the top 25% of the range have a red background and in the bottom 25% of the range have a green background. The red background is not used when the min value is within 80% of the max value.
| dbms | 256us | 1ms | 4ms | 16ms | 64ms | 256ms | 1s | 4s | 16s | gt | max |
|---|---|---|---|---|---|---|---|---|---|---|---|
| fbmy5635_rel.cy10_1g_bee | 99.870 | 0.126 | 0.005 | 0.061 | |||||||
| fbmy8028_rel_native_lto.cy10_1g_bee | 99.731 | 0.189 | 0.078 | 0.003 | 0.083 |
Performance metrics for the DBMS listed above. Some are normalized by throughput, others are not. Legend for results is here.
ips	qps	rps	rmbps	wps	wmbps	rpq	rkbpq	wpi	wkbpi	csps	cpups	cspq	cpupq	dbgb1	dbgb2	rss	maxop	p50	p99	tag
78125	0	0	0.0	36.4	13.3	0.000	0.000	0.000	0.174	7686	22.4	0.098	23	0.7	1.8	0.2	0.061	79010	72720	20m.fbmy5635_rel.cy10_1g_bee
60241	0	0	0.0	36.6	11.8	0.000	0.000	0.001	0.201	6290	21.5	0.104	29	0.7	1.9	0.6	0.083	60730	54338	20m.fbmy8028_rel_native_lto.cy10_1g_bee
l.x
l.x: create secondary indexes.
Average throughput:
Performance metrics for the DBMS listed above. Some are normalized by throughput, others are not. Legend for results is here.
ips	qps	rps	rmbps	wps	wmbps	rpq	rkbpq	wpi	wkbpi	csps	cpups	cspq	cpupq	dbgb1	dbgb2	rss	maxop	p50	p99	tag
80723	0	0	0.0	32.0	12.2	0.000	0.000	0.000	0.155	257	11.5	0.003	11	1.5	2.5	1.3	0.009	NA	NA	20m.fbmy5635_rel.cy10_1g_bee
76136	0	0	0.0	29.2	11.5	0.000	0.000	0.000	0.155	396	11.6	0.005	12	1.4	2.7	1.8	0.009	NA	NA	20m.fbmy8028_rel_native_lto.cy10_1g_bee
l.i1
l.i1: continue load after secondary indexes created. Graphs for performance per 1-second interval are here.
Average throughput:
Insert response time histogram: each cell has the percentage of responses that take <= the time in the header and max is the max response time in seconds. For the max column values in the top 25% of the range have a red background and in the bottom 25% of the range have a green background. The red background is not used when the min value is within 80% of the max value.
| dbms | 256us | 1ms | 4ms | 16ms | 64ms | 256ms | 1s | 4s | 16s | gt | max |
|---|---|---|---|---|---|---|---|---|---|---|---|
| fbmy5635_rel.cy10_1g_bee | 99.805 | 0.190 | 0.003 | 0.002 | 0.110 | ||||||
| fbmy8028_rel_native_lto.cy10_1g_bee | 99.680 | 0.245 | 0.072 | 0.003 | 0.123 |
Delete response time histogram: each cell has the percentage of responses that take <= the time in the header and max is the max response time in seconds. For the max column values in the top 25% of the range have a red background and in the bottom 25% of the range have a green background. The red background is not used when the min value is within 80% of the max value.
| dbms | 256us | 1ms | 4ms | 16ms | 64ms | 256ms | 1s | 4s | 16s | gt | max |
|---|---|---|---|---|---|---|---|---|---|---|---|
| fbmy5635_rel.cy10_1g_bee | 99.797 | 0.193 | 0.008 | 0.002 | 0.110 | ||||||
| fbmy8028_rel_native_lto.cy10_1g_bee | 99.673 | 0.246 | 0.078 | 0.003 | 0.106 |
Performance metrics for the DBMS listed above. Some are normalized by throughput, others are not. Legend for results is here.
ips	qps	rps	rmbps	wps	wmbps	rpq	rkbpq	wpi	wkbpi	csps	cpups	cspq	cpupq	dbgb1	dbgb2	rss	maxop	p50	p99	tag
26652	0	3	0.4	101.1	39.5	0.000	0.015	0.004	1.518	11205	44.2	0.420	133	2.3	4.1	1.4	0.110	26620	23874	20m.fbmy5635_rel.cy10_1g_bee
23585	0	3	0.3	97.4	36.6	0.000	0.015	0.004	1.587	10204	43.4	0.433	147	2.5	4.5	1.8	0.123	23574	21127	20m.fbmy8028_rel_native_lto.cy10_1g_bee
q100.1
q100.1: range queries with 100 insert/s per client. Graphs for performance per 1-second interval are here.
Average throughput:
Query response time histogram: each cell has the percentage of responses that take <= the time in the header and max is the max response time in seconds. For max values in the top 25% of the range have a red background and in the bottom 25% of the range have a green background. The red background is not used when the min value is within 80% of the max value.
| dbms | 256us | 1ms | 4ms | 16ms | 64ms | 256ms | 1s | 4s | 16s | gt | max |
|---|---|---|---|---|---|---|---|---|---|---|---|
| fbmy5635_rel.cy10_1g_bee | 1.742 | 98.258 | 0.001 | nonzero | 0.005 | ||||||
| fbmy8028_rel_native_lto.cy10_1g_bee | 2.422 | 97.576 | 0.002 | 0.003 |
Insert response time histogram: each cell has the percentage of responses that take <= the time in the header and max is the max response time in seconds. For max values in the top 25% of the range have a red background and in the bottom 25% of the range have a green background. The red background is not used when the min value is within 80% of the max value.
| dbms | 256us | 1ms | 4ms | 16ms | 64ms | 256ms | 1s | 4s | 16s | gt | max |
|---|---|---|---|---|---|---|---|---|---|---|---|
| fbmy5635_rel.cy10_1g_bee | 99.611 | 0.389 | 0.009 | ||||||||
| fbmy8028_rel_native_lto.cy10_1g_bee | 99.417 | 0.500 | 0.083 | 0.018 |
Delete response time histogram: each cell has the percentage of responses that take <= the time in the header and max is the max response time in seconds. For max values in the top 25% of the range have a red background and in the bottom 25% of the range have a green background. The red background is not used when the min value is within 80% of the max value.
| dbms | 256us | 1ms | 4ms | 16ms | 64ms | 256ms | 1s | 4s | 16s | gt | max |
|---|---|---|---|---|---|---|---|---|---|---|---|
| fbmy5635_rel.cy10_1g_bee | 99.667 | 0.333 | 0.008 | ||||||||
| fbmy8028_rel_native_lto.cy10_1g_bee | 99.528 | 0.417 | 0.056 | 0.018 |
Performance metrics for the DBMS listed above. Some are normalized by throughput, others are not. Legend for results is here.
ips	qps	rps	rmbps	wps	wmbps	rpq	rkbpq	wpi	wkbpi	csps	cpups	cspq	cpupq	dbgb1	dbgb2	rss	maxop	p50	p99	tag
100	2658	0	0.0	4.7	0.5	0.000	0.000	0.047	5.651	10310	12.9	3.879	388	1.7	3.6	1.5	0.005	2685	2269	20m.fbmy5635_rel.cy10_1g_bee
100	2407	0	0.0	4.4	0.5	0.000	0.000	0.044	4.790	9507	12.8	3.950	425	1.7	3.7	1.9	0.003	2381	2094	20m.fbmy8028_rel_native_lto.cy10_1g_bee
q500.1
q500.1: range queries with 500 insert/s per client. Graphs for performance per 1-second interval are here.
Average throughput:
Query response time histogram: each cell has the percentage of responses that take <= the time in the header and max is the max response time in seconds. For max values in the top 25% of the range have a red background and in the bottom 25% of the range have a green background. The red background is not used when the min value is within 80% of the max value.
| dbms | 256us | 1ms | 4ms | 16ms | 64ms | 256ms | 1s | 4s | 16s | gt | max |
|---|---|---|---|---|---|---|---|---|---|---|---|
| fbmy5635_rel.cy10_1g_bee | 1.173 | 98.826 | 0.001 | nonzero | 0.005 | ||||||
| fbmy8028_rel_native_lto.cy10_1g_bee | 1.823 | 98.176 | 0.001 | 0.003 |
Insert response time histogram: each cell has the percentage of responses that take <= the time in the header and max is the max response time in seconds. For max values in the top 25% of the range have a red background and in the bottom 25% of the range have a green background. The red background is not used when the min value is within 80% of the max value.
| dbms | 256us | 1ms | 4ms | 16ms | 64ms | 256ms | 1s | 4s | 16s | gt | max |
|---|---|---|---|---|---|---|---|---|---|---|---|
| fbmy5635_rel.cy10_1g_bee | 99.739 | 0.261 | 0.010 | ||||||||
| fbmy8028_rel_native_lto.cy10_1g_bee | 99.533 | 0.383 | 0.083 | 0.023 |
Delete response time histogram: each cell has the percentage of responses that take <= the time in the header and max is the max response time in seconds. For max values in the top 25% of the range have a red background and in the bottom 25% of the range have a green background. The red background is not used when the min value is within 80% of the max value.
| dbms | 256us | 1ms | 4ms | 16ms | 64ms | 256ms | 1s | 4s | 16s | gt | max |
|---|---|---|---|---|---|---|---|---|---|---|---|
| fbmy5635_rel.cy10_1g_bee | 99.728 | 0.272 | 0.009 | ||||||||
| fbmy8028_rel_native_lto.cy10_1g_bee | 99.578 | 0.344 | 0.078 | 0.022 |
Performance metrics for the DBMS listed above. Some are normalized by throughput, others are not. Legend for results is here.
ips	qps	rps	rmbps	wps	wmbps	rpq	rkbpq	wpi	wkbpi	csps	cpups	cspq	cpupq	dbgb1	dbgb2	rss	maxop	p50	p99	tag
498	2607	0	0.0	5.5	0.9	0.000	0.000	0.011	1.950	10221	13.5	3.921	414	1.7	1.7	1.5	0.005	2605	2413	20m.fbmy5635_rel.cy10_1g_bee
499	2388	0	0.0	4.9	0.7	0.000	0.000	0.010	1.468	9537	13.7	3.994	459	1.7	2.0	1.8	0.003	2365	2189	20m.fbmy8028_rel_native_lto.cy10_1g_bee
q1000.1
q1000.1: range queries with 1000 insert/s per client. Graphs for performance per 1-second interval are here.
Average throughput:
Query response time histogram: each cell has the percentage of responses that take <= the time in the header and max is the max response time in seconds. For max values in the top 25% of the range have a red background and in the bottom 25% of the range have a green background. The red background is not used when the min value is within 80% of the max value.
| dbms | 256us | 1ms | 4ms | 16ms | 64ms | 256ms | 1s | 4s | 16s | gt | max |
|---|---|---|---|---|---|---|---|---|---|---|---|
| fbmy5635_rel.cy10_1g_bee | 1.454 | 98.546 | 0.001 | 0.002 | |||||||
| fbmy8028_rel_native_lto.cy10_1g_bee | 1.792 | 98.207 | 0.001 | 0.003 |
Insert response time histogram: each cell has the percentage of responses that take <= the time in the header and max is the max response time in seconds. For max values in the top 25% of the range have a red background and in the bottom 25% of the range have a green background. The red background is not used when the min value is within 80% of the max value.
| dbms | 256us | 1ms | 4ms | 16ms | 64ms | 256ms | 1s | 4s | 16s | gt | max |
|---|---|---|---|---|---|---|---|---|---|---|---|
| fbmy5635_rel.cy10_1g_bee | 99.717 | 0.281 | 0.003 | 0.048 | |||||||
| fbmy8028_rel_native_lto.cy10_1g_bee | 99.569 | 0.339 | 0.092 | 0.048 |
Delete response time histogram: each cell has the percentage of responses that take <= the time in the header and max is the max response time in seconds. For max values in the top 25% of the range have a red background and in the bottom 25% of the range have a green background. The red background is not used when the min value is within 80% of the max value.
| dbms | 256us | 1ms | 4ms | 16ms | 64ms | 256ms | 1s | 4s | 16s | gt | max |
|---|---|---|---|---|---|---|---|---|---|---|---|
| fbmy5635_rel.cy10_1g_bee | 99.711 | 0.286 | 0.003 | 0.048 | |||||||
| fbmy8028_rel_native_lto.cy10_1g_bee | 99.597 | 0.314 | 0.089 | 0.063 |
Performance metrics for the DBMS listed above. Some are normalized by throughput, others are not. Legend for results is here.
ips	qps	rps	rmbps	wps	wmbps	rpq	rkbpq	wpi	wkbpi	csps	cpups	cspq	cpupq	dbgb1	dbgb2	rss	maxop	p50	p99	tag
997	2575	0	0.0	6.7	1.4	0.000	0.000	0.007	1.464	10294	14.5	3.997	450	1.8	2.2	1.5	0.002	2572	2397	20m.fbmy5635_rel.cy10_1g_bee
997	2378	0	0.0	8.2	1.9	0.000	0.000	0.008	1.973	9703	15.1	4.080	508	1.8	2.4	1.9	0.003	2349	2189	20m.fbmy8028_rel_native_lto.cy10_1g_bee
l.i0
l.i0: load without secondary indexes
Performance metrics for all DBMS, not just the ones listed above. Some are normalized by throughput, others are not. Legend for results is here.
ips	qps	rps	rmbps	wps	wmbps	rpq	rkbpq	wpi	wkbpi	csps	cpups	cspq	cpupq	dbgb1	dbgb2	rss	maxop	p50	p99	tag
78125	0	0	0.0	36.4	13.3	0.000	0.000	0.000	0.174	7686	22.4	0.098	23	0.7	1.8	0.2	0.061	79010	72720	20m.fbmy5635_rel.cy10_1g_bee
60241	0	0	0.0	36.6	11.8	0.000	0.000	0.001	0.201	6290	21.5	0.104	29	0.7	1.9	0.6	0.083	60730	54338	20m.fbmy8028_rel_native_lto.cy10_1g_bee
l.x
l.x: create secondary indexes
Performance metrics for all DBMS, not just the ones listed above. Some are normalized by throughput, others are not. Legend for results is here.
ips	qps	rps	rmbps	wps	wmbps	rpq	rkbpq	wpi	wkbpi	csps	cpups	cspq	cpupq	dbgb1	dbgb2	rss	maxop	p50	p99	tag
80723	0	0	0.0	32.0	12.2	0.000	0.000	0.000	0.155	257	11.5	0.003	11	1.5	2.5	1.3	0.009	NA	NA	20m.fbmy5635_rel.cy10_1g_bee
76136	0	0	0.0	29.2	11.5	0.000	0.000	0.000	0.155	396	11.6	0.005	12	1.4	2.7	1.8	0.009	NA	NA	20m.fbmy8028_rel_native_lto.cy10_1g_bee
l.i1
l.i1: continue load after secondary indexes created
Performance metrics for all DBMS, not just the ones listed above. Some are normalized by throughput, others are not. Legend for results is here.
ips	qps	rps	rmbps	wps	wmbps	rpq	rkbpq	wpi	wkbpi	csps	cpups	cspq	cpupq	dbgb1	dbgb2	rss	maxop	p50	p99	tag
26652	0	3	0.4	101.1	39.5	0.000	0.015	0.004	1.518	11205	44.2	0.420	133	2.3	4.1	1.4	0.110	26620	23874	20m.fbmy5635_rel.cy10_1g_bee
23585	0	3	0.3	97.4	36.6	0.000	0.015	0.004	1.587	10204	43.4	0.433	147	2.5	4.5	1.8	0.123	23574	21127	20m.fbmy8028_rel_native_lto.cy10_1g_bee
q100.1
q100.1: range queries with 100 insert/s per client
Performance metrics for all DBMS, not just the ones listed above. Some are normalized by throughput, others are not. Legend for results is here.
ips	qps	rps	rmbps	wps	wmbps	rpq	rkbpq	wpi	wkbpi	csps	cpups	cspq	cpupq	dbgb1	dbgb2	rss	maxop	p50	p99	tag
100	2658	0	0.0	4.7	0.5	0.000	0.000	0.047	5.651	10310	12.9	3.879	388	1.7	3.6	1.5	0.005	2685	2269	20m.fbmy5635_rel.cy10_1g_bee
100	2407	0	0.0	4.4	0.5	0.000	0.000	0.044	4.790	9507	12.8	3.950	425	1.7	3.7	1.9	0.003	2381	2094	20m.fbmy8028_rel_native_lto.cy10_1g_bee
q500.1
q500.1: range queries with 500 insert/s per client
Performance metrics for all DBMS, not just the ones listed above. Some are normalized by throughput, others are not. Legend for results is here.
ips	qps	rps	rmbps	wps	wmbps	rpq	rkbpq	wpi	wkbpi	csps	cpups	cspq	cpupq	dbgb1	dbgb2	rss	maxop	p50	p99	tag
498	2607	0	0.0	5.5	0.9	0.000	0.000	0.011	1.950	10221	13.5	3.921	414	1.7	1.7	1.5	0.005	2605	2413	20m.fbmy5635_rel.cy10_1g_bee
499	2388	0	0.0	4.9	0.7	0.000	0.000	0.010	1.468	9537	13.7	3.994	459	1.7	2.0	1.8	0.003	2365	2189	20m.fbmy8028_rel_native_lto.cy10_1g_bee
q1000.1
q1000.1: range queries with 1000 insert/s per client
Performance metrics for all DBMS, not just the ones listed above. Some are normalized by throughput, others are not. Legend for results is here.
ips	qps	rps	rmbps	wps	wmbps	rpq	rkbpq	wpi	wkbpi	csps	cpups	cspq	cpupq	dbgb1	dbgb2	rss	maxop	p50	p99	tag
997	2575	0	0.0	6.7	1.4	0.000	0.000	0.007	1.464	10294	14.5	3.997	450	1.8	2.2	1.5	0.002	2572	2397	20m.fbmy5635_rel.cy10_1g_bee
997	2378	0	0.0	8.2	1.9	0.000	0.000	0.008	1.973	9703	15.1	4.080	508	1.8	2.4	1.9	0.003	2349	2189	20m.fbmy8028_rel_native_lto.cy10_1g_bee
l.i0
- l.i0: load without secondary indexes
- Legend for results is here.
- Each entry lists the percentage of responses that fit in that bucket (slower than max time for previous bucket, faster than min time for next bucket).
Insert response time histogram
256us	1ms	4ms	16ms	64ms	256ms	1s	4s	16s	gt	max	tag
0.000	0.000	99.870	0.126	0.005	0.000	0.000	0.000	0.000	0.000	0.061	fbmy5635_rel.cy10_1g_bee
0.000	0.000	99.731	0.189	0.078	0.003	0.000	0.000	0.000	0.000	0.083	fbmy8028_rel_native_lto.cy10_1g_bee
l.x
- l.x: create secondary indexes
- Legend for results is here.
- Each entry lists the percentage of responses that fit in that bucket (slower than max time for previous bucket, faster than min time for next bucket).
TODO - determine whether there is data for create index response time
l.i1
- l.i1: continue load after secondary indexes created
- Legend for results is here.
- Each entry lists the percentage of responses that fit in that bucket (slower than max time for previous bucket, faster than min time for next bucket).
Insert response time histogram
256us	1ms	4ms	16ms	64ms	256ms	1s	4s	16s	gt	max	tag
0.000	0.000	99.805	0.190	0.003	0.002	0.000	0.000	0.000	0.000	0.110	fbmy5635_rel.cy10_1g_bee
0.000	0.000	99.680	0.245	0.072	0.003	0.000	0.000	0.000	0.000	0.123	fbmy8028_rel_native_lto.cy10_1g_bee
Delete response time histogram
256us	1ms	4ms	16ms	64ms	256ms	1s	4s	16s	gt	max	tag
0.000	0.000	99.797	0.193	0.008	0.002	0.000	0.000	0.000	0.000	0.110	fbmy5635_rel.cy10_1g_bee
0.000	0.000	99.673	0.246	0.078	0.003	0.000	0.000	0.000	0.000	0.106	fbmy8028_rel_native_lto.cy10_1g_bee
q100.1
- q100.1: range queries with 100 insert/s per client
- Legend for results is here.
- Each entry lists the percentage of responses that fit in that bucket (slower than max time for previous bucket, faster than min time for next bucket).
Query response time histogram
256us	1ms	4ms	16ms	64ms	256ms	1s	4s	16s	gt	max	tag
1.742	98.258	0.001	nonzero	0.000	0.000	0.000	0.000	0.000	0.000	0.005	fbmy5635_rel.cy10_1g_bee
2.422	97.576	0.002	0.000	0.000	0.000	0.000	0.000	0.000	0.000	0.003	fbmy8028_rel_native_lto.cy10_1g_bee
Insert response time histogram
256us	1ms	4ms	16ms	64ms	256ms	1s	4s	16s	gt	max	tag
0.000	0.000	99.611	0.389	0.000	0.000	0.000	0.000	0.000	0.000	0.009	fbmy5635_rel.cy10_1g_bee
0.000	0.000	99.417	0.500	0.083	0.000	0.000	0.000	0.000	0.000	0.018	fbmy8028_rel_native_lto.cy10_1g_bee
Delete response time histogram
256us	1ms	4ms	16ms	64ms	256ms	1s	4s	16s	gt	max	tag
0.000	0.000	99.667	0.333	0.000	0.000	0.000	0.000	0.000	0.000	0.008	fbmy5635_rel.cy10_1g_bee
0.000	0.000	99.528	0.417	0.056	0.000	0.000	0.000	0.000	0.000	0.018	fbmy8028_rel_native_lto.cy10_1g_bee
q500.1
- q500.1: range queries with 500 insert/s per client
- Legend for results is here.
- Each entry lists the percentage of responses that fit in that bucket (slower than max time for previous bucket, faster than min time for next bucket).
Query response time histogram
256us	1ms	4ms	16ms	64ms	256ms	1s	4s	16s	gt	max	tag
1.173	98.826	0.001	nonzero	0.000	0.000	0.000	0.000	0.000	0.000	0.005	fbmy5635_rel.cy10_1g_bee
1.823	98.176	0.001	0.000	0.000	0.000	0.000	0.000	0.000	0.000	0.003	fbmy8028_rel_native_lto.cy10_1g_bee
Insert response time histogram
256us	1ms	4ms	16ms	64ms	256ms	1s	4s	16s	gt	max	tag
0.000	0.000	99.739	0.261	0.000	0.000	0.000	0.000	0.000	0.000	0.010	fbmy5635_rel.cy10_1g_bee
0.000	0.000	99.533	0.383	0.083	0.000	0.000	0.000	0.000	0.000	0.023	fbmy8028_rel_native_lto.cy10_1g_bee
Delete response time histogram
256us	1ms	4ms	16ms	64ms	256ms	1s	4s	16s	gt	max	tag
0.000	0.000	99.728	0.272	0.000	0.000	0.000	0.000	0.000	0.000	0.009	fbmy5635_rel.cy10_1g_bee
0.000	0.000	99.578	0.344	0.078	0.000	0.000	0.000	0.000	0.000	0.022	fbmy8028_rel_native_lto.cy10_1g_bee
q1000.1
- q1000.1: range queries with 1000 insert/s per client
- Legend for results is here.
- Each entry lists the percentage of responses that fit in that bucket (slower than max time for previous bucket, faster than min time for next bucket).
Query response time histogram
256us	1ms	4ms	16ms	64ms	256ms	1s	4s	16s	gt	max	tag
1.454	98.546	0.001	0.000	0.000	0.000	0.000	0.000	0.000	0.000	0.002	fbmy5635_rel.cy10_1g_bee
1.792	98.207	0.001	0.000	0.000	0.000	0.000	0.000	0.000	0.000	0.003	fbmy8028_rel_native_lto.cy10_1g_bee
Insert response time histogram
256us	1ms	4ms	16ms	64ms	256ms	1s	4s	16s	gt	max	tag
0.000	0.000	99.717	0.281	0.003	0.000	0.000	0.000	0.000	0.000	0.048	fbmy5635_rel.cy10_1g_bee
0.000	0.000	99.569	0.339	0.092	0.000	0.000	0.000	0.000	0.000	0.048	fbmy8028_rel_native_lto.cy10_1g_bee
Delete response time histogram
256us	1ms	4ms	16ms	64ms	256ms	1s	4s	16s	gt	max	tag
0.000	0.000	99.711	0.286	0.003	0.000	0.000	0.000	0.000	0.000	0.048	fbmy5635_rel.cy10_1g_bee
0.000	0.000	99.597	0.314	0.089	0.000	0.000	0.000	0.000	0.000	0.063	fbmy8028_rel_native_lto.cy10_1g_bee