Introduction
This is a report for the insert benchmark with 160M docs and 8 client(s). It is generated by scripts (bash, awk, sed) and Tufte might not be impressed. An overview of the insert benchmark is here and a short update is here. Below, by DBMS, I mean DBMS+version.config. An example is my8020.c10b40 where my means MySQL, 8020 is version 8.0.20 and c10b40 is the name for the configuration file.
The test server is a c2-standard-30 with 15 cores, hyperthreads disabled, 120G RAM and XFS with SW RAID 0 across 4 NVMe SSD. The benchmark was run with 8 clients and there were 1 or 3 connections per client (1 for queries or inserts without rate limits, 1+1 for rate limited inserts+deletes). It uses 8 tables, 1 per client. It loads 20M rows per table without secondary indexes, creates secondary indexes, then inserts 100M rows per table with a delete per insert to avoid growing the table. It then does 3 read+write tests for 1800s each that do queries as fast as possible with 100, 500 and then 1000 inserts/second/client concurrent with the queries and 1000 deletes/second to avoid growing the table. The database is cached by the OS page cache but not by Postgres Clients and the DBMS share one server. The per-database configs are in the per-database subdirectories here.
The tested DBMS are:
- pg153_o3_native_lto.cx7a_4g_gcp_c2s30 - Postgres 15.3, the cx7a_4g_gcp_c2s30 config and the build used: -O3 -march=native -mtune=native -flto, shared_buffers=8G
- pg153_o3_native_lto.cx7a1_4g_gcp_c2s30 - Postgres 15.3, the cx7a1_4g_gcp_c2s30 config and the build used: -O3 -march=native -mtune=native -flto, adds wal_compression=lz4
- pg153_o3_native_lto.cx7a2_4g_gcp_c2s30 - Postgres 15.3, the cx7a2_4g_gcp_c2s30 config and the build used: -O3 -march=native -mtune=native -flto, adds backend_flush_after=256kb
- pg153_o3_native_lto.cx7a3_4g_gcp_c2s30 - Postgres 15.3, the cx7a3_4g_gcp_c2s30 config and the build used: -O3 -march=native -mtune=native -flto, adds full_page_writes=off
- pg153_o3_native_lto.cx7a4_4g_gcp_c2s30 - Postgres 15.3, the cx7a4_4g_gcp_c2s30 config and the build used: -O3 -march=native -mtune=native -flto, adds checkpoint_timeout=1800s
- pg153_o3_native_lto.cx7a5_4g_gcp_c2s30 - Postgres 15.3, the cx7a5_4g_gcp_c2s30 config and the build used: -O3 -march=native -mtune=native -flto, adds min_wal_size=16384
- pg153_o3_native_lto.cx7a6_4g_gcp_c2s30 - Postgres 15.3, the cx7a6_4g_gcp_c2s30 config and the build used: -O3 -march=native -mtune=native -flto, adds backend_flush_after=256kb, used initdb —wal-segsize 256, inherits larger value for wal_buffers
- pg153_o3_native_lto.cx7a7_4g_gcp_c2s30 - Postgres 15.3, the cx7a7_4g_gcp_c2s30 config and the build used: -O3 -march=native -mtune=native -flto, adds max_wal_size=16GB
- pg153_o3_native_lto.cx7a8_4g_gcp_c2s30 - Postgres 15.3, the cx7a8_4g_gcp_c2s30 config and the build used: -O3 -march=native -mtune=native -flto, uses shared_buffers=8GB
- pg153_o3_native_lto.cx7a9_4g_gcp_c2s30 - Postgres 15.3, the cx7a8_4g_gcp_c2s30 config and the build used: -O3 -march=native -mtune=native -flto, adds checkpoint_timeout=900s
Contents
- Summary
- l.i0: load without secondary indexes
- l.x: create secondary indexes
- l.i1: continue load after secondary indexes created
- q100.1: range queries with 100 insert/s per client
- q500.1: range queries with 500 insert/s per client
- q1000.1: range queries with 1000 insert/s per client
Summary
The numbers are inserts/s for l.i0 and l.i1, indexed docs (or rows) /s for l.x and queries/s for q*.2. The values are the average rate over the entire test for inserts (IPS) and queries (QPS). The range of values for IPS and QPS is split into 3 parts: bottom 25%, middle 50%, top 25%. Values in the bottom 25% have a red background, values in the top 25% have a green background and values in the middle have no color. A gray background is used for values that can be ignored because the DBMS did not sustain the target insert rate. Red backgrounds are not used when the minimum value is within 80% of the max value.
| dbms | l.i0 | l.x | l.i1 | q100.1 | q500.1 | q1000.1 |
|---|---|---|---|---|---|---|
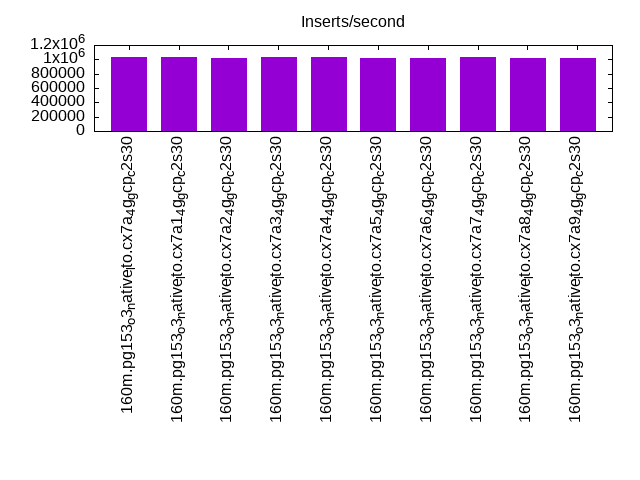
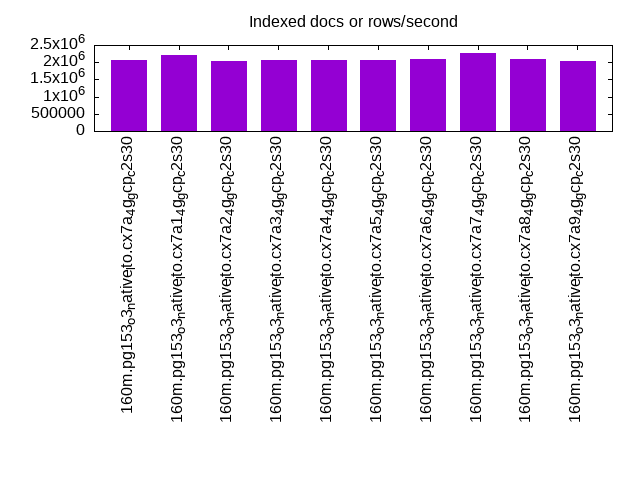
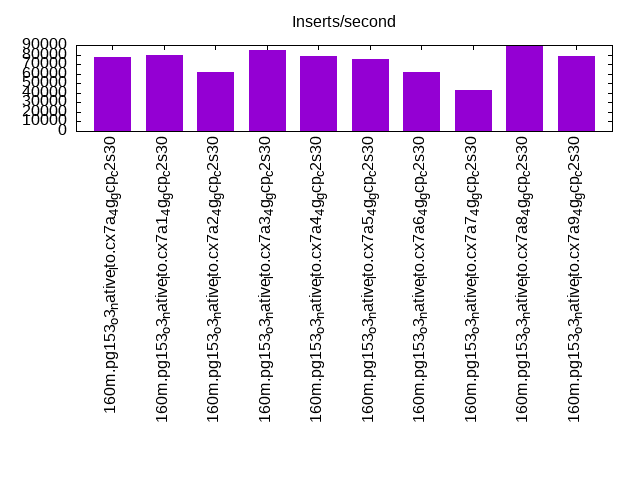
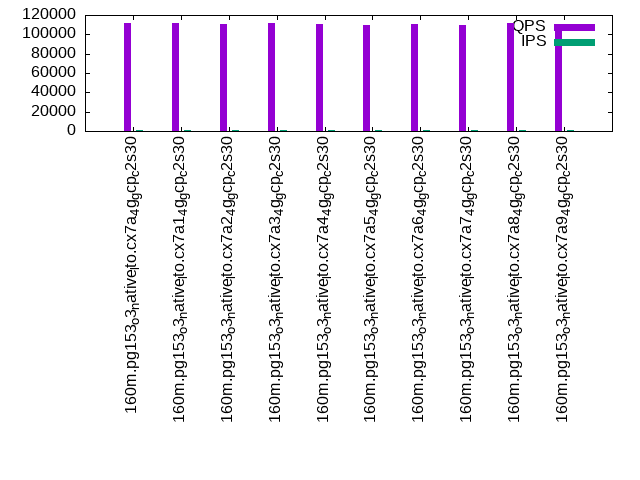
| 160m.pg153_o3_native_lto.cx7a_4g_gcp_c2s30 | 1025641 | 2052564 | 77168 | 111272 | 102074 | 92766 |
| 160m.pg153_o3_native_lto.cx7a1_4g_gcp_c2s30 | 1025641 | 2223611 | 79396 | 111452 | 101840 | 95011 |
| 160m.pg153_o3_native_lto.cx7a2_4g_gcp_c2s30 | 1019108 | 2026582 | 61738 | 110753 | 102430 | 96216 |
| 160m.pg153_o3_native_lto.cx7a3_4g_gcp_c2s30 | 1025641 | 2052564 | 84450 | 111747 | 104138 | 97812 |
| 160m.pg153_o3_native_lto.cx7a4_4g_gcp_c2s30 | 1025641 | 2052564 | 78609 | 110683 | 104727 | 98766 |
| 160m.pg153_o3_native_lto.cx7a5_4g_gcp_c2s30 | 1019108 | 2052564 | 75729 | 110099 | 101192 | 92963 |
| 160m.pg153_o3_native_lto.cx7a6_4g_gcp_c2s30 | 1019108 | 2079221 | 61662 | 110254 | 102121 | 92036 |
| 160m.pg153_o3_native_lto.cx7a7_4g_gcp_c2s30 | 1032258 | 2254930 | 42644 | 110168 | 99342 | 80577 |
| 160m.pg153_o3_native_lto.cx7a8_4g_gcp_c2s30 | 1019108 | 2079221 | 88525 | 111587 | 103699 | 96941 |
| 160m.pg153_o3_native_lto.cx7a9_4g_gcp_c2s30 | 1012658 | 2026582 | 78632 | 111082 | 104033 | 98696 |
This table has relative throughput, throughput for the DBMS relative to the DBMS in the first line, using the absolute throughput from the previous table.
| dbms | l.i0 | l.x | l.i1 | q100.1 | q500.1 | q1000.1 |
|---|---|---|---|---|---|---|
| 160m.pg153_o3_native_lto.cx7a_4g_gcp_c2s30 | 1.00 | 1.00 | 1.00 | 1.00 | 1.00 | 1.00 |
| 160m.pg153_o3_native_lto.cx7a1_4g_gcp_c2s30 | 1.00 | 1.08 | 1.03 | 1.00 | 1.00 | 1.02 |
| 160m.pg153_o3_native_lto.cx7a2_4g_gcp_c2s30 | 0.99 | 0.99 | 0.80 | 1.00 | 1.00 | 1.04 |
| 160m.pg153_o3_native_lto.cx7a3_4g_gcp_c2s30 | 1.00 | 1.00 | 1.09 | 1.00 | 1.02 | 1.05 |
| 160m.pg153_o3_native_lto.cx7a4_4g_gcp_c2s30 | 1.00 | 1.00 | 1.02 | 0.99 | 1.03 | 1.06 |
| 160m.pg153_o3_native_lto.cx7a5_4g_gcp_c2s30 | 0.99 | 1.00 | 0.98 | 0.99 | 0.99 | 1.00 |
| 160m.pg153_o3_native_lto.cx7a6_4g_gcp_c2s30 | 0.99 | 1.01 | 0.80 | 0.99 | 1.00 | 0.99 |
| 160m.pg153_o3_native_lto.cx7a7_4g_gcp_c2s30 | 1.01 | 1.10 | 0.55 | 0.99 | 0.97 | 0.87 |
| 160m.pg153_o3_native_lto.cx7a8_4g_gcp_c2s30 | 0.99 | 1.01 | 1.15 | 1.00 | 1.02 | 1.05 |
| 160m.pg153_o3_native_lto.cx7a9_4g_gcp_c2s30 | 0.99 | 0.99 | 1.02 | 1.00 | 1.02 | 1.06 |
This lists the average rate of inserts/s for the tests that do inserts concurrent with queries. For such tests the query rate is listed in the table above. The read+write tests are setup so that the insert rate should match the target rate every second. Cells that are not at least 95% of the target have a red background to indicate a failure to satisfy the target.
| dbms | q100.1 | q500.1 | q1000.1 |
|---|---|---|---|
| pg153_o3_native_lto.cx7a_4g_gcp_c2s30 | 797 | 3988 | 7976 |
| pg153_o3_native_lto.cx7a1_4g_gcp_c2s30 | 798 | 3987 | 7976 |
| pg153_o3_native_lto.cx7a2_4g_gcp_c2s30 | 797 | 3987 | 7976 |
| pg153_o3_native_lto.cx7a3_4g_gcp_c2s30 | 797 | 3988 | 7976 |
| pg153_o3_native_lto.cx7a4_4g_gcp_c2s30 | 797 | 3987 | 7976 |
| pg153_o3_native_lto.cx7a5_4g_gcp_c2s30 | 797 | 3988 | 7976 |
| pg153_o3_native_lto.cx7a6_4g_gcp_c2s30 | 797 | 3987 | 7976 |
| pg153_o3_native_lto.cx7a7_4g_gcp_c2s30 | 797 | 3987 | 7978 |
| pg153_o3_native_lto.cx7a8_4g_gcp_c2s30 | 797 | 3988 | 7978 |
| pg153_o3_native_lto.cx7a9_4g_gcp_c2s30 | 797 | 3987 | 7976 |
| target | 800 | 4000 | 8000 |
l.i0
l.i0: load without secondary indexes. Graphs for performance per 1-second interval are here.
Average throughput:
Insert response time histogram: each cell has the percentage of responses that take <= the time in the header and max is the max response time in seconds. For the max column values in the top 25% of the range have a red background and in the bottom 25% of the range have a green background. The red background is not used when the min value is within 80% of the max value.
| dbms | 256us | 1ms | 4ms | 16ms | 64ms | 256ms | 1s | 4s | 16s | gt | max |
|---|---|---|---|---|---|---|---|---|---|---|---|
| pg153_o3_native_lto.cx7a_4g_gcp_c2s30 | 98.237 | 1.686 | 0.050 | 0.010 | 0.017 | 0.001 | 0.571 | ||||
| pg153_o3_native_lto.cx7a1_4g_gcp_c2s30 | 98.216 | 1.703 | 0.056 | 0.008 | 0.015 | 0.003 | 0.380 | ||||
| pg153_o3_native_lto.cx7a2_4g_gcp_c2s30 | 97.870 | 2.051 | 0.052 | 0.009 | 0.017 | 0.001 | 0.441 | ||||
| pg153_o3_native_lto.cx7a3_4g_gcp_c2s30 | 98.046 | 1.876 | 0.053 | 0.007 | 0.016 | 0.002 | 0.414 | ||||
| pg153_o3_native_lto.cx7a4_4g_gcp_c2s30 | 97.823 | 2.098 | 0.051 | 0.007 | 0.021 | 0.001 | 0.327 | ||||
| pg153_o3_native_lto.cx7a5_4g_gcp_c2s30 | 97.977 | 1.948 | 0.048 | 0.008 | 0.016 | 0.003 | 0.420 | ||||
| pg153_o3_native_lto.cx7a6_4g_gcp_c2s30 | 97.893 | 2.031 | 0.050 | 0.008 | 0.014 | 0.003 | 0.380 | ||||
| pg153_o3_native_lto.cx7a7_4g_gcp_c2s30 | 97.934 | 1.991 | 0.050 | 0.011 | 0.014 | 0.001 | 0.287 | ||||
| pg153_o3_native_lto.cx7a8_4g_gcp_c2s30 | 97.822 | 2.112 | 0.039 | 0.007 | 0.017 | 0.002 | 0.437 | ||||
| pg153_o3_native_lto.cx7a9_4g_gcp_c2s30 | 97.923 | 2.007 | 0.044 | 0.007 | 0.017 | 0.002 | 0.544 |
Delete response time histogram: each cell has the percentage of responses that take <= the time in the header and max is the max response time in seconds. For the max column values in the top 25% of the range have a red background and in the bottom 25% of the range have a green background. The red background is not used when the min value is within 80% of the max value.
| dbms | 0.000 | sum:DBMS | |||||||||
|---|---|---|---|---|---|---|---|---|---|---|---|
| pg153_o3_native_lto.cx7a_4g_gcp_c2s30 | |||||||||||
| pg153_o3_native_lto.cx7a1_4g_gcp_c2s30 | |||||||||||
| pg153_o3_native_lto.cx7a2_4g_gcp_c2s30 | |||||||||||
| pg153_o3_native_lto.cx7a3_4g_gcp_c2s30 | |||||||||||
| pg153_o3_native_lto.cx7a4_4g_gcp_c2s30 | |||||||||||
| pg153_o3_native_lto.cx7a5_4g_gcp_c2s30 | |||||||||||
| pg153_o3_native_lto.cx7a6_4g_gcp_c2s30 | |||||||||||
| pg153_o3_native_lto.cx7a7_4g_gcp_c2s30 | |||||||||||
| pg153_o3_native_lto.cx7a8_4g_gcp_c2s30 | |||||||||||
| pg153_o3_native_lto.cx7a9_4g_gcp_c2s30 |
Performance metrics for the DBMS listed above. Some are normalized by throughput, others are not. Legend for results is here.
ips	qps	rps	rmbps	wps	wmbps	rpq	rkbpq	wpi	wkbpi	csps	cpups	cspq	cpupq	dbgb1	dbgb2	rss	maxop	p50	p99	tag
1025641	0	20	0.1	4888.1	404.6	0.000	0.000	0.005	0.404	83957	75.0	0.082	11	15.3	41.4	NA	0.571	149638	35961	160m.pg153_o3_native_lto.cx7a_4g_gcp_c2s30
1025641	0	20	0.1	5111.2	406.4	0.000	0.000	0.005	0.406	84405	75.3	0.082	11	15.3	41.4	0.0	0.380	149538	22575	160m.pg153_o3_native_lto.cx7a1_4g_gcp_c2s30
1019108	0	16	0.1	5124.7	403.8	0.000	0.000	0.005	0.406	84867	75.2	0.083	11	15.3	41.4	0.0	0.441	147840	31266	160m.pg153_o3_native_lto.cx7a2_4g_gcp_c2s30
1025641	0	9	0.0	5106.5	405.4	0.000	0.000	0.005	0.405	84046	75.2	0.082	11	15.3	41.4	0.0	0.414	149737	36161	160m.pg153_o3_native_lto.cx7a3_4g_gcp_c2s30
1025641	0	18	0.1	5122.5	404.4	0.000	0.000	0.005	0.404	84066	75.5	0.082	11	15.3	41.4	0.0	0.327	148539	43753	160m.pg153_o3_native_lto.cx7a4_4g_gcp_c2s30
1019108	0	14	0.1	5081.6	408.8	0.000	0.000	0.005	0.411	84386	75.3	0.083	11	15.3	41.4	0.0	0.420	147737	27979	160m.pg153_o3_native_lto.cx7a5_4g_gcp_c2s30
1019108	0	22	0.1	5127.2	406.3	0.000	0.000	0.005	0.408	84680	75.4	0.083	11	15.3	41.4	0.0	0.380	147337	35774	160m.pg153_o3_native_lto.cx7a6_4g_gcp_c2s30
1032258	0	0	0.0	3465.7	338.3	0.000	0.000	0.003	0.336	87024	75.8	0.084	11	15.3	31.4	0.0	0.287	147120	38373	160m.pg153_o3_native_lto.cx7a7_4g_gcp_c2s30
1019108	0	21	0.1	3696.0	378.5	0.000	0.000	0.004	0.380	84430	75.2	0.083	11	15.3	41.4	0.0	0.437	148137	43553	160m.pg153_o3_native_lto.cx7a8_4g_gcp_c2s30
1012658	0	20	0.1	5072.5	405.7	0.000	0.000	0.005	0.410	84059	75.5	0.083	11	15.3	41.4	0.0	0.544	147938	16588	160m.pg153_o3_native_lto.cx7a9_4g_gcp_c2s30
l.x
l.x: create secondary indexes.
Average throughput:
Performance metrics for the DBMS listed above. Some are normalized by throughput, others are not. Legend for results is here.
ips	qps	rps	rmbps	wps	wmbps	rpq	rkbpq	wpi	wkbpi	csps	cpups	cspq	cpupq	dbgb1	dbgb2	rss	maxop	p50	p99	tag
2052564	0	2646	12.2	1705.2	582.2	0.001	0.006	0.001	0.290	20986	36.4	0.010	3	29.4	68.3	0.0	0.002	NA	NA	160m.pg153_o3_native_lto.cx7a_4g_gcp_c2s30
2223611	0	2494	11.9	1529.1	503.9	0.001	0.005	0.001	0.232	10030	40.1	0.005	3	29.4	63.3	0.0	0.002	NA	NA	160m.pg153_o3_native_lto.cx7a1_4g_gcp_c2s30
2026582	0	2560	11.8	1756.3	580.9	0.001	0.006	0.001	0.293	15728	36.2	0.008	3	29.4	68.3	0.0	0.002	NA	NA	160m.pg153_o3_native_lto.cx7a2_4g_gcp_c2s30
2052564	0	2750	12.8	1742.1	589.6	0.001	0.006	0.001	0.294	23526	36.6	0.011	3	29.4	68.3	0.0	0.002	NA	NA	160m.pg153_o3_native_lto.cx7a3_4g_gcp_c2s30
2052564	0	2598	11.9	1742.8	567.3	0.001	0.006	0.001	0.283	21033	36.7	0.010	3	29.4	68.3	0.0	0.002	NA	NA	160m.pg153_o3_native_lto.cx7a4_4g_gcp_c2s30
2052564	0	2497	11.5	1703.8	572.1	0.001	0.006	0.001	0.285	23417	36.9	0.011	3	29.4	68.3	0.0	0.002	NA	NA	160m.pg153_o3_native_lto.cx7a5_4g_gcp_c2s30
2079221	0	2425	11.0	1753.9	583.9	0.001	0.005	0.001	0.288	23544	36.9	0.011	3	29.4	68.3	0.0	0.002	NA	NA	160m.pg153_o3_native_lto.cx7a6_4g_gcp_c2s30
2254930	0	0	0.0	1658.3	487.0	0.000	0.000	0.001	0.221	34303	38.9	0.015	3	29.4	45.5	0.0	0.001	NA	NA	160m.pg153_o3_native_lto.cx7a7_4g_gcp_c2s30
2079221	0	4975	29.2	3373.4	627.9	0.002	0.014	0.002	0.309	18468	38.0	0.009	3	29.4	67.5	0.0	0.002	NA	NA	160m.pg153_o3_native_lto.cx7a8_4g_gcp_c2s30
2026582	0	2765	12.8	1712.6	571.2	0.001	0.006	0.001	0.289	13918	37.1	0.007	3	29.4	68.3	0.0	0.002	NA	NA	160m.pg153_o3_native_lto.cx7a9_4g_gcp_c2s30
l.i1
l.i1: continue load after secondary indexes created. Graphs for performance per 1-second interval are here.
Average throughput:
Insert response time histogram: each cell has the percentage of responses that take <= the time in the header and max is the max response time in seconds. For the max column values in the top 25% of the range have a red background and in the bottom 25% of the range have a green background. The red background is not used when the min value is within 80% of the max value.
| dbms | 256us | 1ms | 4ms | 16ms | 64ms | 256ms | 1s | 4s | 16s | gt | max |
|---|---|---|---|---|---|---|---|---|---|---|---|
| pg153_o3_native_lto.cx7a_4g_gcp_c2s30 | 0.105 | 77.340 | 19.902 | 2.589 | 0.064 | nonzero | 0.265 | ||||
| pg153_o3_native_lto.cx7a1_4g_gcp_c2s30 | 0.432 | 79.111 | 17.816 | 2.585 | 0.055 | nonzero | 0.318 | ||||
| pg153_o3_native_lto.cx7a2_4g_gcp_c2s30 | 0.034 | 58.730 | 36.248 | 4.987 | 0.001 | nonzero | 0.317 | ||||
| pg153_o3_native_lto.cx7a3_4g_gcp_c2s30 | 0.359 | 85.499 | 11.518 | 2.587 | 0.037 | nonzero | 0.412 | ||||
| pg153_o3_native_lto.cx7a4_4g_gcp_c2s30 | 0.200 | 79.256 | 17.852 | 2.636 | 0.057 | nonzero | 0.542 | ||||
| pg153_o3_native_lto.cx7a5_4g_gcp_c2s30 | 0.295 | 77.248 | 19.461 | 2.941 | 0.056 | nonzero | 0.416 | ||||
| pg153_o3_native_lto.cx7a6_4g_gcp_c2s30 | nonzero | 57.905 | 37.152 | 4.941 | 0.001 | 0.149 | |||||
| pg153_o3_native_lto.cx7a7_4g_gcp_c2s30 | 0.035 | 21.578 | 67.489 | 10.528 | 0.370 | nonzero | 0.344 | ||||
| pg153_o3_native_lto.cx7a8_4g_gcp_c2s30 | 0.954 | 81.087 | 16.131 | 1.779 | 0.049 | nonzero | 0.412 | ||||
| pg153_o3_native_lto.cx7a9_4g_gcp_c2s30 | 0.185 | 79.486 | 17.497 | 2.773 | 0.059 | nonzero | 0.410 |
Delete response time histogram: each cell has the percentage of responses that take <= the time in the header and max is the max response time in seconds. For the max column values in the top 25% of the range have a red background and in the bottom 25% of the range have a green background. The red background is not used when the min value is within 80% of the max value.
| dbms | 256us | 1ms | 4ms | 16ms | 64ms | 256ms | 1s | 4s | 16s | gt | max |
|---|---|---|---|---|---|---|---|---|---|---|---|
| pg153_o3_native_lto.cx7a_4g_gcp_c2s30 | 84.938 | 5.463 | 0.472 | 4.280 | 4.839 | 0.008 | nonzero | 0.362 | |||
| pg153_o3_native_lto.cx7a1_4g_gcp_c2s30 | 83.926 | 7.978 | 0.485 | 3.699 | 3.907 | 0.006 | nonzero | 0.318 | |||
| pg153_o3_native_lto.cx7a2_4g_gcp_c2s30 | 76.415 | 8.542 | 0.612 | 9.466 | 4.963 | 0.002 | 0.001 | 0.658 | |||
| pg153_o3_native_lto.cx7a3_4g_gcp_c2s30 | 87.094 | 5.267 | 0.506 | 3.406 | 3.725 | 0.002 | nonzero | 0.311 | |||
| pg153_o3_native_lto.cx7a4_4g_gcp_c2s30 | 84.715 | 6.344 | 0.536 | 4.119 | 4.280 | 0.006 | nonzero | 0.773 | |||
| pg153_o3_native_lto.cx7a5_4g_gcp_c2s30 | 84.371 | 6.175 | 0.480 | 4.512 | 4.455 | 0.007 | nonzero | 0.639 | |||
| pg153_o3_native_lto.cx7a6_4g_gcp_c2s30 | 75.131 | 9.876 | 0.604 | 9.418 | 4.969 | 0.002 | 0.001 | 0.705 | |||
| pg153_o3_native_lto.cx7a7_4g_gcp_c2s30 | 73.608 | 10.970 | 0.754 | 9.282 | 5.314 | 0.071 | nonzero | 0.527 | |||
| pg153_o3_native_lto.cx7a8_4g_gcp_c2s30 | 84.456 | 6.130 | 0.626 | 4.416 | 4.362 | 0.010 | nonzero | 0.406 | |||
| pg153_o3_native_lto.cx7a9_4g_gcp_c2s30 | 84.340 | 6.676 | 0.543 | 4.234 | 4.200 | 0.007 | nonzero | 0.816 |
Performance metrics for the DBMS listed above. Some are normalized by throughput, others are not. Legend for results is here.
ips	qps	rps	rmbps	wps	wmbps	rpq	rkbpq	wpi	wkbpi	csps	cpups	cspq	cpupq	dbgb1	dbgb2	rss	maxop	p50	p99	tag
77168	0	6165	74.1	92087.7	1361.2	0.080	0.984	1.193	18.063	58944	50.3	0.764	98	50.7	111.4	0.0	0.265	10538	1899	160m.pg153_o3_native_lto.cx7a_4g_gcp_c2s30
79396	0	4757	63.8	91155.0	1358.9	0.060	0.822	1.148	17.526	58291	49.4	0.734	93	51.6	98.9	NA	0.318	10743	2048	160m.pg153_o3_native_lto.cx7a1_4g_gcp_c2s30
61738	0	4948	55.1	151107.2	1422.2	0.080	0.913	2.448	23.588	48950	47.5	0.793	115	49.0	102.5	0.0	0.317	8341	2098	160m.pg153_o3_native_lto.cx7a2_4g_gcp_c2s30
84450	0	3968	54.8	90900.3	1386.9	0.047	0.664	1.076	16.817	59495	50.7	0.704	90	51.8	78.8	0.0	0.412	11088	2048	160m.pg153_o3_native_lto.cx7a3_4g_gcp_c2s30
78609	0	5259	66.8	91850.9	1360.2	0.067	0.870	1.168	17.719	58457	50.0	0.744	95	50.9	120.9	0.0	0.542	10489	2049	160m.pg153_o3_native_lto.cx7a4_4g_gcp_c2s30
75729	0	5801	71.1	91084.9	1340.5	0.077	0.961	1.203	18.127	57957	49.3	0.765	98	51.0	111.0	0.0	0.416	9993	1948	160m.pg153_o3_native_lto.cx7a5_4g_gcp_c2s30
61662	0	4953	55.4	150825.2	1421.0	0.080	0.921	2.446	23.599	49162	47.7	0.797	116	49.0	102.7	0.0	0.149	8291	2098	160m.pg153_o3_native_lto.cx7a6_4g_gcp_c2s30
42644	0	21884	172.4	82724.8	1151.2	0.513	4.141	1.940	27.644	54994	36.9	1.290	130	49.6	65.6	0.0	0.344	4545	1499	160m.pg153_o3_native_lto.cx7a7_4g_gcp_c2s30
88525	0	7113	82.8	88393.1	1258.5	0.080	0.958	0.999	14.557	59779	52.5	0.675	89	50.7	115.1	0.0	0.412	11238	1948	160m.pg153_o3_native_lto.cx7a8_4g_gcp_c2s30
78632	0	5323	67.1	92066.0	1367.5	0.068	0.873	1.171	17.809	58543	50.4	0.745	96	50.9	121.0	0.0	0.410	10688	1948	160m.pg153_o3_native_lto.cx7a9_4g_gcp_c2s30
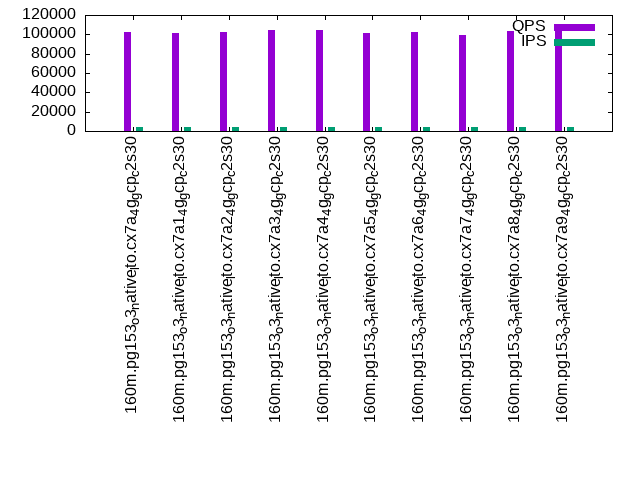
q100.1
q100.1: range queries with 100 insert/s per client. Graphs for performance per 1-second interval are here.
Average throughput:
Query response time histogram: each cell has the percentage of responses that take <= the time in the header and max is the max response time in seconds. For max values in the top 25% of the range have a red background and in the bottom 25% of the range have a green background. The red background is not used when the min value is within 80% of the max value.
| dbms | 256us | 1ms | 4ms | 16ms | 64ms | 256ms | 1s | 4s | 16s | gt | max |
|---|---|---|---|---|---|---|---|---|---|---|---|
| pg153_o3_native_lto.cx7a_4g_gcp_c2s30 | 99.975 | 0.024 | 0.001 | nonzero | nonzero | nonzero | 0.096 | ||||
| pg153_o3_native_lto.cx7a1_4g_gcp_c2s30 | 99.977 | 0.021 | 0.001 | nonzero | nonzero | nonzero | 0.101 | ||||
| pg153_o3_native_lto.cx7a2_4g_gcp_c2s30 | 99.982 | 0.017 | 0.001 | nonzero | nonzero | 0.035 | |||||
| pg153_o3_native_lto.cx7a3_4g_gcp_c2s30 | 99.977 | 0.022 | 0.001 | nonzero | nonzero | nonzero | 0.118 | ||||
| pg153_o3_native_lto.cx7a4_4g_gcp_c2s30 | 99.976 | 0.024 | 0.001 | nonzero | nonzero | nonzero | 0.090 | ||||
| pg153_o3_native_lto.cx7a5_4g_gcp_c2s30 | 99.964 | 0.035 | 0.001 | nonzero | nonzero | nonzero | 0.118 | ||||
| pg153_o3_native_lto.cx7a6_4g_gcp_c2s30 | 99.976 | 0.023 | 0.001 | nonzero | nonzero | 0.030 | |||||
| pg153_o3_native_lto.cx7a7_4g_gcp_c2s30 | 99.976 | 0.023 | 0.001 | nonzero | nonzero | nonzero | 0.117 | ||||
| pg153_o3_native_lto.cx7a8_4g_gcp_c2s30 | 99.971 | 0.028 | 0.001 | nonzero | nonzero | nonzero | 0.113 | ||||
| pg153_o3_native_lto.cx7a9_4g_gcp_c2s30 | 99.974 | 0.025 | 0.001 | nonzero | nonzero | 0.033 |
Insert response time histogram: each cell has the percentage of responses that take <= the time in the header and max is the max response time in seconds. For max values in the top 25% of the range have a red background and in the bottom 25% of the range have a green background. The red background is not used when the min value is within 80% of the max value.
| dbms | 256us | 1ms | 4ms | 16ms | 64ms | 256ms | 1s | 4s | 16s | gt | max |
|---|---|---|---|---|---|---|---|---|---|---|---|
| pg153_o3_native_lto.cx7a_4g_gcp_c2s30 | 89.642 | 10.293 | 0.061 | 0.003 | 0.198 | ||||||
| pg153_o3_native_lto.cx7a1_4g_gcp_c2s30 | 87.000 | 12.965 | 0.033 | 0.002 | 0.086 | ||||||
| pg153_o3_native_lto.cx7a2_4g_gcp_c2s30 | 86.845 | 13.132 | 0.023 | 0.029 | |||||||
| pg153_o3_native_lto.cx7a3_4g_gcp_c2s30 | 94.882 | 5.036 | 0.082 | 0.063 | |||||||
| pg153_o3_native_lto.cx7a4_4g_gcp_c2s30 | 88.656 | 11.210 | 0.125 | 0.009 | 0.070 | ||||||
| pg153_o3_native_lto.cx7a5_4g_gcp_c2s30 | 87.530 | 12.266 | 0.189 | 0.016 | 0.078 | ||||||
| pg153_o3_native_lto.cx7a6_4g_gcp_c2s30 | 87.248 | 12.734 | 0.017 | 0.024 | |||||||
| pg153_o3_native_lto.cx7a7_4g_gcp_c2s30 | 81.030 | 18.917 | 0.047 | 0.007 | 0.110 | ||||||
| pg153_o3_native_lto.cx7a8_4g_gcp_c2s30 | 91.283 | 8.642 | 0.075 | 0.062 | |||||||
| pg153_o3_native_lto.cx7a9_4g_gcp_c2s30 | 79.087 | 20.866 | 0.045 | 0.002 | 0.068 |
Delete response time histogram: each cell has the percentage of responses that take <= the time in the header and max is the max response time in seconds. For max values in the top 25% of the range have a red background and in the bottom 25% of the range have a green background. The red background is not used when the min value is within 80% of the max value.
| dbms | 256us | 1ms | 4ms | 16ms | 64ms | 256ms | 1s | 4s | 16s | gt | max |
|---|---|---|---|---|---|---|---|---|---|---|---|
| pg153_o3_native_lto.cx7a_4g_gcp_c2s30 | 45.873 | 28.503 | 25.604 | 0.019 | 0.005 | ||||||
| pg153_o3_native_lto.cx7a1_4g_gcp_c2s30 | 57.085 | 35.726 | 7.186 | 0.003 | 0.005 | ||||||
| pg153_o3_native_lto.cx7a2_4g_gcp_c2s30 | 51.016 | 37.236 | 11.743 | 0.005 | 0.009 | ||||||
| pg153_o3_native_lto.cx7a3_4g_gcp_c2s30 | 57.101 | 35.493 | 7.398 | 0.009 | 0.007 | ||||||
| pg153_o3_native_lto.cx7a4_4g_gcp_c2s30 | 50.047 | 32.670 | 17.259 | 0.023 | 0.002 | 0.019 | |||||
| pg153_o3_native_lto.cx7a5_4g_gcp_c2s30 | 59.564 | 20.957 | 19.436 | 0.043 | 0.010 | ||||||
| pg153_o3_native_lto.cx7a6_4g_gcp_c2s30 | 57.698 | 26.828 | 15.469 | 0.005 | 0.005 | ||||||
| pg153_o3_native_lto.cx7a7_4g_gcp_c2s30 | 72.269 | 25.080 | 2.651 | 0.004 | |||||||
| pg153_o3_native_lto.cx7a8_4g_gcp_c2s30 | 47.757 | 35.340 | 16.889 | 0.014 | 0.010 | ||||||
| pg153_o3_native_lto.cx7a9_4g_gcp_c2s30 | 51.316 | 37.835 | 10.847 | 0.002 | 0.018 |
Performance metrics for the DBMS listed above. Some are normalized by throughput, others are not. Legend for results is here.
ips	qps	rps	rmbps	wps	wmbps	rpq	rkbpq	wpi	wkbpi	csps	cpups	cspq	cpupq	dbgb1	dbgb2	rss	maxop	p50	p99	tag
797	111272	298	2.0	3588.2	149.7	0.003	0.018	4.500	192.321	424936	53.0	3.819	71	50.7	75.9	0.0	0.096	13921	13218	160m.pg153_o3_native_lto.cx7a_4g_gcp_c2s30
798	111452	249	1.3	3462.8	109.2	0.002	0.012	4.342	140.271	425370	53.0	3.817	71	51.6	74.4	0.0	0.101	13905	13303	160m.pg153_o3_native_lto.cx7a1_4g_gcp_c2s30
797	110753	298	1.6	3398.5	50.2	0.003	0.015	4.263	64.456	422933	53.0	3.819	72	49.0	71.9	0.0	0.035	13894	13414	160m.pg153_o3_native_lto.cx7a2_4g_gcp_c2s30
797	111747	250	1.7	3452.9	90.9	0.002	0.016	4.331	116.763	426019	52.8	3.812	71	51.8	75.6	0.0	0.118	14081	13889	160m.pg153_o3_native_lto.cx7a3_4g_gcp_c2s30
797	110683	314	2.4	3437.1	57.2	0.003	0.022	4.311	73.524	421943	52.8	3.812	72	50.9	120.9	0.0	0.090	13841	13569	160m.pg153_o3_native_lto.cx7a4_4g_gcp_c2s30
797	110099	358	2.9	3542.2	126.8	0.003	0.027	4.443	162.850	420698	52.9	3.821	72	50.9	75.0	0.0	0.118	13825	12498	160m.pg153_o3_native_lto.cx7a5_4g_gcp_c2s30
797	110254	326	1.9	3456.9	67.8	0.003	0.017	4.336	87.035	421097	52.9	3.819	72	49.0	71.7	0.0	0.030	13745	12866	160m.pg153_o3_native_lto.cx7a6_4g_gcp_c2s30
797	110168	562	3.4	3502.5	182.9	0.005	0.032	4.393	234.897	420875	53.0	3.820	72	49.6	60.6	0.0	0.117	13681	13447	160m.pg153_o3_native_lto.cx7a7_4g_gcp_c2s30
797	111587	346	2.4	3489.9	98.9	0.003	0.022	4.377	127.022	426105	53.2	3.819	72	50.7	77.8	0.0	0.113	14112	12003	160m.pg153_o3_native_lto.cx7a8_4g_gcp_c2s30
797	111082	465	3.0	3432.6	36.1	0.004	0.028	4.305	46.359	423896	52.9	3.816	71	50.9	115.1	0.0	0.033	14022	13761	160m.pg153_o3_native_lto.cx7a9_4g_gcp_c2s30
q500.1
q500.1: range queries with 500 insert/s per client. Graphs for performance per 1-second interval are here.
Average throughput:
Query response time histogram: each cell has the percentage of responses that take <= the time in the header and max is the max response time in seconds. For max values in the top 25% of the range have a red background and in the bottom 25% of the range have a green background. The red background is not used when the min value is within 80% of the max value.
| dbms | 256us | 1ms | 4ms | 16ms | 64ms | 256ms | 1s | 4s | 16s | gt | max |
|---|---|---|---|---|---|---|---|---|---|---|---|
| pg153_o3_native_lto.cx7a_4g_gcp_c2s30 | 99.896 | 0.095 | 0.006 | 0.001 | 0.001 | nonzero | 0.181 | ||||
| pg153_o3_native_lto.cx7a1_4g_gcp_c2s30 | 99.899 | 0.089 | 0.012 | 0.001 | nonzero | nonzero | 0.132 | ||||
| pg153_o3_native_lto.cx7a2_4g_gcp_c2s30 | 99.917 | 0.078 | 0.005 | nonzero | nonzero | 0.025 | |||||
| pg153_o3_native_lto.cx7a3_4g_gcp_c2s30 | 99.970 | 0.023 | 0.007 | nonzero | nonzero | 0.049 | |||||
| pg153_o3_native_lto.cx7a4_4g_gcp_c2s30 | 99.957 | 0.038 | 0.005 | nonzero | nonzero | 0.024 | |||||
| pg153_o3_native_lto.cx7a5_4g_gcp_c2s30 | 99.913 | 0.081 | 0.005 | 0.001 | 0.001 | nonzero | 0.165 | ||||
| pg153_o3_native_lto.cx7a6_4g_gcp_c2s30 | 99.909 | 0.084 | 0.006 | nonzero | nonzero | nonzero | 0.160 | ||||
| pg153_o3_native_lto.cx7a7_4g_gcp_c2s30 | 99.888 | 0.101 | 0.007 | 0.002 | 0.002 | nonzero | nonzero | 0.261 | |||
| pg153_o3_native_lto.cx7a8_4g_gcp_c2s30 | 99.909 | 0.085 | 0.005 | 0.001 | nonzero | nonzero | 0.149 | ||||
| pg153_o3_native_lto.cx7a9_4g_gcp_c2s30 | 99.950 | 0.044 | 0.005 | nonzero | nonzero | 0.019 |
Insert response time histogram: each cell has the percentage of responses that take <= the time in the header and max is the max response time in seconds. For max values in the top 25% of the range have a red background and in the bottom 25% of the range have a green background. The red background is not used when the min value is within 80% of the max value.
| dbms | 256us | 1ms | 4ms | 16ms | 64ms | 256ms | 1s | 4s | 16s | gt | max |
|---|---|---|---|---|---|---|---|---|---|---|---|
| pg153_o3_native_lto.cx7a_4g_gcp_c2s30 | 80.564 | 15.860 | 2.952 | 0.623 | 0.240 | ||||||
| pg153_o3_native_lto.cx7a1_4g_gcp_c2s30 | 86.271 | 12.376 | 1.226 | 0.127 | 0.166 | ||||||
| pg153_o3_native_lto.cx7a2_4g_gcp_c2s30 | 88.978 | 10.942 | 0.080 | 0.034 | |||||||
| pg153_o3_native_lto.cx7a3_4g_gcp_c2s30 | 99.269 | 0.641 | 0.090 | 0.063 | |||||||
| pg153_o3_native_lto.cx7a4_4g_gcp_c2s30 | 95.003 | 4.906 | 0.085 | 0.005 | 0.139 | ||||||
| pg153_o3_native_lto.cx7a5_4g_gcp_c2s30 | 84.408 | 13.524 | 1.898 | 0.170 | 0.202 | ||||||
| pg153_o3_native_lto.cx7a6_4g_gcp_c2s30 | 87.409 | 11.674 | 0.860 | 0.057 | 0.193 | ||||||
| pg153_o3_native_lto.cx7a7_4g_gcp_c2s30 | 71.635 | 22.765 | 4.684 | 0.914 | 0.002 | 0.263 | |||||
| pg153_o3_native_lto.cx7a8_4g_gcp_c2s30 | 86.328 | 12.644 | 0.991 | 0.037 | 0.189 | ||||||
| pg153_o3_native_lto.cx7a9_4g_gcp_c2s30 | 95.183 | 4.786 | 0.030 | nonzero | 0.089 |
Delete response time histogram: each cell has the percentage of responses that take <= the time in the header and max is the max response time in seconds. For max values in the top 25% of the range have a red background and in the bottom 25% of the range have a green background. The red background is not used when the min value is within 80% of the max value.
| dbms | 256us | 1ms | 4ms | 16ms | 64ms | 256ms | 1s | 4s | 16s | gt | max |
|---|---|---|---|---|---|---|---|---|---|---|---|
| pg153_o3_native_lto.cx7a_4g_gcp_c2s30 | 78.041 | 2.368 | 2.790 | 16.405 | 0.324 | 0.073 | 0.182 | ||||
| pg153_o3_native_lto.cx7a1_4g_gcp_c2s30 | 75.120 | 3.492 | 3.447 | 17.815 | 0.110 | 0.016 | 0.140 | ||||
| pg153_o3_native_lto.cx7a2_4g_gcp_c2s30 | 76.873 | 2.594 | 2.798 | 17.674 | 0.061 | 0.040 | |||||
| pg153_o3_native_lto.cx7a3_4g_gcp_c2s30 | 76.251 | 2.402 | 3.707 | 17.602 | 0.037 | nonzero | 0.087 | ||||
| pg153_o3_native_lto.cx7a4_4g_gcp_c2s30 | 76.136 | 2.731 | 4.589 | 16.461 | 0.082 | 0.050 | |||||
| pg153_o3_native_lto.cx7a5_4g_gcp_c2s30 | 78.003 | 3.293 | 4.807 | 13.760 | 0.123 | 0.014 | 0.148 | ||||
| pg153_o3_native_lto.cx7a6_4g_gcp_c2s30 | 76.174 | 2.855 | 2.688 | 18.192 | 0.090 | 0.001 | 0.139 | ||||
| pg153_o3_native_lto.cx7a7_4g_gcp_c2s30 | 74.116 | 2.873 | 4.918 | 17.515 | 0.447 | 0.131 | 0.213 | ||||
| pg153_o3_native_lto.cx7a8_4g_gcp_c2s30 | 76.984 | 2.677 | 3.004 | 17.217 | 0.111 | 0.006 | 0.116 | ||||
| pg153_o3_native_lto.cx7a9_4g_gcp_c2s30 | 75.901 | 2.701 | 3.032 | 18.288 | 0.077 | 0.055 |
Performance metrics for the DBMS listed above. Some are normalized by throughput, others are not. Legend for results is here.
ips	qps	rps	rmbps	wps	wmbps	rpq	rkbpq	wpi	wkbpi	csps	cpups	cspq	cpupq	dbgb1	dbgb2	rss	maxop	p50	p99	tag
3988	102074	1685	10.4	16471.6	699.9	0.017	0.104	4.130	179.725	391356	54.9	3.834	81	50.7	72.8	0.0	0.181	12898	11092	160m.pg153_o3_native_lto.cx7a_4g_gcp_c2s30
3987	101840	910	5.6	15976.0	511.3	0.009	0.057	4.007	131.322	390308	55.4	3.833	82	51.6	66.7	0.0	0.132	12770	11799	160m.pg153_o3_native_lto.cx7a1_4g_gcp_c2s30
3987	102430	1748	10.4	15786.9	238.8	0.017	0.104	3.960	61.345	392908	55.4	3.836	81	49.0	70.9	0.0	0.025	12759	11939	160m.pg153_o3_native_lto.cx7a2_4g_gcp_c2s30
3988	104138	152	1.4	15942.8	418.1	0.001	0.014	3.998	107.353	397890	55.1	3.821	79	51.8	70.0	0.0	0.049	12978	12402	160m.pg153_o3_native_lto.cx7a3_4g_gcp_c2s30
3987	104727	544	4.0	15769.3	269.2	0.005	0.039	3.955	69.145	398217	55.1	3.802	79	50.9	117.7	0.0	0.024	13218	12307	160m.pg153_o3_native_lto.cx7a4_4g_gcp_c2s30
3988	101192	1727	10.6	16192.0	584.7	0.017	0.108	4.060	150.138	389163	55.1	3.846	82	50.9	72.9	0.0	0.165	12503	10980	160m.pg153_o3_native_lto.cx7a5_4g_gcp_c2s30
3987	102121	1709	10.1	15954.3	308.0	0.017	0.101	4.002	79.113	391698	55.2	3.836	81	49.0	70.8	0.0	0.160	12914	12019	160m.pg153_o3_native_lto.cx7a6_4g_gcp_c2s30
3987	99342	2009	12.4	16522.6	877.2	0.020	0.128	4.144	225.301	382305	54.9	3.848	83	49.6	65.6	0.0	0.261	12450	10420	160m.pg153_o3_native_lto.cx7a7_4g_gcp_c2s30
3988	103699	1675	10.2	15336.3	448.2	0.016	0.101	3.846	115.093	397456	55.4	3.833	80	50.7	73.6	0.0	0.149	13042	12019	160m.pg153_o3_native_lto.cx7a8_4g_gcp_c2s30
3987	104033	791	5.3	15733.1	169.3	0.008	0.052	3.946	43.478	396478	55.2	3.811	80	50.9	102.4	0.0	0.019	13051	12151	160m.pg153_o3_native_lto.cx7a9_4g_gcp_c2s30
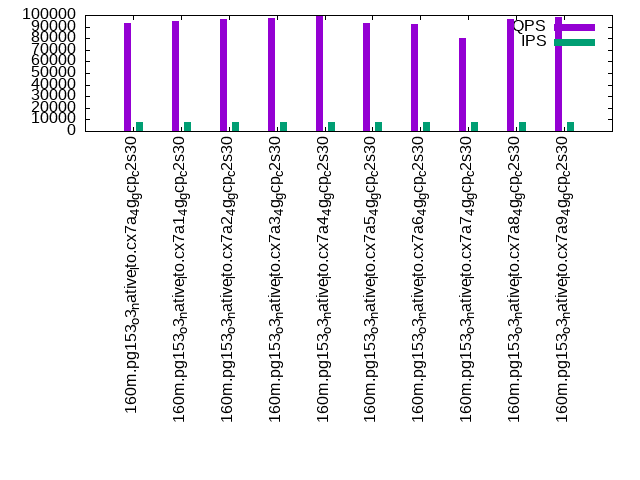
q1000.1
q1000.1: range queries with 1000 insert/s per client. Graphs for performance per 1-second interval are here.
Average throughput:
Query response time histogram: each cell has the percentage of responses that take <= the time in the header and max is the max response time in seconds. For max values in the top 25% of the range have a red background and in the bottom 25% of the range have a green background. The red background is not used when the min value is within 80% of the max value.
| dbms | 256us | 1ms | 4ms | 16ms | 64ms | 256ms | 1s | 4s | 16s | gt | max |
|---|---|---|---|---|---|---|---|---|---|---|---|
| pg153_o3_native_lto.cx7a_4g_gcp_c2s30 | 99.665 | 0.293 | 0.026 | 0.010 | 0.005 | nonzero | 0.234 | ||||
| pg153_o3_native_lto.cx7a1_4g_gcp_c2s30 | 99.734 | 0.234 | 0.026 | 0.004 | 0.002 | nonzero | 0.137 | ||||
| pg153_o3_native_lto.cx7a2_4g_gcp_c2s30 | 99.720 | 0.259 | 0.018 | 0.003 | 0.001 | nonzero | 0.105 | ||||
| pg153_o3_native_lto.cx7a3_4g_gcp_c2s30 | 99.882 | 0.102 | 0.015 | 0.001 | nonzero | nonzero | 0.119 | ||||
| pg153_o3_native_lto.cx7a4_4g_gcp_c2s30 | 99.876 | 0.109 | 0.013 | 0.001 | nonzero | nonzero | 0.138 | ||||
| pg153_o3_native_lto.cx7a5_4g_gcp_c2s30 | 99.666 | 0.298 | 0.024 | 0.009 | 0.004 | nonzero | 0.154 | ||||
| pg153_o3_native_lto.cx7a6_4g_gcp_c2s30 | 99.663 | 0.293 | 0.025 | 0.011 | 0.007 | nonzero | 0.149 | ||||
| pg153_o3_native_lto.cx7a7_4g_gcp_c2s30 | 99.184 | 0.699 | 0.057 | 0.036 | 0.022 | 0.001 | nonzero | 0.318 | |||
| pg153_o3_native_lto.cx7a8_4g_gcp_c2s30 | 99.674 | 0.296 | 0.022 | 0.006 | 0.002 | nonzero | 0.186 | ||||
| pg153_o3_native_lto.cx7a9_4g_gcp_c2s30 | 99.838 | 0.145 | 0.015 | 0.002 | nonzero | nonzero | 0.115 |
Insert response time histogram: each cell has the percentage of responses that take <= the time in the header and max is the max response time in seconds. For max values in the top 25% of the range have a red background and in the bottom 25% of the range have a green background. The red background is not used when the min value is within 80% of the max value.
| dbms | 256us | 1ms | 4ms | 16ms | 64ms | 256ms | 1s | 4s | 16s | gt | max |
|---|---|---|---|---|---|---|---|---|---|---|---|
| pg153_o3_native_lto.cx7a_4g_gcp_c2s30 | 79.094 | 16.534 | 3.960 | 0.411 | 0.001 | 0.318 | |||||
| pg153_o3_native_lto.cx7a1_4g_gcp_c2s30 | 84.871 | 13.187 | 1.879 | 0.063 | 0.248 | ||||||
| pg153_o3_native_lto.cx7a2_4g_gcp_c2s30 | 84.867 | 14.551 | 0.561 | 0.021 | 0.187 | ||||||
| pg153_o3_native_lto.cx7a3_4g_gcp_c2s30 | 96.757 | 3.139 | 0.091 | 0.013 | 0.228 | ||||||
| pg153_o3_native_lto.cx7a4_4g_gcp_c2s30 | 95.043 | 4.754 | 0.184 | 0.019 | 0.177 | ||||||
| pg153_o3_native_lto.cx7a5_4g_gcp_c2s30 | 78.245 | 18.575 | 2.996 | 0.184 | nonzero | 0.274 | |||||
| pg153_o3_native_lto.cx7a6_4g_gcp_c2s30 | 80.966 | 16.832 | 2.072 | 0.130 | 0.218 | ||||||
| pg153_o3_native_lto.cx7a7_4g_gcp_c2s30 | 49.766 | 39.472 | 9.538 | 1.216 | 0.007 | 0.542 | |||||
| pg153_o3_native_lto.cx7a8_4g_gcp_c2s30 | 80.743 | 17.240 | 1.926 | 0.091 | nonzero | 0.261 | |||||
| pg153_o3_native_lto.cx7a9_4g_gcp_c2s30 | 93.811 | 5.971 | 0.197 | 0.021 | nonzero | 0.270 |
Delete response time histogram: each cell has the percentage of responses that take <= the time in the header and max is the max response time in seconds. For max values in the top 25% of the range have a red background and in the bottom 25% of the range have a green background. The red background is not used when the min value is within 80% of the max value.
| dbms | 256us | 1ms | 4ms | 16ms | 64ms | 256ms | 1s | 4s | 16s | gt | max |
|---|---|---|---|---|---|---|---|---|---|---|---|
| pg153_o3_native_lto.cx7a_4g_gcp_c2s30 | 77.869 | 4.595 | 1.189 | 12.473 | 3.817 | 0.057 | 0.214 | ||||
| pg153_o3_native_lto.cx7a1_4g_gcp_c2s30 | 76.688 | 4.132 | 2.862 | 13.133 | 3.177 | 0.008 | 0.197 | ||||
| pg153_o3_native_lto.cx7a2_4g_gcp_c2s30 | 77.764 | 4.240 | 1.864 | 12.709 | 3.419 | 0.003 | 0.109 | ||||
| pg153_o3_native_lto.cx7a3_4g_gcp_c2s30 | 78.280 | 3.116 | 2.635 | 13.047 | 2.921 | nonzero | 0.089 | ||||
| pg153_o3_native_lto.cx7a4_4g_gcp_c2s30 | 77.707 | 3.637 | 2.038 | 13.118 | 3.501 | nonzero | 0.070 | ||||
| pg153_o3_native_lto.cx7a5_4g_gcp_c2s30 | 76.095 | 4.767 | 2.557 | 11.837 | 4.717 | 0.027 | 0.156 | ||||
| pg153_o3_native_lto.cx7a6_4g_gcp_c2s30 | 77.805 | 4.337 | 2.312 | 12.829 | 2.710 | 0.009 | 0.171 | ||||
| pg153_o3_native_lto.cx7a7_4g_gcp_c2s30 | 75.959 | 4.299 | 4.481 | 11.657 | 3.480 | 0.123 | nonzero | 0.318 | |||
| pg153_o3_native_lto.cx7a8_4g_gcp_c2s30 | 77.589 | 4.128 | 1.465 | 13.259 | 3.548 | 0.010 | 0.186 | ||||
| pg153_o3_native_lto.cx7a9_4g_gcp_c2s30 | 77.503 | 4.172 | 2.468 | 13.085 | 2.773 | nonzero | 0.075 |
Performance metrics for the DBMS listed above. Some are normalized by throughput, others are not. Legend for results is here.
ips	qps	rps	rmbps	wps	wmbps	rpq	rkbpq	wpi	wkbpi	csps	cpups	cspq	cpupq	dbgb1	dbgb2	rss	maxop	p50	p99	tag
7976	92766	2406	15.6	28429.8	819.3	0.026	0.172	3.565	105.194	353933	56.1	3.815	91	50.7	80.0	0.0	0.234	11927	5882	160m.pg153_o3_native_lto.cx7a_4g_gcp_c2s30
7976	95011	1389	9.6	29320.3	844.9	0.015	0.104	3.676	108.476	360592	57.7	3.795	91	51.6	70.7	0.0	0.137	12099	9081	160m.pg153_o3_native_lto.cx7a1_4g_gcp_c2s30
7976	96216	2345	14.6	30598.2	457.2	0.024	0.156	3.836	58.699	365671	58.0	3.801	90	49.0	78.2	0.0	0.105	12099	9014	160m.pg153_o3_native_lto.cx7a2_4g_gcp_c2s30
7976	97812	516	4.7	30179.4	773.4	0.005	0.049	3.784	99.292	370543	57.9	3.788	89	51.7	57.0	0.0	0.119	12263	10868	160m.pg153_o3_native_lto.cx7a3_4g_gcp_c2s30
7976	98766	832	6.3	30358.2	485.1	0.008	0.066	3.806	62.284	369930	58.0	3.746	88	50.9	112.8	0.0	0.138	12514	10213	160m.pg153_o3_native_lto.cx7a4_4g_gcp_c2s30
7976	92963	2431	15.5	29234.0	834.1	0.026	0.170	3.665	107.093	355502	57.0	3.824	92	50.7	80.1	0.0	0.154	11827	7768	160m.pg153_o3_native_lto.cx7a5_4g_gcp_c2s30
7976	92036	2353	14.8	30434.5	569.8	0.026	0.164	3.816	73.162	350963	56.0	3.813	91	49.0	78.1	0.0	0.149	11539	8375	160m.pg153_o3_native_lto.cx7a6_4g_gcp_c2s30
7978	80577	5461	35.3	27365.1	1009.6	0.068	0.449	3.430	129.591	316470	52.1	3.928	97	49.6	65.6	0.0	0.318	10309	4155	160m.pg153_o3_native_lto.cx7a7_4g_gcp_c2s30
7978	96941	2409	15.2	28401.4	782.8	0.025	0.161	3.560	100.472	368251	57.3	3.799	89	50.7	79.8	0.0	0.186	12307	8391	160m.pg153_o3_native_lto.cx7a8_4g_gcp_c2s30
7976	98696	1094	7.8	30353.9	291.5	0.011	0.081	3.806	37.422	370026	58.0	3.749	88	50.9	97.0	0.0	0.115	12546	10377	160m.pg153_o3_native_lto.cx7a9_4g_gcp_c2s30
l.i0
l.i0: load without secondary indexes
Performance metrics for all DBMS, not just the ones listed above. Some are normalized by throughput, others are not. Legend for results is here.
ips	qps	rps	rmbps	wps	wmbps	rpq	rkbpq	wpi	wkbpi	csps	cpups	cspq	cpupq	dbgb1	dbgb2	rss	maxop	p50	p99	tag
1025641	0	20	0.1	4888.1	404.6	0.000	0.000	0.005	0.404	83957	75.0	0.082	11	15.3	41.4	NA	0.571	149638	35961	160m.pg153_o3_native_lto.cx7a_4g_gcp_c2s30
1025641	0	20	0.1	5111.2	406.4	0.000	0.000	0.005	0.406	84405	75.3	0.082	11	15.3	41.4	0.0	0.380	149538	22575	160m.pg153_o3_native_lto.cx7a1_4g_gcp_c2s30
1019108	0	16	0.1	5124.7	403.8	0.000	0.000	0.005	0.406	84867	75.2	0.083	11	15.3	41.4	0.0	0.441	147840	31266	160m.pg153_o3_native_lto.cx7a2_4g_gcp_c2s30
1025641	0	9	0.0	5106.5	405.4	0.000	0.000	0.005	0.405	84046	75.2	0.082	11	15.3	41.4	0.0	0.414	149737	36161	160m.pg153_o3_native_lto.cx7a3_4g_gcp_c2s30
1025641	0	18	0.1	5122.5	404.4	0.000	0.000	0.005	0.404	84066	75.5	0.082	11	15.3	41.4	0.0	0.327	148539	43753	160m.pg153_o3_native_lto.cx7a4_4g_gcp_c2s30
1019108	0	14	0.1	5081.6	408.8	0.000	0.000	0.005	0.411	84386	75.3	0.083	11	15.3	41.4	0.0	0.420	147737	27979	160m.pg153_o3_native_lto.cx7a5_4g_gcp_c2s30
1019108	0	22	0.1	5127.2	406.3	0.000	0.000	0.005	0.408	84680	75.4	0.083	11	15.3	41.4	0.0	0.380	147337	35774	160m.pg153_o3_native_lto.cx7a6_4g_gcp_c2s30
1032258	0	0	0.0	3465.7	338.3	0.000	0.000	0.003	0.336	87024	75.8	0.084	11	15.3	31.4	0.0	0.287	147120	38373	160m.pg153_o3_native_lto.cx7a7_4g_gcp_c2s30
1019108	0	21	0.1	3696.0	378.5	0.000	0.000	0.004	0.380	84430	75.2	0.083	11	15.3	41.4	0.0	0.437	148137	43553	160m.pg153_o3_native_lto.cx7a8_4g_gcp_c2s30
1012658	0	20	0.1	5072.5	405.7	0.000	0.000	0.005	0.410	84059	75.5	0.083	11	15.3	41.4	0.0	0.544	147938	16588	160m.pg153_o3_native_lto.cx7a9_4g_gcp_c2s30
l.x
l.x: create secondary indexes
Performance metrics for all DBMS, not just the ones listed above. Some are normalized by throughput, others are not. Legend for results is here.
ips	qps	rps	rmbps	wps	wmbps	rpq	rkbpq	wpi	wkbpi	csps	cpups	cspq	cpupq	dbgb1	dbgb2	rss	maxop	p50	p99	tag
2052564	0	2646	12.2	1705.2	582.2	0.001	0.006	0.001	0.290	20986	36.4	0.010	3	29.4	68.3	0.0	0.002	NA	NA	160m.pg153_o3_native_lto.cx7a_4g_gcp_c2s30
2223611	0	2494	11.9	1529.1	503.9	0.001	0.005	0.001	0.232	10030	40.1	0.005	3	29.4	63.3	0.0	0.002	NA	NA	160m.pg153_o3_native_lto.cx7a1_4g_gcp_c2s30
2026582	0	2560	11.8	1756.3	580.9	0.001	0.006	0.001	0.293	15728	36.2	0.008	3	29.4	68.3	0.0	0.002	NA	NA	160m.pg153_o3_native_lto.cx7a2_4g_gcp_c2s30
2052564	0	2750	12.8	1742.1	589.6	0.001	0.006	0.001	0.294	23526	36.6	0.011	3	29.4	68.3	0.0	0.002	NA	NA	160m.pg153_o3_native_lto.cx7a3_4g_gcp_c2s30
2052564	0	2598	11.9	1742.8	567.3	0.001	0.006	0.001	0.283	21033	36.7	0.010	3	29.4	68.3	0.0	0.002	NA	NA	160m.pg153_o3_native_lto.cx7a4_4g_gcp_c2s30
2052564	0	2497	11.5	1703.8	572.1	0.001	0.006	0.001	0.285	23417	36.9	0.011	3	29.4	68.3	0.0	0.002	NA	NA	160m.pg153_o3_native_lto.cx7a5_4g_gcp_c2s30
2079221	0	2425	11.0	1753.9	583.9	0.001	0.005	0.001	0.288	23544	36.9	0.011	3	29.4	68.3	0.0	0.002	NA	NA	160m.pg153_o3_native_lto.cx7a6_4g_gcp_c2s30
2254930	0	0	0.0	1658.3	487.0	0.000	0.000	0.001	0.221	34303	38.9	0.015	3	29.4	45.5	0.0	0.001	NA	NA	160m.pg153_o3_native_lto.cx7a7_4g_gcp_c2s30
2079221	0	4975	29.2	3373.4	627.9	0.002	0.014	0.002	0.309	18468	38.0	0.009	3	29.4	67.5	0.0	0.002	NA	NA	160m.pg153_o3_native_lto.cx7a8_4g_gcp_c2s30
2026582	0	2765	12.8	1712.6	571.2	0.001	0.006	0.001	0.289	13918	37.1	0.007	3	29.4	68.3	0.0	0.002	NA	NA	160m.pg153_o3_native_lto.cx7a9_4g_gcp_c2s30
l.i1
l.i1: continue load after secondary indexes created
Performance metrics for all DBMS, not just the ones listed above. Some are normalized by throughput, others are not. Legend for results is here.
ips	qps	rps	rmbps	wps	wmbps	rpq	rkbpq	wpi	wkbpi	csps	cpups	cspq	cpupq	dbgb1	dbgb2	rss	maxop	p50	p99	tag
77168	0	6165	74.1	92087.7	1361.2	0.080	0.984	1.193	18.063	58944	50.3	0.764	98	50.7	111.4	0.0	0.265	10538	1899	160m.pg153_o3_native_lto.cx7a_4g_gcp_c2s30
79396	0	4757	63.8	91155.0	1358.9	0.060	0.822	1.148	17.526	58291	49.4	0.734	93	51.6	98.9	NA	0.318	10743	2048	160m.pg153_o3_native_lto.cx7a1_4g_gcp_c2s30
61738	0	4948	55.1	151107.2	1422.2	0.080	0.913	2.448	23.588	48950	47.5	0.793	115	49.0	102.5	0.0	0.317	8341	2098	160m.pg153_o3_native_lto.cx7a2_4g_gcp_c2s30
84450	0	3968	54.8	90900.3	1386.9	0.047	0.664	1.076	16.817	59495	50.7	0.704	90	51.8	78.8	0.0	0.412	11088	2048	160m.pg153_o3_native_lto.cx7a3_4g_gcp_c2s30
78609	0	5259	66.8	91850.9	1360.2	0.067	0.870	1.168	17.719	58457	50.0	0.744	95	50.9	120.9	0.0	0.542	10489	2049	160m.pg153_o3_native_lto.cx7a4_4g_gcp_c2s30
75729	0	5801	71.1	91084.9	1340.5	0.077	0.961	1.203	18.127	57957	49.3	0.765	98	51.0	111.0	0.0	0.416	9993	1948	160m.pg153_o3_native_lto.cx7a5_4g_gcp_c2s30
61662	0	4953	55.4	150825.2	1421.0	0.080	0.921	2.446	23.599	49162	47.7	0.797	116	49.0	102.7	0.0	0.149	8291	2098	160m.pg153_o3_native_lto.cx7a6_4g_gcp_c2s30
42644	0	21884	172.4	82724.8	1151.2	0.513	4.141	1.940	27.644	54994	36.9	1.290	130	49.6	65.6	0.0	0.344	4545	1499	160m.pg153_o3_native_lto.cx7a7_4g_gcp_c2s30
88525	0	7113	82.8	88393.1	1258.5	0.080	0.958	0.999	14.557	59779	52.5	0.675	89	50.7	115.1	0.0	0.412	11238	1948	160m.pg153_o3_native_lto.cx7a8_4g_gcp_c2s30
78632	0	5323	67.1	92066.0	1367.5	0.068	0.873	1.171	17.809	58543	50.4	0.745	96	50.9	121.0	0.0	0.410	10688	1948	160m.pg153_o3_native_lto.cx7a9_4g_gcp_c2s30
q100.1
q100.1: range queries with 100 insert/s per client
Performance metrics for all DBMS, not just the ones listed above. Some are normalized by throughput, others are not. Legend for results is here.
ips	qps	rps	rmbps	wps	wmbps	rpq	rkbpq	wpi	wkbpi	csps	cpups	cspq	cpupq	dbgb1	dbgb2	rss	maxop	p50	p99	tag
797	111272	298	2.0	3588.2	149.7	0.003	0.018	4.500	192.321	424936	53.0	3.819	71	50.7	75.9	0.0	0.096	13921	13218	160m.pg153_o3_native_lto.cx7a_4g_gcp_c2s30
798	111452	249	1.3	3462.8	109.2	0.002	0.012	4.342	140.271	425370	53.0	3.817	71	51.6	74.4	0.0	0.101	13905	13303	160m.pg153_o3_native_lto.cx7a1_4g_gcp_c2s30
797	110753	298	1.6	3398.5	50.2	0.003	0.015	4.263	64.456	422933	53.0	3.819	72	49.0	71.9	0.0	0.035	13894	13414	160m.pg153_o3_native_lto.cx7a2_4g_gcp_c2s30
797	111747	250	1.7	3452.9	90.9	0.002	0.016	4.331	116.763	426019	52.8	3.812	71	51.8	75.6	0.0	0.118	14081	13889	160m.pg153_o3_native_lto.cx7a3_4g_gcp_c2s30
797	110683	314	2.4	3437.1	57.2	0.003	0.022	4.311	73.524	421943	52.8	3.812	72	50.9	120.9	0.0	0.090	13841	13569	160m.pg153_o3_native_lto.cx7a4_4g_gcp_c2s30
797	110099	358	2.9	3542.2	126.8	0.003	0.027	4.443	162.850	420698	52.9	3.821	72	50.9	75.0	0.0	0.118	13825	12498	160m.pg153_o3_native_lto.cx7a5_4g_gcp_c2s30
797	110254	326	1.9	3456.9	67.8	0.003	0.017	4.336	87.035	421097	52.9	3.819	72	49.0	71.7	0.0	0.030	13745	12866	160m.pg153_o3_native_lto.cx7a6_4g_gcp_c2s30
797	110168	562	3.4	3502.5	182.9	0.005	0.032	4.393	234.897	420875	53.0	3.820	72	49.6	60.6	0.0	0.117	13681	13447	160m.pg153_o3_native_lto.cx7a7_4g_gcp_c2s30
797	111587	346	2.4	3489.9	98.9	0.003	0.022	4.377	127.022	426105	53.2	3.819	72	50.7	77.8	0.0	0.113	14112	12003	160m.pg153_o3_native_lto.cx7a8_4g_gcp_c2s30
797	111082	465	3.0	3432.6	36.1	0.004	0.028	4.305	46.359	423896	52.9	3.816	71	50.9	115.1	0.0	0.033	14022	13761	160m.pg153_o3_native_lto.cx7a9_4g_gcp_c2s30
q500.1
q500.1: range queries with 500 insert/s per client
Performance metrics for all DBMS, not just the ones listed above. Some are normalized by throughput, others are not. Legend for results is here.
ips	qps	rps	rmbps	wps	wmbps	rpq	rkbpq	wpi	wkbpi	csps	cpups	cspq	cpupq	dbgb1	dbgb2	rss	maxop	p50	p99	tag
3988	102074	1685	10.4	16471.6	699.9	0.017	0.104	4.130	179.725	391356	54.9	3.834	81	50.7	72.8	0.0	0.181	12898	11092	160m.pg153_o3_native_lto.cx7a_4g_gcp_c2s30
3987	101840	910	5.6	15976.0	511.3	0.009	0.057	4.007	131.322	390308	55.4	3.833	82	51.6	66.7	0.0	0.132	12770	11799	160m.pg153_o3_native_lto.cx7a1_4g_gcp_c2s30
3987	102430	1748	10.4	15786.9	238.8	0.017	0.104	3.960	61.345	392908	55.4	3.836	81	49.0	70.9	0.0	0.025	12759	11939	160m.pg153_o3_native_lto.cx7a2_4g_gcp_c2s30
3988	104138	152	1.4	15942.8	418.1	0.001	0.014	3.998	107.353	397890	55.1	3.821	79	51.8	70.0	0.0	0.049	12978	12402	160m.pg153_o3_native_lto.cx7a3_4g_gcp_c2s30
3987	104727	544	4.0	15769.3	269.2	0.005	0.039	3.955	69.145	398217	55.1	3.802	79	50.9	117.7	0.0	0.024	13218	12307	160m.pg153_o3_native_lto.cx7a4_4g_gcp_c2s30
3988	101192	1727	10.6	16192.0	584.7	0.017	0.108	4.060	150.138	389163	55.1	3.846	82	50.9	72.9	0.0	0.165	12503	10980	160m.pg153_o3_native_lto.cx7a5_4g_gcp_c2s30
3987	102121	1709	10.1	15954.3	308.0	0.017	0.101	4.002	79.113	391698	55.2	3.836	81	49.0	70.8	0.0	0.160	12914	12019	160m.pg153_o3_native_lto.cx7a6_4g_gcp_c2s30
3987	99342	2009	12.4	16522.6	877.2	0.020	0.128	4.144	225.301	382305	54.9	3.848	83	49.6	65.6	0.0	0.261	12450	10420	160m.pg153_o3_native_lto.cx7a7_4g_gcp_c2s30
3988	103699	1675	10.2	15336.3	448.2	0.016	0.101	3.846	115.093	397456	55.4	3.833	80	50.7	73.6	0.0	0.149	13042	12019	160m.pg153_o3_native_lto.cx7a8_4g_gcp_c2s30
3987	104033	791	5.3	15733.1	169.3	0.008	0.052	3.946	43.478	396478	55.2	3.811	80	50.9	102.4	0.0	0.019	13051	12151	160m.pg153_o3_native_lto.cx7a9_4g_gcp_c2s30
q1000.1
q1000.1: range queries with 1000 insert/s per client
Performance metrics for all DBMS, not just the ones listed above. Some are normalized by throughput, others are not. Legend for results is here.
ips	qps	rps	rmbps	wps	wmbps	rpq	rkbpq	wpi	wkbpi	csps	cpups	cspq	cpupq	dbgb1	dbgb2	rss	maxop	p50	p99	tag
7976	92766	2406	15.6	28429.8	819.3	0.026	0.172	3.565	105.194	353933	56.1	3.815	91	50.7	80.0	0.0	0.234	11927	5882	160m.pg153_o3_native_lto.cx7a_4g_gcp_c2s30
7976	95011	1389	9.6	29320.3	844.9	0.015	0.104	3.676	108.476	360592	57.7	3.795	91	51.6	70.7	0.0	0.137	12099	9081	160m.pg153_o3_native_lto.cx7a1_4g_gcp_c2s30
7976	96216	2345	14.6	30598.2	457.2	0.024	0.156	3.836	58.699	365671	58.0	3.801	90	49.0	78.2	0.0	0.105	12099	9014	160m.pg153_o3_native_lto.cx7a2_4g_gcp_c2s30
7976	97812	516	4.7	30179.4	773.4	0.005	0.049	3.784	99.292	370543	57.9	3.788	89	51.7	57.0	0.0	0.119	12263	10868	160m.pg153_o3_native_lto.cx7a3_4g_gcp_c2s30
7976	98766	832	6.3	30358.2	485.1	0.008	0.066	3.806	62.284	369930	58.0	3.746	88	50.9	112.8	0.0	0.138	12514	10213	160m.pg153_o3_native_lto.cx7a4_4g_gcp_c2s30
7976	92963	2431	15.5	29234.0	834.1	0.026	0.170	3.665	107.093	355502	57.0	3.824	92	50.7	80.1	0.0	0.154	11827	7768	160m.pg153_o3_native_lto.cx7a5_4g_gcp_c2s30
7976	92036	2353	14.8	30434.5	569.8	0.026	0.164	3.816	73.162	350963	56.0	3.813	91	49.0	78.1	0.0	0.149	11539	8375	160m.pg153_o3_native_lto.cx7a6_4g_gcp_c2s30
7978	80577	5461	35.3	27365.1	1009.6	0.068	0.449	3.430	129.591	316470	52.1	3.928	97	49.6	65.6	0.0	0.318	10309	4155	160m.pg153_o3_native_lto.cx7a7_4g_gcp_c2s30
7978	96941	2409	15.2	28401.4	782.8	0.025	0.161	3.560	100.472	368251	57.3	3.799	89	50.7	79.8	0.0	0.186	12307	8391	160m.pg153_o3_native_lto.cx7a8_4g_gcp_c2s30
7976	98696	1094	7.8	30353.9	291.5	0.011	0.081	3.806	37.422	370026	58.0	3.749	88	50.9	97.0	0.0	0.115	12546	10377	160m.pg153_o3_native_lto.cx7a9_4g_gcp_c2s30
l.i0
- l.i0: load without secondary indexes
- Legend for results is here.
- Each entry lists the percentage of responses that fit in that bucket (slower than max time for previous bucket, faster than min time for next bucket).
Insert response time histogram
256us	1ms	4ms	16ms	64ms	256ms	1s	4s	16s	gt	max	tag
0.000	98.237	1.686	0.050	0.010	0.017	0.001	0.000	0.000	0.000	0.571	pg153_o3_native_lto.cx7a_4g_gcp_c2s30
0.000	98.216	1.703	0.056	0.008	0.015	0.003	0.000	0.000	0.000	0.380	pg153_o3_native_lto.cx7a1_4g_gcp_c2s30
0.000	97.870	2.051	0.052	0.009	0.017	0.001	0.000	0.000	0.000	0.441	pg153_o3_native_lto.cx7a2_4g_gcp_c2s30
0.000	98.046	1.876	0.053	0.007	0.016	0.002	0.000	0.000	0.000	0.414	pg153_o3_native_lto.cx7a3_4g_gcp_c2s30
0.000	97.823	2.098	0.051	0.007	0.021	0.001	0.000	0.000	0.000	0.327	pg153_o3_native_lto.cx7a4_4g_gcp_c2s30
0.000	97.977	1.948	0.048	0.008	0.016	0.003	0.000	0.000	0.000	0.420	pg153_o3_native_lto.cx7a5_4g_gcp_c2s30
0.000	97.893	2.031	0.050	0.008	0.014	0.003	0.000	0.000	0.000	0.380	pg153_o3_native_lto.cx7a6_4g_gcp_c2s30
0.000	97.934	1.991	0.050	0.011	0.014	0.001	0.000	0.000	0.000	0.287	pg153_o3_native_lto.cx7a7_4g_gcp_c2s30
0.000	97.822	2.112	0.039	0.007	0.017	0.002	0.000	0.000	0.000	0.437	pg153_o3_native_lto.cx7a8_4g_gcp_c2s30
0.000	97.923	2.007	0.044	0.007	0.017	0.002	0.000	0.000	0.000	0.544	pg153_o3_native_lto.cx7a9_4g_gcp_c2s30
Delete response time histogram
0.000	sum:DBMS
0.000	pg153_o3_native_lto.cx7a_4g_gcp_c2s30
0.000	pg153_o3_native_lto.cx7a1_4g_gcp_c2s30
0.000	pg153_o3_native_lto.cx7a2_4g_gcp_c2s30
0.000	pg153_o3_native_lto.cx7a3_4g_gcp_c2s30
0.000	pg153_o3_native_lto.cx7a4_4g_gcp_c2s30
0.000	pg153_o3_native_lto.cx7a5_4g_gcp_c2s30
0.000	pg153_o3_native_lto.cx7a6_4g_gcp_c2s30
0.000	pg153_o3_native_lto.cx7a7_4g_gcp_c2s30
0.000	pg153_o3_native_lto.cx7a8_4g_gcp_c2s30
0.000	pg153_o3_native_lto.cx7a9_4g_gcp_c2s30
l.x
- l.x: create secondary indexes
- Legend for results is here.
- Each entry lists the percentage of responses that fit in that bucket (slower than max time for previous bucket, faster than min time for next bucket).
TODO - determine whether there is data for create index response time
l.i1
- l.i1: continue load after secondary indexes created
- Legend for results is here.
- Each entry lists the percentage of responses that fit in that bucket (slower than max time for previous bucket, faster than min time for next bucket).
Insert response time histogram
256us	1ms	4ms	16ms	64ms	256ms	1s	4s	16s	gt	max	tag
0.000	0.105	77.340	19.902	2.589	0.064	nonzero	0.000	0.000	0.000	0.265	pg153_o3_native_lto.cx7a_4g_gcp_c2s30
0.000	0.432	79.111	17.816	2.585	0.055	nonzero	0.000	0.000	0.000	0.318	pg153_o3_native_lto.cx7a1_4g_gcp_c2s30
0.000	0.034	58.730	36.248	4.987	0.001	nonzero	0.000	0.000	0.000	0.317	pg153_o3_native_lto.cx7a2_4g_gcp_c2s30
0.000	0.359	85.499	11.518	2.587	0.037	nonzero	0.000	0.000	0.000	0.412	pg153_o3_native_lto.cx7a3_4g_gcp_c2s30
0.000	0.200	79.256	17.852	2.636	0.057	nonzero	0.000	0.000	0.000	0.542	pg153_o3_native_lto.cx7a4_4g_gcp_c2s30
0.000	0.295	77.248	19.461	2.941	0.056	nonzero	0.000	0.000	0.000	0.416	pg153_o3_native_lto.cx7a5_4g_gcp_c2s30
0.000	nonzero	57.905	37.152	4.941	0.001	0.000	0.000	0.000	0.000	0.149	pg153_o3_native_lto.cx7a6_4g_gcp_c2s30
0.000	0.035	21.578	67.489	10.528	0.370	nonzero	0.000	0.000	0.000	0.344	pg153_o3_native_lto.cx7a7_4g_gcp_c2s30
0.000	0.954	81.087	16.131	1.779	0.049	nonzero	0.000	0.000	0.000	0.412	pg153_o3_native_lto.cx7a8_4g_gcp_c2s30
0.000	0.185	79.486	17.497	2.773	0.059	nonzero	0.000	0.000	0.000	0.410	pg153_o3_native_lto.cx7a9_4g_gcp_c2s30
Delete response time histogram
256us	1ms	4ms	16ms	64ms	256ms	1s	4s	16s	gt	max	tag
84.938	5.463	0.472	4.280	4.839	0.008	nonzero	0.000	0.000	0.000	0.362	pg153_o3_native_lto.cx7a_4g_gcp_c2s30
83.926	7.978	0.485	3.699	3.907	0.006	nonzero	0.000	0.000	0.000	0.318	pg153_o3_native_lto.cx7a1_4g_gcp_c2s30
76.415	8.542	0.612	9.466	4.963	0.002	0.001	0.000	0.000	0.000	0.658	pg153_o3_native_lto.cx7a2_4g_gcp_c2s30
87.094	5.267	0.506	3.406	3.725	0.002	nonzero	0.000	0.000	0.000	0.311	pg153_o3_native_lto.cx7a3_4g_gcp_c2s30
84.715	6.344	0.536	4.119	4.280	0.006	nonzero	0.000	0.000	0.000	0.773	pg153_o3_native_lto.cx7a4_4g_gcp_c2s30
84.371	6.175	0.480	4.512	4.455	0.007	nonzero	0.000	0.000	0.000	0.639	pg153_o3_native_lto.cx7a5_4g_gcp_c2s30
75.131	9.876	0.604	9.418	4.969	0.002	0.001	0.000	0.000	0.000	0.705	pg153_o3_native_lto.cx7a6_4g_gcp_c2s30
73.608	10.970	0.754	9.282	5.314	0.071	nonzero	0.000	0.000	0.000	0.527	pg153_o3_native_lto.cx7a7_4g_gcp_c2s30
84.456	6.130	0.626	4.416	4.362	0.010	nonzero	0.000	0.000	0.000	0.406	pg153_o3_native_lto.cx7a8_4g_gcp_c2s30
84.340	6.676	0.543	4.234	4.200	0.007	nonzero	0.000	0.000	0.000	0.816	pg153_o3_native_lto.cx7a9_4g_gcp_c2s30
q100.1
- q100.1: range queries with 100 insert/s per client
- Legend for results is here.
- Each entry lists the percentage of responses that fit in that bucket (slower than max time for previous bucket, faster than min time for next bucket).
Query response time histogram
256us	1ms	4ms	16ms	64ms	256ms	1s	4s	16s	gt	max	tag
99.975	0.024	0.001	nonzero	nonzero	nonzero	0.000	0.000	0.000	0.000	0.096	pg153_o3_native_lto.cx7a_4g_gcp_c2s30
99.977	0.021	0.001	nonzero	nonzero	nonzero	0.000	0.000	0.000	0.000	0.101	pg153_o3_native_lto.cx7a1_4g_gcp_c2s30
99.982	0.017	0.001	nonzero	nonzero	0.000	0.000	0.000	0.000	0.000	0.035	pg153_o3_native_lto.cx7a2_4g_gcp_c2s30
99.977	0.022	0.001	nonzero	nonzero	nonzero	0.000	0.000	0.000	0.000	0.118	pg153_o3_native_lto.cx7a3_4g_gcp_c2s30
99.976	0.024	0.001	nonzero	nonzero	nonzero	0.000	0.000	0.000	0.000	0.090	pg153_o3_native_lto.cx7a4_4g_gcp_c2s30
99.964	0.035	0.001	nonzero	nonzero	nonzero	0.000	0.000	0.000	0.000	0.118	pg153_o3_native_lto.cx7a5_4g_gcp_c2s30
99.976	0.023	0.001	nonzero	nonzero	0.000	0.000	0.000	0.000	0.000	0.030	pg153_o3_native_lto.cx7a6_4g_gcp_c2s30
99.976	0.023	0.001	nonzero	nonzero	nonzero	0.000	0.000	0.000	0.000	0.117	pg153_o3_native_lto.cx7a7_4g_gcp_c2s30
99.971	0.028	0.001	nonzero	nonzero	nonzero	0.000	0.000	0.000	0.000	0.113	pg153_o3_native_lto.cx7a8_4g_gcp_c2s30
99.974	0.025	0.001	nonzero	nonzero	0.000	0.000	0.000	0.000	0.000	0.033	pg153_o3_native_lto.cx7a9_4g_gcp_c2s30
Insert response time histogram
256us	1ms	4ms	16ms	64ms	256ms	1s	4s	16s	gt	max	tag
0.000	0.000	89.642	10.293	0.061	0.003	0.000	0.000	0.000	0.000	0.198	pg153_o3_native_lto.cx7a_4g_gcp_c2s30
0.000	0.000	87.000	12.965	0.033	0.002	0.000	0.000	0.000	0.000	0.086	pg153_o3_native_lto.cx7a1_4g_gcp_c2s30
0.000	0.000	86.845	13.132	0.023	0.000	0.000	0.000	0.000	0.000	0.029	pg153_o3_native_lto.cx7a2_4g_gcp_c2s30
0.000	0.000	94.882	5.036	0.082	0.000	0.000	0.000	0.000	0.000	0.063	pg153_o3_native_lto.cx7a3_4g_gcp_c2s30
0.000	0.000	88.656	11.210	0.125	0.009	0.000	0.000	0.000	0.000	0.070	pg153_o3_native_lto.cx7a4_4g_gcp_c2s30
0.000	0.000	87.530	12.266	0.189	0.016	0.000	0.000	0.000	0.000	0.078	pg153_o3_native_lto.cx7a5_4g_gcp_c2s30
0.000	0.000	87.248	12.734	0.017	0.000	0.000	0.000	0.000	0.000	0.024	pg153_o3_native_lto.cx7a6_4g_gcp_c2s30
0.000	0.000	81.030	18.917	0.047	0.007	0.000	0.000	0.000	0.000	0.110	pg153_o3_native_lto.cx7a7_4g_gcp_c2s30
0.000	0.000	91.283	8.642	0.075	0.000	0.000	0.000	0.000	0.000	0.062	pg153_o3_native_lto.cx7a8_4g_gcp_c2s30
0.000	0.000	79.087	20.866	0.045	0.002	0.000	0.000	0.000	0.000	0.068	pg153_o3_native_lto.cx7a9_4g_gcp_c2s30
Delete response time histogram
256us	1ms	4ms	16ms	64ms	256ms	1s	4s	16s	gt	max	tag
45.873	28.503	25.604	0.019	0.000	0.000	0.000	0.000	0.000	0.000	0.005	pg153_o3_native_lto.cx7a_4g_gcp_c2s30
57.085	35.726	7.186	0.003	0.000	0.000	0.000	0.000	0.000	0.000	0.005	pg153_o3_native_lto.cx7a1_4g_gcp_c2s30
51.016	37.236	11.743	0.005	0.000	0.000	0.000	0.000	0.000	0.000	0.009	pg153_o3_native_lto.cx7a2_4g_gcp_c2s30
57.101	35.493	7.398	0.009	0.000	0.000	0.000	0.000	0.000	0.000	0.007	pg153_o3_native_lto.cx7a3_4g_gcp_c2s30
50.047	32.670	17.259	0.023	0.002	0.000	0.000	0.000	0.000	0.000	0.019	pg153_o3_native_lto.cx7a4_4g_gcp_c2s30
59.564	20.957	19.436	0.043	0.000	0.000	0.000	0.000	0.000	0.000	0.010	pg153_o3_native_lto.cx7a5_4g_gcp_c2s30
57.698	26.828	15.469	0.005	0.000	0.000	0.000	0.000	0.000	0.000	0.005	pg153_o3_native_lto.cx7a6_4g_gcp_c2s30
72.269	25.080	2.651	0.000	0.000	0.000	0.000	0.000	0.000	0.000	0.004	pg153_o3_native_lto.cx7a7_4g_gcp_c2s30
47.757	35.340	16.889	0.014	0.000	0.000	0.000	0.000	0.000	0.000	0.010	pg153_o3_native_lto.cx7a8_4g_gcp_c2s30
51.316	37.835	10.847	0.000	0.002	0.000	0.000	0.000	0.000	0.000	0.018	pg153_o3_native_lto.cx7a9_4g_gcp_c2s30
q500.1
- q500.1: range queries with 500 insert/s per client
- Legend for results is here.
- Each entry lists the percentage of responses that fit in that bucket (slower than max time for previous bucket, faster than min time for next bucket).
Query response time histogram
256us	1ms	4ms	16ms	64ms	256ms	1s	4s	16s	gt	max	tag
99.896	0.095	0.006	0.001	0.001	nonzero	0.000	0.000	0.000	0.000	0.181	pg153_o3_native_lto.cx7a_4g_gcp_c2s30
99.899	0.089	0.012	0.001	nonzero	nonzero	0.000	0.000	0.000	0.000	0.132	pg153_o3_native_lto.cx7a1_4g_gcp_c2s30
99.917	0.078	0.005	nonzero	nonzero	0.000	0.000	0.000	0.000	0.000	0.025	pg153_o3_native_lto.cx7a2_4g_gcp_c2s30
99.970	0.023	0.007	nonzero	nonzero	0.000	0.000	0.000	0.000	0.000	0.049	pg153_o3_native_lto.cx7a3_4g_gcp_c2s30
99.957	0.038	0.005	nonzero	nonzero	0.000	0.000	0.000	0.000	0.000	0.024	pg153_o3_native_lto.cx7a4_4g_gcp_c2s30
99.913	0.081	0.005	0.001	0.001	nonzero	0.000	0.000	0.000	0.000	0.165	pg153_o3_native_lto.cx7a5_4g_gcp_c2s30
99.909	0.084	0.006	nonzero	nonzero	nonzero	0.000	0.000	0.000	0.000	0.160	pg153_o3_native_lto.cx7a6_4g_gcp_c2s30
99.888	0.101	0.007	0.002	0.002	nonzero	nonzero	0.000	0.000	0.000	0.261	pg153_o3_native_lto.cx7a7_4g_gcp_c2s30
99.909	0.085	0.005	0.001	nonzero	nonzero	0.000	0.000	0.000	0.000	0.149	pg153_o3_native_lto.cx7a8_4g_gcp_c2s30
99.950	0.044	0.005	nonzero	nonzero	0.000	0.000	0.000	0.000	0.000	0.019	pg153_o3_native_lto.cx7a9_4g_gcp_c2s30
Insert response time histogram
256us	1ms	4ms	16ms	64ms	256ms	1s	4s	16s	gt	max	tag
0.000	0.000	80.564	15.860	2.952	0.623	0.000	0.000	0.000	0.000	0.240	pg153_o3_native_lto.cx7a_4g_gcp_c2s30
0.000	0.000	86.271	12.376	1.226	0.127	0.000	0.000	0.000	0.000	0.166	pg153_o3_native_lto.cx7a1_4g_gcp_c2s30
0.000	0.000	88.978	10.942	0.080	0.000	0.000	0.000	0.000	0.000	0.034	pg153_o3_native_lto.cx7a2_4g_gcp_c2s30
0.000	0.000	99.269	0.641	0.090	0.000	0.000	0.000	0.000	0.000	0.063	pg153_o3_native_lto.cx7a3_4g_gcp_c2s30
0.000	0.000	95.003	4.906	0.085	0.005	0.000	0.000	0.000	0.000	0.139	pg153_o3_native_lto.cx7a4_4g_gcp_c2s30
0.000	0.000	84.408	13.524	1.898	0.170	0.000	0.000	0.000	0.000	0.202	pg153_o3_native_lto.cx7a5_4g_gcp_c2s30
0.000	0.000	87.409	11.674	0.860	0.057	0.000	0.000	0.000	0.000	0.193	pg153_o3_native_lto.cx7a6_4g_gcp_c2s30
0.000	0.000	71.635	22.765	4.684	0.914	0.002	0.000	0.000	0.000	0.263	pg153_o3_native_lto.cx7a7_4g_gcp_c2s30
0.000	0.000	86.328	12.644	0.991	0.037	0.000	0.000	0.000	0.000	0.189	pg153_o3_native_lto.cx7a8_4g_gcp_c2s30
0.000	0.000	95.183	4.786	0.030	nonzero	0.000	0.000	0.000	0.000	0.089	pg153_o3_native_lto.cx7a9_4g_gcp_c2s30
Delete response time histogram
256us	1ms	4ms	16ms	64ms	256ms	1s	4s	16s	gt	max	tag
78.041	2.368	2.790	16.405	0.324	0.073	0.000	0.000	0.000	0.000	0.182	pg153_o3_native_lto.cx7a_4g_gcp_c2s30
75.120	3.492	3.447	17.815	0.110	0.016	0.000	0.000	0.000	0.000	0.140	pg153_o3_native_lto.cx7a1_4g_gcp_c2s30
76.873	2.594	2.798	17.674	0.061	0.000	0.000	0.000	0.000	0.000	0.040	pg153_o3_native_lto.cx7a2_4g_gcp_c2s30
76.251	2.402	3.707	17.602	0.037	nonzero	0.000	0.000	0.000	0.000	0.087	pg153_o3_native_lto.cx7a3_4g_gcp_c2s30
76.136	2.731	4.589	16.461	0.082	0.000	0.000	0.000	0.000	0.000	0.050	pg153_o3_native_lto.cx7a4_4g_gcp_c2s30
78.003	3.293	4.807	13.760	0.123	0.014	0.000	0.000	0.000	0.000	0.148	pg153_o3_native_lto.cx7a5_4g_gcp_c2s30
76.174	2.855	2.688	18.192	0.090	0.001	0.000	0.000	0.000	0.000	0.139	pg153_o3_native_lto.cx7a6_4g_gcp_c2s30
74.116	2.873	4.918	17.515	0.447	0.131	0.000	0.000	0.000	0.000	0.213	pg153_o3_native_lto.cx7a7_4g_gcp_c2s30
76.984	2.677	3.004	17.217	0.111	0.006	0.000	0.000	0.000	0.000	0.116	pg153_o3_native_lto.cx7a8_4g_gcp_c2s30
75.901	2.701	3.032	18.288	0.077	0.000	0.000	0.000	0.000	0.000	0.055	pg153_o3_native_lto.cx7a9_4g_gcp_c2s30
q1000.1
- q1000.1: range queries with 1000 insert/s per client
- Legend for results is here.
- Each entry lists the percentage of responses that fit in that bucket (slower than max time for previous bucket, faster than min time for next bucket).
Query response time histogram
256us	1ms	4ms	16ms	64ms	256ms	1s	4s	16s	gt	max	tag
99.665	0.293	0.026	0.010	0.005	nonzero	0.000	0.000	0.000	0.000	0.234	pg153_o3_native_lto.cx7a_4g_gcp_c2s30
99.734	0.234	0.026	0.004	0.002	nonzero	0.000	0.000	0.000	0.000	0.137	pg153_o3_native_lto.cx7a1_4g_gcp_c2s30
99.720	0.259	0.018	0.003	0.001	nonzero	0.000	0.000	0.000	0.000	0.105	pg153_o3_native_lto.cx7a2_4g_gcp_c2s30
99.882	0.102	0.015	0.001	nonzero	nonzero	0.000	0.000	0.000	0.000	0.119	pg153_o3_native_lto.cx7a3_4g_gcp_c2s30
99.876	0.109	0.013	0.001	nonzero	nonzero	0.000	0.000	0.000	0.000	0.138	pg153_o3_native_lto.cx7a4_4g_gcp_c2s30
99.666	0.298	0.024	0.009	0.004	nonzero	0.000	0.000	0.000	0.000	0.154	pg153_o3_native_lto.cx7a5_4g_gcp_c2s30
99.663	0.293	0.025	0.011	0.007	nonzero	0.000	0.000	0.000	0.000	0.149	pg153_o3_native_lto.cx7a6_4g_gcp_c2s30
99.184	0.699	0.057	0.036	0.022	0.001	nonzero	0.000	0.000	0.000	0.318	pg153_o3_native_lto.cx7a7_4g_gcp_c2s30
99.674	0.296	0.022	0.006	0.002	nonzero	0.000	0.000	0.000	0.000	0.186	pg153_o3_native_lto.cx7a8_4g_gcp_c2s30
99.838	0.145	0.015	0.002	nonzero	nonzero	0.000	0.000	0.000	0.000	0.115	pg153_o3_native_lto.cx7a9_4g_gcp_c2s30
Insert response time histogram
256us	1ms	4ms	16ms	64ms	256ms	1s	4s	16s	gt	max	tag
0.000	0.000	79.094	16.534	3.960	0.411	0.001	0.000	0.000	0.000	0.318	pg153_o3_native_lto.cx7a_4g_gcp_c2s30
0.000	0.000	84.871	13.187	1.879	0.063	0.000	0.000	0.000	0.000	0.248	pg153_o3_native_lto.cx7a1_4g_gcp_c2s30
0.000	0.000	84.867	14.551	0.561	0.021	0.000	0.000	0.000	0.000	0.187	pg153_o3_native_lto.cx7a2_4g_gcp_c2s30
0.000	0.000	96.757	3.139	0.091	0.013	0.000	0.000	0.000	0.000	0.228	pg153_o3_native_lto.cx7a3_4g_gcp_c2s30
0.000	0.000	95.043	4.754	0.184	0.019	0.000	0.000	0.000	0.000	0.177	pg153_o3_native_lto.cx7a4_4g_gcp_c2s30
0.000	0.000	78.245	18.575	2.996	0.184	nonzero	0.000	0.000	0.000	0.274	pg153_o3_native_lto.cx7a5_4g_gcp_c2s30
0.000	0.000	80.966	16.832	2.072	0.130	0.000	0.000	0.000	0.000	0.218	pg153_o3_native_lto.cx7a6_4g_gcp_c2s30
0.000	0.000	49.766	39.472	9.538	1.216	0.007	0.000	0.000	0.000	0.542	pg153_o3_native_lto.cx7a7_4g_gcp_c2s30
0.000	0.000	80.743	17.240	1.926	0.091	nonzero	0.000	0.000	0.000	0.261	pg153_o3_native_lto.cx7a8_4g_gcp_c2s30
0.000	0.000	93.811	5.971	0.197	0.021	nonzero	0.000	0.000	0.000	0.270	pg153_o3_native_lto.cx7a9_4g_gcp_c2s30
Delete response time histogram
256us	1ms	4ms	16ms	64ms	256ms	1s	4s	16s	gt	max	tag
77.869	4.595	1.189	12.473	3.817	0.057	0.000	0.000	0.000	0.000	0.214	pg153_o3_native_lto.cx7a_4g_gcp_c2s30
76.688	4.132	2.862	13.133	3.177	0.008	0.000	0.000	0.000	0.000	0.197	pg153_o3_native_lto.cx7a1_4g_gcp_c2s30
77.764	4.240	1.864	12.709	3.419	0.003	0.000	0.000	0.000	0.000	0.109	pg153_o3_native_lto.cx7a2_4g_gcp_c2s30
78.280	3.116	2.635	13.047	2.921	nonzero	0.000	0.000	0.000	0.000	0.089	pg153_o3_native_lto.cx7a3_4g_gcp_c2s30
77.707	3.637	2.038	13.118	3.501	nonzero	0.000	0.000	0.000	0.000	0.070	pg153_o3_native_lto.cx7a4_4g_gcp_c2s30
76.095	4.767	2.557	11.837	4.717	0.027	0.000	0.000	0.000	0.000	0.156	pg153_o3_native_lto.cx7a5_4g_gcp_c2s30
77.805	4.337	2.312	12.829	2.710	0.009	0.000	0.000	0.000	0.000	0.171	pg153_o3_native_lto.cx7a6_4g_gcp_c2s30
75.959	4.299	4.481	11.657	3.480	0.123	nonzero	0.000	0.000	0.000	0.318	pg153_o3_native_lto.cx7a7_4g_gcp_c2s30
77.589	4.128	1.465	13.259	3.548	0.010	0.000	0.000	0.000	0.000	0.186	pg153_o3_native_lto.cx7a8_4g_gcp_c2s30
77.503	4.172	2.468	13.085	2.773	nonzero	0.000	0.000	0.000	0.000	0.075	pg153_o3_native_lto.cx7a9_4g_gcp_c2s30