Introduction
This is a report for the insert benchmark with 20M docs and 4 client(s). It is generated by scripts (bash, awk, sed) and Tufte might not be impressed. An overview of the insert benchmark is here and a short update is here. Below, by DBMS, I mean DBMS+version.config. An example is my8020.c10b40 where my means MySQL, 8020 is version 8.0.20 and c10b40 is the name for the configuration file.
The test server has 8 AMD cores, 16G RAM and an NVMe SSD. It is described here as the Beelink. The benchmark was run with 4 clients and there were 1 or 2 connections per client (1 for queries, 1 for inserts). The benchmark loads 20M rows without secondary indexes, creates secondary indexes, loads another 20M rows then does 3 read+write tests for one hour each that do queries as fast as possible with 100, 500 and then 1000 writes/second/client concurrent with the queries. There is 1 table. The database is cached by the storage engine and the only IO is for writes. Clients and the DBMS share one server. The per-database configs are in the per-database subdirectories here.
The tested DBMS are:
- my8031_rel_withdbg.cy9 - InnoDB and MySQL 8.0.31, the cy9 config and compiled with CMAKE_BUILD_TYPE=RelWitDebInfo -O2 -flto
- my8031_rel_o2.cy9 - InnoDB and MySQL 8.0.31, the cy9 config and compiled with CMAKE_BUILD_TYPE=Release -O2
- my8031_rel_native.cy9 - InnoDB and MySQL 8.0.31, the cy9 config and compiled with CMAKE_BUILD_TYPE=Release -O3 -march=native -mtune=native
- my8031_rel.cy9 - InnoDB and MySQL 8.0.31, the cy9 config and compiled with CMAKE_BUILD_TYPE=Release -O3
- my8031_rel_o2_lto.cy9 - InnoDB and MySQL 8.0.31, the cy9 config and compiled with CMAKE_BUILD_TYPE=Release -O2 -flto
- my8031_rel_native_lto.cy9 - InnoDB and MySQL 8.0.31, the cy9 config and compiled with CMAKE_BUILD_TYPE=Release -O3 -flto -march=native -mtune=native
- my8031_rel_lto.cy9 - InnoDB and MySQL 8.0.31, the cy9 config and compiled with CMAKE_BUILD_TYPE=Release -O3 -flto
Contents
- Summary
- l.i0: load without secondary indexes
- l.x: create secondary indexes
- l.i1: continue load after secondary indexes created
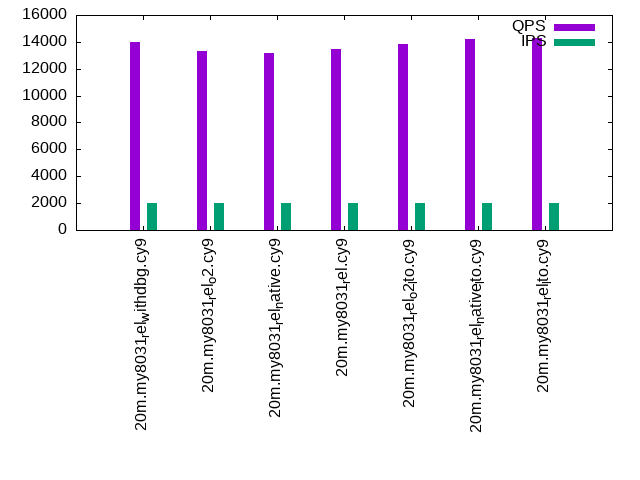
- q100.1: range queries with 100 insert/s per client
- q500.1: range queries with 500 insert/s per client
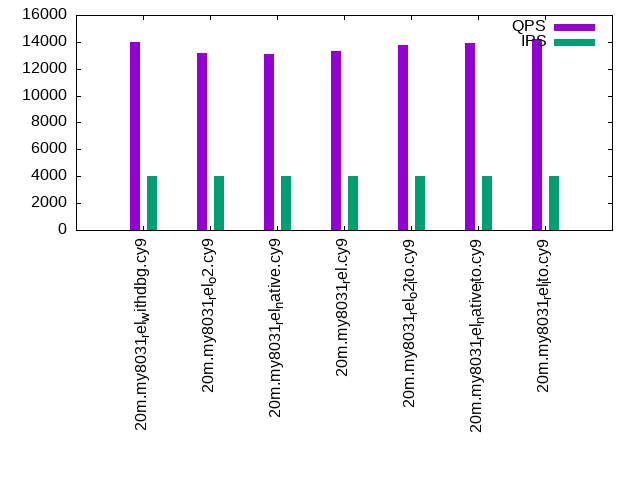
- q1000.1: range queries with 1000 insert/s per client
Summary
The numbers are inserts/s for l.i0 and l.i1, indexed docs (or rows) /s for l.x and queries/s for q*.2. The values are the average rate over the entire test for inserts (IPS) and queries (QPS). The range of values for IPS and QPS is split into 3 parts: bottom 25%, middle 50%, top 25%. Values in the bottom 25% have a red background, values in the top 25% have a green background and values in the middle have no color. A gray background is used for values that can be ignored because the DBMS did not sustain the target insert rate. Red backgrounds are not used when the minimum value is within 80% of the max value.
| dbms | l.i0 | l.x | l.i1 | q100.1 | q500.1 | q1000.1 |
|---|---|---|---|---|---|---|
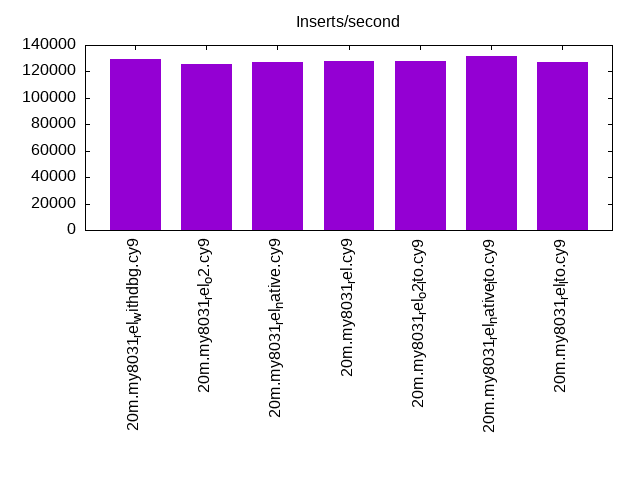
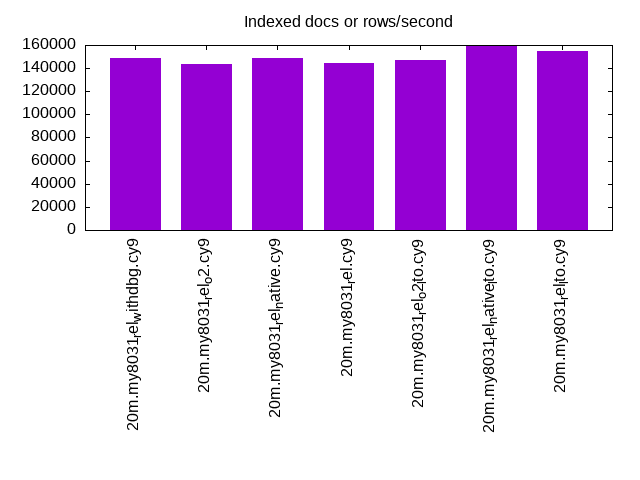
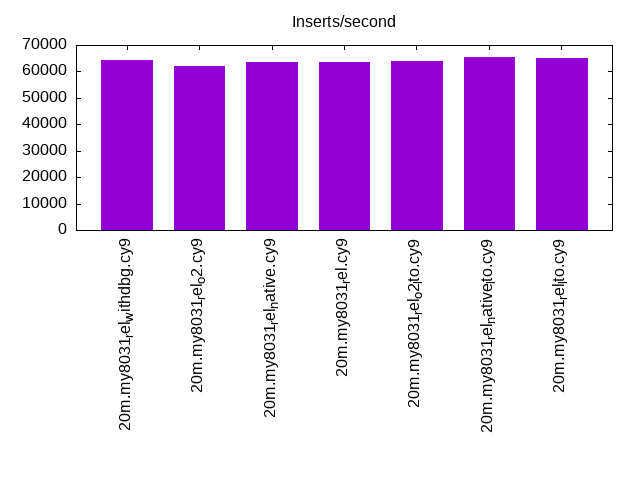
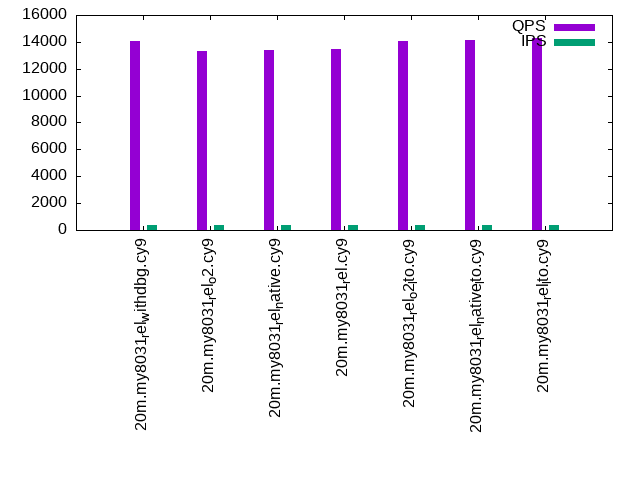
| 20m.my8031_rel_withdbg.cy9 | 129032 | 148889 | 64309 | 14101 | 14008 | 13975 |
| 20m.my8031_rel_o2.cy9 | 125786 | 143571 | 61920 | 13288 | 13337 | 13182 |
| 20m.my8031_rel_native.cy9 | 127388 | 148889 | 63492 | 13375 | 13183 | 13128 |
| 20m.my8031_rel.cy9 | 128205 | 144604 | 63694 | 13444 | 13445 | 13284 |
| 20m.my8031_rel_o2_lto.cy9 | 128205 | 146715 | 64102 | 14030 | 13873 | 13790 |
| 20m.my8031_rel_native_lto.cy9 | 131579 | 159524 | 65359 | 14173 | 14182 | 13910 |
| 20m.my8031_rel_lto.cy9 | 127388 | 154615 | 64935 | 14297 | 14310 | 14239 |
This table has relative throughput, throughput for the DBMS relative to the DBMS in the first line, using the absolute throughput from the previous table.
| dbms | l.i0 | l.x | l.i1 | q100.1 | q500.1 | q1000.1 |
|---|---|---|---|---|---|---|
| 20m.my8031_rel_withdbg.cy9 | 1.00 | 1.00 | 1.00 | 1.00 | 1.00 | 1.00 |
| 20m.my8031_rel_o2.cy9 | 0.97 | 0.96 | 0.96 | 0.94 | 0.95 | 0.94 |
| 20m.my8031_rel_native.cy9 | 0.99 | 1.00 | 0.99 | 0.95 | 0.94 | 0.94 |
| 20m.my8031_rel.cy9 | 0.99 | 0.97 | 0.99 | 0.95 | 0.96 | 0.95 |
| 20m.my8031_rel_o2_lto.cy9 | 0.99 | 0.99 | 1.00 | 0.99 | 0.99 | 0.99 |
| 20m.my8031_rel_native_lto.cy9 | 1.02 | 1.07 | 1.02 | 1.01 | 1.01 | 1.00 |
| 20m.my8031_rel_lto.cy9 | 0.99 | 1.04 | 1.01 | 1.01 | 1.02 | 1.02 |
This lists the average rate of inserts/s for the tests that do inserts concurrent with queries. For such tests the query rate is listed in the table above. The read+write tests are setup so that the insert rate should match the target rate every second. Cells that are not at least 95% of the target have a red background to indicate a failure to satisfy the target.
| dbms | q100.1 | q500.1 | q1000.1 |
|---|---|---|---|
| my8031_rel_withdbg.cy9 | 399 | 1994 | 3987 |
| my8031_rel_o2.cy9 | 399 | 1994 | 3989 |
| my8031_rel_native.cy9 | 399 | 1994 | 3989 |
| my8031_rel.cy9 | 399 | 1994 | 3989 |
| my8031_rel_o2_lto.cy9 | 399 | 1994 | 3989 |
| my8031_rel_native_lto.cy9 | 399 | 1993 | 3989 |
| my8031_rel_lto.cy9 | 399 | 1994 | 3989 |
| target | 400 | 2000 | 4000 |
l.i0
l.i0: load without secondary indexes. Graphs for performance per 1-second interval are here.
Average throughput:
Insert response time histogram: each cell has the percentage of responses that take <= the time in the header and max is the max response time in seconds. For the max column values in the top 25% of the range have a red background and in the bottom 25% of the range have a green background. The red background is not used when the min value is within 80% of the max value.
| dbms | 256us | 1ms | 4ms | 16ms | 64ms | 256ms | 1s | 4s | 16s | gt | max |
|---|---|---|---|---|---|---|---|---|---|---|---|
| my8031_rel_withdbg.cy9 | 97.903 | 1.121 | 0.962 | 0.013 | 0.133 | ||||||
| my8031_rel_o2.cy9 | 97.769 | 1.232 | 0.985 | 0.013 | 0.117 | ||||||
| my8031_rel_native.cy9 | 97.970 | 1.034 | 0.984 | 0.012 | 0.124 | ||||||
| my8031_rel.cy9 | 97.969 | 1.080 | 0.938 | 0.013 | 0.126 | ||||||
| my8031_rel_o2_lto.cy9 | 97.949 | 1.079 | 0.959 | 0.013 | 0.134 | ||||||
| my8031_rel_native_lto.cy9 | 98.024 | 1.011 | 0.951 | 0.013 | 0.119 | ||||||
| my8031_rel_lto.cy9 | 97.874 | 1.150 | 0.961 | 0.015 | 0.121 |
Performance metrics for the DBMS listed above. Some are normalized by throughput, others are not. Legend for results is here.
ips	qps	rps	rmbps	wps	wmbps	rpq	rkbpq	wpi	wkbpi	csps	cpups	cspq	cpupq	dbgb1	dbgb2	rss	maxop	p50	p99	tag
129032	0	0	0.0	454.3	51.9	0.000	0.000	0.004	0.412	13684	57.8	0.106	36	2.4	11.0	3.3	0.133	34663	7592	20m.my8031_rel_withdbg.cy9
125786	0	0	0.0	433.3	50.8	0.000	0.000	0.003	0.413	13314	58.3	0.106	37	2.4	11.0	3.3	0.117	33463	5494	20m.my8031_rel_o2.cy9
127388	0	0	0.0	437.8	51.4	0.000	0.000	0.003	0.413	13573	58.0	0.107	36	2.4	10.9	3.3	0.124	34177	26781	20m.my8031_rel_native.cy9
128205	0	0	0.0	446.2	51.6	0.000	0.000	0.003	0.412	13652	58.0	0.106	36	2.4	10.9	3.3	0.126	34562	29367	20m.my8031_rel.cy9
128205	0	0	0.0	448.3	51.8	0.000	0.000	0.003	0.414	13551	57.9	0.106	36	2.4	11.0	3.3	0.134	34462	28668	20m.my8031_rel_o2_lto.cy9
131579	0	0	0.0	447.9	52.9	0.000	0.000	0.003	0.411	13865	58.3	0.105	35	2.4	10.9	3.3	0.119	35376	28369	20m.my8031_rel_native_lto.cy9
127388	0	0	0.0	445.8	51.8	0.000	0.000	0.003	0.417	13647	58.1	0.107	36	2.4	11.0	3.3	0.121	34562	27070	20m.my8031_rel_lto.cy9
l.x
l.x: create secondary indexes.
Average throughput:
Performance metrics for the DBMS listed above. Some are normalized by throughput, others are not. Legend for results is here.
ips	qps	rps	rmbps	wps	wmbps	rpq	rkbpq	wpi	wkbpi	csps	cpups	cspq	cpupq	dbgb1	dbgb2	rss	maxop	p50	p99	tag
148889	0	768	51.4	2996.9	154.4	0.005	0.353	0.020	1.062	10809	42.1	0.073	23	4.0	12.6	4.7	0.011	NA	NA	20m.my8031_rel_withdbg.cy9
143571	0	768	51.3	2045.7	140.8	0.005	0.366	0.014	1.004	8927	44.1	0.062	25	4.0	12.6	4.7	0.012	NA	NA	20m.my8031_rel_o2.cy9
148889	0	797	53.4	2108.4	145.2	0.005	0.367	0.014	0.999	9212	43.8	0.062	24	4.0	12.6	4.6	0.016	NA	NA	20m.my8031_rel_native.cy9
144604	0	768	51.4	2052.2	139.8	0.005	0.364	0.014	0.990	8825	43.9	0.061	24	4.0	12.6	4.6	0.019	NA	NA	20m.my8031_rel.cy9
146715	0	768	51.4	2665.7	149.8	0.005	0.358	0.018	1.046	10088	43.5	0.069	24	4.0	12.6	4.6	0.014	NA	NA	20m.my8031_rel_o2_lto.cy9
159524	0	830	55.5	3115.0	166.3	0.005	0.356	0.020	1.068	11364	42.6	0.071	21	4.0	12.6	4.5	0.017	NA	NA	20m.my8031_rel_native_lto.cy9
154615	0	798	53.4	3133.5	161.3	0.005	0.353	0.020	1.068	11214	43.4	0.073	22	4.0	12.6	4.6	0.018	NA	NA	20m.my8031_rel_lto.cy9
l.i1
l.i1: continue load after secondary indexes created. Graphs for performance per 1-second interval are here.
Average throughput:
Insert response time histogram: each cell has the percentage of responses that take <= the time in the header and max is the max response time in seconds. For the max column values in the top 25% of the range have a red background and in the bottom 25% of the range have a green background. The red background is not used when the min value is within 80% of the max value.
| dbms | 256us | 1ms | 4ms | 16ms | 64ms | 256ms | 1s | 4s | 16s | gt | max |
|---|---|---|---|---|---|---|---|---|---|---|---|
| my8031_rel_withdbg.cy9 | 96.762 | 2.295 | 0.931 | 0.012 | 0.104 | ||||||
| my8031_rel_o2.cy9 | 96.590 | 2.473 | 0.919 | 0.018 | 0.104 | ||||||
| my8031_rel_native.cy9 | 96.785 | 2.323 | 0.871 | 0.021 | 0.104 | ||||||
| my8031_rel.cy9 | 96.739 | 2.333 | 0.896 | 0.032 | 0.104 | ||||||
| my8031_rel_o2_lto.cy9 | 96.742 | 2.353 | 0.890 | 0.015 | 0.104 | ||||||
| my8031_rel_native_lto.cy9 | 96.827 | 2.266 | 0.885 | 0.022 | 0.104 | ||||||
| my8031_rel_lto.cy9 | 96.805 | 2.267 | 0.909 | 0.020 | 0.104 |
Performance metrics for the DBMS listed above. Some are normalized by throughput, others are not. Legend for results is here.
ips	qps	rps	rmbps	wps	wmbps	rpq	rkbpq	wpi	wkbpi	csps	cpups	cspq	cpupq	dbgb1	dbgb2	rss	maxop	p50	p99	tag
64309	0	297	4.6	1850.7	94.0	0.005	0.074	0.029	1.496	19028	55.5	0.296	69	10.1	18.7	10.0	0.104	16981	849	20m.my8031_rel_withdbg.cy9
61920	0	288	4.5	1832.3	91.7	0.005	0.074	0.030	1.516	18277	54.5	0.295	70	10.1	18.7	10.0	0.104	16282	849	20m.my8031_rel_o2.cy9
63492	0	297	4.6	1850.2	93.1	0.005	0.075	0.029	1.501	18863	55.5	0.297	70	10.1	18.7	10.0	0.104	16781	849	20m.my8031_rel_native.cy9
63694	0	297	4.6	1844.2	92.8	0.005	0.075	0.029	1.491	18908	55.4	0.297	70	10.1	18.7	10.0	0.104	16682	799	20m.my8031_rel.cy9
64102	0	297	4.6	1855.1	93.9	0.005	0.074	0.029	1.500	18984	55.7	0.296	70	10.1	18.7	10.0	0.104	16788	849	20m.my8031_rel_o2_lto.cy9
65359	0	302	4.7	1865.3	95.2	0.005	0.074	0.029	1.492	19235	55.4	0.294	68	10.1	18.7	10.0	0.104	17130	849	20m.my8031_rel_native_lto.cy9
64935	0	302	4.7	1850.1	93.9	0.005	0.074	0.028	1.481	19226	55.4	0.296	68	10.1	18.7	10.0	0.104	16988	850	20m.my8031_rel_lto.cy9
q100.1
q100.1: range queries with 100 insert/s per client. Graphs for performance per 1-second interval are here.
Average throughput:
Query response time histogram: each cell has the percentage of responses that take <= the time in the header and max is the max response time in seconds. For max values in the top 25% of the range have a red background and in the bottom 25% of the range have a green background. The red background is not used when the min value is within 80% of the max value.
| dbms | 256us | 1ms | 4ms | 16ms | 64ms | 256ms | 1s | 4s | 16s | gt | max |
|---|---|---|---|---|---|---|---|---|---|---|---|
| my8031_rel_withdbg.cy9 | 50.262 | 49.732 | 0.005 | 0.001 | nonzero | 0.021 | |||||
| my8031_rel_o2.cy9 | 41.726 | 58.268 | 0.006 | 0.001 | nonzero | 0.024 | |||||
| my8031_rel_native.cy9 | 42.794 | 57.200 | 0.005 | 0.001 | nonzero | 0.024 | |||||
| my8031_rel.cy9 | 43.274 | 56.720 | 0.005 | 0.001 | nonzero | 0.022 | |||||
| my8031_rel_o2_lto.cy9 | 49.142 | 50.852 | 0.005 | 0.001 | nonzero | 0.022 | |||||
| my8031_rel_native_lto.cy9 | 51.317 | 48.677 | 0.005 | 0.001 | nonzero | 0.022 | |||||
| my8031_rel_lto.cy9 | 52.909 | 47.085 | 0.006 | 0.001 | nonzero | 0.023 |
Insert response time histogram: each cell has the percentage of responses that take <= the time in the header and max is the max response time in seconds. For max values in the top 25% of the range have a red background and in the bottom 25% of the range have a green background. The red background is not used when the min value is within 80% of the max value.
| dbms | 256us | 1ms | 4ms | 16ms | 64ms | 256ms | 1s | 4s | 16s | gt | max |
|---|---|---|---|---|---|---|---|---|---|---|---|
| my8031_rel_withdbg.cy9 | 98.028 | 1.257 | 0.715 | 0.033 | |||||||
| my8031_rel_o2.cy9 | 97.951 | 1.250 | 0.799 | 0.028 | |||||||
| my8031_rel_native.cy9 | 98.493 | 0.840 | 0.667 | 0.028 | |||||||
| my8031_rel.cy9 | 97.986 | 1.403 | 0.611 | 0.025 | |||||||
| my8031_rel_o2_lto.cy9 | 98.174 | 0.993 | 0.833 | 0.029 | |||||||
| my8031_rel_native_lto.cy9 | 98.479 | 0.819 | 0.701 | 0.030 | |||||||
| my8031_rel_lto.cy9 | 98.021 | 1.243 | 0.736 | 0.029 |
Performance metrics for the DBMS listed above. Some are normalized by throughput, others are not. Legend for results is here.
ips	qps	rps	rmbps	wps	wmbps	rpq	rkbpq	wpi	wkbpi	csps	cpups	cspq	cpupq	dbgb1	dbgb2	rss	maxop	p50	p99	tag
399	14101	0	0.0	234.6	6.1	0.000	0.000	0.588	15.729	54571	50.1	3.870	284	10.5	19.1	10.3	0.021	3581	2893	20m.my8031_rel_withdbg.cy9
399	13288	0	0.0	237.8	6.2	0.000	0.000	0.596	15.975	51497	50.1	3.875	302	10.5	19.1	10.3	0.024	3324	2717	20m.my8031_rel_o2.cy9
399	13375	0	0.0	235.5	6.2	0.000	0.000	0.591	15.801	51827	50.0	3.875	299	10.5	19.1	10.3	0.024	3356	2733	20m.my8031_rel_native.cy9
399	13444	0	0.0	240.7	6.3	0.000	0.000	0.604	16.117	52092	50.1	3.875	298	10.5	19.1	10.3	0.022	3388	2797	20m.my8031_rel.cy9
399	14030	0	0.0	239.5	6.3	0.000	0.000	0.601	16.081	54309	50.1	3.871	286	10.5	19.1	10.3	0.022	3580	2925	20m.my8031_rel_o2_lto.cy9
399	14173	0	0.0	233.5	6.1	0.000	0.000	0.585	15.657	54856	50.0	3.870	282	10.5	19.1	10.3	0.022	3614	2941	20m.my8031_rel_native_lto.cy9
399	14297	0	0.0	238.4	6.2	0.000	0.000	0.598	16.001	55278	50.2	3.866	281	10.5	19.1	10.3	0.023	3630	2893	20m.my8031_rel_lto.cy9
q500.1
q500.1: range queries with 500 insert/s per client. Graphs for performance per 1-second interval are here.
Average throughput:
Query response time histogram: each cell has the percentage of responses that take <= the time in the header and max is the max response time in seconds. For max values in the top 25% of the range have a red background and in the bottom 25% of the range have a green background. The red background is not used when the min value is within 80% of the max value.
| dbms | 256us | 1ms | 4ms | 16ms | 64ms | 256ms | 1s | 4s | 16s | gt | max |
|---|---|---|---|---|---|---|---|---|---|---|---|
| my8031_rel_withdbg.cy9 | 48.783 | 51.197 | 0.017 | 0.003 | nonzero | 0.040 | |||||
| my8031_rel_o2.cy9 | 41.970 | 58.010 | 0.017 | 0.003 | nonzero | 0.023 | |||||
| my8031_rel_native.cy9 | 39.827 | 60.152 | 0.018 | 0.003 | nonzero | 0.027 | |||||
| my8031_rel.cy9 | 43.082 | 56.898 | 0.017 | 0.003 | 0.001 | 0.025 | |||||
| my8031_rel_o2_lto.cy9 | 46.955 | 53.026 | 0.015 | 0.003 | 0.001 | 0.026 | |||||
| my8031_rel_native_lto.cy9 | 51.351 | 48.630 | 0.017 | 0.002 | nonzero | 0.022 | |||||
| my8031_rel_lto.cy9 | 52.435 | 47.546 | 0.016 | 0.002 | 0.001 | 0.022 |
Insert response time histogram: each cell has the percentage of responses that take <= the time in the header and max is the max response time in seconds. For max values in the top 25% of the range have a red background and in the bottom 25% of the range have a green background. The red background is not used when the min value is within 80% of the max value.
| dbms | 256us | 1ms | 4ms | 16ms | 64ms | 256ms | 1s | 4s | 16s | gt | max |
|---|---|---|---|---|---|---|---|---|---|---|---|
| my8031_rel_withdbg.cy9 | 94.340 | 4.881 | 0.722 | 0.057 | 0.108 | ||||||
| my8031_rel_o2.cy9 | 95.211 | 4.135 | 0.636 | 0.018 | 0.105 | ||||||
| my8031_rel_native.cy9 | 95.138 | 4.125 | 0.714 | 0.024 | 0.107 | ||||||
| my8031_rel.cy9 | 95.033 | 4.311 | 0.618 | 0.037 | 0.107 | ||||||
| my8031_rel_o2_lto.cy9 | 93.094 | 5.961 | 0.921 | 0.024 | 0.104 | ||||||
| my8031_rel_native_lto.cy9 | 97.493 | 2.056 | 0.438 | 0.014 | 0.103 | ||||||
| my8031_rel_lto.cy9 | 96.001 | 3.360 | 0.615 | 0.024 | 0.105 |
Performance metrics for the DBMS listed above. Some are normalized by throughput, others are not. Legend for results is here.
ips	qps	rps	rmbps	wps	wmbps	rpq	rkbpq	wpi	wkbpi	csps	cpups	cspq	cpupq	dbgb1	dbgb2	rss	maxop	p50	p99	tag
1994	14008	0	0.0	226.9	6.9	0.000	0.000	0.114	3.525	53666	51.2	3.831	292	11.4	20.0	11.0	0.040	3484	2861	20m.my8031_rel_withdbg.cy9
1994	13337	0	0.0	221.0	6.7	0.000	0.000	0.111	3.436	51145	51.2	3.835	307	11.4	20.0	11.0	0.023	3294	2733	20m.my8031_rel_o2.cy9
1994	13183	0	0.0	223.9	6.8	0.000	0.000	0.112	3.469	50564	51.1	3.835	310	11.4	19.9	11.0	0.027	3356	2751	20m.my8031_rel_native.cy9
1994	13445	0	0.0	222.0	6.7	0.000	0.000	0.111	3.455	51553	51.2	3.834	305	11.4	19.9	10.9	0.025	3340	2749	20m.my8031_rel.cy9
1994	13873	0	0.0	226.0	6.8	0.000	0.000	0.113	3.509	53118	51.2	3.829	295	11.4	20.0	11.0	0.026	3484	2878	20m.my8031_rel_o2_lto.cy9
1993	14182	0	0.0	221.3	6.7	0.000	0.000	0.111	3.423	54456	51.0	3.840	288	11.3	19.9	10.9	0.022	3582	2942	20m.my8031_rel_native_lto.cy9
1994	14310	0	0.0	221.7	6.7	0.000	0.000	0.111	3.437	54860	51.1	3.834	286	11.4	20.0	11.0	0.022	3628	2925	20m.my8031_rel_lto.cy9
q1000.1
q1000.1: range queries with 1000 insert/s per client. Graphs for performance per 1-second interval are here.
Average throughput:
Query response time histogram: each cell has the percentage of responses that take <= the time in the header and max is the max response time in seconds. For max values in the top 25% of the range have a red background and in the bottom 25% of the range have a green background. The red background is not used when the min value is within 80% of the max value.
| dbms | 256us | 1ms | 4ms | 16ms | 64ms | 256ms | 1s | 4s | 16s | gt | max |
|---|---|---|---|---|---|---|---|---|---|---|---|
| my8031_rel_withdbg.cy9 | 47.832 | 52.127 | 0.035 | 0.005 | 0.001 | 0.026 | |||||
| my8031_rel_o2.cy9 | 38.850 | 61.108 | 0.036 | 0.006 | 0.001 | 0.026 | |||||
| my8031_rel_native.cy9 | 38.215 | 61.738 | 0.041 | 0.005 | 0.001 | 0.028 | |||||
| my8031_rel.cy9 | 40.074 | 59.885 | 0.035 | 0.005 | nonzero | 0.022 | |||||
| my8031_rel_o2_lto.cy9 | 45.676 | 54.283 | 0.035 | 0.005 | 0.001 | 0.024 | |||||
| my8031_rel_native_lto.cy9 | 47.252 | 52.713 | 0.030 | 0.005 | 0.001 | 0.025 | |||||
| my8031_rel_lto.cy9 | 51.353 | 48.606 | 0.035 | 0.005 | nonzero | 0.023 |
Insert response time histogram: each cell has the percentage of responses that take <= the time in the header and max is the max response time in seconds. For max values in the top 25% of the range have a red background and in the bottom 25% of the range have a green background. The red background is not used when the min value is within 80% of the max value.
| dbms | 256us | 1ms | 4ms | 16ms | 64ms | 256ms | 1s | 4s | 16s | gt | max |
|---|---|---|---|---|---|---|---|---|---|---|---|
| my8031_rel_withdbg.cy9 | 96.638 | 2.950 | 0.401 | 0.010 | 0.106 | ||||||
| my8031_rel_o2.cy9 | 94.281 | 5.258 | 0.438 | 0.024 | 0.108 | ||||||
| my8031_rel_native.cy9 | 96.524 | 3.112 | 0.358 | 0.006 | 0.106 | ||||||
| my8031_rel.cy9 | 95.424 | 4.120 | 0.420 | 0.036 | 0.112 | ||||||
| my8031_rel_o2_lto.cy9 | 95.917 | 3.740 | 0.333 | 0.010 | 0.105 | ||||||
| my8031_rel_native_lto.cy9 | 93.794 | 5.615 | 0.572 | 0.019 | 0.107 | ||||||
| my8031_rel_lto.cy9 | 96.752 | 2.896 | 0.342 | 0.010 | 0.105 |
Performance metrics for the DBMS listed above. Some are normalized by throughput, others are not. Legend for results is here.
ips	qps	rps	rmbps	wps	wmbps	rpq	rkbpq	wpi	wkbpi	csps	cpups	cspq	cpupq	dbgb1	dbgb2	rss	maxop	p50	p99	tag
3987	13975	1	0.0	389.7	11.8	0.000	0.002	0.098	3.029	53167	52.6	3.804	301	12.7	21.3	11.1	0.026	3468	2877	20m.my8031_rel_withdbg.cy9
3989	13182	2	0.0	394.5	11.9	0.000	0.002	0.099	3.065	50070	52.6	3.798	319	12.8	21.3	11.1	0.026	3308	2717	20m.my8031_rel_o2.cy9
3989	13128	1	0.0	383.9	11.6	0.000	0.002	0.096	2.983	50038	52.5	3.812	320	12.7	21.3	11.1	0.028	3244	2733	20m.my8031_rel_native.cy9
3989	13284	1	0.0	396.8	12.0	0.000	0.002	0.099	3.077	50528	52.7	3.804	317	12.7	21.3	11.1	0.022	3278	2797	20m.my8031_rel.cy9
3989	13790	1	0.0	386.8	11.7	0.000	0.002	0.097	3.004	52421	52.7	3.801	306	12.7	21.3	11.1	0.024	3404	2845	20m.my8031_rel_o2_lto.cy9
3989	13910	2	0.0	395.2	12.0	0.000	0.002	0.099	3.080	52858	52.6	3.800	303	12.8	21.3	11.1	0.025	3454	2893	20m.my8031_rel_native_lto.cy9
3989	14239	1	0.0	386.9	11.7	0.000	0.002	0.097	3.006	54234	52.6	3.809	296	12.7	21.3	11.1	0.023	3580	2973	20m.my8031_rel_lto.cy9
l.i0
l.i0: load without secondary indexes
Performance metrics for all DBMS, not just the ones listed above. Some are normalized by throughput, others are not. Legend for results is here.
ips	qps	rps	rmbps	wps	wmbps	rpq	rkbpq	wpi	wkbpi	csps	cpups	cspq	cpupq	dbgb1	dbgb2	rss	maxop	p50	p99	tag
129032	0	0	0.0	454.3	51.9	0.000	0.000	0.004	0.412	13684	57.8	0.106	36	2.4	11.0	3.3	0.133	34663	7592	20m.my8031_rel_withdbg.cy9
125786	0	0	0.0	433.3	50.8	0.000	0.000	0.003	0.413	13314	58.3	0.106	37	2.4	11.0	3.3	0.117	33463	5494	20m.my8031_rel_o2.cy9
127388	0	0	0.0	437.8	51.4	0.000	0.000	0.003	0.413	13573	58.0	0.107	36	2.4	10.9	3.3	0.124	34177	26781	20m.my8031_rel_native.cy9
128205	0	0	0.0	446.2	51.6	0.000	0.000	0.003	0.412	13652	58.0	0.106	36	2.4	10.9	3.3	0.126	34562	29367	20m.my8031_rel.cy9
128205	0	0	0.0	448.3	51.8	0.000	0.000	0.003	0.414	13551	57.9	0.106	36	2.4	11.0	3.3	0.134	34462	28668	20m.my8031_rel_o2_lto.cy9
131579	0	0	0.0	447.9	52.9	0.000	0.000	0.003	0.411	13865	58.3	0.105	35	2.4	10.9	3.3	0.119	35376	28369	20m.my8031_rel_native_lto.cy9
127388	0	0	0.0	445.8	51.8	0.000	0.000	0.003	0.417	13647	58.1	0.107	36	2.4	11.0	3.3	0.121	34562	27070	20m.my8031_rel_lto.cy9
l.x
l.x: create secondary indexes
Performance metrics for all DBMS, not just the ones listed above. Some are normalized by throughput, others are not. Legend for results is here.
ips	qps	rps	rmbps	wps	wmbps	rpq	rkbpq	wpi	wkbpi	csps	cpups	cspq	cpupq	dbgb1	dbgb2	rss	maxop	p50	p99	tag
148889	0	768	51.4	2996.9	154.4	0.005	0.353	0.020	1.062	10809	42.1	0.073	23	4.0	12.6	4.7	0.011	NA	NA	20m.my8031_rel_withdbg.cy9
143571	0	768	51.3	2045.7	140.8	0.005	0.366	0.014	1.004	8927	44.1	0.062	25	4.0	12.6	4.7	0.012	NA	NA	20m.my8031_rel_o2.cy9
148889	0	797	53.4	2108.4	145.2	0.005	0.367	0.014	0.999	9212	43.8	0.062	24	4.0	12.6	4.6	0.016	NA	NA	20m.my8031_rel_native.cy9
144604	0	768	51.4	2052.2	139.8	0.005	0.364	0.014	0.990	8825	43.9	0.061	24	4.0	12.6	4.6	0.019	NA	NA	20m.my8031_rel.cy9
146715	0	768	51.4	2665.7	149.8	0.005	0.358	0.018	1.046	10088	43.5	0.069	24	4.0	12.6	4.6	0.014	NA	NA	20m.my8031_rel_o2_lto.cy9
159524	0	830	55.5	3115.0	166.3	0.005	0.356	0.020	1.068	11364	42.6	0.071	21	4.0	12.6	4.5	0.017	NA	NA	20m.my8031_rel_native_lto.cy9
154615	0	798	53.4	3133.5	161.3	0.005	0.353	0.020	1.068	11214	43.4	0.073	22	4.0	12.6	4.6	0.018	NA	NA	20m.my8031_rel_lto.cy9
l.i1
l.i1: continue load after secondary indexes created
Performance metrics for all DBMS, not just the ones listed above. Some are normalized by throughput, others are not. Legend for results is here.
ips	qps	rps	rmbps	wps	wmbps	rpq	rkbpq	wpi	wkbpi	csps	cpups	cspq	cpupq	dbgb1	dbgb2	rss	maxop	p50	p99	tag
64309	0	297	4.6	1850.7	94.0	0.005	0.074	0.029	1.496	19028	55.5	0.296	69	10.1	18.7	10.0	0.104	16981	849	20m.my8031_rel_withdbg.cy9
61920	0	288	4.5	1832.3	91.7	0.005	0.074	0.030	1.516	18277	54.5	0.295	70	10.1	18.7	10.0	0.104	16282	849	20m.my8031_rel_o2.cy9
63492	0	297	4.6	1850.2	93.1	0.005	0.075	0.029	1.501	18863	55.5	0.297	70	10.1	18.7	10.0	0.104	16781	849	20m.my8031_rel_native.cy9
63694	0	297	4.6	1844.2	92.8	0.005	0.075	0.029	1.491	18908	55.4	0.297	70	10.1	18.7	10.0	0.104	16682	799	20m.my8031_rel.cy9
64102	0	297	4.6	1855.1	93.9	0.005	0.074	0.029	1.500	18984	55.7	0.296	70	10.1	18.7	10.0	0.104	16788	849	20m.my8031_rel_o2_lto.cy9
65359	0	302	4.7	1865.3	95.2	0.005	0.074	0.029	1.492	19235	55.4	0.294	68	10.1	18.7	10.0	0.104	17130	849	20m.my8031_rel_native_lto.cy9
64935	0	302	4.7	1850.1	93.9	0.005	0.074	0.028	1.481	19226	55.4	0.296	68	10.1	18.7	10.0	0.104	16988	850	20m.my8031_rel_lto.cy9
q100.1
q100.1: range queries with 100 insert/s per client
Performance metrics for all DBMS, not just the ones listed above. Some are normalized by throughput, others are not. Legend for results is here.
ips	qps	rps	rmbps	wps	wmbps	rpq	rkbpq	wpi	wkbpi	csps	cpups	cspq	cpupq	dbgb1	dbgb2	rss	maxop	p50	p99	tag
399	14101	0	0.0	234.6	6.1	0.000	0.000	0.588	15.729	54571	50.1	3.870	284	10.5	19.1	10.3	0.021	3581	2893	20m.my8031_rel_withdbg.cy9
399	13288	0	0.0	237.8	6.2	0.000	0.000	0.596	15.975	51497	50.1	3.875	302	10.5	19.1	10.3	0.024	3324	2717	20m.my8031_rel_o2.cy9
399	13375	0	0.0	235.5	6.2	0.000	0.000	0.591	15.801	51827	50.0	3.875	299	10.5	19.1	10.3	0.024	3356	2733	20m.my8031_rel_native.cy9
399	13444	0	0.0	240.7	6.3	0.000	0.000	0.604	16.117	52092	50.1	3.875	298	10.5	19.1	10.3	0.022	3388	2797	20m.my8031_rel.cy9
399	14030	0	0.0	239.5	6.3	0.000	0.000	0.601	16.081	54309	50.1	3.871	286	10.5	19.1	10.3	0.022	3580	2925	20m.my8031_rel_o2_lto.cy9
399	14173	0	0.0	233.5	6.1	0.000	0.000	0.585	15.657	54856	50.0	3.870	282	10.5	19.1	10.3	0.022	3614	2941	20m.my8031_rel_native_lto.cy9
399	14297	0	0.0	238.4	6.2	0.000	0.000	0.598	16.001	55278	50.2	3.866	281	10.5	19.1	10.3	0.023	3630	2893	20m.my8031_rel_lto.cy9
q500.1
q500.1: range queries with 500 insert/s per client
Performance metrics for all DBMS, not just the ones listed above. Some are normalized by throughput, others are not. Legend for results is here.
ips	qps	rps	rmbps	wps	wmbps	rpq	rkbpq	wpi	wkbpi	csps	cpups	cspq	cpupq	dbgb1	dbgb2	rss	maxop	p50	p99	tag
1994	14008	0	0.0	226.9	6.9	0.000	0.000	0.114	3.525	53666	51.2	3.831	292	11.4	20.0	11.0	0.040	3484	2861	20m.my8031_rel_withdbg.cy9
1994	13337	0	0.0	221.0	6.7	0.000	0.000	0.111	3.436	51145	51.2	3.835	307	11.4	20.0	11.0	0.023	3294	2733	20m.my8031_rel_o2.cy9
1994	13183	0	0.0	223.9	6.8	0.000	0.000	0.112	3.469	50564	51.1	3.835	310	11.4	19.9	11.0	0.027	3356	2751	20m.my8031_rel_native.cy9
1994	13445	0	0.0	222.0	6.7	0.000	0.000	0.111	3.455	51553	51.2	3.834	305	11.4	19.9	10.9	0.025	3340	2749	20m.my8031_rel.cy9
1994	13873	0	0.0	226.0	6.8	0.000	0.000	0.113	3.509	53118	51.2	3.829	295	11.4	20.0	11.0	0.026	3484	2878	20m.my8031_rel_o2_lto.cy9
1993	14182	0	0.0	221.3	6.7	0.000	0.000	0.111	3.423	54456	51.0	3.840	288	11.3	19.9	10.9	0.022	3582	2942	20m.my8031_rel_native_lto.cy9
1994	14310	0	0.0	221.7	6.7	0.000	0.000	0.111	3.437	54860	51.1	3.834	286	11.4	20.0	11.0	0.022	3628	2925	20m.my8031_rel_lto.cy9
q1000.1
q1000.1: range queries with 1000 insert/s per client
Performance metrics for all DBMS, not just the ones listed above. Some are normalized by throughput, others are not. Legend for results is here.
ips	qps	rps	rmbps	wps	wmbps	rpq	rkbpq	wpi	wkbpi	csps	cpups	cspq	cpupq	dbgb1	dbgb2	rss	maxop	p50	p99	tag
3987	13975	1	0.0	389.7	11.8	0.000	0.002	0.098	3.029	53167	52.6	3.804	301	12.7	21.3	11.1	0.026	3468	2877	20m.my8031_rel_withdbg.cy9
3989	13182	2	0.0	394.5	11.9	0.000	0.002	0.099	3.065	50070	52.6	3.798	319	12.8	21.3	11.1	0.026	3308	2717	20m.my8031_rel_o2.cy9
3989	13128	1	0.0	383.9	11.6	0.000	0.002	0.096	2.983	50038	52.5	3.812	320	12.7	21.3	11.1	0.028	3244	2733	20m.my8031_rel_native.cy9
3989	13284	1	0.0	396.8	12.0	0.000	0.002	0.099	3.077	50528	52.7	3.804	317	12.7	21.3	11.1	0.022	3278	2797	20m.my8031_rel.cy9
3989	13790	1	0.0	386.8	11.7	0.000	0.002	0.097	3.004	52421	52.7	3.801	306	12.7	21.3	11.1	0.024	3404	2845	20m.my8031_rel_o2_lto.cy9
3989	13910	2	0.0	395.2	12.0	0.000	0.002	0.099	3.080	52858	52.6	3.800	303	12.8	21.3	11.1	0.025	3454	2893	20m.my8031_rel_native_lto.cy9
3989	14239	1	0.0	386.9	11.7	0.000	0.002	0.097	3.006	54234	52.6	3.809	296	12.7	21.3	11.1	0.023	3580	2973	20m.my8031_rel_lto.cy9
l.i0
- l.i0: load without secondary indexes
- Legend for results is here.
- Each entry lists the percentage of responses that fit in that bucket (slower than max time for previous bucket, faster than min time for next bucket).
Insert response time histogram
256us	1ms	4ms	16ms	64ms	256ms	1s	4s	16s	gt	max	tag
0.000	0.000	97.903	1.121	0.962	0.013	0.000	0.000	0.000	0.000	0.133	my8031_rel_withdbg.cy9
0.000	0.000	97.769	1.232	0.985	0.013	0.000	0.000	0.000	0.000	0.117	my8031_rel_o2.cy9
0.000	0.000	97.970	1.034	0.984	0.012	0.000	0.000	0.000	0.000	0.124	my8031_rel_native.cy9
0.000	0.000	97.969	1.080	0.938	0.013	0.000	0.000	0.000	0.000	0.126	my8031_rel.cy9
0.000	0.000	97.949	1.079	0.959	0.013	0.000	0.000	0.000	0.000	0.134	my8031_rel_o2_lto.cy9
0.000	0.000	98.024	1.011	0.951	0.013	0.000	0.000	0.000	0.000	0.119	my8031_rel_native_lto.cy9
0.000	0.000	97.874	1.150	0.961	0.015	0.000	0.000	0.000	0.000	0.121	my8031_rel_lto.cy9
l.x
- l.x: create secondary indexes
- Legend for results is here.
- Each entry lists the percentage of responses that fit in that bucket (slower than max time for previous bucket, faster than min time for next bucket).
TODO - determine whether there is data for create index response time
l.i1
- l.i1: continue load after secondary indexes created
- Legend for results is here.
- Each entry lists the percentage of responses that fit in that bucket (slower than max time for previous bucket, faster than min time for next bucket).
Insert response time histogram
256us	1ms	4ms	16ms	64ms	256ms	1s	4s	16s	gt	max	tag
0.000	0.000	96.762	2.295	0.931	0.012	0.000	0.000	0.000	0.000	0.104	my8031_rel_withdbg.cy9
0.000	0.000	96.590	2.473	0.919	0.018	0.000	0.000	0.000	0.000	0.104	my8031_rel_o2.cy9
0.000	0.000	96.785	2.323	0.871	0.021	0.000	0.000	0.000	0.000	0.104	my8031_rel_native.cy9
0.000	0.000	96.739	2.333	0.896	0.032	0.000	0.000	0.000	0.000	0.104	my8031_rel.cy9
0.000	0.000	96.742	2.353	0.890	0.015	0.000	0.000	0.000	0.000	0.104	my8031_rel_o2_lto.cy9
0.000	0.000	96.827	2.266	0.885	0.022	0.000	0.000	0.000	0.000	0.104	my8031_rel_native_lto.cy9
0.000	0.000	96.805	2.267	0.909	0.020	0.000	0.000	0.000	0.000	0.104	my8031_rel_lto.cy9
q100.1
- q100.1: range queries with 100 insert/s per client
- Legend for results is here.
- Each entry lists the percentage of responses that fit in that bucket (slower than max time for previous bucket, faster than min time for next bucket).
Query response time histogram
256us	1ms	4ms	16ms	64ms	256ms	1s	4s	16s	gt	max	tag
50.262	49.732	0.005	0.001	nonzero	0.000	0.000	0.000	0.000	0.000	0.021	my8031_rel_withdbg.cy9
41.726	58.268	0.006	0.001	nonzero	0.000	0.000	0.000	0.000	0.000	0.024	my8031_rel_o2.cy9
42.794	57.200	0.005	0.001	nonzero	0.000	0.000	0.000	0.000	0.000	0.024	my8031_rel_native.cy9
43.274	56.720	0.005	0.001	nonzero	0.000	0.000	0.000	0.000	0.000	0.022	my8031_rel.cy9
49.142	50.852	0.005	0.001	nonzero	0.000	0.000	0.000	0.000	0.000	0.022	my8031_rel_o2_lto.cy9
51.317	48.677	0.005	0.001	nonzero	0.000	0.000	0.000	0.000	0.000	0.022	my8031_rel_native_lto.cy9
52.909	47.085	0.006	0.001	nonzero	0.000	0.000	0.000	0.000	0.000	0.023	my8031_rel_lto.cy9
Insert response time histogram
256us	1ms	4ms	16ms	64ms	256ms	1s	4s	16s	gt	max	tag
0.000	0.000	98.028	1.257	0.715	0.000	0.000	0.000	0.000	0.000	0.033	my8031_rel_withdbg.cy9
0.000	0.000	97.951	1.250	0.799	0.000	0.000	0.000	0.000	0.000	0.028	my8031_rel_o2.cy9
0.000	0.000	98.493	0.840	0.667	0.000	0.000	0.000	0.000	0.000	0.028	my8031_rel_native.cy9
0.000	0.000	97.986	1.403	0.611	0.000	0.000	0.000	0.000	0.000	0.025	my8031_rel.cy9
0.000	0.000	98.174	0.993	0.833	0.000	0.000	0.000	0.000	0.000	0.029	my8031_rel_o2_lto.cy9
0.000	0.000	98.479	0.819	0.701	0.000	0.000	0.000	0.000	0.000	0.030	my8031_rel_native_lto.cy9
0.000	0.000	98.021	1.243	0.736	0.000	0.000	0.000	0.000	0.000	0.029	my8031_rel_lto.cy9
q500.1
- q500.1: range queries with 500 insert/s per client
- Legend for results is here.
- Each entry lists the percentage of responses that fit in that bucket (slower than max time for previous bucket, faster than min time for next bucket).
Query response time histogram
256us	1ms	4ms	16ms	64ms	256ms	1s	4s	16s	gt	max	tag
48.783	51.197	0.017	0.003	nonzero	0.000	0.000	0.000	0.000	0.000	0.040	my8031_rel_withdbg.cy9
41.970	58.010	0.017	0.003	nonzero	0.000	0.000	0.000	0.000	0.000	0.023	my8031_rel_o2.cy9
39.827	60.152	0.018	0.003	nonzero	0.000	0.000	0.000	0.000	0.000	0.027	my8031_rel_native.cy9
43.082	56.898	0.017	0.003	0.001	0.000	0.000	0.000	0.000	0.000	0.025	my8031_rel.cy9
46.955	53.026	0.015	0.003	0.001	0.000	0.000	0.000	0.000	0.000	0.026	my8031_rel_o2_lto.cy9
51.351	48.630	0.017	0.002	nonzero	0.000	0.000	0.000	0.000	0.000	0.022	my8031_rel_native_lto.cy9
52.435	47.546	0.016	0.002	0.001	0.000	0.000	0.000	0.000	0.000	0.022	my8031_rel_lto.cy9
Insert response time histogram
256us	1ms	4ms	16ms	64ms	256ms	1s	4s	16s	gt	max	tag
0.000	0.000	94.340	4.881	0.722	0.057	0.000	0.000	0.000	0.000	0.108	my8031_rel_withdbg.cy9
0.000	0.000	95.211	4.135	0.636	0.018	0.000	0.000	0.000	0.000	0.105	my8031_rel_o2.cy9
0.000	0.000	95.138	4.125	0.714	0.024	0.000	0.000	0.000	0.000	0.107	my8031_rel_native.cy9
0.000	0.000	95.033	4.311	0.618	0.037	0.000	0.000	0.000	0.000	0.107	my8031_rel.cy9
0.000	0.000	93.094	5.961	0.921	0.024	0.000	0.000	0.000	0.000	0.104	my8031_rel_o2_lto.cy9
0.000	0.000	97.493	2.056	0.438	0.014	0.000	0.000	0.000	0.000	0.103	my8031_rel_native_lto.cy9
0.000	0.000	96.001	3.360	0.615	0.024	0.000	0.000	0.000	0.000	0.105	my8031_rel_lto.cy9
q1000.1
- q1000.1: range queries with 1000 insert/s per client
- Legend for results is here.
- Each entry lists the percentage of responses that fit in that bucket (slower than max time for previous bucket, faster than min time for next bucket).
Query response time histogram
256us	1ms	4ms	16ms	64ms	256ms	1s	4s	16s	gt	max	tag
47.832	52.127	0.035	0.005	0.001	0.000	0.000	0.000	0.000	0.000	0.026	my8031_rel_withdbg.cy9
38.850	61.108	0.036	0.006	0.001	0.000	0.000	0.000	0.000	0.000	0.026	my8031_rel_o2.cy9
38.215	61.738	0.041	0.005	0.001	0.000	0.000	0.000	0.000	0.000	0.028	my8031_rel_native.cy9
40.074	59.885	0.035	0.005	nonzero	0.000	0.000	0.000	0.000	0.000	0.022	my8031_rel.cy9
45.676	54.283	0.035	0.005	0.001	0.000	0.000	0.000	0.000	0.000	0.024	my8031_rel_o2_lto.cy9
47.252	52.713	0.030	0.005	0.001	0.000	0.000	0.000	0.000	0.000	0.025	my8031_rel_native_lto.cy9
51.353	48.606	0.035	0.005	nonzero	0.000	0.000	0.000	0.000	0.000	0.023	my8031_rel_lto.cy9
Insert response time histogram
256us	1ms	4ms	16ms	64ms	256ms	1s	4s	16s	gt	max	tag
0.000	0.000	96.638	2.950	0.401	0.010	0.000	0.000	0.000	0.000	0.106	my8031_rel_withdbg.cy9
0.000	0.000	94.281	5.258	0.438	0.024	0.000	0.000	0.000	0.000	0.108	my8031_rel_o2.cy9
0.000	0.000	96.524	3.112	0.358	0.006	0.000	0.000	0.000	0.000	0.106	my8031_rel_native.cy9
0.000	0.000	95.424	4.120	0.420	0.036	0.000	0.000	0.000	0.000	0.112	my8031_rel.cy9
0.000	0.000	95.917	3.740	0.333	0.010	0.000	0.000	0.000	0.000	0.105	my8031_rel_o2_lto.cy9
0.000	0.000	93.794	5.615	0.572	0.019	0.000	0.000	0.000	0.000	0.107	my8031_rel_native_lto.cy9
0.000	0.000	96.752	2.896	0.342	0.010	0.000	0.000	0.000	0.000	0.105	my8031_rel_lto.cy9