Introduction
This is a report for the insert benchmark with 20M docs and 4 client(s). It is generated by scripts (bash, awk, sed) and Tufte might not be impressed. An overview of the insert benchmark is here and a short update is here. Below, by DBMS, I mean DBMS+version.config. An example is my8020.c10b40 where my means MySQL, 8020 is version 8.0.20 and c10b40 is the name for the configuration file.
The test server has 8 AMD cores, 16G RAM and an NVMe SSD. It is described here as the Beelink. The benchmark was run with 4 clients and there were 1 or 2 connections per client (1 for queries, 1 for inserts). The benchmark loads 20M rows without secondary indexes, creates secondary indexes, loads another 20M rows then does 3 read+write tests for one hour each that do queries as fast as possible with 100, 500 and then 1000 writes/second/client concurrent with the queries. There is 1 table. The database is cached by the OS page cache but not the storage engine. Clients and the DBMS share one server. The per-database configs are in the per-database subdirectories here.
The tested DBMS are:
- my8031_rel_withdbg.cy9_1g - InnoDB and MySQL 8.0.31, the cy9_1g config and compiled with CMAKE_BUILD_TYPE=RelWitDebInfo -O2 -flto
- my8031_rel_o2.cy9_1g - InnoDB and MySQL 8.0.31, the cy9_1g config and compiled with CMAKE_BUILD_TYPE=Release -O2
- my8031_rel_native.cy9_1g - InnoDB and MySQL 8.0.31, the cy9_1g config and compiled with CMAKE_BUILD_TYPE=Release -O3 -march=native -mtune=native
- my8031_rel.cy9_1g - InnoDB and MySQL 8.0.31, the cy9_1g config and compiled with CMAKE_BUILD_TYPE=Release -O3
- my8031_rel_o2_lto.cy9_1g - InnoDB and MySQL 8.0.31, the cy9_1g config and compiled with CMAKE_BUILD_TYPE=Release -O2 -flto
- my8031_rel_native_lto.cy9_1g - InnoDB and MySQL 8.0.31, the cy9_1g config and compiled with CMAKE_BUILD_TYPE=Release -O3 -flto -march=native -mtune=native
- my8031_rel_lto.cy9_1g - InnoDB and MySQL 8.0.31, the cy9_1g config and compiled with CMAKE_BUILD_TYPE=Release -O3 -flto
Contents
- Summary
- l.i0: load without secondary indexes
- l.x: create secondary indexes
- l.i1: continue load after secondary indexes created
- q100.1: range queries with 100 insert/s per client
- q500.1: range queries with 500 insert/s per client
- q1000.1: range queries with 1000 insert/s per client
Summary
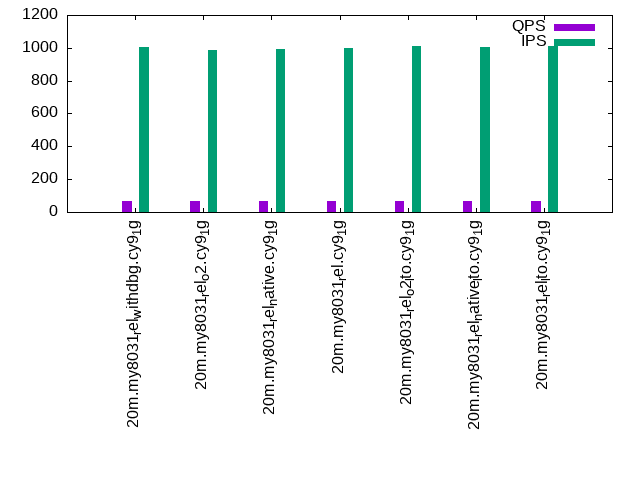
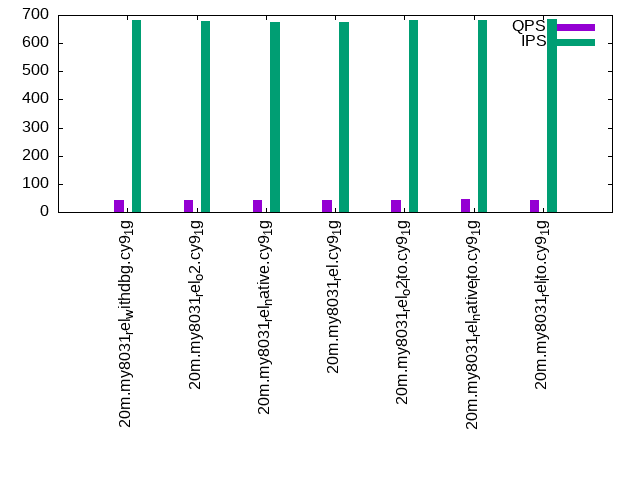
The numbers are inserts/s for l.i0 and l.i1, indexed docs (or rows) /s for l.x and queries/s for q*.2. The values are the average rate over the entire test for inserts (IPS) and queries (QPS). The range of values for IPS and QPS is split into 3 parts: bottom 25%, middle 50%, top 25%. Values in the bottom 25% have a red background, values in the top 25% have a green background and values in the middle have no color. A gray background is used for values that can be ignored because the DBMS did not sustain the target insert rate. Red backgrounds are not used when the minimum value is within 80% of the max value.
| dbms | l.i0 | l.x | l.i1 | q100.1 | q500.1 | q1000.1 |
|---|---|---|---|---|---|---|
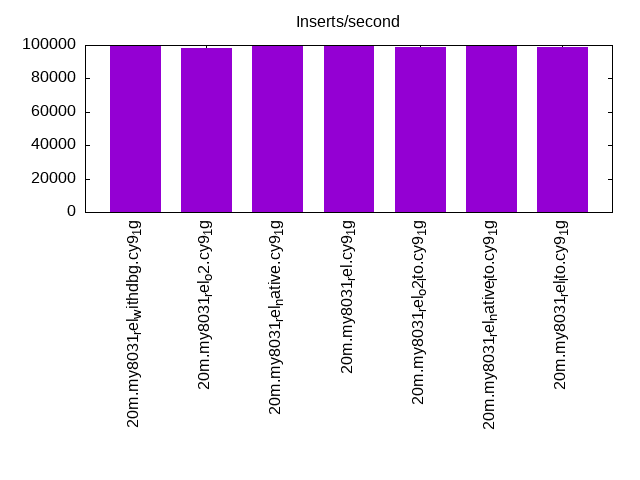
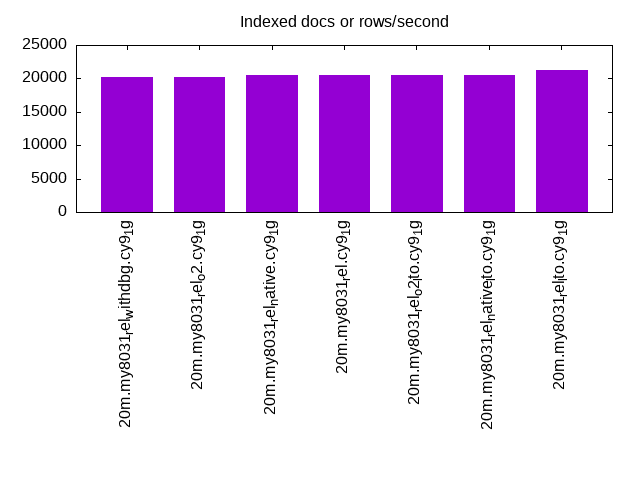
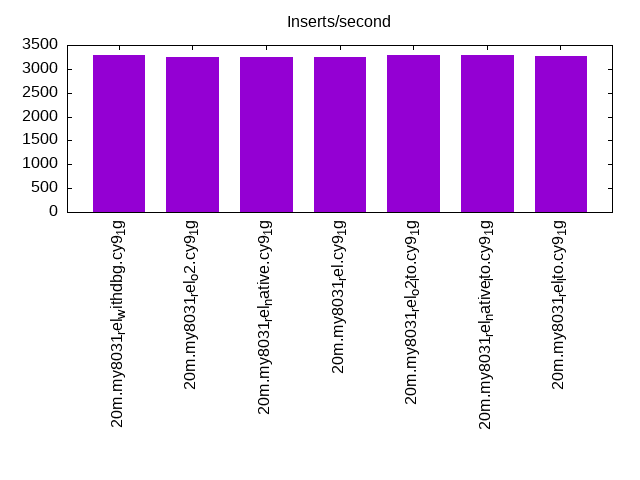
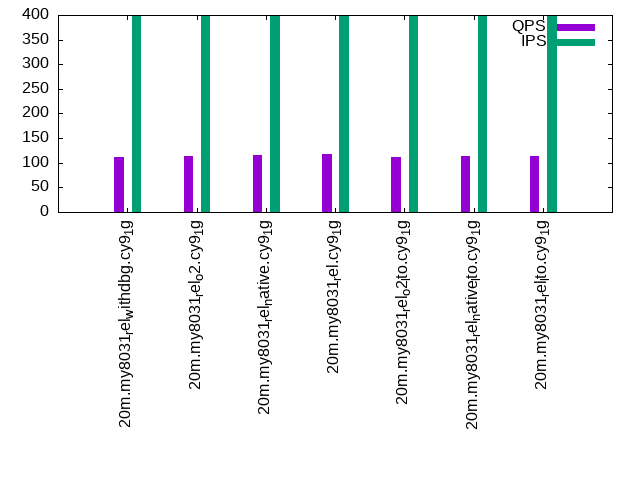
| 20m.my8031_rel_withdbg.cy9_1g | 99502 | 20262 | 3280 | 112 | 68 | 44 |
| 20m.my8031_rel_o2.cy9_1g | 98039 | 20242 | 3243 | 113 | 67 | 44 |
| 20m.my8031_rel_native.cy9_1g | 100000 | 20489 | 3255 | 115 | 68 | 44 |
| 20m.my8031_rel.cy9_1g | 100000 | 20489 | 3254 | 117 | 68 | 44 |
| 20m.my8031_rel_o2_lto.cy9_1g | 99010 | 20510 | 3288 | 111 | 69 | 44 |
| 20m.my8031_rel_native_lto.cy9_1g | 100000 | 20510 | 3291 | 113 | 70 | 45 |
| 20m.my8031_rel_lto.cy9_1g | 98522 | 21225 | 3279 | 113 | 69 | 44 |
This table has relative throughput, throughput for the DBMS relative to the DBMS in the first line, using the absolute throughput from the previous table.
| dbms | l.i0 | l.x | l.i1 | q100.1 | q500.1 | q1000.1 |
|---|---|---|---|---|---|---|
| 20m.my8031_rel_withdbg.cy9_1g | 1.00 | 1.00 | 1.00 | 1.00 | 1.00 | 1.00 |
| 20m.my8031_rel_o2.cy9_1g | 0.99 | 1.00 | 0.99 | 1.01 | 0.99 | 1.00 |
| 20m.my8031_rel_native.cy9_1g | 1.01 | 1.01 | 0.99 | 1.03 | 1.00 | 1.00 |
| 20m.my8031_rel.cy9_1g | 1.01 | 1.01 | 0.99 | 1.04 | 1.00 | 1.00 |
| 20m.my8031_rel_o2_lto.cy9_1g | 1.00 | 1.01 | 1.00 | 0.99 | 1.01 | 1.00 |
| 20m.my8031_rel_native_lto.cy9_1g | 1.01 | 1.01 | 1.00 | 1.01 | 1.03 | 1.02 |
| 20m.my8031_rel_lto.cy9_1g | 0.99 | 1.05 | 1.00 | 1.01 | 1.01 | 1.00 |
This lists the average rate of inserts/s for the tests that do inserts concurrent with queries. For such tests the query rate is listed in the table above. The read+write tests are setup so that the insert rate should match the target rate every second. Cells that are not at least 95% of the target have a red background to indicate a failure to satisfy the target.
| dbms | q100.1 | q500.1 | q1000.1 |
|---|---|---|---|
| my8031_rel_withdbg.cy9_1g | 398 | 1007 | 681 |
| my8031_rel_o2.cy9_1g | 398 | 985 | 678 |
| my8031_rel_native.cy9_1g | 398 | 995 | 675 |
| my8031_rel.cy9_1g | 399 | 998 | 675 |
| my8031_rel_o2_lto.cy9_1g | 399 | 1011 | 684 |
| my8031_rel_native_lto.cy9_1g | 398 | 1005 | 681 |
| my8031_rel_lto.cy9_1g | 399 | 1012 | 686 |
| target | 400 | 2000 | 4000 |
l.i0
l.i0: load without secondary indexes. Graphs for performance per 1-second interval are here.
Average throughput:
Insert response time histogram: each cell has the percentage of responses that take <= the time in the header and max is the max response time in seconds. For the max column values in the top 25% of the range have a red background and in the bottom 25% of the range have a green background. The red background is not used when the min value is within 80% of the max value.
| dbms | 256us | 1ms | 4ms | 16ms | 64ms | 256ms | 1s | 4s | 16s | gt | max |
|---|---|---|---|---|---|---|---|---|---|---|---|
| my8031_rel_withdbg.cy9_1g | 91.645 | 6.229 | 2.016 | 0.110 | 0.164 | ||||||
| my8031_rel_o2.cy9_1g | 90.329 | 7.504 | 2.062 | 0.105 | 0.148 | ||||||
| my8031_rel_native.cy9_1g | 91.381 | 6.581 | 1.948 | 0.090 | 0.138 | ||||||
| my8031_rel.cy9_1g | 91.709 | 6.193 | 1.991 | 0.107 | 0.203 | ||||||
| my8031_rel_o2_lto.cy9_1g | 91.677 | 6.103 | 2.067 | 0.152 | 0.001 | 0.279 | |||||
| my8031_rel_native_lto.cy9_1g | 91.722 | 6.107 | 2.034 | 0.136 | 0.221 | ||||||
| my8031_rel_lto.cy9_1g | 90.701 | 7.107 | 2.106 | 0.086 | 0.156 |
Performance metrics for the DBMS listed above. Some are normalized by throughput, others are not. Legend for results is here.
ips	qps	rps	rmbps	wps	wmbps	rpq	rkbpq	wpi	wkbpi	csps	cpups	cspq	cpupq	dbgb1	dbgb2	rss	maxop	p50	p99	tag
99502	0	0	0.0	509.1	46.3	0.000	0.000	0.005	0.477	12679	49.0	0.127	39	2.4	11.0	1.4	0.164	27870	9689	20m.my8031_rel_withdbg.cy9_1g
98039	0	0	0.0	495.7	45.7	0.000	0.000	0.005	0.477	12559	50.0	0.128	41	2.4	11.0	1.4	0.148	25471	15382	20m.my8031_rel_o2.cy9_1g
100000	0	0	0.0	508.6	46.3	0.000	0.000	0.005	0.475	12731	49.8	0.127	40	2.4	11.0	1.4	0.138	27570	15483	20m.my8031_rel_native.cy9_1g
100000	0	0	0.0	509.9	46.3	0.000	0.000	0.005	0.474	12780	49.2	0.128	39	2.4	11.0	1.4	0.203	27281	13895	20m.my8031_rel.cy9_1g
99010	0	0	0.0	506.5	46.1	0.000	0.000	0.005	0.477	12619	48.8	0.127	39	2.4	11.0	1.4	0.279	26781	4095	20m.my8031_rel_o2_lto.cy9_1g
100000	0	0	0.0	512.6	46.4	0.000	0.000	0.005	0.475	12705	48.5	0.127	39	2.4	11.0	1.4	0.221	26371	999	20m.my8031_rel_native_lto.cy9_1g
98522	0	0	0.0	512.8	46.5	0.000	0.000	0.005	0.483	12658	49.5	0.128	40	2.4	11.0	1.4	0.156	26570	14392	20m.my8031_rel_lto.cy9_1g
l.x
l.x: create secondary indexes.
Average throughput:
Performance metrics for the DBMS listed above. Some are normalized by throughput, others are not. Legend for results is here.
ips	qps	rps	rmbps	wps	wmbps	rpq	rkbpq	wpi	wkbpi	csps	cpups	cspq	cpupq	dbgb1	dbgb2	rss	maxop	p50	p99	tag
20262	0	105	7.0	564.1	22.8	0.005	0.354	0.028	1.153	4434	7.6	0.219	30	4.0	12.6	1.5	0.063	NA	NA	20m.my8031_rel_withdbg.cy9_1g
20242	0	105	7.0	561.5	22.9	0.005	0.354	0.028	1.160	4426	7.9	0.219	31	4.0	12.6	1.5	0.067	NA	NA	20m.my8031_rel_o2.cy9_1g
20489	0	106	7.1	564.5	23.1	0.005	0.354	0.028	1.157	4457	7.8	0.218	30	4.0	12.6	1.5	0.043	NA	NA	20m.my8031_rel_native.cy9_1g
20489	0	106	7.1	564.9	23.1	0.005	0.354	0.028	1.152	4452	7.8	0.217	30	4.0	12.6	1.5	0.017	NA	NA	20m.my8031_rel.cy9_1g
20510	0	106	7.1	565.2	23.1	0.005	0.353	0.028	1.156	4451	7.7	0.217	30	4.0	12.6	1.5	0.025	NA	NA	20m.my8031_rel_o2_lto.cy9_1g
20510	0	106	7.1	565.1	23.0	0.005	0.353	0.028	1.151	4453	7.4	0.217	29	4.0	12.6	1.5	0.028	NA	NA	20m.my8031_rel_native_lto.cy9_1g
21225	0	110	7.3	583.3	24.0	0.005	0.354	0.027	1.157	4558	6.4	0.215	24	4.0	12.6	1.5	0.039	NA	NA	20m.my8031_rel_lto.cy9_1g
l.i1
l.i1: continue load after secondary indexes created. Graphs for performance per 1-second interval are here.
Average throughput:
Insert response time histogram: each cell has the percentage of responses that take <= the time in the header and max is the max response time in seconds. For the max column values in the top 25% of the range have a red background and in the bottom 25% of the range have a green background. The red background is not used when the min value is within 80% of the max value.
| dbms | 256us | 1ms | 4ms | 16ms | 64ms | 256ms | 1s | 4s | 16s | gt | max |
|---|---|---|---|---|---|---|---|---|---|---|---|
| my8031_rel_withdbg.cy9_1g | 0.005 | 23.493 | 44.478 | 30.714 | 1.124 | 0.163 | 0.023 | 8.345 | |||
| my8031_rel_o2.cy9_1g | 0.003 | 20.706 | 47.129 | 30.875 | 1.106 | 0.155 | 0.025 | 8.678 | |||
| my8031_rel_native.cy9_1g | 0.013 | 21.872 | 46.278 | 30.514 | 1.125 | 0.181 | 0.018 | 7.644 | |||
| my8031_rel.cy9_1g | 0.004 | 21.808 | 46.379 | 30.457 | 1.155 | 0.173 | 0.023 | 8.779 | |||
| my8031_rel_o2_lto.cy9_1g | 0.015 | 23.681 | 44.494 | 30.473 | 1.147 | 0.167 | 0.023 | 7.820 | |||
| my8031_rel_native_lto.cy9_1g | 0.014 | 24.817 | 43.240 | 30.630 | 1.111 | 0.166 | 0.021 | 9.884 | |||
| my8031_rel_lto.cy9_1g | 0.009 | 22.774 | 45.093 | 30.933 | 0.993 | 0.177 | 0.021 | 9.681 |
Performance metrics for the DBMS listed above. Some are normalized by throughput, others are not. Legend for results is here.
ips	qps	rps	rmbps	wps	wmbps	rpq	rkbpq	wpi	wkbpi	csps	cpups	cspq	cpupq	dbgb1	dbgb2	rss	maxop	p50	p99	tag
3280	0	0	0.0	1002.2	22.6	0.000	0.002	0.306	7.046	6661	13.9	2.031	339	10.5	19.0	1.5	8.345	699	0	20m.my8031_rel_withdbg.cy9_1g
3243	0	0	0.0	994.7	22.4	0.000	0.002	0.307	7.062	6619	14.3	2.041	353	10.5	19.0	1.5	8.678	700	0	20m.my8031_rel_o2.cy9_1g
3255	0	0	0.0	994.7	22.4	0.000	0.002	0.306	7.045	6628	13.9	2.036	342	10.5	19.0	1.5	7.644	699	0	20m.my8031_rel_native.cy9_1g
3254	0	0	0.0	995.7	22.4	0.000	0.002	0.306	7.049	6629	13.9	2.038	342	10.5	19.0	1.5	8.779	699	0	20m.my8031_rel.cy9_1g
3288	0	0	0.0	1001.4	22.6	0.000	0.002	0.305	7.031	6668	13.9	2.028	338	10.5	19.0	1.5	7.820	699	0	20m.my8031_rel_o2_lto.cy9_1g
3291	0	0	0.0	1002.9	22.6	0.000	0.002	0.305	7.030	6661	13.5	2.024	328	10.4	19.0	1.5	9.884	699	0	20m.my8031_rel_native_lto.cy9_1g
3279	0	0	0.0	1006.1	22.6	0.000	0.002	0.307	7.068	6672	13.9	2.035	339	10.5	19.1	1.5	9.681	699	0	20m.my8031_rel_lto.cy9_1g
q100.1
q100.1: range queries with 100 insert/s per client. Graphs for performance per 1-second interval are here.
Average throughput:
Query response time histogram: each cell has the percentage of responses that take <= the time in the header and max is the max response time in seconds. For max values in the top 25% of the range have a red background and in the bottom 25% of the range have a green background. The red background is not used when the min value is within 80% of the max value.
| dbms | 256us | 1ms | 4ms | 16ms | 64ms | 256ms | 1s | 4s | 16s | gt | max |
|---|---|---|---|---|---|---|---|---|---|---|---|
| my8031_rel_withdbg.cy9_1g | 0.003 | 23.225 | 3.872 | 25.013 | 32.988 | 13.357 | 1.541 | nonzero | 1.202 | ||
| my8031_rel_o2.cy9_1g | 0.002 | 23.241 | 3.896 | 24.964 | 32.820 | 13.642 | 1.434 | nonzero | 1.292 | ||
| my8031_rel_native.cy9_1g | 0.002 | 23.338 | 3.957 | 25.634 | 32.659 | 12.963 | 1.445 | 0.001 | 1.233 | ||
| my8031_rel.cy9_1g | 0.002 | 23.483 | 4.024 | 25.631 | 32.815 | 12.605 | 1.438 | 0.001 | 1.213 | ||
| my8031_rel_o2_lto.cy9_1g | 23.274 | 3.798 | 25.298 | 32.643 | 13.414 | 1.570 | 0.002 | 1.331 | |||
| my8031_rel_native_lto.cy9_1g | 0.005 | 22.976 | 3.889 | 25.758 | 33.240 | 12.471 | 1.661 | 0.002 | 1.368 | ||
| my8031_rel_lto.cy9_1g | 0.011 | 23.324 | 3.698 | 25.375 | 32.993 | 13.085 | 1.513 | nonzero | 1.148 |
Insert response time histogram: each cell has the percentage of responses that take <= the time in the header and max is the max response time in seconds. For max values in the top 25% of the range have a red background and in the bottom 25% of the range have a green background. The red background is not used when the min value is within 80% of the max value.
| dbms | 256us | 1ms | 4ms | 16ms | 64ms | 256ms | 1s | 4s | 16s | gt | max |
|---|---|---|---|---|---|---|---|---|---|---|---|
| my8031_rel_withdbg.cy9_1g | 0.215 | 2.306 | 49.326 | 46.604 | 1.549 | 2.491 | |||||
| my8031_rel_o2.cy9_1g | 0.201 | 2.486 | 50.944 | 44.882 | 1.486 | 1.800 | |||||
| my8031_rel_native.cy9_1g | 0.188 | 2.229 | 50.299 | 45.465 | 1.819 | 1.775 | |||||
| my8031_rel.cy9_1g | 0.243 | 2.278 | 51.396 | 44.340 | 1.743 | 1.825 | |||||
| my8031_rel_o2_lto.cy9_1g | 0.174 | 2.382 | 48.750 | 47.188 | 1.507 | 2.011 | |||||
| my8031_rel_native_lto.cy9_1g | 0.146 | 2.229 | 50.688 | 45.153 | 1.785 | 2.072 | |||||
| my8031_rel_lto.cy9_1g | 0.146 | 2.493 | 50.097 | 45.757 | 1.507 | 1.765 |
Performance metrics for the DBMS listed above. Some are normalized by throughput, others are not. Legend for results is here.
ips	qps	rps	rmbps	wps	wmbps	rpq	rkbpq	wpi	wkbpi	csps	cpups	cspq	cpupq	dbgb1	dbgb2	rss	maxop	p50	p99	tag
398	112	11	0.2	1005.5	16.8	0.101	1.655	2.525	43.320	7096	6.0	63.474	4293	10.9	19.5	1.5	1.202	16	0	20m.my8031_rel_withdbg.cy9_1g
398	113	11	0.2	1003.7	16.8	0.099	1.627	2.519	43.259	7078	6.0	62.747	4256	10.9	19.5	1.5	1.292	16	0	20m.my8031_rel_o2.cy9_1g
398	115	11	0.2	1006.5	16.9	0.096	1.559	2.526	43.485	7105	6.0	61.887	4181	10.9	19.5	1.5	1.233	16	0	20m.my8031_rel_native.cy9_1g
399	117	12	0.2	1016.1	17.1	0.101	1.648	2.549	43.842	7167	6.1	61.361	4178	10.9	19.5	1.5	1.213	16	0	20m.my8031_rel.cy9_1g
399	111	11	0.2	1005.7	16.8	0.103	1.677	2.523	43.222	7092	6.0	63.777	4317	10.9	19.5	1.5	1.331	16	0	20m.my8031_rel_o2_lto.cy9_1g
398	113	12	0.2	1009.5	16.9	0.104	1.705	2.534	43.459	7116	5.9	63.085	4184	10.9	19.5	1.5	1.368	16	0	20m.my8031_rel_native_lto.cy9_1g
399	113	12	0.2	1009.3	16.9	0.105	1.718	2.532	43.373	7119	5.9	62.830	4166	10.9	19.5	1.5	1.148	16	0	20m.my8031_rel_lto.cy9_1g
q500.1
q500.1: range queries with 500 insert/s per client. Graphs for performance per 1-second interval are here.
Average throughput:
Query response time histogram: each cell has the percentage of responses that take <= the time in the header and max is the max response time in seconds. For max values in the top 25% of the range have a red background and in the bottom 25% of the range have a green background. The red background is not used when the min value is within 80% of the max value.
| dbms | 256us | 1ms | 4ms | 16ms | 64ms | 256ms | 1s | 4s | 16s | gt | max |
|---|---|---|---|---|---|---|---|---|---|---|---|
| my8031_rel_withdbg.cy9_1g | 0.002 | 16.683 | 3.470 | 18.482 | 33.790 | 23.452 | 4.113 | 0.007 | 1.599 | ||
| my8031_rel_o2.cy9_1g | nonzero | 16.820 | 3.656 | 18.334 | 33.302 | 23.653 | 4.228 | 0.008 | 1.491 | ||
| my8031_rel_native.cy9_1g | 16.756 | 3.580 | 18.895 | 33.577 | 22.977 | 4.210 | 0.005 | 1.193 | |||
| my8031_rel.cy9_1g | 0.001 | 16.680 | 3.573 | 18.602 | 33.552 | 23.455 | 4.132 | 0.005 | 1.617 | ||
| my8031_rel_o2_lto.cy9_1g | nonzero | 16.976 | 3.550 | 18.664 | 33.471 | 23.262 | 4.071 | 0.005 | 1.285 | ||
| my8031_rel_native_lto.cy9_1g | nonzero | 17.200 | 3.468 | 19.101 | 33.915 | 22.239 | 4.071 | 0.006 | 2.151 | ||
| my8031_rel_lto.cy9_1g | 0.006 | 16.671 | 3.415 | 18.798 | 34.131 | 22.901 | 4.075 | 0.004 | 1.268 |
Insert response time histogram: each cell has the percentage of responses that take <= the time in the header and max is the max response time in seconds. For max values in the top 25% of the range have a red background and in the bottom 25% of the range have a green background. The red background is not used when the min value is within 80% of the max value.
| dbms | 256us | 1ms | 4ms | 16ms | 64ms | 256ms | 1s | 4s | 16s | gt | max |
|---|---|---|---|---|---|---|---|---|---|---|---|
| my8031_rel_withdbg.cy9_1g | 1.765 | 8.981 | 64.606 | 24.501 | 0.147 | 1.626 | |||||
| my8031_rel_o2.cy9_1g | 1.674 | 8.947 | 63.731 | 25.418 | 0.231 | 1.739 | |||||
| my8031_rel_native.cy9_1g | 1.679 | 8.710 | 64.281 | 25.215 | 0.115 | 1.663 | |||||
| my8031_rel.cy9_1g | 1.807 | 8.549 | 64.833 | 24.643 | 0.168 | 1.538 | |||||
| my8031_rel_o2_lto.cy9_1g | 1.794 | 8.769 | 65.038 | 24.274 | 0.125 | 1.724 | |||||
| my8031_rel_native_lto.cy9_1g | 0.004 | 1.822 | 9.122 | 64.681 | 24.207 | 0.164 | 1.814 | ||||
| my8031_rel_lto.cy9_1g | 1.753 | 8.772 | 65.451 | 23.858 | 0.165 | 1.591 |
Performance metrics for the DBMS listed above. Some are normalized by throughput, others are not. Legend for results is here.
ips	qps	rps	rmbps	wps	wmbps	rpq	rkbpq	wpi	wkbpi	csps	cpups	cspq	cpupq	dbgb1	dbgb2	rss	maxop	p50	p99	tag
1007	68	8	0.1	979.5	16.9	0.114	1.914	0.973	17.211	6909	7.3	102.056	8626	12.0	20.6	1.5	1.599	16	0	20m.my8031_rel_withdbg.cy9_1g
985	67	8	0.1	966.1	16.7	0.112	1.903	0.980	17.326	6836	7.3	101.880	8704	12.0	20.6	1.5	1.491	16	0	20m.my8031_rel_o2.cy9_1g
995	68	8	0.1	977.3	16.9	0.117	1.976	0.982	17.352	6916	7.3	101.405	8563	12.0	20.6	1.5	1.193	16	0	20m.my8031_rel_native.cy9_1g
998	68	8	0.1	977.1	16.9	0.115	1.947	0.979	17.315	6915	7.3	101.846	8601	12.0	20.6	1.5	1.617	16	0	20m.my8031_rel.cy9_1g
1011	69	8	0.1	987.3	17.1	0.114	1.913	0.977	17.281	6972	7.4	101.629	8630	12.0	20.6	1.5	1.285	16	0	20m.my8031_rel_o2_lto.cy9_1g
1005	70	8	0.1	988.2	17.1	0.114	1.914	0.983	17.410	6957	7.3	99.809	8379	12.0	20.6	1.5	2.151	16	0	20m.my8031_rel_native_lto.cy9_1g
1012	69	8	0.1	989.3	17.1	0.115	1.957	0.978	17.304	6976	7.3	101.396	8488	12.0	20.6	1.5	1.268	16	0	20m.my8031_rel_lto.cy9_1g
q1000.1
q1000.1: range queries with 1000 insert/s per client. Graphs for performance per 1-second interval are here.
Average throughput:
Query response time histogram: each cell has the percentage of responses that take <= the time in the header and max is the max response time in seconds. For max values in the top 25% of the range have a red background and in the bottom 25% of the range have a green background. The red background is not used when the min value is within 80% of the max value.
| dbms | 256us | 1ms | 4ms | 16ms | 64ms | 256ms | 1s | 4s | 16s | gt | max |
|---|---|---|---|---|---|---|---|---|---|---|---|
| my8031_rel_withdbg.cy9_1g | 0.001 | 16.142 | 2.817 | 12.087 | 31.016 | 27.777 | 10.078 | 0.081 | 1.826 | ||
| my8031_rel_o2.cy9_1g | nonzero | 16.121 | 2.981 | 12.110 | 30.300 | 28.359 | 10.054 | 0.074 | 1.922 | ||
| my8031_rel_native.cy9_1g | nonzero | 16.095 | 2.879 | 12.119 | 30.413 | 28.200 | 10.228 | 0.065 | 1.704 | ||
| my8031_rel.cy9_1g | 0.001 | 16.193 | 2.776 | 12.150 | 30.744 | 28.022 | 10.042 | 0.071 | 2.167 | ||
| my8031_rel_o2_lto.cy9_1g | 0.001 | 16.101 | 2.757 | 11.993 | 30.635 | 28.433 | 10.013 | 0.068 | 2.414 | ||
| my8031_rel_native_lto.cy9_1g | 0.003 | 16.390 | 2.623 | 12.141 | 31.153 | 27.687 | 9.935 | 0.068 | 2.192 | ||
| my8031_rel_lto.cy9_1g | 0.005 | 16.025 | 2.637 | 12.028 | 30.974 | 28.194 | 10.073 | 0.064 | 1.857 |
Insert response time histogram: each cell has the percentage of responses that take <= the time in the header and max is the max response time in seconds. For max values in the top 25% of the range have a red background and in the bottom 25% of the range have a green background. The red background is not used when the min value is within 80% of the max value.
| dbms | 256us | 1ms | 4ms | 16ms | 64ms | 256ms | 1s | 4s | 16s | gt | max |
|---|---|---|---|---|---|---|---|---|---|---|---|
| my8031_rel_withdbg.cy9_1g | 2.028 | 3.912 | 50.514 | 42.077 | 1.469 | 2.819 | |||||
| my8031_rel_o2.cy9_1g | 2.057 | 4.108 | 49.837 | 42.503 | 1.496 | 2.397 | |||||
| my8031_rel_native.cy9_1g | 2.017 | 3.928 | 50.019 | 42.483 | 1.552 | 2.574 | |||||
| my8031_rel.cy9_1g | 2.006 | 3.700 | 50.059 | 42.707 | 1.528 | 2.661 | |||||
| my8031_rel_o2_lto.cy9_1g | 2.167 | 3.949 | 50.260 | 42.179 | 1.445 | 3.074 | |||||
| my8031_rel_native_lto.cy9_1g | 0.001 | 2.133 | 3.889 | 50.798 | 41.594 | 1.585 | 2.259 | ||||
| my8031_rel_lto.cy9_1g | 2.120 | 3.958 | 50.949 | 41.556 | 1.416 | 2.478 |
Performance metrics for the DBMS listed above. Some are normalized by throughput, others are not. Legend for results is here.
ips	qps	rps	rmbps	wps	wmbps	rpq	rkbpq	wpi	wkbpi	csps	cpups	cspq	cpupq	dbgb1	dbgb2	rss	maxop	p50	p99	tag
681	44	5	0.1	685.7	11.8	0.109	1.947	1.007	17.696	5044	5.2	113.849	9391	13.7	22.3	1.4	1.826	16	0	20m.my8031_rel_withdbg.cy9_1g
678	44	5	0.1	682.8	11.7	0.105	1.886	1.007	17.664	5016	5.3	113.749	9615	13.7	22.3	1.4	1.922	16	0	20m.my8031_rel_o2.cy9_1g
675	44	5	0.1	682.0	11.7	0.107	1.924	1.010	17.715	5027	5.2	114.781	9498	13.7	22.3	1.4	1.704	16	0	20m.my8031_rel_native.cy9_1g
675	44	5	0.1	683.4	11.7	0.106	1.918	1.012	17.776	5049	5.2	113.982	9390	13.7	22.3	1.3	2.167	16	0	20m.my8031_rel.cy9_1g
684	44	5	0.1	686.3	11.8	0.104	1.876	1.004	17.638	5044	5.2	114.116	9412	13.7	22.3	1.4	2.414	16	0	20m.my8031_rel_o2_lto.cy9_1g
681	45	5	0.1	686.9	11.8	0.106	1.899	1.008	17.724	5043	5.2	112.826	9307	13.7	22.3	1.4	2.192	16	0	20m.my8031_rel_native_lto.cy9_1g
686	44	5	0.1	688.2	11.8	0.107	1.933	1.003	17.590	5056	5.2	114.659	9433	13.7	22.3	1.4	1.857	16	0	20m.my8031_rel_lto.cy9_1g
l.i0
l.i0: load without secondary indexes
Performance metrics for all DBMS, not just the ones listed above. Some are normalized by throughput, others are not. Legend for results is here.
ips	qps	rps	rmbps	wps	wmbps	rpq	rkbpq	wpi	wkbpi	csps	cpups	cspq	cpupq	dbgb1	dbgb2	rss	maxop	p50	p99	tag
99502	0	0	0.0	509.1	46.3	0.000	0.000	0.005	0.477	12679	49.0	0.127	39	2.4	11.0	1.4	0.164	27870	9689	20m.my8031_rel_withdbg.cy9_1g
98039	0	0	0.0	495.7	45.7	0.000	0.000	0.005	0.477	12559	50.0	0.128	41	2.4	11.0	1.4	0.148	25471	15382	20m.my8031_rel_o2.cy9_1g
100000	0	0	0.0	508.6	46.3	0.000	0.000	0.005	0.475	12731	49.8	0.127	40	2.4	11.0	1.4	0.138	27570	15483	20m.my8031_rel_native.cy9_1g
100000	0	0	0.0	509.9	46.3	0.000	0.000	0.005	0.474	12780	49.2	0.128	39	2.4	11.0	1.4	0.203	27281	13895	20m.my8031_rel.cy9_1g
99010	0	0	0.0	506.5	46.1	0.000	0.000	0.005	0.477	12619	48.8	0.127	39	2.4	11.0	1.4	0.279	26781	4095	20m.my8031_rel_o2_lto.cy9_1g
100000	0	0	0.0	512.6	46.4	0.000	0.000	0.005	0.475	12705	48.5	0.127	39	2.4	11.0	1.4	0.221	26371	999	20m.my8031_rel_native_lto.cy9_1g
98522	0	0	0.0	512.8	46.5	0.000	0.000	0.005	0.483	12658	49.5	0.128	40	2.4	11.0	1.4	0.156	26570	14392	20m.my8031_rel_lto.cy9_1g
l.x
l.x: create secondary indexes
Performance metrics for all DBMS, not just the ones listed above. Some are normalized by throughput, others are not. Legend for results is here.
ips	qps	rps	rmbps	wps	wmbps	rpq	rkbpq	wpi	wkbpi	csps	cpups	cspq	cpupq	dbgb1	dbgb2	rss	maxop	p50	p99	tag
20262	0	105	7.0	564.1	22.8	0.005	0.354	0.028	1.153	4434	7.6	0.219	30	4.0	12.6	1.5	0.063	NA	NA	20m.my8031_rel_withdbg.cy9_1g
20242	0	105	7.0	561.5	22.9	0.005	0.354	0.028	1.160	4426	7.9	0.219	31	4.0	12.6	1.5	0.067	NA	NA	20m.my8031_rel_o2.cy9_1g
20489	0	106	7.1	564.5	23.1	0.005	0.354	0.028	1.157	4457	7.8	0.218	30	4.0	12.6	1.5	0.043	NA	NA	20m.my8031_rel_native.cy9_1g
20489	0	106	7.1	564.9	23.1	0.005	0.354	0.028	1.152	4452	7.8	0.217	30	4.0	12.6	1.5	0.017	NA	NA	20m.my8031_rel.cy9_1g
20510	0	106	7.1	565.2	23.1	0.005	0.353	0.028	1.156	4451	7.7	0.217	30	4.0	12.6	1.5	0.025	NA	NA	20m.my8031_rel_o2_lto.cy9_1g
20510	0	106	7.1	565.1	23.0	0.005	0.353	0.028	1.151	4453	7.4	0.217	29	4.0	12.6	1.5	0.028	NA	NA	20m.my8031_rel_native_lto.cy9_1g
21225	0	110	7.3	583.3	24.0	0.005	0.354	0.027	1.157	4558	6.4	0.215	24	4.0	12.6	1.5	0.039	NA	NA	20m.my8031_rel_lto.cy9_1g
l.i1
l.i1: continue load after secondary indexes created
Performance metrics for all DBMS, not just the ones listed above. Some are normalized by throughput, others are not. Legend for results is here.
ips	qps	rps	rmbps	wps	wmbps	rpq	rkbpq	wpi	wkbpi	csps	cpups	cspq	cpupq	dbgb1	dbgb2	rss	maxop	p50	p99	tag
3280	0	0	0.0	1002.2	22.6	0.000	0.002	0.306	7.046	6661	13.9	2.031	339	10.5	19.0	1.5	8.345	699	0	20m.my8031_rel_withdbg.cy9_1g
3243	0	0	0.0	994.7	22.4	0.000	0.002	0.307	7.062	6619	14.3	2.041	353	10.5	19.0	1.5	8.678	700	0	20m.my8031_rel_o2.cy9_1g
3255	0	0	0.0	994.7	22.4	0.000	0.002	0.306	7.045	6628	13.9	2.036	342	10.5	19.0	1.5	7.644	699	0	20m.my8031_rel_native.cy9_1g
3254	0	0	0.0	995.7	22.4	0.000	0.002	0.306	7.049	6629	13.9	2.038	342	10.5	19.0	1.5	8.779	699	0	20m.my8031_rel.cy9_1g
3288	0	0	0.0	1001.4	22.6	0.000	0.002	0.305	7.031	6668	13.9	2.028	338	10.5	19.0	1.5	7.820	699	0	20m.my8031_rel_o2_lto.cy9_1g
3291	0	0	0.0	1002.9	22.6	0.000	0.002	0.305	7.030	6661	13.5	2.024	328	10.4	19.0	1.5	9.884	699	0	20m.my8031_rel_native_lto.cy9_1g
3279	0	0	0.0	1006.1	22.6	0.000	0.002	0.307	7.068	6672	13.9	2.035	339	10.5	19.1	1.5	9.681	699	0	20m.my8031_rel_lto.cy9_1g
q100.1
q100.1: range queries with 100 insert/s per client
Performance metrics for all DBMS, not just the ones listed above. Some are normalized by throughput, others are not. Legend for results is here.
ips	qps	rps	rmbps	wps	wmbps	rpq	rkbpq	wpi	wkbpi	csps	cpups	cspq	cpupq	dbgb1	dbgb2	rss	maxop	p50	p99	tag
398	112	11	0.2	1005.5	16.8	0.101	1.655	2.525	43.320	7096	6.0	63.474	4293	10.9	19.5	1.5	1.202	16	0	20m.my8031_rel_withdbg.cy9_1g
398	113	11	0.2	1003.7	16.8	0.099	1.627	2.519	43.259	7078	6.0	62.747	4256	10.9	19.5	1.5	1.292	16	0	20m.my8031_rel_o2.cy9_1g
398	115	11	0.2	1006.5	16.9	0.096	1.559	2.526	43.485	7105	6.0	61.887	4181	10.9	19.5	1.5	1.233	16	0	20m.my8031_rel_native.cy9_1g
399	117	12	0.2	1016.1	17.1	0.101	1.648	2.549	43.842	7167	6.1	61.361	4178	10.9	19.5	1.5	1.213	16	0	20m.my8031_rel.cy9_1g
399	111	11	0.2	1005.7	16.8	0.103	1.677	2.523	43.222	7092	6.0	63.777	4317	10.9	19.5	1.5	1.331	16	0	20m.my8031_rel_o2_lto.cy9_1g
398	113	12	0.2	1009.5	16.9	0.104	1.705	2.534	43.459	7116	5.9	63.085	4184	10.9	19.5	1.5	1.368	16	0	20m.my8031_rel_native_lto.cy9_1g
399	113	12	0.2	1009.3	16.9	0.105	1.718	2.532	43.373	7119	5.9	62.830	4166	10.9	19.5	1.5	1.148	16	0	20m.my8031_rel_lto.cy9_1g
q500.1
q500.1: range queries with 500 insert/s per client
Performance metrics for all DBMS, not just the ones listed above. Some are normalized by throughput, others are not. Legend for results is here.
ips	qps	rps	rmbps	wps	wmbps	rpq	rkbpq	wpi	wkbpi	csps	cpups	cspq	cpupq	dbgb1	dbgb2	rss	maxop	p50	p99	tag
1007	68	8	0.1	979.5	16.9	0.114	1.914	0.973	17.211	6909	7.3	102.056	8626	12.0	20.6	1.5	1.599	16	0	20m.my8031_rel_withdbg.cy9_1g
985	67	8	0.1	966.1	16.7	0.112	1.903	0.980	17.326	6836	7.3	101.880	8704	12.0	20.6	1.5	1.491	16	0	20m.my8031_rel_o2.cy9_1g
995	68	8	0.1	977.3	16.9	0.117	1.976	0.982	17.352	6916	7.3	101.405	8563	12.0	20.6	1.5	1.193	16	0	20m.my8031_rel_native.cy9_1g
998	68	8	0.1	977.1	16.9	0.115	1.947	0.979	17.315	6915	7.3	101.846	8601	12.0	20.6	1.5	1.617	16	0	20m.my8031_rel.cy9_1g
1011	69	8	0.1	987.3	17.1	0.114	1.913	0.977	17.281	6972	7.4	101.629	8630	12.0	20.6	1.5	1.285	16	0	20m.my8031_rel_o2_lto.cy9_1g
1005	70	8	0.1	988.2	17.1	0.114	1.914	0.983	17.410	6957	7.3	99.809	8379	12.0	20.6	1.5	2.151	16	0	20m.my8031_rel_native_lto.cy9_1g
1012	69	8	0.1	989.3	17.1	0.115	1.957	0.978	17.304	6976	7.3	101.396	8488	12.0	20.6	1.5	1.268	16	0	20m.my8031_rel_lto.cy9_1g
q1000.1
q1000.1: range queries with 1000 insert/s per client
Performance metrics for all DBMS, not just the ones listed above. Some are normalized by throughput, others are not. Legend for results is here.
ips	qps	rps	rmbps	wps	wmbps	rpq	rkbpq	wpi	wkbpi	csps	cpups	cspq	cpupq	dbgb1	dbgb2	rss	maxop	p50	p99	tag
681	44	5	0.1	685.7	11.8	0.109	1.947	1.007	17.696	5044	5.2	113.849	9391	13.7	22.3	1.4	1.826	16	0	20m.my8031_rel_withdbg.cy9_1g
678	44	5	0.1	682.8	11.7	0.105	1.886	1.007	17.664	5016	5.3	113.749	9615	13.7	22.3	1.4	1.922	16	0	20m.my8031_rel_o2.cy9_1g
675	44	5	0.1	682.0	11.7	0.107	1.924	1.010	17.715	5027	5.2	114.781	9498	13.7	22.3	1.4	1.704	16	0	20m.my8031_rel_native.cy9_1g
675	44	5	0.1	683.4	11.7	0.106	1.918	1.012	17.776	5049	5.2	113.982	9390	13.7	22.3	1.3	2.167	16	0	20m.my8031_rel.cy9_1g
684	44	5	0.1	686.3	11.8	0.104	1.876	1.004	17.638	5044	5.2	114.116	9412	13.7	22.3	1.4	2.414	16	0	20m.my8031_rel_o2_lto.cy9_1g
681	45	5	0.1	686.9	11.8	0.106	1.899	1.008	17.724	5043	5.2	112.826	9307	13.7	22.3	1.4	2.192	16	0	20m.my8031_rel_native_lto.cy9_1g
686	44	5	0.1	688.2	11.8	0.107	1.933	1.003	17.590	5056	5.2	114.659	9433	13.7	22.3	1.4	1.857	16	0	20m.my8031_rel_lto.cy9_1g
l.i0
- l.i0: load without secondary indexes
- Legend for results is here.
- Each entry lists the percentage of responses that fit in that bucket (slower than max time for previous bucket, faster than min time for next bucket).
Insert response time histogram
256us	1ms	4ms	16ms	64ms	256ms	1s	4s	16s	gt	max	tag
0.000	0.000	91.645	6.229	2.016	0.110	0.000	0.000	0.000	0.000	0.164	my8031_rel_withdbg.cy9_1g
0.000	0.000	90.329	7.504	2.062	0.105	0.000	0.000	0.000	0.000	0.148	my8031_rel_o2.cy9_1g
0.000	0.000	91.381	6.581	1.948	0.090	0.000	0.000	0.000	0.000	0.138	my8031_rel_native.cy9_1g
0.000	0.000	91.709	6.193	1.991	0.107	0.000	0.000	0.000	0.000	0.203	my8031_rel.cy9_1g
0.000	0.000	91.677	6.103	2.067	0.152	0.001	0.000	0.000	0.000	0.279	my8031_rel_o2_lto.cy9_1g
0.000	0.000	91.722	6.107	2.034	0.136	0.000	0.000	0.000	0.000	0.221	my8031_rel_native_lto.cy9_1g
0.000	0.000	90.701	7.107	2.106	0.086	0.000	0.000	0.000	0.000	0.156	my8031_rel_lto.cy9_1g
l.x
- l.x: create secondary indexes
- Legend for results is here.
- Each entry lists the percentage of responses that fit in that bucket (slower than max time for previous bucket, faster than min time for next bucket).
TODO - determine whether there is data for create index response time
l.i1
- l.i1: continue load after secondary indexes created
- Legend for results is here.
- Each entry lists the percentage of responses that fit in that bucket (slower than max time for previous bucket, faster than min time for next bucket).
Insert response time histogram
256us	1ms	4ms	16ms	64ms	256ms	1s	4s	16s	gt	max	tag
0.000	0.000	0.005	23.493	44.478	30.714	1.124	0.163	0.023	0.000	8.345	my8031_rel_withdbg.cy9_1g
0.000	0.000	0.003	20.706	47.129	30.875	1.106	0.155	0.025	0.000	8.678	my8031_rel_o2.cy9_1g
0.000	0.000	0.013	21.872	46.278	30.514	1.125	0.181	0.018	0.000	7.644	my8031_rel_native.cy9_1g
0.000	0.000	0.004	21.808	46.379	30.457	1.155	0.173	0.023	0.000	8.779	my8031_rel.cy9_1g
0.000	0.000	0.015	23.681	44.494	30.473	1.147	0.167	0.023	0.000	7.820	my8031_rel_o2_lto.cy9_1g
0.000	0.000	0.014	24.817	43.240	30.630	1.111	0.166	0.021	0.000	9.884	my8031_rel_native_lto.cy9_1g
0.000	0.000	0.009	22.774	45.093	30.933	0.993	0.177	0.021	0.000	9.681	my8031_rel_lto.cy9_1g
q100.1
- q100.1: range queries with 100 insert/s per client
- Legend for results is here.
- Each entry lists the percentage of responses that fit in that bucket (slower than max time for previous bucket, faster than min time for next bucket).
Query response time histogram
256us	1ms	4ms	16ms	64ms	256ms	1s	4s	16s	gt	max	tag
0.003	23.225	3.872	25.013	32.988	13.357	1.541	nonzero	0.000	0.000	1.202	my8031_rel_withdbg.cy9_1g
0.002	23.241	3.896	24.964	32.820	13.642	1.434	nonzero	0.000	0.000	1.292	my8031_rel_o2.cy9_1g
0.002	23.338	3.957	25.634	32.659	12.963	1.445	0.001	0.000	0.000	1.233	my8031_rel_native.cy9_1g
0.002	23.483	4.024	25.631	32.815	12.605	1.438	0.001	0.000	0.000	1.213	my8031_rel.cy9_1g
0.000	23.274	3.798	25.298	32.643	13.414	1.570	0.002	0.000	0.000	1.331	my8031_rel_o2_lto.cy9_1g
0.005	22.976	3.889	25.758	33.240	12.471	1.661	0.002	0.000	0.000	1.368	my8031_rel_native_lto.cy9_1g
0.011	23.324	3.698	25.375	32.993	13.085	1.513	nonzero	0.000	0.000	1.148	my8031_rel_lto.cy9_1g
Insert response time histogram
256us	1ms	4ms	16ms	64ms	256ms	1s	4s	16s	gt	max	tag
0.000	0.000	0.000	0.215	2.306	49.326	46.604	1.549	0.000	0.000	2.491	my8031_rel_withdbg.cy9_1g
0.000	0.000	0.000	0.201	2.486	50.944	44.882	1.486	0.000	0.000	1.800	my8031_rel_o2.cy9_1g
0.000	0.000	0.000	0.188	2.229	50.299	45.465	1.819	0.000	0.000	1.775	my8031_rel_native.cy9_1g
0.000	0.000	0.000	0.243	2.278	51.396	44.340	1.743	0.000	0.000	1.825	my8031_rel.cy9_1g
0.000	0.000	0.000	0.174	2.382	48.750	47.188	1.507	0.000	0.000	2.011	my8031_rel_o2_lto.cy9_1g
0.000	0.000	0.000	0.146	2.229	50.688	45.153	1.785	0.000	0.000	2.072	my8031_rel_native_lto.cy9_1g
0.000	0.000	0.000	0.146	2.493	50.097	45.757	1.507	0.000	0.000	1.765	my8031_rel_lto.cy9_1g
q500.1
- q500.1: range queries with 500 insert/s per client
- Legend for results is here.
- Each entry lists the percentage of responses that fit in that bucket (slower than max time for previous bucket, faster than min time for next bucket).
Query response time histogram
256us	1ms	4ms	16ms	64ms	256ms	1s	4s	16s	gt	max	tag
0.002	16.683	3.470	18.482	33.790	23.452	4.113	0.007	0.000	0.000	1.599	my8031_rel_withdbg.cy9_1g
nonzero	16.820	3.656	18.334	33.302	23.653	4.228	0.008	0.000	0.000	1.491	my8031_rel_o2.cy9_1g
0.000	16.756	3.580	18.895	33.577	22.977	4.210	0.005	0.000	0.000	1.193	my8031_rel_native.cy9_1g
0.001	16.680	3.573	18.602	33.552	23.455	4.132	0.005	0.000	0.000	1.617	my8031_rel.cy9_1g
nonzero	16.976	3.550	18.664	33.471	23.262	4.071	0.005	0.000	0.000	1.285	my8031_rel_o2_lto.cy9_1g
nonzero	17.200	3.468	19.101	33.915	22.239	4.071	0.006	0.000	0.000	2.151	my8031_rel_native_lto.cy9_1g
0.006	16.671	3.415	18.798	34.131	22.901	4.075	0.004	0.000	0.000	1.268	my8031_rel_lto.cy9_1g
Insert response time histogram
256us	1ms	4ms	16ms	64ms	256ms	1s	4s	16s	gt	max	tag
0.000	0.000	0.000	1.765	8.981	64.606	24.501	0.147	0.000	0.000	1.626	my8031_rel_withdbg.cy9_1g
0.000	0.000	0.000	1.674	8.947	63.731	25.418	0.231	0.000	0.000	1.739	my8031_rel_o2.cy9_1g
0.000	0.000	0.000	1.679	8.710	64.281	25.215	0.115	0.000	0.000	1.663	my8031_rel_native.cy9_1g
0.000	0.000	0.000	1.807	8.549	64.833	24.643	0.168	0.000	0.000	1.538	my8031_rel.cy9_1g
0.000	0.000	0.000	1.794	8.769	65.038	24.274	0.125	0.000	0.000	1.724	my8031_rel_o2_lto.cy9_1g
0.000	0.000	0.004	1.822	9.122	64.681	24.207	0.164	0.000	0.000	1.814	my8031_rel_native_lto.cy9_1g
0.000	0.000	0.000	1.753	8.772	65.451	23.858	0.165	0.000	0.000	1.591	my8031_rel_lto.cy9_1g
q1000.1
- q1000.1: range queries with 1000 insert/s per client
- Legend for results is here.
- Each entry lists the percentage of responses that fit in that bucket (slower than max time for previous bucket, faster than min time for next bucket).
Query response time histogram
256us	1ms	4ms	16ms	64ms	256ms	1s	4s	16s	gt	max	tag
0.001	16.142	2.817	12.087	31.016	27.777	10.078	0.081	0.000	0.000	1.826	my8031_rel_withdbg.cy9_1g
nonzero	16.121	2.981	12.110	30.300	28.359	10.054	0.074	0.000	0.000	1.922	my8031_rel_o2.cy9_1g
nonzero	16.095	2.879	12.119	30.413	28.200	10.228	0.065	0.000	0.000	1.704	my8031_rel_native.cy9_1g
0.001	16.193	2.776	12.150	30.744	28.022	10.042	0.071	0.000	0.000	2.167	my8031_rel.cy9_1g
0.001	16.101	2.757	11.993	30.635	28.433	10.013	0.068	0.000	0.000	2.414	my8031_rel_o2_lto.cy9_1g
0.003	16.390	2.623	12.141	31.153	27.687	9.935	0.068	0.000	0.000	2.192	my8031_rel_native_lto.cy9_1g
0.005	16.025	2.637	12.028	30.974	28.194	10.073	0.064	0.000	0.000	1.857	my8031_rel_lto.cy9_1g
Insert response time histogram
256us	1ms	4ms	16ms	64ms	256ms	1s	4s	16s	gt	max	tag
0.000	0.000	0.000	2.028	3.912	50.514	42.077	1.469	0.000	0.000	2.819	my8031_rel_withdbg.cy9_1g
0.000	0.000	0.000	2.057	4.108	49.837	42.503	1.496	0.000	0.000	2.397	my8031_rel_o2.cy9_1g
0.000	0.000	0.000	2.017	3.928	50.019	42.483	1.552	0.000	0.000	2.574	my8031_rel_native.cy9_1g
0.000	0.000	0.000	2.006	3.700	50.059	42.707	1.528	0.000	0.000	2.661	my8031_rel.cy9_1g
0.000	0.000	0.000	2.167	3.949	50.260	42.179	1.445	0.000	0.000	3.074	my8031_rel_o2_lto.cy9_1g
0.000	0.000	0.001	2.133	3.889	50.798	41.594	1.585	0.000	0.000	2.259	my8031_rel_native_lto.cy9_1g
0.000	0.000	0.000	2.120	3.958	50.949	41.556	1.416	0.000	0.000	2.478	my8031_rel_lto.cy9_1g