Introduction
This is a report for the insert benchmark with 20M docs and 4 client(s). It is generated by scripts (bash, awk, sed) and Tufte might not be impressed. An overview of the insert benchmark is here and a short update is here. Below, by DBMS, I mean DBMS+version.config. An example is my8020.c10b40 where my means MySQL, 8020 is version 8.0.20 and c10b40 is the name for the configuration file.
The test server has 8 AMD cores, 16G RAM and an NVMe SSD. It is described here as the Beelink. The benchmark was run with 4 clients and there were 1 or 2 connections per client (1 for queries, 1 for inserts). The benchmark loads 20M rows without secondary indexes, creates secondary indexes, loads another 20M rows then does 3 read+write tests for one hour each that do queries as fast as possible with 100, 500 and then 1000 writes/second/client concurrent with the queries. There is 1 table per client. The database is cached by the storage engine and the only IO is for writes. Clients and the DBMS share one server. The per-database configs are in the per-database subdirectories here.
The tested DBMS are:
- my8031_rel_withdbg.cy9 - InnoDB and MySQL 8.0.31, the cy9 config and compiled with CMAKE_BUILD_TYPE=RelWitDebInfo -O2 -flto
- my8031_rel_o2.cy9 - InnoDB and MySQL 8.0.31, the cy9 config and compiled with CMAKE_BUILD_TYPE=Release -O2
- my8031_rel_native.cy9 - InnoDB and MySQL 8.0.31, the cy9 config and compiled with CMAKE_BUILD_TYPE=Release -O3 -march=native -mtune=native
- my8031_rel.cy9 - InnoDB and MySQL 8.0.31, the cy9 config and compiled with CMAKE_BUILD_TYPE=Release -O3
- my8031_rel_o2_lto.cy9 - InnoDB and MySQL 8.0.31, the cy9 config and compiled with CMAKE_BUILD_TYPE=Release -O2 -flto
- my8031_rel_native_lto.cy9 - InnoDB and MySQL 8.0.31, the cy9 config and compiled with CMAKE_BUILD_TYPE=Release -O3 -flto -march=native -mtune=native
- my8031_rel_lto.cy9 - InnoDB and MySQL 8.0.31, the cy9 config and compiled with CMAKE_BUILD_TYPE=Release -O3 -flto
Contents
- Summary
- l.i0: load without secondary indexes
- l.x: create secondary indexes
- l.i1: continue load after secondary indexes created
- q100.1: range queries with 100 insert/s per client
- q500.1: range queries with 500 insert/s per client
- q1000.1: range queries with 1000 insert/s per client
Summary
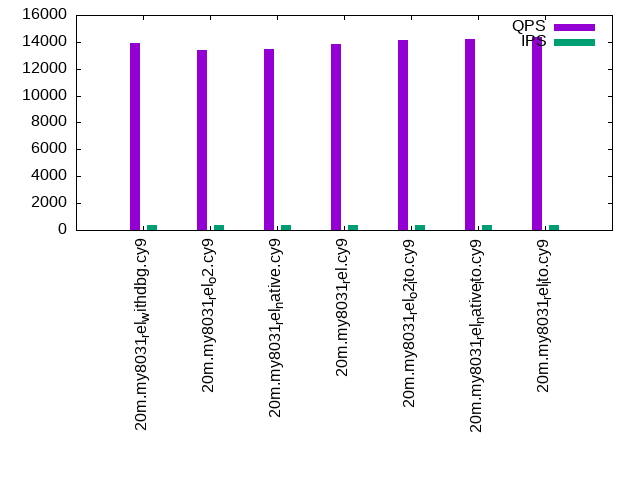
The numbers are inserts/s for l.i0 and l.i1, indexed docs (or rows) /s for l.x and queries/s for q*.2. The values are the average rate over the entire test for inserts (IPS) and queries (QPS). The range of values for IPS and QPS is split into 3 parts: bottom 25%, middle 50%, top 25%. Values in the bottom 25% have a red background, values in the top 25% have a green background and values in the middle have no color. A gray background is used for values that can be ignored because the DBMS did not sustain the target insert rate. Red backgrounds are not used when the minimum value is within 80% of the max value.
| dbms | l.i0 | l.x | l.i1 | q100.1 | q500.1 | q1000.1 |
|---|---|---|---|---|---|---|
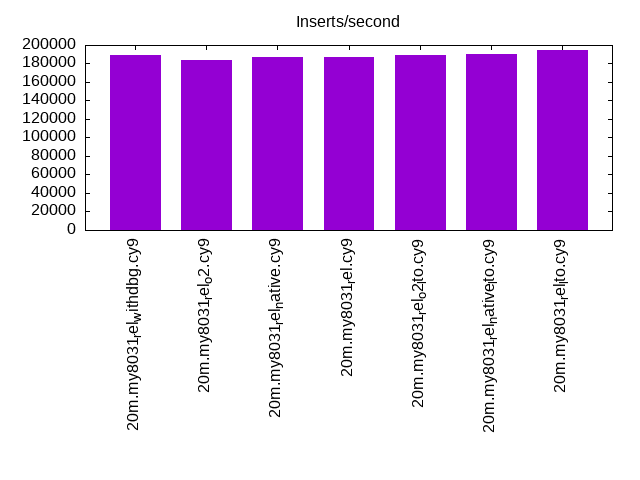
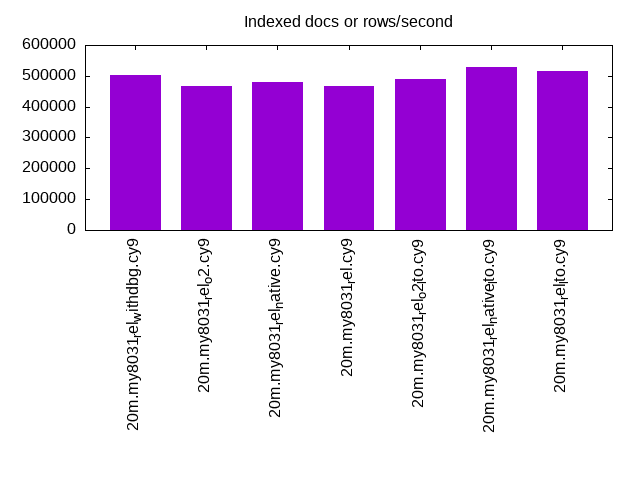
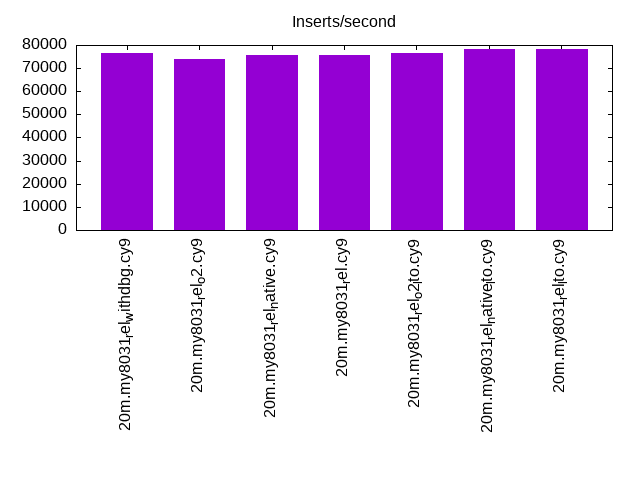
| 20m.my8031_rel_withdbg.cy9 | 188679 | 502500 | 76628 | 13889 | 13792 | 13865 |
| 20m.my8031_rel_o2.cy9 | 183486 | 467442 | 73801 | 13370 | 13205 | 13136 |
| 20m.my8031_rel_native.cy9 | 186916 | 478571 | 75758 | 13433 | 13308 | 13312 |
| 20m.my8031_rel.cy9 | 186916 | 467442 | 75472 | 13834 | 13768 | 13660 |
| 20m.my8031_rel_o2_lto.cy9 | 188679 | 490244 | 76628 | 14137 | 14084 | 13938 |
| 20m.my8031_rel_native_lto.cy9 | 190476 | 528947 | 78125 | 14250 | 14001 | 14105 |
| 20m.my8031_rel_lto.cy9 | 194175 | 515385 | 78431 | 14381 | 14196 | 14259 |
This table has relative throughput, throughput for the DBMS relative to the DBMS in the first line, using the absolute throughput from the previous table.
| dbms | l.i0 | l.x | l.i1 | q100.1 | q500.1 | q1000.1 |
|---|---|---|---|---|---|---|
| 20m.my8031_rel_withdbg.cy9 | 1.00 | 1.00 | 1.00 | 1.00 | 1.00 | 1.00 |
| 20m.my8031_rel_o2.cy9 | 0.97 | 0.93 | 0.96 | 0.96 | 0.96 | 0.95 |
| 20m.my8031_rel_native.cy9 | 0.99 | 0.95 | 0.99 | 0.97 | 0.96 | 0.96 |
| 20m.my8031_rel.cy9 | 0.99 | 0.93 | 0.98 | 1.00 | 1.00 | 0.99 |
| 20m.my8031_rel_o2_lto.cy9 | 1.00 | 0.98 | 1.00 | 1.02 | 1.02 | 1.01 |
| 20m.my8031_rel_native_lto.cy9 | 1.01 | 1.05 | 1.02 | 1.03 | 1.02 | 1.02 |
| 20m.my8031_rel_lto.cy9 | 1.03 | 1.03 | 1.02 | 1.04 | 1.03 | 1.03 |
This lists the average rate of inserts/s for the tests that do inserts concurrent with queries. For such tests the query rate is listed in the table above. The read+write tests are setup so that the insert rate should match the target rate every second. Cells that are not at least 95% of the target have a red background to indicate a failure to satisfy the target.
| dbms | q100.1 | q500.1 | q1000.1 |
|---|---|---|---|
| my8031_rel_withdbg.cy9 | 399 | 1994 | 3989 |
| my8031_rel_o2.cy9 | 399 | 1994 | 3989 |
| my8031_rel_native.cy9 | 399 | 1994 | 3987 |
| my8031_rel.cy9 | 399 | 1993 | 3989 |
| my8031_rel_o2_lto.cy9 | 399 | 1994 | 3989 |
| my8031_rel_native_lto.cy9 | 399 | 1994 | 3989 |
| my8031_rel_lto.cy9 | 399 | 1994 | 3989 |
| target | 400 | 2000 | 4000 |
l.i0
l.i0: load without secondary indexes. Graphs for performance per 1-second interval are here.
Average throughput:
Insert response time histogram: each cell has the percentage of responses that take <= the time in the header and max is the max response time in seconds. For the max column values in the top 25% of the range have a red background and in the bottom 25% of the range have a green background. The red background is not used when the min value is within 80% of the max value.
| dbms | 256us | 1ms | 4ms | 16ms | 64ms | 256ms | 1s | 4s | 16s | gt | max |
|---|---|---|---|---|---|---|---|---|---|---|---|
| my8031_rel_withdbg.cy9 | 99.234 | 0.636 | 0.110 | 0.019 | 0.121 | ||||||
| my8031_rel_o2.cy9 | 99.237 | 0.617 | 0.130 | 0.015 | 0.123 | ||||||
| my8031_rel_native.cy9 | 99.252 | 0.617 | 0.115 | 0.015 | 0.124 | ||||||
| my8031_rel.cy9 | 99.233 | 0.621 | 0.129 | 0.018 | 0.137 | ||||||
| my8031_rel_o2_lto.cy9 | 99.249 | 0.623 | 0.112 | 0.015 | 0.119 | ||||||
| my8031_rel_native_lto.cy9 | 99.252 | 0.615 | 0.118 | 0.015 | 0.116 | ||||||
| my8031_rel_lto.cy9 | 99.264 | 0.602 | 0.114 | 0.019 | 0.124 |
Performance metrics for the DBMS listed above. Some are normalized by throughput, others are not. Legend for results is here.
ips	qps	rps	rmbps	wps	wmbps	rpq	rkbpq	wpi	wkbpi	csps	cpups	cspq	cpupq	dbgb1	dbgb2	rss	maxop	p50	p99	tag
188679	0	0	0.0	344.5	51.5	0.000	0.000	0.002	0.280	20583	64.9	0.109	28	1.3	9.9	2.5	0.121	53861	5095	20m.my8031_rel_withdbg.cy9
183486	0	0	0.0	335.0	50.6	0.000	0.000	0.002	0.283	19996	64.8	0.109	28	1.3	9.9	2.5	0.123	52543	26571	20m.my8031_rel_o2.cy9
186916	0	0	0.0	341.5	51.2	0.000	0.000	0.002	0.281	20084	65.3	0.107	28	1.3	9.9	2.5	0.124	53260	34663	20m.my8031_rel_native.cy9
186916	0	0	0.0	341.4	51.2	0.000	0.000	0.002	0.281	20302	65.1	0.109	28	1.3	9.9	2.5	0.137	53342	14285	20m.my8031_rel.cy9
188679	0	0	0.0	348.2	51.7	0.000	0.000	0.002	0.281	20335	64.7	0.108	27	1.3	9.9	2.5	0.119	54341	6393	20m.my8031_rel_o2_lto.cy9
190476	0	0	0.0	340.6	52.8	0.000	0.000	0.002	0.284	21537	68.6	0.113	29	1.3	9.9	2.5	0.116	55240	35462	20m.my8031_rel_native_lto.cy9
194175	0	0	0.0	347.1	53.4	0.000	0.000	0.002	0.282	21771	68.7	0.112	28	1.3	9.9	2.5	0.124	56290	18680	20m.my8031_rel_lto.cy9
l.x
l.x: create secondary indexes.
Average throughput:
Performance metrics for the DBMS listed above. Some are normalized by throughput, others are not. Legend for results is here.
ips	qps	rps	rmbps	wps	wmbps	rpq	rkbpq	wpi	wkbpi	csps	cpups	cspq	cpupq	dbgb1	dbgb2	rss	maxop	p50	p99	tag
502500	0	3015	197.9	6553.4	446.3	0.006	0.403	0.013	0.910	20425	86.1	0.041	14	3.0	11.6	3.5	0.009	NA	NA	20m.my8031_rel_withdbg.cy9
467442	0	2640	173.3	6288.0	405.1	0.006	0.380	0.013	0.887	20487	87.7	0.044	15	3.0	11.6	3.6	0.009	NA	NA	20m.my8031_rel_o2.cy9
478571	0	2644	173.2	8382.6	442.5	0.006	0.371	0.018	0.947	25321	86.1	0.053	14	3.0	11.6	3.7	0.008	NA	NA	20m.my8031_rel_native.cy9
467442	0	2639	173.2	6062.3	401.9	0.006	0.379	0.013	0.880	20363	87.3	0.044	15	3.0	11.6	3.7	0.013	NA	NA	20m.my8031_rel.cy9
490244	0	2644	173.2	7882.5	434.2	0.005	0.362	0.016	0.907	24183	86.8	0.049	14	3.0	11.6	3.6	0.009	NA	NA	20m.my8031_rel_o2_lto.cy9
528947	0	3021	198.1	7962.1	479.6	0.006	0.383	0.015	0.928	25282	85.2	0.048	13	3.0	11.6	3.5	0.010	NA	NA	20m.my8031_rel_native_lto.cy9
515385	0	3015	197.9	6038.7	442.5	0.006	0.393	0.012	0.879	19920	86.1	0.039	13	3.0	11.6	3.8	0.007	NA	NA	20m.my8031_rel_lto.cy9
l.i1
l.i1: continue load after secondary indexes created. Graphs for performance per 1-second interval are here.
Average throughput:
Insert response time histogram: each cell has the percentage of responses that take <= the time in the header and max is the max response time in seconds. For the max column values in the top 25% of the range have a red background and in the bottom 25% of the range have a green background. The red background is not used when the min value is within 80% of the max value.
| dbms | 256us | 1ms | 4ms | 16ms | 64ms | 256ms | 1s | 4s | 16s | gt | max |
|---|---|---|---|---|---|---|---|---|---|---|---|
| my8031_rel_withdbg.cy9 | 98.100 | 1.634 | 0.249 | 0.016 | 0.118 | ||||||
| my8031_rel_o2.cy9 | 98.047 | 1.685 | 0.261 | 0.007 | 0.124 | ||||||
| my8031_rel_native.cy9 | 98.101 | 1.639 | 0.250 | 0.011 | 0.113 | ||||||
| my8031_rel.cy9 | 98.062 | 1.676 | 0.247 | 0.015 | 0.117 | ||||||
| my8031_rel_o2_lto.cy9 | 98.074 | 1.668 | 0.246 | 0.011 | 0.114 | ||||||
| my8031_rel_native_lto.cy9 | 98.139 | 1.602 | 0.249 | 0.009 | 0.121 | ||||||
| my8031_rel_lto.cy9 | 98.135 | 1.615 | 0.240 | 0.010 | 0.118 |
Performance metrics for the DBMS listed above. Some are normalized by throughput, others are not. Legend for results is here.
ips	qps	rps	rmbps	wps	wmbps	rpq	rkbpq	wpi	wkbpi	csps	cpups	cspq	cpupq	dbgb1	dbgb2	rss	maxop	p50	p99	tag
76628	0	352	5.5	1823.4	94.7	0.005	0.073	0.024	1.266	21147	58.8	0.276	61	7.9	16.5	8.4	0.118	20177	1748	20m.my8031_rel_withdbg.cy9
73801	0	338	5.3	1805.1	92.9	0.005	0.073	0.024	1.289	20615	58.6	0.279	64	7.9	16.5	8.4	0.124	19394	1648	20m.my8031_rel_o2.cy9
75758	0	352	5.5	1798.2	93.5	0.005	0.074	0.024	1.263	20883	59.0	0.276	62	7.9	16.5	8.4	0.113	19780	1848	20m.my8031_rel_native.cy9
75472	0	352	5.5	1801.0	93.5	0.005	0.075	0.024	1.269	20871	59.1	0.277	63	7.9	16.5	8.4	0.117	19878	1648	20m.my8031_rel.cy9
76628	0	352	5.5	1819.2	95.0	0.005	0.073	0.024	1.270	21113	58.9	0.276	61	7.9	16.5	8.4	0.114	20078	1798	20m.my8031_rel_o2_lto.cy9
78125	0	358	5.6	1835.2	95.9	0.005	0.073	0.023	1.257	21421	59.0	0.274	60	7.9	16.5	8.4	0.121	20486	1798	20m.my8031_rel_native_lto.cy9
78431	0	358	5.6	1835.7	96.1	0.005	0.073	0.023	1.255	21432	58.8	0.273	60	7.9	16.5	8.4	0.118	20535	1798	20m.my8031_rel_lto.cy9
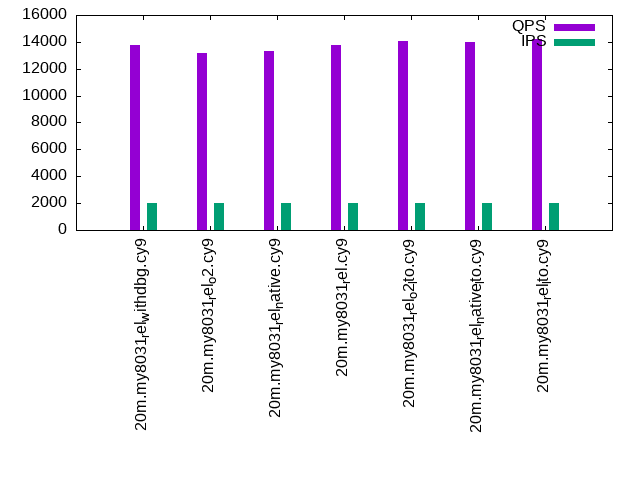
q100.1
q100.1: range queries with 100 insert/s per client. Graphs for performance per 1-second interval are here.
Average throughput:
Query response time histogram: each cell has the percentage of responses that take <= the time in the header and max is the max response time in seconds. For max values in the top 25% of the range have a red background and in the bottom 25% of the range have a green background. The red background is not used when the min value is within 80% of the max value.
| dbms | 256us | 1ms | 4ms | 16ms | 64ms | 256ms | 1s | 4s | 16s | gt | max |
|---|---|---|---|---|---|---|---|---|---|---|---|
| my8031_rel_withdbg.cy9 | 47.594 | 52.401 | 0.005 | nonzero | nonzero | 0.017 | |||||
| my8031_rel_o2.cy9 | 42.425 | 57.569 | 0.006 | nonzero | nonzero | 0.023 | |||||
| my8031_rel_native.cy9 | 43.171 | 56.824 | 0.005 | nonzero | nonzero | 0.021 | |||||
| my8031_rel.cy9 | 47.478 | 52.517 | 0.005 | nonzero | nonzero | 0.018 | |||||
| my8031_rel_o2_lto.cy9 | 50.291 | 49.703 | 0.005 | nonzero | nonzero | 0.022 | |||||
| my8031_rel_native_lto.cy9 | 52.194 | 47.801 | 0.005 | nonzero | nonzero | 0.026 | |||||
| my8031_rel_lto.cy9 | 53.448 | 46.547 | 0.005 | nonzero | nonzero | 0.021 |
Insert response time histogram: each cell has the percentage of responses that take <= the time in the header and max is the max response time in seconds. For max values in the top 25% of the range have a red background and in the bottom 25% of the range have a green background. The red background is not used when the min value is within 80% of the max value.
| dbms | 256us | 1ms | 4ms | 16ms | 64ms | 256ms | 1s | 4s | 16s | gt | max |
|---|---|---|---|---|---|---|---|---|---|---|---|
| my8031_rel_withdbg.cy9 | 98.396 | 0.861 | 0.743 | 0.026 | |||||||
| my8031_rel_o2.cy9 | 98.500 | 0.674 | 0.826 | 0.025 | |||||||
| my8031_rel_native.cy9 | 98.667 | 0.556 | 0.778 | 0.030 | |||||||
| my8031_rel.cy9 | 98.569 | 0.618 | 0.812 | 0.028 | |||||||
| my8031_rel_o2_lto.cy9 | 98.174 | 1.076 | 0.750 | 0.031 | |||||||
| my8031_rel_native_lto.cy9 | 98.639 | 0.562 | 0.799 | 0.030 | |||||||
| my8031_rel_lto.cy9 | 98.250 | 1.007 | 0.743 | 0.024 |
Performance metrics for the DBMS listed above. Some are normalized by throughput, others are not. Legend for results is here.
ips	qps	rps	rmbps	wps	wmbps	rpq	rkbpq	wpi	wkbpi	csps	cpups	cspq	cpupq	dbgb1	dbgb2	rss	maxop	p50	p99	tag
399	13889	0	0.0	223.6	6.0	0.000	0.000	0.561	15.300	53748	50.2	3.870	289	8.4	17.0	8.8	0.017	3516	2862	20m.my8031_rel_withdbg.cy9
399	13370	0	0.0	223.9	6.0	0.000	0.000	0.561	15.318	51735	50.3	3.870	301	8.4	17.0	8.8	0.023	3292	2749	20m.my8031_rel_o2.cy9
399	13433	0	0.0	222.9	5.9	0.000	0.000	0.559	15.228	51962	50.3	3.868	300	8.4	17.0	8.8	0.021	3324	2735	20m.my8031_rel_native.cy9
399	13834	0	0.0	225.9	6.0	0.000	0.000	0.566	15.423	53510	50.3	3.868	291	8.4	17.0	8.8	0.018	3452	2813	20m.my8031_rel.cy9
399	14137	0	0.0	227.4	6.0	0.000	0.000	0.570	15.532	54669	50.1	3.867	284	8.4	17.0	8.8	0.022	3468	2909	20m.my8031_rel_o2_lto.cy9
399	14250	0	0.0	224.0	6.0	0.000	0.000	0.562	15.343	55058	50.2	3.864	282	8.4	17.0	8.8	0.026	3532	2894	20m.my8031_rel_native_lto.cy9
399	14381	0	0.0	221.9	5.9	0.000	0.000	0.556	15.179	55595	50.3	3.866	280	8.4	17.0	8.8	0.021	3644	2925	20m.my8031_rel_lto.cy9
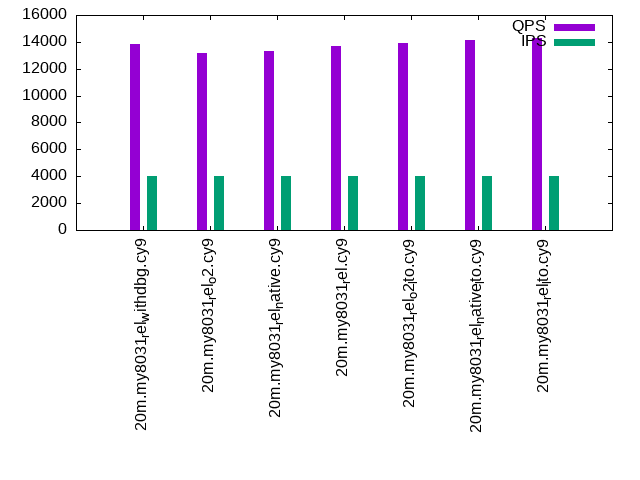
q500.1
q500.1: range queries with 500 insert/s per client. Graphs for performance per 1-second interval are here.
Average throughput:
Query response time histogram: each cell has the percentage of responses that take <= the time in the header and max is the max response time in seconds. For max values in the top 25% of the range have a red background and in the bottom 25% of the range have a green background. The red background is not used when the min value is within 80% of the max value.
| dbms | 256us | 1ms | 4ms | 16ms | 64ms | 256ms | 1s | 4s | 16s | gt | max |
|---|---|---|---|---|---|---|---|---|---|---|---|
| my8031_rel_withdbg.cy9 | 46.244 | 53.738 | 0.017 | 0.001 | nonzero | 0.021 | |||||
| my8031_rel_o2.cy9 | 39.916 | 60.066 | 0.016 | 0.002 | nonzero | 0.025 | |||||
| my8031_rel_native.cy9 | 41.435 | 58.547 | 0.016 | 0.001 | nonzero | 0.022 | |||||
| my8031_rel.cy9 | 46.600 | 53.382 | 0.016 | 0.002 | nonzero | 0.028 | |||||
| my8031_rel_o2_lto.cy9 | 49.403 | 50.580 | 0.016 | 0.002 | nonzero | 0.022 | |||||
| my8031_rel_native_lto.cy9 | 48.953 | 51.030 | 0.016 | 0.001 | nonzero | 0.021 | |||||
| my8031_rel_lto.cy9 | 51.376 | 48.607 | 0.015 | 0.002 | nonzero | 0.022 |
Insert response time histogram: each cell has the percentage of responses that take <= the time in the header and max is the max response time in seconds. For max values in the top 25% of the range have a red background and in the bottom 25% of the range have a green background. The red background is not used when the min value is within 80% of the max value.
| dbms | 256us | 1ms | 4ms | 16ms | 64ms | 256ms | 1s | 4s | 16s | gt | max |
|---|---|---|---|---|---|---|---|---|---|---|---|
| my8031_rel_withdbg.cy9 | 97.597 | 2.044 | 0.331 | 0.028 | 0.106 | ||||||
| my8031_rel_o2.cy9 | 94.476 | 5.040 | 0.390 | 0.093 | 0.125 | ||||||
| my8031_rel_native.cy9 | 96.672 | 2.936 | 0.353 | 0.039 | 0.110 | ||||||
| my8031_rel.cy9 | 96.774 | 2.800 | 0.351 | 0.075 | 0.107 | ||||||
| my8031_rel_o2_lto.cy9 | 96.157 | 3.393 | 0.372 | 0.078 | 0.110 | ||||||
| my8031_rel_native_lto.cy9 | 97.372 | 2.233 | 0.354 | 0.040 | 0.108 | ||||||
| my8031_rel_lto.cy9 | 96.476 | 3.138 | 0.367 | 0.019 | 0.107 |
Performance metrics for the DBMS listed above. Some are normalized by throughput, others are not. Legend for results is here.
ips	qps	rps	rmbps	wps	wmbps	rpq	rkbpq	wpi	wkbpi	csps	cpups	cspq	cpupq	dbgb1	dbgb2	rss	maxop	p50	p99	tag
1994	13792	0	0.0	243.3	7.4	0.000	0.000	0.122	3.774	52943	51.3	3.839	298	9.5	18.0	9.8	0.021	3500	2862	20m.my8031_rel_withdbg.cy9
1994	13205	0	0.0	244.5	7.4	0.000	0.000	0.123	3.782	50665	51.3	3.837	311	9.5	18.0	9.8	0.025	3244	2701	20m.my8031_rel_o2.cy9
1994	13308	0	0.0	245.3	7.4	0.000	0.000	0.123	3.805	51127	51.3	3.842	308	9.5	18.0	9.8	0.022	3294	2765	20m.my8031_rel_native.cy9
1993	13768	0	0.0	244.5	7.4	0.000	0.000	0.123	3.790	52888	51.4	3.842	299	9.5	18.0	9.8	0.028	3404	2861	20m.my8031_rel.cy9
1994	14084	0	0.0	242.8	7.3	0.000	0.000	0.122	3.768	54008	51.2	3.835	291	9.5	18.0	9.8	0.022	3468	2862	20m.my8031_rel_o2_lto.cy9
1994	14001	0	0.0	242.7	7.3	0.000	0.000	0.122	3.770	53742	51.2	3.838	293	9.5	18.0	9.8	0.021	3404	2893	20m.my8031_rel_native_lto.cy9
1994	14196	0	0.0	244.4	7.4	0.000	0.000	0.123	3.795	54466	51.3	3.837	289	9.5	18.0	9.7	0.022	3484	2909	20m.my8031_rel_lto.cy9
q1000.1
q1000.1: range queries with 1000 insert/s per client. Graphs for performance per 1-second interval are here.
Average throughput:
Query response time histogram: each cell has the percentage of responses that take <= the time in the header and max is the max response time in seconds. For max values in the top 25% of the range have a red background and in the bottom 25% of the range have a green background. The red background is not used when the min value is within 80% of the max value.
| dbms | 256us | 1ms | 4ms | 16ms | 64ms | 256ms | 1s | 4s | 16s | gt | max |
|---|---|---|---|---|---|---|---|---|---|---|---|
| my8031_rel_withdbg.cy9 | 46.262 | 53.703 | 0.033 | 0.002 | nonzero | 0.022 | |||||
| my8031_rel_o2.cy9 | 37.861 | 62.100 | 0.037 | 0.003 | nonzero | 0.021 | |||||
| my8031_rel_native.cy9 | 40.420 | 59.549 | 0.028 | 0.003 | nonzero | 0.026 | |||||
| my8031_rel.cy9 | 44.215 | 55.751 | 0.031 | 0.003 | nonzero | 0.020 | |||||
| my8031_rel_o2_lto.cy9 | 47.122 | 52.847 | 0.029 | 0.003 | nonzero | 0.023 | |||||
| my8031_rel_native_lto.cy9 | 49.477 | 50.487 | 0.033 | 0.002 | nonzero | 0.020 | |||||
| my8031_rel_lto.cy9 | 51.424 | 48.541 | 0.033 | 0.003 | nonzero | 0.020 |
Insert response time histogram: each cell has the percentage of responses that take <= the time in the header and max is the max response time in seconds. For max values in the top 25% of the range have a red background and in the bottom 25% of the range have a green background. The red background is not used when the min value is within 80% of the max value.
| dbms | 256us | 1ms | 4ms | 16ms | 64ms | 256ms | 1s | 4s | 16s | gt | max |
|---|---|---|---|---|---|---|---|---|---|---|---|
| my8031_rel_withdbg.cy9 | 97.181 | 2.655 | 0.111 | 0.053 | 0.109 | ||||||
| my8031_rel_o2.cy9 | 97.591 | 2.297 | 0.097 | 0.015 | 0.114 | ||||||
| my8031_rel_native.cy9 | 95.101 | 4.673 | 0.151 | 0.074 | 0.112 | ||||||
| my8031_rel.cy9 | 95.766 | 4.008 | 0.160 | 0.066 | 0.109 | ||||||
| my8031_rel_o2_lto.cy9 | 95.562 | 4.212 | 0.149 | 0.077 | 0.107 | ||||||
| my8031_rel_native_lto.cy9 | 97.936 | 1.935 | 0.114 | 0.015 | 0.108 | ||||||
| my8031_rel_lto.cy9 | 97.274 | 2.551 | 0.132 | 0.043 | 0.110 |
Performance metrics for the DBMS listed above. Some are normalized by throughput, others are not. Legend for results is here.
ips	qps	rps	rmbps	wps	wmbps	rpq	rkbpq	wpi	wkbpi	csps	cpups	cspq	cpupq	dbgb1	dbgb2	rss	maxop	p50	p99	tag
3989	13865	0	0.0	376.2	10.9	0.000	0.000	0.094	2.809	52736	52.7	3.803	304	10.0	18.6	10.3	0.022	3435	2877	20m.my8031_rel_withdbg.cy9
3989	13136	0	0.0	367.4	10.7	0.000	0.000	0.092	2.750	49936	52.8	3.801	322	10.0	18.6	10.3	0.021	3228	2717	20m.my8031_rel_o2.cy9
3987	13312	0	0.0	367.8	10.7	0.000	0.000	0.092	2.756	50572	52.7	3.799	317	10.1	18.6	10.3	0.026	3262	2749	20m.my8031_rel_native.cy9
3989	13660	0	0.0	368.2	10.7	0.000	0.000	0.092	2.757	51862	52.8	3.797	309	10.0	18.6	10.3	0.020	3405	2845	20m.my8031_rel.cy9
3989	13938	0	0.0	371.6	10.8	0.000	0.000	0.093	2.777	52888	52.6	3.795	302	10.0	18.6	10.3	0.023	3452	2877	20m.my8031_rel_o2_lto.cy9
3989	14105	0	0.0	372.7	10.8	0.000	0.000	0.093	2.784	53652	52.6	3.804	298	10.0	18.6	10.3	0.020	3486	2925	20m.my8031_rel_native_lto.cy9
3989	14259	0	0.0	380.0	11.0	0.000	0.000	0.095	2.831	54257	52.7	3.805	296	10.0	18.6	10.3	0.020	3564	2973	20m.my8031_rel_lto.cy9
l.i0
l.i0: load without secondary indexes
Performance metrics for all DBMS, not just the ones listed above. Some are normalized by throughput, others are not. Legend for results is here.
ips	qps	rps	rmbps	wps	wmbps	rpq	rkbpq	wpi	wkbpi	csps	cpups	cspq	cpupq	dbgb1	dbgb2	rss	maxop	p50	p99	tag
188679	0	0	0.0	344.5	51.5	0.000	0.000	0.002	0.280	20583	64.9	0.109	28	1.3	9.9	2.5	0.121	53861	5095	20m.my8031_rel_withdbg.cy9
183486	0	0	0.0	335.0	50.6	0.000	0.000	0.002	0.283	19996	64.8	0.109	28	1.3	9.9	2.5	0.123	52543	26571	20m.my8031_rel_o2.cy9
186916	0	0	0.0	341.5	51.2	0.000	0.000	0.002	0.281	20084	65.3	0.107	28	1.3	9.9	2.5	0.124	53260	34663	20m.my8031_rel_native.cy9
186916	0	0	0.0	341.4	51.2	0.000	0.000	0.002	0.281	20302	65.1	0.109	28	1.3	9.9	2.5	0.137	53342	14285	20m.my8031_rel.cy9
188679	0	0	0.0	348.2	51.7	0.000	0.000	0.002	0.281	20335	64.7	0.108	27	1.3	9.9	2.5	0.119	54341	6393	20m.my8031_rel_o2_lto.cy9
190476	0	0	0.0	340.6	52.8	0.000	0.000	0.002	0.284	21537	68.6	0.113	29	1.3	9.9	2.5	0.116	55240	35462	20m.my8031_rel_native_lto.cy9
194175	0	0	0.0	347.1	53.4	0.000	0.000	0.002	0.282	21771	68.7	0.112	28	1.3	9.9	2.5	0.124	56290	18680	20m.my8031_rel_lto.cy9
l.x
l.x: create secondary indexes
Performance metrics for all DBMS, not just the ones listed above. Some are normalized by throughput, others are not. Legend for results is here.
ips	qps	rps	rmbps	wps	wmbps	rpq	rkbpq	wpi	wkbpi	csps	cpups	cspq	cpupq	dbgb1	dbgb2	rss	maxop	p50	p99	tag
502500	0	3015	197.9	6553.4	446.3	0.006	0.403	0.013	0.910	20425	86.1	0.041	14	3.0	11.6	3.5	0.009	NA	NA	20m.my8031_rel_withdbg.cy9
467442	0	2640	173.3	6288.0	405.1	0.006	0.380	0.013	0.887	20487	87.7	0.044	15	3.0	11.6	3.6	0.009	NA	NA	20m.my8031_rel_o2.cy9
478571	0	2644	173.2	8382.6	442.5	0.006	0.371	0.018	0.947	25321	86.1	0.053	14	3.0	11.6	3.7	0.008	NA	NA	20m.my8031_rel_native.cy9
467442	0	2639	173.2	6062.3	401.9	0.006	0.379	0.013	0.880	20363	87.3	0.044	15	3.0	11.6	3.7	0.013	NA	NA	20m.my8031_rel.cy9
490244	0	2644	173.2	7882.5	434.2	0.005	0.362	0.016	0.907	24183	86.8	0.049	14	3.0	11.6	3.6	0.009	NA	NA	20m.my8031_rel_o2_lto.cy9
528947	0	3021	198.1	7962.1	479.6	0.006	0.383	0.015	0.928	25282	85.2	0.048	13	3.0	11.6	3.5	0.010	NA	NA	20m.my8031_rel_native_lto.cy9
515385	0	3015	197.9	6038.7	442.5	0.006	0.393	0.012	0.879	19920	86.1	0.039	13	3.0	11.6	3.8	0.007	NA	NA	20m.my8031_rel_lto.cy9
l.i1
l.i1: continue load after secondary indexes created
Performance metrics for all DBMS, not just the ones listed above. Some are normalized by throughput, others are not. Legend for results is here.
ips	qps	rps	rmbps	wps	wmbps	rpq	rkbpq	wpi	wkbpi	csps	cpups	cspq	cpupq	dbgb1	dbgb2	rss	maxop	p50	p99	tag
76628	0	352	5.5	1823.4	94.7	0.005	0.073	0.024	1.266	21147	58.8	0.276	61	7.9	16.5	8.4	0.118	20177	1748	20m.my8031_rel_withdbg.cy9
73801	0	338	5.3	1805.1	92.9	0.005	0.073	0.024	1.289	20615	58.6	0.279	64	7.9	16.5	8.4	0.124	19394	1648	20m.my8031_rel_o2.cy9
75758	0	352	5.5	1798.2	93.5	0.005	0.074	0.024	1.263	20883	59.0	0.276	62	7.9	16.5	8.4	0.113	19780	1848	20m.my8031_rel_native.cy9
75472	0	352	5.5	1801.0	93.5	0.005	0.075	0.024	1.269	20871	59.1	0.277	63	7.9	16.5	8.4	0.117	19878	1648	20m.my8031_rel.cy9
76628	0	352	5.5	1819.2	95.0	0.005	0.073	0.024	1.270	21113	58.9	0.276	61	7.9	16.5	8.4	0.114	20078	1798	20m.my8031_rel_o2_lto.cy9
78125	0	358	5.6	1835.2	95.9	0.005	0.073	0.023	1.257	21421	59.0	0.274	60	7.9	16.5	8.4	0.121	20486	1798	20m.my8031_rel_native_lto.cy9
78431	0	358	5.6	1835.7	96.1	0.005	0.073	0.023	1.255	21432	58.8	0.273	60	7.9	16.5	8.4	0.118	20535	1798	20m.my8031_rel_lto.cy9
q100.1
q100.1: range queries with 100 insert/s per client
Performance metrics for all DBMS, not just the ones listed above. Some are normalized by throughput, others are not. Legend for results is here.
ips	qps	rps	rmbps	wps	wmbps	rpq	rkbpq	wpi	wkbpi	csps	cpups	cspq	cpupq	dbgb1	dbgb2	rss	maxop	p50	p99	tag
399	13889	0	0.0	223.6	6.0	0.000	0.000	0.561	15.300	53748	50.2	3.870	289	8.4	17.0	8.8	0.017	3516	2862	20m.my8031_rel_withdbg.cy9
399	13370	0	0.0	223.9	6.0	0.000	0.000	0.561	15.318	51735	50.3	3.870	301	8.4	17.0	8.8	0.023	3292	2749	20m.my8031_rel_o2.cy9
399	13433	0	0.0	222.9	5.9	0.000	0.000	0.559	15.228	51962	50.3	3.868	300	8.4	17.0	8.8	0.021	3324	2735	20m.my8031_rel_native.cy9
399	13834	0	0.0	225.9	6.0	0.000	0.000	0.566	15.423	53510	50.3	3.868	291	8.4	17.0	8.8	0.018	3452	2813	20m.my8031_rel.cy9
399	14137	0	0.0	227.4	6.0	0.000	0.000	0.570	15.532	54669	50.1	3.867	284	8.4	17.0	8.8	0.022	3468	2909	20m.my8031_rel_o2_lto.cy9
399	14250	0	0.0	224.0	6.0	0.000	0.000	0.562	15.343	55058	50.2	3.864	282	8.4	17.0	8.8	0.026	3532	2894	20m.my8031_rel_native_lto.cy9
399	14381	0	0.0	221.9	5.9	0.000	0.000	0.556	15.179	55595	50.3	3.866	280	8.4	17.0	8.8	0.021	3644	2925	20m.my8031_rel_lto.cy9
q500.1
q500.1: range queries with 500 insert/s per client
Performance metrics for all DBMS, not just the ones listed above. Some are normalized by throughput, others are not. Legend for results is here.
ips	qps	rps	rmbps	wps	wmbps	rpq	rkbpq	wpi	wkbpi	csps	cpups	cspq	cpupq	dbgb1	dbgb2	rss	maxop	p50	p99	tag
1994	13792	0	0.0	243.3	7.4	0.000	0.000	0.122	3.774	52943	51.3	3.839	298	9.5	18.0	9.8	0.021	3500	2862	20m.my8031_rel_withdbg.cy9
1994	13205	0	0.0	244.5	7.4	0.000	0.000	0.123	3.782	50665	51.3	3.837	311	9.5	18.0	9.8	0.025	3244	2701	20m.my8031_rel_o2.cy9
1994	13308	0	0.0	245.3	7.4	0.000	0.000	0.123	3.805	51127	51.3	3.842	308	9.5	18.0	9.8	0.022	3294	2765	20m.my8031_rel_native.cy9
1993	13768	0	0.0	244.5	7.4	0.000	0.000	0.123	3.790	52888	51.4	3.842	299	9.5	18.0	9.8	0.028	3404	2861	20m.my8031_rel.cy9
1994	14084	0	0.0	242.8	7.3	0.000	0.000	0.122	3.768	54008	51.2	3.835	291	9.5	18.0	9.8	0.022	3468	2862	20m.my8031_rel_o2_lto.cy9
1994	14001	0	0.0	242.7	7.3	0.000	0.000	0.122	3.770	53742	51.2	3.838	293	9.5	18.0	9.8	0.021	3404	2893	20m.my8031_rel_native_lto.cy9
1994	14196	0	0.0	244.4	7.4	0.000	0.000	0.123	3.795	54466	51.3	3.837	289	9.5	18.0	9.7	0.022	3484	2909	20m.my8031_rel_lto.cy9
q1000.1
q1000.1: range queries with 1000 insert/s per client
Performance metrics for all DBMS, not just the ones listed above. Some are normalized by throughput, others are not. Legend for results is here.
ips	qps	rps	rmbps	wps	wmbps	rpq	rkbpq	wpi	wkbpi	csps	cpups	cspq	cpupq	dbgb1	dbgb2	rss	maxop	p50	p99	tag
3989	13865	0	0.0	376.2	10.9	0.000	0.000	0.094	2.809	52736	52.7	3.803	304	10.0	18.6	10.3	0.022	3435	2877	20m.my8031_rel_withdbg.cy9
3989	13136	0	0.0	367.4	10.7	0.000	0.000	0.092	2.750	49936	52.8	3.801	322	10.0	18.6	10.3	0.021	3228	2717	20m.my8031_rel_o2.cy9
3987	13312	0	0.0	367.8	10.7	0.000	0.000	0.092	2.756	50572	52.7	3.799	317	10.1	18.6	10.3	0.026	3262	2749	20m.my8031_rel_native.cy9
3989	13660	0	0.0	368.2	10.7	0.000	0.000	0.092	2.757	51862	52.8	3.797	309	10.0	18.6	10.3	0.020	3405	2845	20m.my8031_rel.cy9
3989	13938	0	0.0	371.6	10.8	0.000	0.000	0.093	2.777	52888	52.6	3.795	302	10.0	18.6	10.3	0.023	3452	2877	20m.my8031_rel_o2_lto.cy9
3989	14105	0	0.0	372.7	10.8	0.000	0.000	0.093	2.784	53652	52.6	3.804	298	10.0	18.6	10.3	0.020	3486	2925	20m.my8031_rel_native_lto.cy9
3989	14259	0	0.0	380.0	11.0	0.000	0.000	0.095	2.831	54257	52.7	3.805	296	10.0	18.6	10.3	0.020	3564	2973	20m.my8031_rel_lto.cy9
l.i0
- l.i0: load without secondary indexes
- Legend for results is here.
- Each entry lists the percentage of responses that fit in that bucket (slower than max time for previous bucket, faster than min time for next bucket).
Insert response time histogram
256us	1ms	4ms	16ms	64ms	256ms	1s	4s	16s	gt	max	tag
0.000	0.000	99.234	0.636	0.110	0.019	0.000	0.000	0.000	0.000	0.121	my8031_rel_withdbg.cy9
0.000	0.000	99.237	0.617	0.130	0.015	0.000	0.000	0.000	0.000	0.123	my8031_rel_o2.cy9
0.000	0.000	99.252	0.617	0.115	0.015	0.000	0.000	0.000	0.000	0.124	my8031_rel_native.cy9
0.000	0.000	99.233	0.621	0.129	0.018	0.000	0.000	0.000	0.000	0.137	my8031_rel.cy9
0.000	0.000	99.249	0.623	0.112	0.015	0.000	0.000	0.000	0.000	0.119	my8031_rel_o2_lto.cy9
0.000	0.000	99.252	0.615	0.118	0.015	0.000	0.000	0.000	0.000	0.116	my8031_rel_native_lto.cy9
0.000	0.000	99.264	0.602	0.114	0.019	0.000	0.000	0.000	0.000	0.124	my8031_rel_lto.cy9
l.x
- l.x: create secondary indexes
- Legend for results is here.
- Each entry lists the percentage of responses that fit in that bucket (slower than max time for previous bucket, faster than min time for next bucket).
TODO - determine whether there is data for create index response time
l.i1
- l.i1: continue load after secondary indexes created
- Legend for results is here.
- Each entry lists the percentage of responses that fit in that bucket (slower than max time for previous bucket, faster than min time for next bucket).
Insert response time histogram
256us	1ms	4ms	16ms	64ms	256ms	1s	4s	16s	gt	max	tag
0.000	0.000	98.100	1.634	0.249	0.016	0.000	0.000	0.000	0.000	0.118	my8031_rel_withdbg.cy9
0.000	0.000	98.047	1.685	0.261	0.007	0.000	0.000	0.000	0.000	0.124	my8031_rel_o2.cy9
0.000	0.000	98.101	1.639	0.250	0.011	0.000	0.000	0.000	0.000	0.113	my8031_rel_native.cy9
0.000	0.000	98.062	1.676	0.247	0.015	0.000	0.000	0.000	0.000	0.117	my8031_rel.cy9
0.000	0.000	98.074	1.668	0.246	0.011	0.000	0.000	0.000	0.000	0.114	my8031_rel_o2_lto.cy9
0.000	0.000	98.139	1.602	0.249	0.009	0.000	0.000	0.000	0.000	0.121	my8031_rel_native_lto.cy9
0.000	0.000	98.135	1.615	0.240	0.010	0.000	0.000	0.000	0.000	0.118	my8031_rel_lto.cy9
q100.1
- q100.1: range queries with 100 insert/s per client
- Legend for results is here.
- Each entry lists the percentage of responses that fit in that bucket (slower than max time for previous bucket, faster than min time for next bucket).
Query response time histogram
256us	1ms	4ms	16ms	64ms	256ms	1s	4s	16s	gt	max	tag
47.594	52.401	0.005	nonzero	nonzero	0.000	0.000	0.000	0.000	0.000	0.017	my8031_rel_withdbg.cy9
42.425	57.569	0.006	nonzero	nonzero	0.000	0.000	0.000	0.000	0.000	0.023	my8031_rel_o2.cy9
43.171	56.824	0.005	nonzero	nonzero	0.000	0.000	0.000	0.000	0.000	0.021	my8031_rel_native.cy9
47.478	52.517	0.005	nonzero	nonzero	0.000	0.000	0.000	0.000	0.000	0.018	my8031_rel.cy9
50.291	49.703	0.005	nonzero	nonzero	0.000	0.000	0.000	0.000	0.000	0.022	my8031_rel_o2_lto.cy9
52.194	47.801	0.005	nonzero	nonzero	0.000	0.000	0.000	0.000	0.000	0.026	my8031_rel_native_lto.cy9
53.448	46.547	0.005	nonzero	nonzero	0.000	0.000	0.000	0.000	0.000	0.021	my8031_rel_lto.cy9
Insert response time histogram
256us	1ms	4ms	16ms	64ms	256ms	1s	4s	16s	gt	max	tag
0.000	0.000	98.396	0.861	0.743	0.000	0.000	0.000	0.000	0.000	0.026	my8031_rel_withdbg.cy9
0.000	0.000	98.500	0.674	0.826	0.000	0.000	0.000	0.000	0.000	0.025	my8031_rel_o2.cy9
0.000	0.000	98.667	0.556	0.778	0.000	0.000	0.000	0.000	0.000	0.030	my8031_rel_native.cy9
0.000	0.000	98.569	0.618	0.812	0.000	0.000	0.000	0.000	0.000	0.028	my8031_rel.cy9
0.000	0.000	98.174	1.076	0.750	0.000	0.000	0.000	0.000	0.000	0.031	my8031_rel_o2_lto.cy9
0.000	0.000	98.639	0.562	0.799	0.000	0.000	0.000	0.000	0.000	0.030	my8031_rel_native_lto.cy9
0.000	0.000	98.250	1.007	0.743	0.000	0.000	0.000	0.000	0.000	0.024	my8031_rel_lto.cy9
q500.1
- q500.1: range queries with 500 insert/s per client
- Legend for results is here.
- Each entry lists the percentage of responses that fit in that bucket (slower than max time for previous bucket, faster than min time for next bucket).
Query response time histogram
256us	1ms	4ms	16ms	64ms	256ms	1s	4s	16s	gt	max	tag
46.244	53.738	0.017	0.001	nonzero	0.000	0.000	0.000	0.000	0.000	0.021	my8031_rel_withdbg.cy9
39.916	60.066	0.016	0.002	nonzero	0.000	0.000	0.000	0.000	0.000	0.025	my8031_rel_o2.cy9
41.435	58.547	0.016	0.001	nonzero	0.000	0.000	0.000	0.000	0.000	0.022	my8031_rel_native.cy9
46.600	53.382	0.016	0.002	nonzero	0.000	0.000	0.000	0.000	0.000	0.028	my8031_rel.cy9
49.403	50.580	0.016	0.002	nonzero	0.000	0.000	0.000	0.000	0.000	0.022	my8031_rel_o2_lto.cy9
48.953	51.030	0.016	0.001	nonzero	0.000	0.000	0.000	0.000	0.000	0.021	my8031_rel_native_lto.cy9
51.376	48.607	0.015	0.002	nonzero	0.000	0.000	0.000	0.000	0.000	0.022	my8031_rel_lto.cy9
Insert response time histogram
256us	1ms	4ms	16ms	64ms	256ms	1s	4s	16s	gt	max	tag
0.000	0.000	97.597	2.044	0.331	0.028	0.000	0.000	0.000	0.000	0.106	my8031_rel_withdbg.cy9
0.000	0.000	94.476	5.040	0.390	0.093	0.000	0.000	0.000	0.000	0.125	my8031_rel_o2.cy9
0.000	0.000	96.672	2.936	0.353	0.039	0.000	0.000	0.000	0.000	0.110	my8031_rel_native.cy9
0.000	0.000	96.774	2.800	0.351	0.075	0.000	0.000	0.000	0.000	0.107	my8031_rel.cy9
0.000	0.000	96.157	3.393	0.372	0.078	0.000	0.000	0.000	0.000	0.110	my8031_rel_o2_lto.cy9
0.000	0.000	97.372	2.233	0.354	0.040	0.000	0.000	0.000	0.000	0.108	my8031_rel_native_lto.cy9
0.000	0.000	96.476	3.138	0.367	0.019	0.000	0.000	0.000	0.000	0.107	my8031_rel_lto.cy9
q1000.1
- q1000.1: range queries with 1000 insert/s per client
- Legend for results is here.
- Each entry lists the percentage of responses that fit in that bucket (slower than max time for previous bucket, faster than min time for next bucket).
Query response time histogram
256us	1ms	4ms	16ms	64ms	256ms	1s	4s	16s	gt	max	tag
46.262	53.703	0.033	0.002	nonzero	0.000	0.000	0.000	0.000	0.000	0.022	my8031_rel_withdbg.cy9
37.861	62.100	0.037	0.003	nonzero	0.000	0.000	0.000	0.000	0.000	0.021	my8031_rel_o2.cy9
40.420	59.549	0.028	0.003	nonzero	0.000	0.000	0.000	0.000	0.000	0.026	my8031_rel_native.cy9
44.215	55.751	0.031	0.003	nonzero	0.000	0.000	0.000	0.000	0.000	0.020	my8031_rel.cy9
47.122	52.847	0.029	0.003	nonzero	0.000	0.000	0.000	0.000	0.000	0.023	my8031_rel_o2_lto.cy9
49.477	50.487	0.033	0.002	nonzero	0.000	0.000	0.000	0.000	0.000	0.020	my8031_rel_native_lto.cy9
51.424	48.541	0.033	0.003	nonzero	0.000	0.000	0.000	0.000	0.000	0.020	my8031_rel_lto.cy9
Insert response time histogram
256us	1ms	4ms	16ms	64ms	256ms	1s	4s	16s	gt	max	tag
0.000	0.000	97.181	2.655	0.111	0.053	0.000	0.000	0.000	0.000	0.109	my8031_rel_withdbg.cy9
0.000	0.000	97.591	2.297	0.097	0.015	0.000	0.000	0.000	0.000	0.114	my8031_rel_o2.cy9
0.000	0.000	95.101	4.673	0.151	0.074	0.000	0.000	0.000	0.000	0.112	my8031_rel_native.cy9
0.000	0.000	95.766	4.008	0.160	0.066	0.000	0.000	0.000	0.000	0.109	my8031_rel.cy9
0.000	0.000	95.562	4.212	0.149	0.077	0.000	0.000	0.000	0.000	0.107	my8031_rel_o2_lto.cy9
0.000	0.000	97.936	1.935	0.114	0.015	0.000	0.000	0.000	0.000	0.108	my8031_rel_native_lto.cy9
0.000	0.000	97.274	2.551	0.132	0.043	0.000	0.000	0.000	0.000	0.110	my8031_rel_lto.cy9