Introduction
This is a report for the insert benchmark with 20M docs and 4 client(s). It is generated by scripts (bash, awk, sed) and Tufte might not be impressed. An overview of the insert benchmark is here and a short update is here. Below, by DBMS, I mean DBMS+version.config. An example is my8020.c10b40 where my means MySQL, 8020 is version 8.0.20 and c10b40 is the name for the configuration file.
The test server has 8 AMD cores, 16G RAM and an NVMe SSD. It is described here as the Beelink. The benchmark was run with 4 clients and there were 1 or 2 connections per client (1 for queries, 1 for inserts). The benchmark loads 20M rows without secondary indexes, creates secondary indexes, loads another 20M rows then does 3 read+write tests for one hour each that do queries as fast as possible with 100, 500 and then 1000 writes/second/client concurrent with the queries. There is 1 table. The database is cached by the OS but not by InnoDB. Clients and the DBMS share one server. The per-database configs are in the per-database subdirectories here.
The tested DBMS are:
- my8031_rel_withdbg.cy9_1g - InnoDB and MySQL 8.0.31, the cy9_1g config and compiled with CMAKE_BUILD_TYPE=RelWitDebInfo -O2 -flto
- my8031_rel_o2.cy9_1g - InnoDB and MySQL 8.0.31, the cy9_1g config and compiled with CMAKE_BUILD_TYPE=Release -O2
- my8031_rel_native.cy9_1g - InnoDB and MySQL 8.0.31, the cy9_1g config and compiled with CMAKE_BUILD_TYPE=Release -O3 -march=native -mtune=native
- my8031_rel.cy9_1g - InnoDB and MySQL 8.0.31, the cy9_1g config and compiled with CMAKE_BUILD_TYPE=Release -O3
- my8031_rel_o2_lto.cy9_1g - InnoDB and MySQL 8.0.31, the cy9_1g config and compiled with CMAKE_BUILD_TYPE=Release -O2 -flto
- my8031_rel_native_lto.cy9_1g - InnoDB and MySQL 8.0.31, the cy9_1g config and compiled with CMAKE_BUILD_TYPE=Release -O3 -flto -march=native -mtune=native
- my8031_rel_lto.cy9_1g - InnoDB and MySQL 8.0.31, the cy9_1g config and compiled with CMAKE_BUILD_TYPE=Release -O3 -flto
Contents
- Summary
- l.i0: load without secondary indexes
- l.x: create secondary indexes
- l.i1: continue load after secondary indexes created
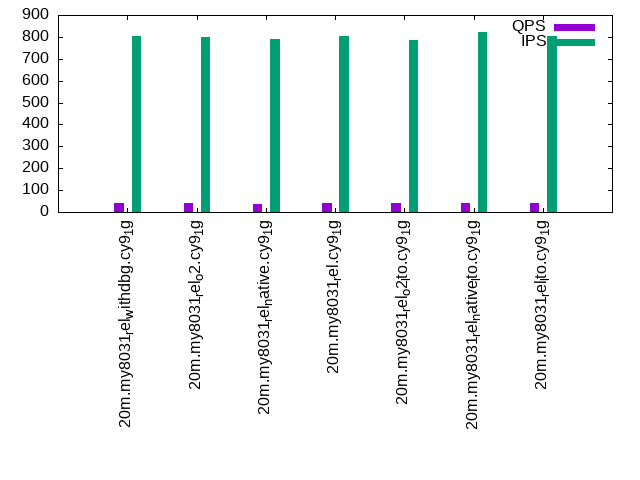
- q100.1: range queries with 100 insert/s per client
- q500.1: range queries with 500 insert/s per client
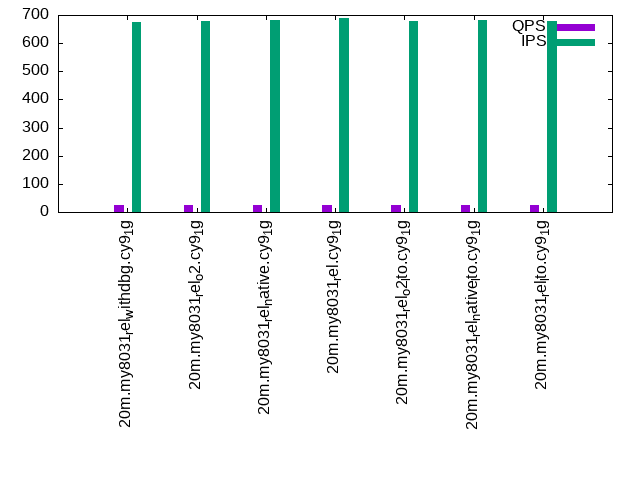
- q1000.1: range queries with 1000 insert/s per client
Summary
The numbers are inserts/s for l.i0 and l.i1, indexed docs (or rows) /s for l.x and queries/s for q*.2. The values are the average rate over the entire test for inserts (IPS) and queries (QPS). The range of values for IPS and QPS is split into 3 parts: bottom 25%, middle 50%, top 25%. Values in the bottom 25% have a red background, values in the top 25% have a green background and values in the middle have no color. A gray background is used for values that can be ignored because the DBMS did not sustain the target insert rate. Red backgrounds are not used when the minimum value is within 80% of the max value.
| dbms | l.i0 | l.x | l.i1 | q100.1 | q500.1 | q1000.1 |
|---|---|---|---|---|---|---|
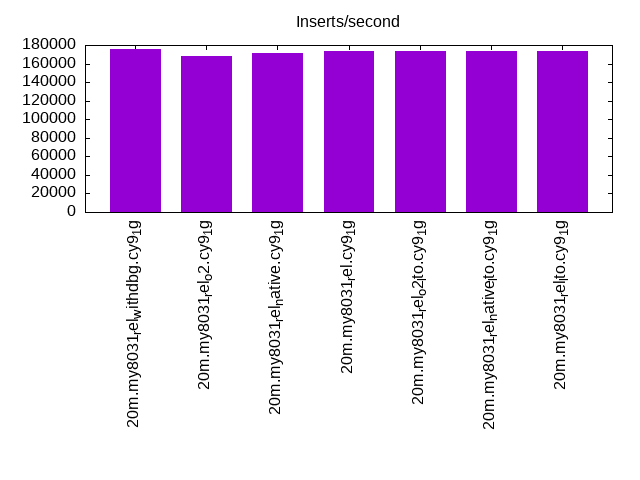
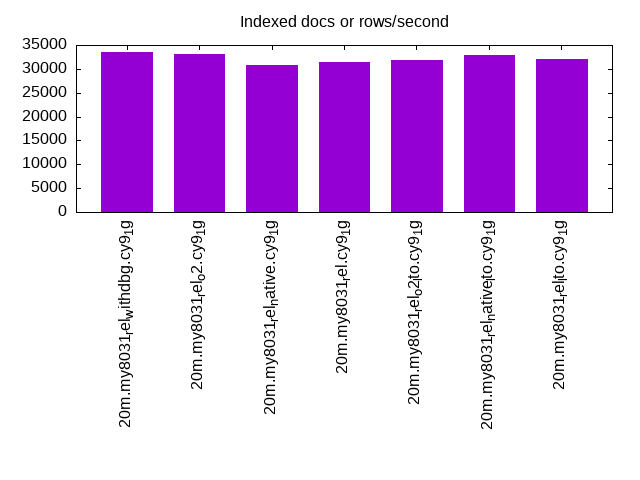
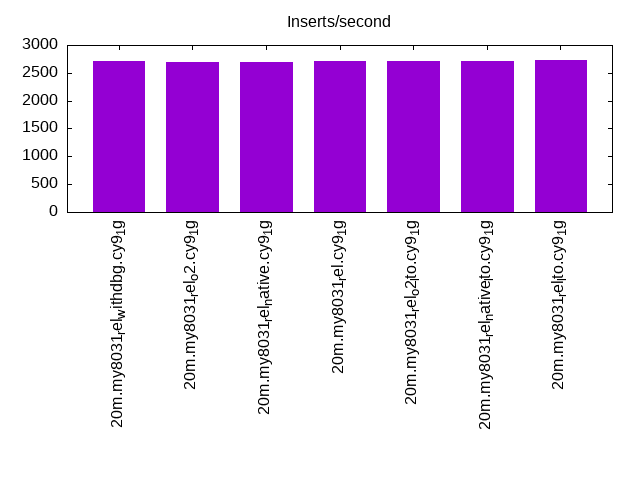
| 20m.my8031_rel_withdbg.cy9_1g | 175438 | 33612 | 2705 | 52 | 39 | 26 |
| 20m.my8031_rel_o2.cy9_1g | 168067 | 33059 | 2694 | 51 | 39 | 26 |
| 20m.my8031_rel_native.cy9_1g | 170940 | 30781 | 2688 | 50 | 38 | 25 |
| 20m.my8031_rel.cy9_1g | 173913 | 31406 | 2706 | 50 | 39 | 25 |
| 20m.my8031_rel_o2_lto.cy9_1g | 173913 | 31854 | 2708 | 52 | 39 | 26 |
| 20m.my8031_rel_native_lto.cy9_1g | 173913 | 33005 | 2720 | 52 | 40 | 26 |
| 20m.my8031_rel_lto.cy9_1g | 173913 | 32109 | 2731 | 52 | 40 | 26 |
This table has relative throughput, throughput for the DBMS relative to the DBMS in the first line, using the absolute throughput from the previous table.
| dbms | l.i0 | l.x | l.i1 | q100.1 | q500.1 | q1000.1 |
|---|---|---|---|---|---|---|
| 20m.my8031_rel_withdbg.cy9_1g | 1.00 | 1.00 | 1.00 | 1.00 | 1.00 | 1.00 |
| 20m.my8031_rel_o2.cy9_1g | 0.96 | 0.98 | 1.00 | 0.98 | 1.00 | 1.00 |
| 20m.my8031_rel_native.cy9_1g | 0.97 | 0.92 | 0.99 | 0.96 | 0.97 | 0.96 |
| 20m.my8031_rel.cy9_1g | 0.99 | 0.93 | 1.00 | 0.96 | 1.00 | 0.96 |
| 20m.my8031_rel_o2_lto.cy9_1g | 0.99 | 0.95 | 1.00 | 1.00 | 1.00 | 1.00 |
| 20m.my8031_rel_native_lto.cy9_1g | 0.99 | 0.98 | 1.01 | 1.00 | 1.03 | 1.00 |
| 20m.my8031_rel_lto.cy9_1g | 0.99 | 0.96 | 1.01 | 1.00 | 1.03 | 1.00 |
This lists the average rate of inserts/s for the tests that do inserts concurrent with queries. For such tests the query rate is listed in the table above. The read+write tests are setup so that the insert rate should match the target rate every second. Cells that are not at least 95% of the target have a red background to indicate a failure to satisfy the target.
| dbms | q100.1 | q500.1 | q1000.1 |
|---|---|---|---|
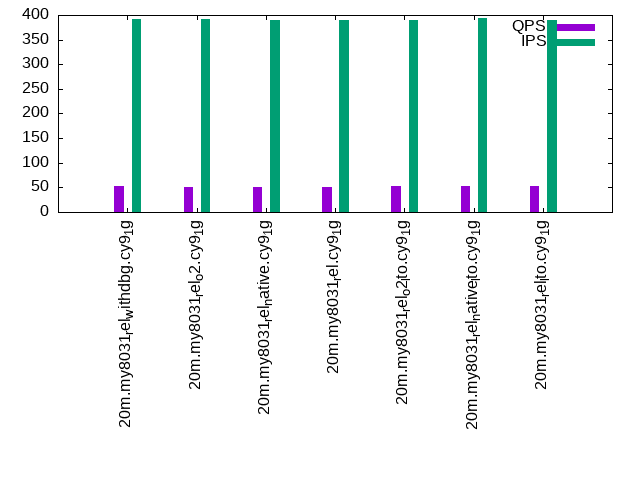
| my8031_rel_withdbg.cy9_1g | 392 | 803 | 676 |
| my8031_rel_o2.cy9_1g | 391 | 800 | 677 |
| my8031_rel_native.cy9_1g | 389 | 789 | 681 |
| my8031_rel.cy9_1g | 390 | 805 | 689 |
| my8031_rel_o2_lto.cy9_1g | 389 | 786 | 677 |
| my8031_rel_native_lto.cy9_1g | 394 | 822 | 681 |
| my8031_rel_lto.cy9_1g | 390 | 802 | 680 |
| target | 400 | 2000 | 4000 |
l.i0
l.i0: load without secondary indexes. Graphs for performance per 1-second interval are here.
Average throughput:
Insert response time histogram: each cell has the percentage of responses that take <= the time in the header and max is the max response time in seconds. For the max column values in the top 25% of the range have a red background and in the bottom 25% of the range have a green background. The red background is not used when the min value is within 80% of the max value.
| dbms | 256us | 1ms | 4ms | 16ms | 64ms | 256ms | 1s | 4s | 16s | gt | max |
|---|---|---|---|---|---|---|---|---|---|---|---|
| my8031_rel_withdbg.cy9_1g | 98.340 | 1.333 | 0.304 | 0.024 | 0.132 | ||||||
| my8031_rel_o2.cy9_1g | 98.106 | 1.532 | 0.333 | 0.028 | 0.179 | ||||||
| my8031_rel_native.cy9_1g | 98.216 | 1.474 | 0.283 | 0.027 | 0.135 | ||||||
| my8031_rel.cy9_1g | 98.258 | 1.401 | 0.312 | 0.029 | 0.140 | ||||||
| my8031_rel_o2_lto.cy9_1g | 98.279 | 1.303 | 0.397 | 0.021 | 0.160 | ||||||
| my8031_rel_native_lto.cy9_1g | 98.093 | 1.511 | 0.367 | 0.029 | 0.156 | ||||||
| my8031_rel_lto.cy9_1g | 98.138 | 1.470 | 0.355 | 0.036 | 0.153 |
Performance metrics for the DBMS listed above. Some are normalized by throughput, others are not. Legend for results is here.
ips	qps	rps	rmbps	wps	wmbps	rpq	rkbpq	wpi	wkbpi	csps	cpups	cspq	cpupq	dbgb1	dbgb2	rss	maxop	p50	p99	tag
175438	0	0	0.0	415.6	50.8	0.000	0.000	0.002	0.296	19236	61.8	0.110	28	1.3	9.9	1.4	0.132	52665	12286	20m.my8031_rel_withdbg.cy9_1g
168067	0	0	0.0	408.8	48.8	0.000	0.000	0.002	0.298	18505	60.6	0.110	29	1.3	9.9	1.4	0.179	50165	22191	20m.my8031_rel_o2.cy9_1g
170940	0	0	0.0	413.0	49.2	0.000	0.000	0.002	0.295	18898	61.2	0.111	29	1.3	9.9	1.4	0.135	50844	28569	20m.my8031_rel_native.cy9_1g
173913	0	0	0.0	425.7	49.7	0.000	0.000	0.002	0.293	19009	60.7	0.109	28	1.3	9.9	1.4	0.140	52144	21177	20m.my8031_rel.cy9_1g
173913	0	0	0.0	431.0	49.6	0.000	0.000	0.002	0.292	19092	60.1	0.110	28	1.3	9.9	1.4	0.160	52541	18680	20m.my8031_rel_o2_lto.cy9_1g
173913	0	0	0.0	427.0	49.7	0.000	0.000	0.002	0.293	18990	59.5	0.109	27	1.3	9.9	1.4	0.156	53342	20977	20m.my8031_rel_native_lto.cy9_1g
173913	0	0	0.0	424.9	49.7	0.000	0.000	0.002	0.292	18789	59.9	0.108	28	1.3	9.9	1.4	0.153	52590	13286	20m.my8031_rel_lto.cy9_1g
l.x
l.x: create secondary indexes.
Average throughput:
Performance metrics for the DBMS listed above. Some are normalized by throughput, others are not. Legend for results is here.
ips	qps	rps	rmbps	wps	wmbps	rpq	rkbpq	wpi	wkbpi	csps	cpups	cspq	cpupq	dbgb1	dbgb2	rss	maxop	p50	p99	tag
33612	0	177	11.6	1060.4	34.3	0.005	0.355	0.032	1.044	9644	9.7	0.287	23	3.0	11.6	1.5	0.076	NA	NA	20m.my8031_rel_withdbg.cy9_1g
33059	0	174	11.5	1049.6	33.5	0.005	0.355	0.032	1.037	9657	10.2	0.292	25	3.0	11.6	1.5	0.115	NA	NA	20m.my8031_rel_o2.cy9_1g
30781	0	162	10.7	966.7	31.4	0.005	0.355	0.031	1.044	9026	9.0	0.293	23	3.0	11.6	1.5	0.094	NA	NA	20m.my8031_rel_native.cy9_1g
31406	0	165	10.8	989.4	31.8	0.005	0.353	0.032	1.037	9044	9.7	0.288	25	3.0	11.6	1.5	0.163	NA	NA	20m.my8031_rel.cy9_1g
31854	0	167	11.0	1002.2	32.2	0.005	0.353	0.031	1.034	9034	9.4	0.284	24	3.0	11.6	1.5	0.111	NA	NA	20m.my8031_rel_o2_lto.cy9_1g
33005	0	174	11.4	1040.4	33.5	0.005	0.355	0.032	1.039	9533	8.8	0.289	21	3.0	11.6	1.5	0.176	NA	NA	20m.my8031_rel_native_lto.cy9_1g
32109	0	169	11.1	1003.7	32.5	0.005	0.353	0.031	1.036	9179	9.0	0.286	22	3.0	11.6	1.5	0.136	NA	NA	20m.my8031_rel_lto.cy9_1g
l.i1
l.i1: continue load after secondary indexes created. Graphs for performance per 1-second interval are here.
Average throughput:
Insert response time histogram: each cell has the percentage of responses that take <= the time in the header and max is the max response time in seconds. For the max column values in the top 25% of the range have a red background and in the bottom 25% of the range have a green background. The red background is not used when the min value is within 80% of the max value.
| dbms | 256us | 1ms | 4ms | 16ms | 64ms | 256ms | 1s | 4s | 16s | gt | max |
|---|---|---|---|---|---|---|---|---|---|---|---|
| my8031_rel_withdbg.cy9_1g | 0.017 | 18.766 | 40.317 | 38.721 | 1.970 | 0.177 | 0.032 | 6.969 | |||
| my8031_rel_o2.cy9_1g | 0.010 | 16.402 | 42.093 | 39.439 | 1.853 | 0.170 | 0.034 | 7.665 | |||
| my8031_rel_native.cy9_1g | 0.019 | 17.883 | 40.870 | 39.069 | 1.945 | 0.185 | 0.028 | 8.279 | |||
| my8031_rel.cy9_1g | 0.015 | 17.709 | 41.258 | 38.973 | 1.834 | 0.181 | 0.030 | 8.018 | |||
| my8031_rel_o2_lto.cy9_1g | 0.015 | 18.304 | 40.782 | 38.736 | 1.953 | 0.182 | 0.027 | 7.691 | |||
| my8031_rel_native_lto.cy9_1g | 0.032 | 19.195 | 39.892 | 38.727 | 1.943 | 0.182 | 0.029 | 7.840 | |||
| my8031_rel_lto.cy9_1g | 0.037 | 19.645 | 40.005 | 38.197 | 1.911 | 0.177 | 0.028 | 7.941 |
Performance metrics for the DBMS listed above. Some are normalized by throughput, others are not. Legend for results is here.
ips	qps	rps	rmbps	wps	wmbps	rpq	rkbpq	wpi	wkbpi	csps	cpups	cspq	cpupq	dbgb1	dbgb2	rss	maxop	p50	p99	tag
2705	0	0	0.0	975.6	18.1	0.000	0.001	0.361	6.870	6372	11.4	2.355	337	7.8	16.4	1.5	6.969	599	0	20m.my8031_rel_withdbg.cy9_1g
2694	0	0	0.0	970.8	18.0	0.000	0.001	0.360	6.858	6372	11.9	2.366	353	7.8	16.4	1.5	7.665	599	0	20m.my8031_rel_o2.cy9_1g
2688	0	0	0.0	968.0	18.0	0.000	0.001	0.360	6.844	6362	11.5	2.367	342	7.8	16.4	1.5	8.279	599	0	20m.my8031_rel_native.cy9_1g
2706	0	0	0.0	969.8	18.0	0.000	0.001	0.358	6.827	6359	11.6	2.350	343	7.8	16.4	1.5	8.018	599	0	20m.my8031_rel.cy9_1g
2708	0	0	0.0	975.6	18.2	0.000	0.001	0.360	6.869	6427	11.4	2.373	337	7.8	16.4	1.5	7.691	599	0	20m.my8031_rel_o2_lto.cy9_1g
2720	0	0	0.0	977.5	18.2	0.000	0.001	0.359	6.845	6377	11.1	2.345	326	7.8	16.4	1.5	7.840	599	0	20m.my8031_rel_native_lto.cy9_1g
2731	0	0	0.0	977.7	18.2	0.000	0.001	0.358	6.826	6374	11.1	2.334	325	7.8	16.4	1.5	7.941	599	0	20m.my8031_rel_lto.cy9_1g
q100.1
q100.1: range queries with 100 insert/s per client. Graphs for performance per 1-second interval are here.
Average throughput:
Query response time histogram: each cell has the percentage of responses that take <= the time in the header and max is the max response time in seconds. For max values in the top 25% of the range have a red background and in the bottom 25% of the range have a green background. The red background is not used when the min value is within 80% of the max value.
| dbms | 256us | 1ms | 4ms | 16ms | 64ms | 256ms | 1s | 4s | 16s | gt | max |
|---|---|---|---|---|---|---|---|---|---|---|---|
| my8031_rel_withdbg.cy9_1g | 10.778 | 3.700 | 7.877 | 34.046 | 40.172 | 3.420 | 0.007 | 1.790 | |||
| my8031_rel_o2.cy9_1g | 10.669 | 3.789 | 7.346 | 33.387 | 41.394 | 3.412 | 0.003 | 1.626 | |||
| my8031_rel_native.cy9_1g | 10.300 | 3.524 | 7.324 | 33.182 | 42.252 | 3.416 | 0.001 | 1.439 | |||
| my8031_rel.cy9_1g | 10.232 | 3.544 | 7.341 | 33.387 | 42.006 | 3.489 | 0.966 | ||||
| my8031_rel_o2_lto.cy9_1g | 11.070 | 3.706 | 7.815 | 34.086 | 39.985 | 3.335 | 0.004 | 1.305 | |||
| my8031_rel_native_lto.cy9_1g | 0.001 | 10.760 | 3.322 | 7.495 | 34.154 | 40.941 | 3.322 | 0.004 | 1.958 | ||
| my8031_rel_lto.cy9_1g | 11.091 | 3.415 | 7.894 | 34.338 | 39.979 | 3.277 | 0.006 | 1.627 |
Insert response time histogram: each cell has the percentage of responses that take <= the time in the header and max is the max response time in seconds. For max values in the top 25% of the range have a red background and in the bottom 25% of the range have a green background. The red background is not used when the min value is within 80% of the max value.
| dbms | 256us | 1ms | 4ms | 16ms | 64ms | 256ms | 1s | 4s | 16s | gt | max |
|---|---|---|---|---|---|---|---|---|---|---|---|
| my8031_rel_withdbg.cy9_1g | 0.271 | 1.625 | 31.167 | 63.271 | 3.667 | 1.951 | |||||
| my8031_rel_o2.cy9_1g | 0.243 | 1.306 | 29.299 | 65.868 | 3.285 | 2.095 | |||||
| my8031_rel_native.cy9_1g | 0.174 | 1.257 | 28.618 | 66.382 | 3.569 | 2.457 | |||||
| my8031_rel.cy9_1g | 0.208 | 1.326 | 29.299 | 65.639 | 3.528 | 2.154 | |||||
| my8031_rel_o2_lto.cy9_1g | 0.292 | 1.458 | 30.924 | 63.569 | 3.757 | 2.442 | |||||
| my8031_rel_native_lto.cy9_1g | 0.250 | 1.410 | 30.444 | 64.715 | 3.181 | 2.190 | |||||
| my8031_rel_lto.cy9_1g | 0.292 | 1.417 | 30.889 | 63.889 | 3.514 | 3.388 |
Performance metrics for the DBMS listed above. Some are normalized by throughput, others are not. Legend for results is here.
ips	qps	rps	rmbps	wps	wmbps	rpq	rkbpq	wpi	wkbpi	csps	cpups	cspq	cpupq	dbgb1	dbgb2	rss	maxop	p50	p99	tag
392	52	8	0.1	1122.8	14.9	0.160	2.646	2.867	38.877	7464	5.0	143.816	7707	8.4	17.0	1.5	1.790	16	0	20m.my8031_rel_withdbg.cy9_1g
391	51	10	0.1	1118.0	14.7	0.195	3.004	2.859	38.623	7447	5.1	146.315	8015	8.4	17.0	1.5	1.626	16	0	20m.my8031_rel_o2.cy9_1g
389	50	9	0.1	1115.6	14.7	0.187	2.976	2.867	38.651	7447	5.0	148.060	7952	8.4	17.0	1.5	1.439	16	0	20m.my8031_rel_native.cy9_1g
390	50	9	0.1	1115.4	14.7	0.172	2.809	2.857	38.588	7435	5.0	147.524	7937	8.4	17.0	1.5	0.966	16	0	20m.my8031_rel.cy9_1g
389	52	10	0.2	1123.9	14.9	0.196	3.041	2.888	39.150	7467	5.0	142.767	7648	8.4	17.0	1.5	1.305	16	0	20m.my8031_rel_o2_lto.cy9_1g
394	52	10	0.2	1125.3	14.9	0.194	3.008	2.856	38.671	7479	4.9	144.374	7568	8.4	17.0	1.5	1.958	16	0	20m.my8031_rel_native_lto.cy9_1g
390	52	10	0.2	1121.7	14.9	0.197	3.035	2.878	39.103	7444	4.9	142.338	7495	8.4	17.0	1.5	1.627	16	0	20m.my8031_rel_lto.cy9_1g
q500.1
q500.1: range queries with 500 insert/s per client. Graphs for performance per 1-second interval are here.
Average throughput:
Query response time histogram: each cell has the percentage of responses that take <= the time in the header and max is the max response time in seconds. For max values in the top 25% of the range have a red background and in the bottom 25% of the range have a green background. The red background is not used when the min value is within 80% of the max value.
| dbms | 256us | 1ms | 4ms | 16ms | 64ms | 256ms | 1s | 4s | 16s | gt | max |
|---|---|---|---|---|---|---|---|---|---|---|---|
| my8031_rel_withdbg.cy9_1g | 7.077 | 3.716 | 6.008 | 29.630 | 45.700 | 7.832 | 0.037 | 1.872 | |||
| my8031_rel_o2.cy9_1g | 6.834 | 3.905 | 5.956 | 29.163 | 46.278 | 7.826 | 0.037 | 2.481 | |||
| my8031_rel_native.cy9_1g | 0.001 | 7.157 | 3.659 | 5.847 | 28.706 | 46.480 | 8.117 | 0.033 | 2.018 | ||
| my8031_rel.cy9_1g | 0.003 | 7.123 | 3.814 | 5.884 | 29.305 | 46.128 | 7.712 | 0.030 | 1.593 | ||
| my8031_rel_o2_lto.cy9_1g | 0.001 | 7.027 | 3.711 | 6.050 | 29.352 | 45.907 | 7.914 | 0.038 | 2.088 | ||
| my8031_rel_native_lto.cy9_1g | 7.248 | 3.636 | 6.152 | 30.114 | 45.625 | 7.200 | 0.025 | 1.804 | |||
| my8031_rel_lto.cy9_1g | 7.462 | 3.489 | 6.112 | 29.913 | 45.438 | 7.565 | 0.022 | 1.929 |
Insert response time histogram: each cell has the percentage of responses that take <= the time in the header and max is the max response time in seconds. For max values in the top 25% of the range have a red background and in the bottom 25% of the range have a green background. The red background is not used when the min value is within 80% of the max value.
| dbms | 256us | 1ms | 4ms | 16ms | 64ms | 256ms | 1s | 4s | 16s | gt | max |
|---|---|---|---|---|---|---|---|---|---|---|---|
| my8031_rel_withdbg.cy9_1g | 1.793 | 8.171 | 53.981 | 35.267 | 0.789 | 2.512 | |||||
| my8031_rel_o2.cy9_1g | 1.772 | 7.985 | 53.879 | 35.601 | 0.762 | 2.418 | |||||
| my8031_rel_native.cy9_1g | 1.726 | 7.825 | 53.286 | 36.329 | 0.833 | 3.351 | |||||
| my8031_rel.cy9_1g | 1.868 | 8.261 | 53.893 | 35.192 | 0.786 | 2.637 | |||||
| my8031_rel_o2_lto.cy9_1g | 0.001 | 1.669 | 7.512 | 53.292 | 36.735 | 0.790 | 2.908 | ||||
| my8031_rel_native_lto.cy9_1g | 1.717 | 8.447 | 54.721 | 34.513 | 0.603 | 3.191 | |||||
| my8031_rel_lto.cy9_1g | 0.001 | 1.743 | 7.839 | 54.226 | 35.453 | 0.737 | 2.728 |
Performance metrics for the DBMS listed above. Some are normalized by throughput, others are not. Legend for results is here.
ips	qps	rps	rmbps	wps	wmbps	rpq	rkbpq	wpi	wkbpi	csps	cpups	cspq	cpupq	dbgb1	dbgb2	rss	maxop	p50	p99	tag
803	39	7	0.1	1028.8	14.0	0.181	3.183	1.281	17.864	6975	5.9	178.387	12071	9.4	18.0	1.5	1.872	16	0	20m.my8031_rel_withdbg.cy9_1g
800	39	8	0.1	1025.5	13.9	0.198	3.291	1.282	17.804	6972	5.9	180.616	12228	9.5	18.0	1.5	2.481	16	0	20m.my8031_rel_o2.cy9_1g
789	38	7	0.1	1016.2	13.8	0.185	3.118	1.289	17.875	6912	5.7	179.990	11875	9.5	18.0	1.5	2.018	16	0	20m.my8031_rel_native.cy9_1g
805	39	7	0.1	1030.1	14.0	0.185	3.242	1.280	17.793	6996	5.9	179.835	12134	9.4	18.0	1.5	1.593	16	0	20m.my8031_rel.cy9_1g
786	39	7	0.1	1015.7	13.8	0.188	3.161	1.293	18.031	6887	5.8	177.957	11990	9.4	18.0	1.5	2.088	16	0	20m.my8031_rel_o2_lto.cy9_1g
822	40	8	0.1	1056.2	14.4	0.188	3.150	1.286	17.908	7143	5.9	177.685	11741	9.4	18.0	1.5	1.804	16	0	20m.my8031_rel_native_lto.cy9_1g
802	40	8	0.1	1036.5	14.1	0.189	3.117	1.293	18.020	7017	5.8	177.186	11717	9.4	18.0	1.5	1.929	16	0	20m.my8031_rel_lto.cy9_1g
q1000.1
q1000.1: range queries with 1000 insert/s per client. Graphs for performance per 1-second interval are here.
Average throughput:
Query response time histogram: each cell has the percentage of responses that take <= the time in the header and max is the max response time in seconds. For max values in the top 25% of the range have a red background and in the bottom 25% of the range have a green background. The red background is not used when the min value is within 80% of the max value.
| dbms | 256us | 1ms | 4ms | 16ms | 64ms | 256ms | 1s | 4s | 16s | gt | max |
|---|---|---|---|---|---|---|---|---|---|---|---|
| my8031_rel_withdbg.cy9_1g | 5.767 | 3.607 | 4.963 | 21.750 | 43.514 | 20.200 | 0.199 | 2.872 | |||
| my8031_rel_o2.cy9_1g | nonzero | 5.597 | 3.802 | 4.799 | 21.194 | 43.830 | 20.574 | 0.203 | 2.661 | ||
| my8031_rel_native.cy9_1g | 5.670 | 3.641 | 4.717 | 20.779 | 44.104 | 20.875 | 0.214 | 2.656 | |||
| my8031_rel.cy9_1g | 5.639 | 3.708 | 4.824 | 20.863 | 43.863 | 20.896 | 0.207 | 2.283 | |||
| my8031_rel_o2_lto.cy9_1g | 5.929 | 3.596 | 4.938 | 21.427 | 43.704 | 20.191 | 0.216 | 2.838 | |||
| my8031_rel_native_lto.cy9_1g | 5.954 | 3.536 | 4.881 | 21.441 | 43.382 | 20.611 | 0.196 | 2.911 | |||
| my8031_rel_lto.cy9_1g | 6.050 | 3.546 | 4.936 | 21.476 | 43.477 | 20.309 | 0.204 | 2.823 |
Insert response time histogram: each cell has the percentage of responses that take <= the time in the header and max is the max response time in seconds. For max values in the top 25% of the range have a red background and in the bottom 25% of the range have a green background. The red background is not used when the min value is within 80% of the max value.
| dbms | 256us | 1ms | 4ms | 16ms | 64ms | 256ms | 1s | 4s | 16s | gt | max |
|---|---|---|---|---|---|---|---|---|---|---|---|
| my8031_rel_withdbg.cy9_1g | 3.451 | 5.365 | 44.721 | 44.998 | 1.465 | 2.668 | |||||
| my8031_rel_o2.cy9_1g | 3.274 | 5.609 | 45.090 | 44.427 | 1.601 | 3.069 | |||||
| my8031_rel_native.cy9_1g | 3.472 | 5.888 | 45.002 | 44.006 | 1.632 | 3.268 | |||||
| my8031_rel.cy9_1g | 3.472 | 6.146 | 45.301 | 43.483 | 1.599 | 2.889 | |||||
| my8031_rel_o2_lto.cy9_1g | 3.467 | 5.552 | 44.699 | 44.733 | 1.549 | 2.578 | |||||
| my8031_rel_native_lto.cy9_1g | 0.001 | 3.568 | 5.683 | 45.146 | 44.061 | 1.542 | 3.582 | ||||
| my8031_rel_lto.cy9_1g | 3.644 | 5.553 | 44.940 | 44.322 | 1.542 | 2.842 |
Performance metrics for the DBMS listed above. Some are normalized by throughput, others are not. Legend for results is here.
ips	qps	rps	rmbps	wps	wmbps	rpq	rkbpq	wpi	wkbpi	csps	cpups	cspq	cpupq	dbgb1	dbgb2	rss	maxop	p50	p99	tag
676	26	4	0.1	714.5	10.0	0.160	2.834	1.058	15.209	5030	4.8	194.944	14884	10.0	18.6	1.4	2.872	0	0	20m.my8031_rel_withdbg.cy9_1g
677	26	4	0.1	713.3	10.0	0.168	2.898	1.054	15.086	5031	4.9	197.296	15373	10.0	18.6	1.4	2.661	0	0	20m.my8031_rel_o2.cy9_1g
681	25	4	0.1	711.0	9.9	0.170	2.954	1.045	14.950	5022	4.8	199.276	15238	10.0	18.6	1.4	2.656	0	0	20m.my8031_rel_native.cy9_1g
689	25	4	0.1	714.1	10.0	0.165	2.923	1.036	14.835	5037	4.9	199.097	15494	10.0	18.6	1.3	2.283	0	0	20m.my8031_rel.cy9_1g
677	26	4	0.1	714.5	10.0	0.165	2.877	1.055	15.157	5032	4.8	195.788	14942	10.0	18.6	1.4	2.838	0	0	20m.my8031_rel_o2_lto.cy9_1g
681	26	4	0.1	714.4	10.0	0.167	2.883	1.048	15.054	5022	4.8	196.943	15059	10.0	18.6	1.4	2.911	0	0	20m.my8031_rel_native_lto.cy9_1g
680	26	4	0.1	715.7	10.0	0.164	2.854	1.053	15.119	5028	4.8	195.625	14942	10.0	18.6	1.4	2.823	0	0	20m.my8031_rel_lto.cy9_1g
l.i0
l.i0: load without secondary indexes
Performance metrics for all DBMS, not just the ones listed above. Some are normalized by throughput, others are not. Legend for results is here.
ips	qps	rps	rmbps	wps	wmbps	rpq	rkbpq	wpi	wkbpi	csps	cpups	cspq	cpupq	dbgb1	dbgb2	rss	maxop	p50	p99	tag
175438	0	0	0.0	415.6	50.8	0.000	0.000	0.002	0.296	19236	61.8	0.110	28	1.3	9.9	1.4	0.132	52665	12286	20m.my8031_rel_withdbg.cy9_1g
168067	0	0	0.0	408.8	48.8	0.000	0.000	0.002	0.298	18505	60.6	0.110	29	1.3	9.9	1.4	0.179	50165	22191	20m.my8031_rel_o2.cy9_1g
170940	0	0	0.0	413.0	49.2	0.000	0.000	0.002	0.295	18898	61.2	0.111	29	1.3	9.9	1.4	0.135	50844	28569	20m.my8031_rel_native.cy9_1g
173913	0	0	0.0	425.7	49.7	0.000	0.000	0.002	0.293	19009	60.7	0.109	28	1.3	9.9	1.4	0.140	52144	21177	20m.my8031_rel.cy9_1g
173913	0	0	0.0	431.0	49.6	0.000	0.000	0.002	0.292	19092	60.1	0.110	28	1.3	9.9	1.4	0.160	52541	18680	20m.my8031_rel_o2_lto.cy9_1g
173913	0	0	0.0	427.0	49.7	0.000	0.000	0.002	0.293	18990	59.5	0.109	27	1.3	9.9	1.4	0.156	53342	20977	20m.my8031_rel_native_lto.cy9_1g
173913	0	0	0.0	424.9	49.7	0.000	0.000	0.002	0.292	18789	59.9	0.108	28	1.3	9.9	1.4	0.153	52590	13286	20m.my8031_rel_lto.cy9_1g
l.x
l.x: create secondary indexes
Performance metrics for all DBMS, not just the ones listed above. Some are normalized by throughput, others are not. Legend for results is here.
ips	qps	rps	rmbps	wps	wmbps	rpq	rkbpq	wpi	wkbpi	csps	cpups	cspq	cpupq	dbgb1	dbgb2	rss	maxop	p50	p99	tag
33612	0	177	11.6	1060.4	34.3	0.005	0.355	0.032	1.044	9644	9.7	0.287	23	3.0	11.6	1.5	0.076	NA	NA	20m.my8031_rel_withdbg.cy9_1g
33059	0	174	11.5	1049.6	33.5	0.005	0.355	0.032	1.037	9657	10.2	0.292	25	3.0	11.6	1.5	0.115	NA	NA	20m.my8031_rel_o2.cy9_1g
30781	0	162	10.7	966.7	31.4	0.005	0.355	0.031	1.044	9026	9.0	0.293	23	3.0	11.6	1.5	0.094	NA	NA	20m.my8031_rel_native.cy9_1g
31406	0	165	10.8	989.4	31.8	0.005	0.353	0.032	1.037	9044	9.7	0.288	25	3.0	11.6	1.5	0.163	NA	NA	20m.my8031_rel.cy9_1g
31854	0	167	11.0	1002.2	32.2	0.005	0.353	0.031	1.034	9034	9.4	0.284	24	3.0	11.6	1.5	0.111	NA	NA	20m.my8031_rel_o2_lto.cy9_1g
33005	0	174	11.4	1040.4	33.5	0.005	0.355	0.032	1.039	9533	8.8	0.289	21	3.0	11.6	1.5	0.176	NA	NA	20m.my8031_rel_native_lto.cy9_1g
32109	0	169	11.1	1003.7	32.5	0.005	0.353	0.031	1.036	9179	9.0	0.286	22	3.0	11.6	1.5	0.136	NA	NA	20m.my8031_rel_lto.cy9_1g
l.i1
l.i1: continue load after secondary indexes created
Performance metrics for all DBMS, not just the ones listed above. Some are normalized by throughput, others are not. Legend for results is here.
ips	qps	rps	rmbps	wps	wmbps	rpq	rkbpq	wpi	wkbpi	csps	cpups	cspq	cpupq	dbgb1	dbgb2	rss	maxop	p50	p99	tag
2705	0	0	0.0	975.6	18.1	0.000	0.001	0.361	6.870	6372	11.4	2.355	337	7.8	16.4	1.5	6.969	599	0	20m.my8031_rel_withdbg.cy9_1g
2694	0	0	0.0	970.8	18.0	0.000	0.001	0.360	6.858	6372	11.9	2.366	353	7.8	16.4	1.5	7.665	599	0	20m.my8031_rel_o2.cy9_1g
2688	0	0	0.0	968.0	18.0	0.000	0.001	0.360	6.844	6362	11.5	2.367	342	7.8	16.4	1.5	8.279	599	0	20m.my8031_rel_native.cy9_1g
2706	0	0	0.0	969.8	18.0	0.000	0.001	0.358	6.827	6359	11.6	2.350	343	7.8	16.4	1.5	8.018	599	0	20m.my8031_rel.cy9_1g
2708	0	0	0.0	975.6	18.2	0.000	0.001	0.360	6.869	6427	11.4	2.373	337	7.8	16.4	1.5	7.691	599	0	20m.my8031_rel_o2_lto.cy9_1g
2720	0	0	0.0	977.5	18.2	0.000	0.001	0.359	6.845	6377	11.1	2.345	326	7.8	16.4	1.5	7.840	599	0	20m.my8031_rel_native_lto.cy9_1g
2731	0	0	0.0	977.7	18.2	0.000	0.001	0.358	6.826	6374	11.1	2.334	325	7.8	16.4	1.5	7.941	599	0	20m.my8031_rel_lto.cy9_1g
q100.1
q100.1: range queries with 100 insert/s per client
Performance metrics for all DBMS, not just the ones listed above. Some are normalized by throughput, others are not. Legend for results is here.
ips	qps	rps	rmbps	wps	wmbps	rpq	rkbpq	wpi	wkbpi	csps	cpups	cspq	cpupq	dbgb1	dbgb2	rss	maxop	p50	p99	tag
392	52	8	0.1	1122.8	14.9	0.160	2.646	2.867	38.877	7464	5.0	143.816	7707	8.4	17.0	1.5	1.790	16	0	20m.my8031_rel_withdbg.cy9_1g
391	51	10	0.1	1118.0	14.7	0.195	3.004	2.859	38.623	7447	5.1	146.315	8015	8.4	17.0	1.5	1.626	16	0	20m.my8031_rel_o2.cy9_1g
389	50	9	0.1	1115.6	14.7	0.187	2.976	2.867	38.651	7447	5.0	148.060	7952	8.4	17.0	1.5	1.439	16	0	20m.my8031_rel_native.cy9_1g
390	50	9	0.1	1115.4	14.7	0.172	2.809	2.857	38.588	7435	5.0	147.524	7937	8.4	17.0	1.5	0.966	16	0	20m.my8031_rel.cy9_1g
389	52	10	0.2	1123.9	14.9	0.196	3.041	2.888	39.150	7467	5.0	142.767	7648	8.4	17.0	1.5	1.305	16	0	20m.my8031_rel_o2_lto.cy9_1g
394	52	10	0.2	1125.3	14.9	0.194	3.008	2.856	38.671	7479	4.9	144.374	7568	8.4	17.0	1.5	1.958	16	0	20m.my8031_rel_native_lto.cy9_1g
390	52	10	0.2	1121.7	14.9	0.197	3.035	2.878	39.103	7444	4.9	142.338	7495	8.4	17.0	1.5	1.627	16	0	20m.my8031_rel_lto.cy9_1g
q500.1
q500.1: range queries with 500 insert/s per client
Performance metrics for all DBMS, not just the ones listed above. Some are normalized by throughput, others are not. Legend for results is here.
ips	qps	rps	rmbps	wps	wmbps	rpq	rkbpq	wpi	wkbpi	csps	cpups	cspq	cpupq	dbgb1	dbgb2	rss	maxop	p50	p99	tag
803	39	7	0.1	1028.8	14.0	0.181	3.183	1.281	17.864	6975	5.9	178.387	12071	9.4	18.0	1.5	1.872	16	0	20m.my8031_rel_withdbg.cy9_1g
800	39	8	0.1	1025.5	13.9	0.198	3.291	1.282	17.804	6972	5.9	180.616	12228	9.5	18.0	1.5	2.481	16	0	20m.my8031_rel_o2.cy9_1g
789	38	7	0.1	1016.2	13.8	0.185	3.118	1.289	17.875	6912	5.7	179.990	11875	9.5	18.0	1.5	2.018	16	0	20m.my8031_rel_native.cy9_1g
805	39	7	0.1	1030.1	14.0	0.185	3.242	1.280	17.793	6996	5.9	179.835	12134	9.4	18.0	1.5	1.593	16	0	20m.my8031_rel.cy9_1g
786	39	7	0.1	1015.7	13.8	0.188	3.161	1.293	18.031	6887	5.8	177.957	11990	9.4	18.0	1.5	2.088	16	0	20m.my8031_rel_o2_lto.cy9_1g
822	40	8	0.1	1056.2	14.4	0.188	3.150	1.286	17.908	7143	5.9	177.685	11741	9.4	18.0	1.5	1.804	16	0	20m.my8031_rel_native_lto.cy9_1g
802	40	8	0.1	1036.5	14.1	0.189	3.117	1.293	18.020	7017	5.8	177.186	11717	9.4	18.0	1.5	1.929	16	0	20m.my8031_rel_lto.cy9_1g
q1000.1
q1000.1: range queries with 1000 insert/s per client
Performance metrics for all DBMS, not just the ones listed above. Some are normalized by throughput, others are not. Legend for results is here.
ips	qps	rps	rmbps	wps	wmbps	rpq	rkbpq	wpi	wkbpi	csps	cpups	cspq	cpupq	dbgb1	dbgb2	rss	maxop	p50	p99	tag
676	26	4	0.1	714.5	10.0	0.160	2.834	1.058	15.209	5030	4.8	194.944	14884	10.0	18.6	1.4	2.872	0	0	20m.my8031_rel_withdbg.cy9_1g
677	26	4	0.1	713.3	10.0	0.168	2.898	1.054	15.086	5031	4.9	197.296	15373	10.0	18.6	1.4	2.661	0	0	20m.my8031_rel_o2.cy9_1g
681	25	4	0.1	711.0	9.9	0.170	2.954	1.045	14.950	5022	4.8	199.276	15238	10.0	18.6	1.4	2.656	0	0	20m.my8031_rel_native.cy9_1g
689	25	4	0.1	714.1	10.0	0.165	2.923	1.036	14.835	5037	4.9	199.097	15494	10.0	18.6	1.3	2.283	0	0	20m.my8031_rel.cy9_1g
677	26	4	0.1	714.5	10.0	0.165	2.877	1.055	15.157	5032	4.8	195.788	14942	10.0	18.6	1.4	2.838	0	0	20m.my8031_rel_o2_lto.cy9_1g
681	26	4	0.1	714.4	10.0	0.167	2.883	1.048	15.054	5022	4.8	196.943	15059	10.0	18.6	1.4	2.911	0	0	20m.my8031_rel_native_lto.cy9_1g
680	26	4	0.1	715.7	10.0	0.164	2.854	1.053	15.119	5028	4.8	195.625	14942	10.0	18.6	1.4	2.823	0	0	20m.my8031_rel_lto.cy9_1g
l.i0
- l.i0: load without secondary indexes
- Legend for results is here.
- Each entry lists the percentage of responses that fit in that bucket (slower than max time for previous bucket, faster than min time for next bucket).
Insert response time histogram
256us	1ms	4ms	16ms	64ms	256ms	1s	4s	16s	gt	max	tag
0.000	0.000	98.340	1.333	0.304	0.024	0.000	0.000	0.000	0.000	0.132	my8031_rel_withdbg.cy9_1g
0.000	0.000	98.106	1.532	0.333	0.028	0.000	0.000	0.000	0.000	0.179	my8031_rel_o2.cy9_1g
0.000	0.000	98.216	1.474	0.283	0.027	0.000	0.000	0.000	0.000	0.135	my8031_rel_native.cy9_1g
0.000	0.000	98.258	1.401	0.312	0.029	0.000	0.000	0.000	0.000	0.140	my8031_rel.cy9_1g
0.000	0.000	98.279	1.303	0.397	0.021	0.000	0.000	0.000	0.000	0.160	my8031_rel_o2_lto.cy9_1g
0.000	0.000	98.093	1.511	0.367	0.029	0.000	0.000	0.000	0.000	0.156	my8031_rel_native_lto.cy9_1g
0.000	0.000	98.138	1.470	0.355	0.036	0.000	0.000	0.000	0.000	0.153	my8031_rel_lto.cy9_1g
l.x
- l.x: create secondary indexes
- Legend for results is here.
- Each entry lists the percentage of responses that fit in that bucket (slower than max time for previous bucket, faster than min time for next bucket).
TODO - determine whether there is data for create index response time
l.i1
- l.i1: continue load after secondary indexes created
- Legend for results is here.
- Each entry lists the percentage of responses that fit in that bucket (slower than max time for previous bucket, faster than min time for next bucket).
Insert response time histogram
256us	1ms	4ms	16ms	64ms	256ms	1s	4s	16s	gt	max	tag
0.000	0.000	0.017	18.766	40.317	38.721	1.970	0.177	0.032	0.000	6.969	my8031_rel_withdbg.cy9_1g
0.000	0.000	0.010	16.402	42.093	39.439	1.853	0.170	0.034	0.000	7.665	my8031_rel_o2.cy9_1g
0.000	0.000	0.019	17.883	40.870	39.069	1.945	0.185	0.028	0.000	8.279	my8031_rel_native.cy9_1g
0.000	0.000	0.015	17.709	41.258	38.973	1.834	0.181	0.030	0.000	8.018	my8031_rel.cy9_1g
0.000	0.000	0.015	18.304	40.782	38.736	1.953	0.182	0.027	0.000	7.691	my8031_rel_o2_lto.cy9_1g
0.000	0.000	0.032	19.195	39.892	38.727	1.943	0.182	0.029	0.000	7.840	my8031_rel_native_lto.cy9_1g
0.000	0.000	0.037	19.645	40.005	38.197	1.911	0.177	0.028	0.000	7.941	my8031_rel_lto.cy9_1g
q100.1
- q100.1: range queries with 100 insert/s per client
- Legend for results is here.
- Each entry lists the percentage of responses that fit in that bucket (slower than max time for previous bucket, faster than min time for next bucket).
Query response time histogram
256us	1ms	4ms	16ms	64ms	256ms	1s	4s	16s	gt	max	tag
0.000	10.778	3.700	7.877	34.046	40.172	3.420	0.007	0.000	0.000	1.790	my8031_rel_withdbg.cy9_1g
0.000	10.669	3.789	7.346	33.387	41.394	3.412	0.003	0.000	0.000	1.626	my8031_rel_o2.cy9_1g
0.000	10.300	3.524	7.324	33.182	42.252	3.416	0.001	0.000	0.000	1.439	my8031_rel_native.cy9_1g
0.000	10.232	3.544	7.341	33.387	42.006	3.489	0.000	0.000	0.000	0.966	my8031_rel.cy9_1g
0.000	11.070	3.706	7.815	34.086	39.985	3.335	0.004	0.000	0.000	1.305	my8031_rel_o2_lto.cy9_1g
0.001	10.760	3.322	7.495	34.154	40.941	3.322	0.004	0.000	0.000	1.958	my8031_rel_native_lto.cy9_1g
0.000	11.091	3.415	7.894	34.338	39.979	3.277	0.006	0.000	0.000	1.627	my8031_rel_lto.cy9_1g
Insert response time histogram
256us	1ms	4ms	16ms	64ms	256ms	1s	4s	16s	gt	max	tag
0.000	0.000	0.000	0.271	1.625	31.167	63.271	3.667	0.000	0.000	1.951	my8031_rel_withdbg.cy9_1g
0.000	0.000	0.000	0.243	1.306	29.299	65.868	3.285	0.000	0.000	2.095	my8031_rel_o2.cy9_1g
0.000	0.000	0.000	0.174	1.257	28.618	66.382	3.569	0.000	0.000	2.457	my8031_rel_native.cy9_1g
0.000	0.000	0.000	0.208	1.326	29.299	65.639	3.528	0.000	0.000	2.154	my8031_rel.cy9_1g
0.000	0.000	0.000	0.292	1.458	30.924	63.569	3.757	0.000	0.000	2.442	my8031_rel_o2_lto.cy9_1g
0.000	0.000	0.000	0.250	1.410	30.444	64.715	3.181	0.000	0.000	2.190	my8031_rel_native_lto.cy9_1g
0.000	0.000	0.000	0.292	1.417	30.889	63.889	3.514	0.000	0.000	3.388	my8031_rel_lto.cy9_1g
q500.1
- q500.1: range queries with 500 insert/s per client
- Legend for results is here.
- Each entry lists the percentage of responses that fit in that bucket (slower than max time for previous bucket, faster than min time for next bucket).
Query response time histogram
256us	1ms	4ms	16ms	64ms	256ms	1s	4s	16s	gt	max	tag
0.000	7.077	3.716	6.008	29.630	45.700	7.832	0.037	0.000	0.000	1.872	my8031_rel_withdbg.cy9_1g
0.000	6.834	3.905	5.956	29.163	46.278	7.826	0.037	0.000	0.000	2.481	my8031_rel_o2.cy9_1g
0.001	7.157	3.659	5.847	28.706	46.480	8.117	0.033	0.000	0.000	2.018	my8031_rel_native.cy9_1g
0.003	7.123	3.814	5.884	29.305	46.128	7.712	0.030	0.000	0.000	1.593	my8031_rel.cy9_1g
0.001	7.027	3.711	6.050	29.352	45.907	7.914	0.038	0.000	0.000	2.088	my8031_rel_o2_lto.cy9_1g
0.000	7.248	3.636	6.152	30.114	45.625	7.200	0.025	0.000	0.000	1.804	my8031_rel_native_lto.cy9_1g
0.000	7.462	3.489	6.112	29.913	45.438	7.565	0.022	0.000	0.000	1.929	my8031_rel_lto.cy9_1g
Insert response time histogram
256us	1ms	4ms	16ms	64ms	256ms	1s	4s	16s	gt	max	tag
0.000	0.000	0.000	1.793	8.171	53.981	35.267	0.789	0.000	0.000	2.512	my8031_rel_withdbg.cy9_1g
0.000	0.000	0.000	1.772	7.985	53.879	35.601	0.762	0.000	0.000	2.418	my8031_rel_o2.cy9_1g
0.000	0.000	0.000	1.726	7.825	53.286	36.329	0.833	0.000	0.000	3.351	my8031_rel_native.cy9_1g
0.000	0.000	0.000	1.868	8.261	53.893	35.192	0.786	0.000	0.000	2.637	my8031_rel.cy9_1g
0.000	0.000	0.001	1.669	7.512	53.292	36.735	0.790	0.000	0.000	2.908	my8031_rel_o2_lto.cy9_1g
0.000	0.000	0.000	1.717	8.447	54.721	34.513	0.603	0.000	0.000	3.191	my8031_rel_native_lto.cy9_1g
0.000	0.000	0.001	1.743	7.839	54.226	35.453	0.737	0.000	0.000	2.728	my8031_rel_lto.cy9_1g
q1000.1
- q1000.1: range queries with 1000 insert/s per client
- Legend for results is here.
- Each entry lists the percentage of responses that fit in that bucket (slower than max time for previous bucket, faster than min time for next bucket).
Query response time histogram
256us	1ms	4ms	16ms	64ms	256ms	1s	4s	16s	gt	max	tag
0.000	5.767	3.607	4.963	21.750	43.514	20.200	0.199	0.000	0.000	2.872	my8031_rel_withdbg.cy9_1g
nonzero	5.597	3.802	4.799	21.194	43.830	20.574	0.203	0.000	0.000	2.661	my8031_rel_o2.cy9_1g
0.000	5.670	3.641	4.717	20.779	44.104	20.875	0.214	0.000	0.000	2.656	my8031_rel_native.cy9_1g
0.000	5.639	3.708	4.824	20.863	43.863	20.896	0.207	0.000	0.000	2.283	my8031_rel.cy9_1g
0.000	5.929	3.596	4.938	21.427	43.704	20.191	0.216	0.000	0.000	2.838	my8031_rel_o2_lto.cy9_1g
0.000	5.954	3.536	4.881	21.441	43.382	20.611	0.196	0.000	0.000	2.911	my8031_rel_native_lto.cy9_1g
0.000	6.050	3.546	4.936	21.476	43.477	20.309	0.204	0.000	0.000	2.823	my8031_rel_lto.cy9_1g
Insert response time histogram
256us	1ms	4ms	16ms	64ms	256ms	1s	4s	16s	gt	max	tag
0.000	0.000	0.000	3.451	5.365	44.721	44.998	1.465	0.000	0.000	2.668	my8031_rel_withdbg.cy9_1g
0.000	0.000	0.000	3.274	5.609	45.090	44.427	1.601	0.000	0.000	3.069	my8031_rel_o2.cy9_1g
0.000	0.000	0.000	3.472	5.888	45.002	44.006	1.632	0.000	0.000	3.268	my8031_rel_native.cy9_1g
0.000	0.000	0.000	3.472	6.146	45.301	43.483	1.599	0.000	0.000	2.889	my8031_rel.cy9_1g
0.000	0.000	0.000	3.467	5.552	44.699	44.733	1.549	0.000	0.000	2.578	my8031_rel_o2_lto.cy9_1g
0.000	0.000	0.001	3.568	5.683	45.146	44.061	1.542	0.000	0.000	3.582	my8031_rel_native_lto.cy9_1g
0.000	0.000	0.000	3.644	5.553	44.940	44.322	1.542	0.000	0.000	2.842	my8031_rel_lto.cy9_1g