Introduction
This is a report for the insert benchmark with 20M docs and 1 client(s). It is generated by scripts (bash, awk, sed) and Tufte might not be impressed. An overview of the insert benchmark is here and a short update is here. Below, by DBMS, I mean DBMS+version.config. An example is my8020.c10b40 where my means MySQL, 8020 is version 8.0.20 and c10b40 is the name for the configuration file.
The test server has 8 AMD cores, 16G RAM and an NVMe SSD. It is described here as the Beelink. The benchmark was run with 1 client and there were 1 or 2 connections per client (1 for queries, 1 for inserts). The benchmark loads 20M rows without secondary indexes, creates secondary indexes, loads another 20M rows then does 3 read+write tests for one hour each that do queries as fast as possible with 100, 500 and then 1000 writes/second/client concurrent with the queries. There is 1 table. The database is cached by the storage engine and the only IO is for writes. Clients and the DBMS share one server. The per-database configs are in the per-database subdirectories here.
The tested DBMS are:
- my8031_rel_withdbg.cy9 - InnoDB and MySQL 8.0.31, the cy9 config and compiled with CMAKE_BUILD_TYPE=RelWitDebInfo -O2 -flto
- my8031_rel_o2.cy9 - InnoDB and MySQL 8.0.31, the cy9 config and compiled with CMAKE_BUILD_TYPE=Release -O2
- my8031_rel_native.cy9 - InnoDB and MySQL 8.0.31, the cy9 config and compiled with CMAKE_BUILD_TYPE=Release -O3 -march=native -mtune=native
- my8031_rel.cy9 - InnoDB and MySQL 8.0.31, the cy9 config and compiled with CMAKE_BUILD_TYPE=Release -O3
- my8031_rel_o2_lto.cy9 - InnoDB and MySQL 8.0.31, the cy9 config and compiled with CMAKE_BUILD_TYPE=Release -O2 -flto
- my8031_rel_native_lto.cy9 - InnoDB and MySQL 8.0.31, the cy9 config and compiled with CMAKE_BUILD_TYPE=Release -O3 -flto -march=native -mtune=native
- my8031_rel_lto.cy9 - InnoDB and MySQL 8.0.31, the cy9 config and compiled with CMAKE_BUILD_TYPE=Release -O3 -flto
Contents
- Summary
- l.i0: load without secondary indexes
- l.x: create secondary indexes
- l.i1: continue load after secondary indexes created
- q100.1: range queries with 100 insert/s per client
- q500.1: range queries with 500 insert/s per client
- q1000.1: range queries with 1000 insert/s per client
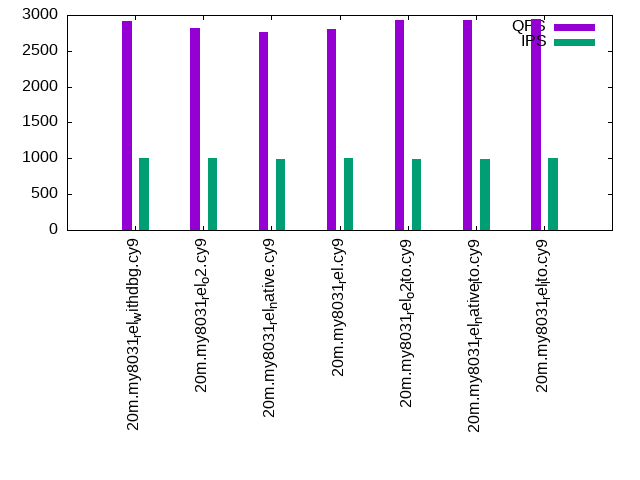
Summary
The numbers are inserts/s for l.i0 and l.i1, indexed docs (or rows) /s for l.x and queries/s for q*.2. The values are the average rate over the entire test for inserts (IPS) and queries (QPS). The range of values for IPS and QPS is split into 3 parts: bottom 25%, middle 50%, top 25%. Values in the bottom 25% have a red background, values in the top 25% have a green background and values in the middle have no color. A gray background is used for values that can be ignored because the DBMS did not sustain the target insert rate. Red backgrounds are not used when the minimum value is within 80% of the max value.
| dbms | l.i0 | l.x | l.i1 | q100.1 | q500.1 | q1000.1 |
|---|---|---|---|---|---|---|
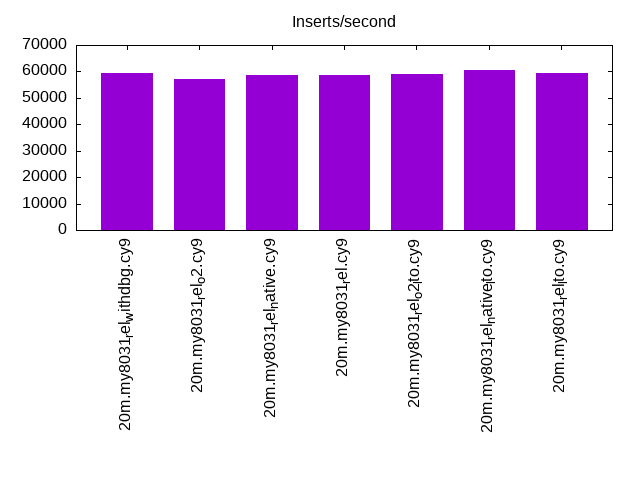
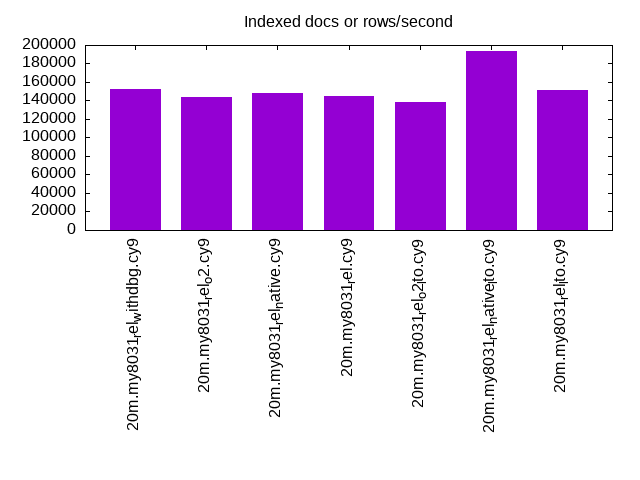
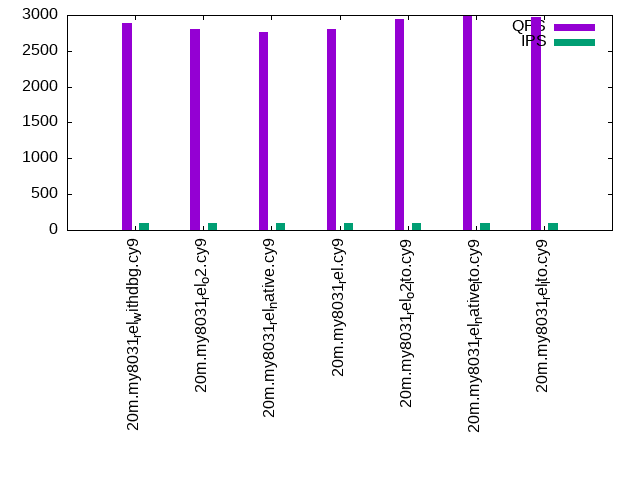
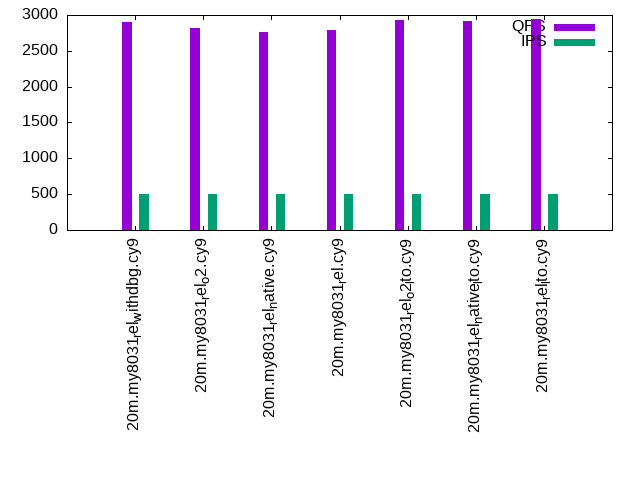
| 20m.my8031_rel_withdbg.cy9 | 59347 | 152273 | 21209 | 2889 | 2907 | 2915 |
| 20m.my8031_rel_o2.cy9 | 57306 | 143571 | 20182 | 2806 | 2815 | 2817 |
| 20m.my8031_rel_native.cy9 | 58480 | 147794 | 20682 | 2769 | 2763 | 2760 |
| 20m.my8031_rel.cy9 | 58651 | 144604 | 20576 | 2808 | 2797 | 2805 |
| 20m.my8031_rel_o2_lto.cy9 | 59172 | 138621 | 20833 | 2944 | 2931 | 2934 |
| 20m.my8031_rel_native_lto.cy9 | 60423 | 193269 | 21786 | 2991 | 2911 | 2937 |
| 20m.my8031_rel_lto.cy9 | 59524 | 151128 | 21598 | 2972 | 2945 | 2948 |
This table has relative throughput, throughput for the DBMS relative to the DBMS in the first line, using the absolute throughput from the previous table.
| dbms | l.i0 | l.x | l.i1 | q100.1 | q500.1 | q1000.1 |
|---|---|---|---|---|---|---|
| 20m.my8031_rel_withdbg.cy9 | 1.00 | 1.00 | 1.00 | 1.00 | 1.00 | 1.00 |
| 20m.my8031_rel_o2.cy9 | 0.97 | 0.94 | 0.95 | 0.97 | 0.97 | 0.97 |
| 20m.my8031_rel_native.cy9 | 0.99 | 0.97 | 0.98 | 0.96 | 0.95 | 0.95 |
| 20m.my8031_rel.cy9 | 0.99 | 0.95 | 0.97 | 0.97 | 0.96 | 0.96 |
| 20m.my8031_rel_o2_lto.cy9 | 1.00 | 0.91 | 0.98 | 1.02 | 1.01 | 1.01 |
| 20m.my8031_rel_native_lto.cy9 | 1.02 | 1.27 | 1.03 | 1.04 | 1.00 | 1.01 |
| 20m.my8031_rel_lto.cy9 | 1.00 | 0.99 | 1.02 | 1.03 | 1.01 | 1.01 |
This lists the average rate of inserts/s for the tests that do inserts concurrent with queries. For such tests the query rate is listed in the table above. The read+write tests are setup so that the insert rate should match the target rate every second. Cells that are not at least 95% of the target have a red background to indicate a failure to satisfy the target.
| dbms | q100.1 | q500.1 | q1000.1 |
|---|---|---|---|
| my8031_rel_withdbg.cy9 | 100 | 499 | 998 |
| my8031_rel_o2.cy9 | 100 | 499 | 998 |
| my8031_rel_native.cy9 | 100 | 498 | 996 |
| my8031_rel.cy9 | 100 | 499 | 998 |
| my8031_rel_o2_lto.cy9 | 100 | 498 | 997 |
| my8031_rel_native_lto.cy9 | 100 | 498 | 997 |
| my8031_rel_lto.cy9 | 100 | 499 | 998 |
| target | 100 | 500 | 1000 |
l.i0
l.i0: load without secondary indexes. Graphs for performance per 1-second interval are here.
Average throughput:
Insert response time histogram: each cell has the percentage of responses that take <= the time in the header and max is the max response time in seconds. For the max column values in the top 25% of the range have a red background and in the bottom 25% of the range have a green background. The red background is not used when the min value is within 80% of the max value.
| dbms | 256us | 1ms | 4ms | 16ms | 64ms | 256ms | 1s | 4s | 16s | gt | max |
|---|---|---|---|---|---|---|---|---|---|---|---|
| my8031_rel_withdbg.cy9 | 99.438 | 0.422 | 0.136 | 0.003 | 0.079 | ||||||
| my8031_rel_o2.cy9 | 99.409 | 0.451 | 0.136 | 0.003 | 0.083 | ||||||
| my8031_rel_native.cy9 | 99.416 | 0.440 | 0.140 | 0.003 | 0.076 | ||||||
| my8031_rel.cy9 | 99.440 | 0.451 | 0.106 | 0.003 | 0.098 | ||||||
| my8031_rel_o2_lto.cy9 | 99.436 | 0.411 | 0.149 | 0.004 | 0.101 | ||||||
| my8031_rel_native_lto.cy9 | 99.436 | 0.415 | 0.146 | 0.003 | 0.094 | ||||||
| my8031_rel_lto.cy9 | 99.458 | 0.384 | 0.154 | 0.003 | 0.105 |
Performance metrics for the DBMS listed above. Some are normalized by throughput, others are not. Legend for results is here.
ips	qps	rps	rmbps	wps	wmbps	rpq	rkbpq	wpi	wkbpi	csps	cpups	cspq	cpupq	dbgb1	dbgb2	rss	maxop	p50	p99	tag
59347	0	0	0.0	189.0	18.0	0.000	0.000	0.003	0.311	6574	20.5	0.111	28	1.3	9.9	2.5	0.079	59734	53741	20m.my8031_rel_withdbg.cy9
57306	0	0	0.0	184.0	17.4	0.000	0.000	0.003	0.312	6379	20.5	0.111	29	1.3	9.9	2.5	0.083	57493	39422	20m.my8031_rel_o2.cy9
58480	0	0	0.0	187.3	17.8	0.000	0.000	0.003	0.311	6496	20.5	0.111	28	1.3	9.9	2.5	0.076	58635	52047	20m.my8031_rel_native.cy9
58651	0	0	0.0	187.7	17.8	0.000	0.000	0.003	0.311	6508	20.7	0.111	28	1.3	9.9	2.5	0.098	58933	52257	20m.my8031_rel.cy9
59172	0	0	0.0	189.0	18.0	0.000	0.000	0.003	0.311	6574	20.4	0.111	28	1.3	9.9	2.5	0.101	59746	34620	20m.my8031_rel_o2_lto.cy9
60423	0	0	0.0	190.9	18.3	0.000	0.000	0.003	0.310	6656	20.4	0.110	27	1.3	9.9	2.5	0.094	60550	52941	20m.my8031_rel_native_lto.cy9
59524	0	0	0.0	189.6	18.1	0.000	0.000	0.003	0.311	6606	20.3	0.111	27	1.3	9.9	2.5	0.105	59934	35961	20m.my8031_rel_lto.cy9
l.x
l.x: create secondary indexes.
Average throughput:
Performance metrics for the DBMS listed above. Some are normalized by throughput, others are not. Legend for results is here.
ips	qps	rps	rmbps	wps	wmbps	rpq	rkbpq	wpi	wkbpi	csps	cpups	cspq	cpupq	dbgb1	dbgb2	rss	maxop	p50	p99	tag
152273	0	798	53.3	2615.8	153.3	0.005	0.359	0.017	1.031	10029	43.0	0.066	23	3.0	11.5	3.9	0.011	NA	NA	20m.my8031_rel_withdbg.cy9
143571	0	768	51.4	2062.2	140.4	0.005	0.366	0.014	1.002	8923	43.6	0.062	24	3.0	11.5	3.9	0.011	NA	NA	20m.my8031_rel_o2.cy9
147794	0	768	51.4	2738.5	151.0	0.005	0.356	0.019	1.046	10274	42.9	0.070	23	3.0	11.5	3.9	0.011	NA	NA	20m.my8031_rel_native.cy9
144604	0	768	51.4	2294.8	143.9	0.005	0.364	0.016	1.019	9337	43.9	0.065	24	3.0	11.5	3.9	0.011	NA	NA	20m.my8031_rel.cy9
138621	0	717	47.9	2826.8	145.0	0.005	0.354	0.020	1.071	9960	41.2	0.072	24	3.0	11.5	3.9	0.015	NA	NA	20m.my8031_rel_o2_lto.cy9
193269	0	1036	69.3	2890.9	191.1	0.005	0.367	0.015	1.012	12261	43.7	0.063	18	3.0	11.5	3.9	0.020	NA	NA	20m.my8031_rel_native_lto.cy9
151128	0	798	53.4	2560.3	152.4	0.005	0.362	0.017	1.032	10033	43.2	0.066	23	3.0	11.5	3.9	0.014	NA	NA	20m.my8031_rel_lto.cy9
l.i1
l.i1: continue load after secondary indexes created. Graphs for performance per 1-second interval are here.
Average throughput:

Insert response time histogram: each cell has the percentage of responses that take <= the time in the header and max is the max response time in seconds. For the max column values in the top 25% of the range have a red background and in the bottom 25% of the range have a green background. The red background is not used when the min value is within 80% of the max value.
| dbms | 256us | 1ms | 4ms | 16ms | 64ms | 256ms | 1s | 4s | 16s | gt | max |
|---|---|---|---|---|---|---|---|---|---|---|---|
| my8031_rel_withdbg.cy9 | 98.575 | 1.123 | 0.301 | 0.001 | 0.071 | ||||||
| my8031_rel_o2.cy9 | 98.555 | 1.150 | 0.294 | 0.001 | 0.072 | ||||||
| my8031_rel_native.cy9 | 98.568 | 1.143 | 0.288 | 0.002 | 0.072 | ||||||
| my8031_rel.cy9 | 98.553 | 1.151 | 0.296 | 0.001 | 0.070 | ||||||
| my8031_rel_o2_lto.cy9 | 98.573 | 1.128 | 0.297 | 0.002 | 0.083 | ||||||
| my8031_rel_native_lto.cy9 | 98.599 | 1.094 | 0.306 | 0.002 | 0.079 | ||||||
| my8031_rel_lto.cy9 | 98.596 | 1.094 | 0.308 | 0.002 | 0.086 |
Performance metrics for the DBMS listed above. Some are normalized by throughput, others are not. Legend for results is here.
ips	qps	rps	rmbps	wps	wmbps	rpq	rkbpq	wpi	wkbpi	csps	cpups	cspq	cpupq	dbgb1	dbgb2	rss	maxop	p50	p99	tag
21209	0	98	1.5	936.8	36.8	0.005	0.074	0.044	1.779	7699	15.7	0.363	59	7.9	16.4	8.3	0.071	21774	1598	20m.my8031_rel_withdbg.cy9
20182	0	94	1.5	905.4	35.4	0.005	0.074	0.045	1.797	7379	15.2	0.366	60	7.9	16.4	8.3	0.072	20827	1698	20m.my8031_rel_o2.cy9
20682	0	96	1.5	915.9	36.0	0.005	0.074	0.044	1.781	7473	15.3	0.361	59	7.9	16.4	8.3	0.072	21234	1699	20m.my8031_rel_native.cy9
20576	0	95	1.5	918.9	36.0	0.005	0.074	0.045	1.791	7457	15.3	0.362	59	7.9	16.4	8.3	0.070	21176	1598	20m.my8031_rel.cy9
20833	0	96	1.5	922.8	36.2	0.005	0.074	0.044	1.780	7581	15.4	0.364	59	7.9	16.4	8.3	0.083	21327	1648	20m.my8031_rel_o2_lto.cy9
21786	0	101	1.6	957.0	37.7	0.005	0.074	0.044	1.773	7863	15.8	0.361	58	7.9	16.4	8.3	0.079	22425	1599	20m.my8031_rel_native_lto.cy9
21598	0	100	1.6	952.5	37.5	0.005	0.074	0.044	1.776	7853	15.8	0.364	59	7.9	16.4	8.3	0.086	22126	1599	20m.my8031_rel_lto.cy9
q100.1
q100.1: range queries with 100 insert/s per client. Graphs for performance per 1-second interval are here.
Average throughput:
Query response time histogram: each cell has the percentage of responses that take <= the time in the header and max is the max response time in seconds. For max values in the top 25% of the range have a red background and in the bottom 25% of the range have a green background. The red background is not used when the min value is within 80% of the max value.
| dbms | 256us | 1ms | 4ms | 16ms | 64ms | 256ms | 1s | 4s | 16s | gt | max |
|---|---|---|---|---|---|---|---|---|---|---|---|
| my8031_rel_withdbg.cy9 | 9.571 | 90.428 | nonzero | nonzero | nonzero | 0.022 | |||||
| my8031_rel_o2.cy9 | 3.871 | 96.129 | nonzero | nonzero | nonzero | 0.018 | |||||
| my8031_rel_native.cy9 | 3.162 | 96.837 | nonzero | nonzero | 0.015 | ||||||
| my8031_rel.cy9 | 3.633 | 96.366 | nonzero | nonzero | nonzero | 0.017 | |||||
| my8031_rel_o2_lto.cy9 | 17.186 | 82.813 | nonzero | nonzero | nonzero | 0.023 | |||||
| my8031_rel_native_lto.cy9 | 20.410 | 79.590 | nonzero | nonzero | nonzero | 0.023 | |||||
| my8031_rel_lto.cy9 | 19.882 | 80.117 | nonzero | nonzero | nonzero | 0.022 |
Insert response time histogram: each cell has the percentage of responses that take <= the time in the header and max is the max response time in seconds. For max values in the top 25% of the range have a red background and in the bottom 25% of the range have a green background. The red background is not used when the min value is within 80% of the max value.
| dbms | 256us | 1ms | 4ms | 16ms | 64ms | 256ms | 1s | 4s | 16s | gt | max |
|---|---|---|---|---|---|---|---|---|---|---|---|
| my8031_rel_withdbg.cy9 | 98.833 | 0.472 | 0.694 | 0.026 | |||||||
| my8031_rel_o2.cy9 | 98.722 | 0.611 | 0.667 | 0.026 | |||||||
| my8031_rel_native.cy9 | 98.917 | 0.500 | 0.583 | 0.026 | |||||||
| my8031_rel.cy9 | 98.528 | 0.861 | 0.611 | 0.029 | |||||||
| my8031_rel_o2_lto.cy9 | 99.028 | 0.278 | 0.694 | 0.034 | |||||||
| my8031_rel_native_lto.cy9 | 98.972 | 0.444 | 0.583 | 0.027 | |||||||
| my8031_rel_lto.cy9 | 98.917 | 0.444 | 0.639 | 0.030 |
Performance metrics for the DBMS listed above. Some are normalized by throughput, others are not. Legend for results is here.
ips	qps	rps	rmbps	wps	wmbps	rpq	rkbpq	wpi	wkbpi	csps	cpups	cspq	cpupq	dbgb1	dbgb2	rss	maxop	p50	p99	tag
100	2889	0	0.0	183.1	4.5	0.000	0.000	1.835	46.399	11988	13.1	4.150	363	8.0	16.5	8.4	0.022	2863	2764	20m.my8031_rel_withdbg.cy9
100	2806	0	0.0	183.4	4.5	0.000	0.000	1.841	46.515	11706	13.2	4.171	376	8.0	16.5	8.4	0.018	2796	2685	20m.my8031_rel_o2.cy9
100	2769	0	0.0	182.8	4.5	0.000	0.000	1.835	46.416	11541	13.2	4.169	381	8.0	16.5	8.4	0.015	2751	2653	20m.my8031_rel_native.cy9
100	2808	0	0.0	185.9	4.6	0.000	0.000	1.865	47.194	11688	13.3	4.163	379	8.0	16.5	8.4	0.017	2797	2685	20m.my8031_rel.cy9
100	2944	0	0.0	184.3	4.6	0.000	0.000	1.849	46.747	12218	12.8	4.150	348	8.0	16.5	8.4	0.023	2925	2797	20m.my8031_rel_o2_lto.cy9
100	2991	0	0.0	182.0	4.5	0.000	0.000	1.828	46.269	12407	12.8	4.148	342	8.0	16.5	8.4	0.023	2975	2844	20m.my8031_rel_native_lto.cy9
100	2972	0	0.0	185.2	4.6	0.000	0.000	1.860	47.064	12344	12.9	4.153	347	8.0	16.5	8.4	0.022	2957	2829	20m.my8031_rel_lto.cy9
q500.1
q500.1: range queries with 500 insert/s per client. Graphs for performance per 1-second interval are here.
Average throughput:
Query response time histogram: each cell has the percentage of responses that take <= the time in the header and max is the max response time in seconds. For max values in the top 25% of the range have a red background and in the bottom 25% of the range have a green background. The red background is not used when the min value is within 80% of the max value.
| dbms | 256us | 1ms | 4ms | 16ms | 64ms | 256ms | 1s | 4s | 16s | gt | max |
|---|---|---|---|---|---|---|---|---|---|---|---|
| my8031_rel_withdbg.cy9 | 12.500 | 87.498 | 0.001 | 0.001 | nonzero | 0.019 | |||||
| my8031_rel_o2.cy9 | 4.052 | 95.946 | 0.001 | 0.001 | nonzero | 0.026 | |||||
| my8031_rel_native.cy9 | 2.848 | 97.151 | 0.001 | 0.001 | nonzero | 0.018 | |||||
| my8031_rel.cy9 | 3.733 | 96.266 | nonzero | 0.001 | nonzero | 0.018 | |||||
| my8031_rel_o2_lto.cy9 | 15.853 | 84.145 | 0.001 | nonzero | nonzero | 0.021 | |||||
| my8031_rel_native_lto.cy9 | 15.760 | 84.239 | 0.001 | 0.001 | nonzero | 0.020 | |||||
| my8031_rel_lto.cy9 | 17.958 | 82.040 | nonzero | 0.001 | nonzero | 0.023 |
Insert response time histogram: each cell has the percentage of responses that take <= the time in the header and max is the max response time in seconds. For max values in the top 25% of the range have a red background and in the bottom 25% of the range have a green background. The red background is not used when the min value is within 80% of the max value.
| dbms | 256us | 1ms | 4ms | 16ms | 64ms | 256ms | 1s | 4s | 16s | gt | max |
|---|---|---|---|---|---|---|---|---|---|---|---|
| my8031_rel_withdbg.cy9 | 98.822 | 0.728 | 0.450 | 0.025 | |||||||
| my8031_rel_o2.cy9 | 98.744 | 0.744 | 0.511 | 0.029 | |||||||
| my8031_rel_native.cy9 | 99.133 | 0.322 | 0.544 | 0.026 | |||||||
| my8031_rel.cy9 | 98.983 | 0.483 | 0.533 | 0.025 | |||||||
| my8031_rel_o2_lto.cy9 | 98.883 | 0.617 | 0.500 | 0.031 | |||||||
| my8031_rel_native_lto.cy9 | 99.122 | 0.317 | 0.561 | 0.028 | |||||||
| my8031_rel_lto.cy9 | 99.028 | 0.433 | 0.539 | 0.027 |
Performance metrics for the DBMS listed above. Some are normalized by throughput, others are not. Legend for results is here.
ips	qps	rps	rmbps	wps	wmbps	rpq	rkbpq	wpi	wkbpi	csps	cpups	cspq	cpupq	dbgb1	dbgb2	rss	maxop	p50	p99	tag
499	2907	0	0.0	49.2	1.6	0.000	0.000	0.099	3.201	11699	13.4	4.024	369	8.4	17.0	8.8	0.019	2893	2777	20m.my8031_rel_withdbg.cy9
499	2815	0	0.0	49.8	1.6	0.000	0.000	0.100	3.230	11353	13.4	4.033	381	8.4	17.0	8.8	0.026	2797	2687	20m.my8031_rel_o2.cy9
498	2763	0	0.0	50.0	1.6	0.000	0.000	0.100	3.246	11163	13.4	4.040	388	8.4	17.0	8.8	0.018	2749	2637	20m.my8031_rel_native.cy9
499	2797	0	0.0	48.2	1.5	0.000	0.000	0.097	3.151	11267	13.4	4.028	383	8.4	17.0	8.8	0.018	2781	2683	20m.my8031_rel.cy9
498	2931	0	0.0	50.1	1.6	0.000	0.000	0.101	3.261	11811	13.4	4.029	366	8.4	17.0	8.8	0.021	2925	2781	20m.my8031_rel_o2_lto.cy9
498	2911	0	0.0	52.6	1.7	0.000	0.000	0.106	3.408	11736	13.3	4.031	365	8.4	17.0	8.8	0.020	2908	2781	20m.my8031_rel_native_lto.cy9
499	2945	0	0.0	49.2	1.6	0.000	0.000	0.099	3.212	11871	13.4	4.031	364	8.4	17.0	8.8	0.023	2926	2813	20m.my8031_rel_lto.cy9
q1000.1
q1000.1: range queries with 1000 insert/s per client. Graphs for performance per 1-second interval are here.
Average throughput:
Query response time histogram: each cell has the percentage of responses that take <= the time in the header and max is the max response time in seconds. For max values in the top 25% of the range have a red background and in the bottom 25% of the range have a green background. The red background is not used when the min value is within 80% of the max value.
| dbms | 256us | 1ms | 4ms | 16ms | 64ms | 256ms | 1s | 4s | 16s | gt | max |
|---|---|---|---|---|---|---|---|---|---|---|---|
| my8031_rel_withdbg.cy9 | 12.216 | 87.781 | 0.001 | 0.001 | nonzero | 0.020 | |||||
| my8031_rel_o2.cy9 | 4.239 | 95.759 | 0.001 | nonzero | nonzero | 0.019 | |||||
| my8031_rel_native.cy9 | 4.150 | 95.847 | 0.001 | nonzero | nonzero | 0.019 | |||||
| my8031_rel.cy9 | 4.301 | 95.698 | 0.001 | nonzero | nonzero | 0.018 | |||||
| my8031_rel_o2_lto.cy9 | 15.620 | 84.378 | 0.001 | nonzero | 0.001 | 0.026 | |||||
| my8031_rel_native_lto.cy9 | 16.314 | 83.684 | 0.001 | 0.001 | nonzero | 0.026 | |||||
| my8031_rel_lto.cy9 | 17.887 | 82.111 | 0.001 | nonzero | nonzero | 0.024 |
Insert response time histogram: each cell has the percentage of responses that take <= the time in the header and max is the max response time in seconds. For max values in the top 25% of the range have a red background and in the bottom 25% of the range have a green background. The red background is not used when the min value is within 80% of the max value.
| dbms | 256us | 1ms | 4ms | 16ms | 64ms | 256ms | 1s | 4s | 16s | gt | max |
|---|---|---|---|---|---|---|---|---|---|---|---|
| my8031_rel_withdbg.cy9 | 99.167 | 0.572 | 0.261 | 0.026 | |||||||
| my8031_rel_o2.cy9 | 99.317 | 0.378 | 0.306 | 0.026 | |||||||
| my8031_rel_native.cy9 | 99.264 | 0.456 | 0.281 | 0.030 | |||||||
| my8031_rel.cy9 | 99.364 | 0.361 | 0.275 | 0.026 | |||||||
| my8031_rel_o2_lto.cy9 | 99.231 | 0.483 | 0.286 | 0.031 | |||||||
| my8031_rel_native_lto.cy9 | 99.183 | 0.558 | 0.258 | 0.031 | |||||||
| my8031_rel_lto.cy9 | 99.344 | 0.369 | 0.286 | 0.030 |
Performance metrics for the DBMS listed above. Some are normalized by throughput, others are not. Legend for results is here.
ips	qps	rps	rmbps	wps	wmbps	rpq	rkbpq	wpi	wkbpi	csps	cpups	cspq	cpupq	dbgb1	dbgb2	rss	maxop	p50	p99	tag
998	2915	0	0.0	157.3	4.4	0.000	0.000	0.158	4.563	12193	13.6	4.183	373	8.8	17.4	9.2	0.020	2893	2764	20m.my8031_rel_withdbg.cy9
998	2817	0	0.0	156.0	4.4	0.000	0.000	0.156	4.531	11801	13.8	4.190	392	8.8	17.4	9.2	0.019	2797	2685	20m.my8031_rel_o2.cy9
996	2760	0	0.0	155.5	4.4	0.000	0.000	0.156	4.527	11594	13.6	4.201	394	8.8	17.4	9.2	0.019	2749	2637	20m.my8031_rel_native.cy9
998	2805	0	0.0	155.4	4.4	0.000	0.000	0.156	4.525	11742	13.7	4.186	391	8.8	17.4	9.2	0.018	2783	2669	20m.my8031_rel.cy9
997	2934	0	0.0	156.0	4.4	0.000	0.000	0.156	4.528	12248	13.5	4.174	368	8.8	17.4	9.2	0.026	2925	2781	20m.my8031_rel_o2_lto.cy9
997	2937	0	0.0	157.2	4.4	0.000	0.000	0.158	4.558	12257	13.5	4.173	368	8.8	17.4	9.2	0.026	2925	2797	20m.my8031_rel_native_lto.cy9
998	2948	0	0.0	156.9	4.4	0.000	0.000	0.157	4.557	12305	13.5	4.173	366	8.8	17.4	9.2	0.024	2940	2812	20m.my8031_rel_lto.cy9
l.i0
l.i0: load without secondary indexes
Performance metrics for all DBMS, not just the ones listed above. Some are normalized by throughput, others are not. Legend for results is here.
ips	qps	rps	rmbps	wps	wmbps	rpq	rkbpq	wpi	wkbpi	csps	cpups	cspq	cpupq	dbgb1	dbgb2	rss	maxop	p50	p99	tag
59347	0	0	0.0	189.0	18.0	0.000	0.000	0.003	0.311	6574	20.5	0.111	28	1.3	9.9	2.5	0.079	59734	53741	20m.my8031_rel_withdbg.cy9
57306	0	0	0.0	184.0	17.4	0.000	0.000	0.003	0.312	6379	20.5	0.111	29	1.3	9.9	2.5	0.083	57493	39422	20m.my8031_rel_o2.cy9
58480	0	0	0.0	187.3	17.8	0.000	0.000	0.003	0.311	6496	20.5	0.111	28	1.3	9.9	2.5	0.076	58635	52047	20m.my8031_rel_native.cy9
58651	0	0	0.0	187.7	17.8	0.000	0.000	0.003	0.311	6508	20.7	0.111	28	1.3	9.9	2.5	0.098	58933	52257	20m.my8031_rel.cy9
59172	0	0	0.0	189.0	18.0	0.000	0.000	0.003	0.311	6574	20.4	0.111	28	1.3	9.9	2.5	0.101	59746	34620	20m.my8031_rel_o2_lto.cy9
60423	0	0	0.0	190.9	18.3	0.000	0.000	0.003	0.310	6656	20.4	0.110	27	1.3	9.9	2.5	0.094	60550	52941	20m.my8031_rel_native_lto.cy9
59524	0	0	0.0	189.6	18.1	0.000	0.000	0.003	0.311	6606	20.3	0.111	27	1.3	9.9	2.5	0.105	59934	35961	20m.my8031_rel_lto.cy9
l.x
l.x: create secondary indexes
Performance metrics for all DBMS, not just the ones listed above. Some are normalized by throughput, others are not. Legend for results is here.
ips	qps	rps	rmbps	wps	wmbps	rpq	rkbpq	wpi	wkbpi	csps	cpups	cspq	cpupq	dbgb1	dbgb2	rss	maxop	p50	p99	tag
152273	0	798	53.3	2615.8	153.3	0.005	0.359	0.017	1.031	10029	43.0	0.066	23	3.0	11.5	3.9	0.011	NA	NA	20m.my8031_rel_withdbg.cy9
143571	0	768	51.4	2062.2	140.4	0.005	0.366	0.014	1.002	8923	43.6	0.062	24	3.0	11.5	3.9	0.011	NA	NA	20m.my8031_rel_o2.cy9
147794	0	768	51.4	2738.5	151.0	0.005	0.356	0.019	1.046	10274	42.9	0.070	23	3.0	11.5	3.9	0.011	NA	NA	20m.my8031_rel_native.cy9
144604	0	768	51.4	2294.8	143.9	0.005	0.364	0.016	1.019	9337	43.9	0.065	24	3.0	11.5	3.9	0.011	NA	NA	20m.my8031_rel.cy9
138621	0	717	47.9	2826.8	145.0	0.005	0.354	0.020	1.071	9960	41.2	0.072	24	3.0	11.5	3.9	0.015	NA	NA	20m.my8031_rel_o2_lto.cy9
193269	0	1036	69.3	2890.9	191.1	0.005	0.367	0.015	1.012	12261	43.7	0.063	18	3.0	11.5	3.9	0.020	NA	NA	20m.my8031_rel_native_lto.cy9
151128	0	798	53.4	2560.3	152.4	0.005	0.362	0.017	1.032	10033	43.2	0.066	23	3.0	11.5	3.9	0.014	NA	NA	20m.my8031_rel_lto.cy9
l.i1
l.i1: continue load after secondary indexes created
Performance metrics for all DBMS, not just the ones listed above. Some are normalized by throughput, others are not. Legend for results is here.
ips	qps	rps	rmbps	wps	wmbps	rpq	rkbpq	wpi	wkbpi	csps	cpups	cspq	cpupq	dbgb1	dbgb2	rss	maxop	p50	p99	tag
21209	0	98	1.5	936.8	36.8	0.005	0.074	0.044	1.779	7699	15.7	0.363	59	7.9	16.4	8.3	0.071	21774	1598	20m.my8031_rel_withdbg.cy9
20182	0	94	1.5	905.4	35.4	0.005	0.074	0.045	1.797	7379	15.2	0.366	60	7.9	16.4	8.3	0.072	20827	1698	20m.my8031_rel_o2.cy9
20682	0	96	1.5	915.9	36.0	0.005	0.074	0.044	1.781	7473	15.3	0.361	59	7.9	16.4	8.3	0.072	21234	1699	20m.my8031_rel_native.cy9
20576	0	95	1.5	918.9	36.0	0.005	0.074	0.045	1.791	7457	15.3	0.362	59	7.9	16.4	8.3	0.070	21176	1598	20m.my8031_rel.cy9
20833	0	96	1.5	922.8	36.2	0.005	0.074	0.044	1.780	7581	15.4	0.364	59	7.9	16.4	8.3	0.083	21327	1648	20m.my8031_rel_o2_lto.cy9
21786	0	101	1.6	957.0	37.7	0.005	0.074	0.044	1.773	7863	15.8	0.361	58	7.9	16.4	8.3	0.079	22425	1599	20m.my8031_rel_native_lto.cy9
21598	0	100	1.6	952.5	37.5	0.005	0.074	0.044	1.776	7853	15.8	0.364	59	7.9	16.4	8.3	0.086	22126	1599	20m.my8031_rel_lto.cy9
q100.1
q100.1: range queries with 100 insert/s per client
Performance metrics for all DBMS, not just the ones listed above. Some are normalized by throughput, others are not. Legend for results is here.
ips	qps	rps	rmbps	wps	wmbps	rpq	rkbpq	wpi	wkbpi	csps	cpups	cspq	cpupq	dbgb1	dbgb2	rss	maxop	p50	p99	tag
100	2889	0	0.0	183.1	4.5	0.000	0.000	1.835	46.399	11988	13.1	4.150	363	8.0	16.5	8.4	0.022	2863	2764	20m.my8031_rel_withdbg.cy9
100	2806	0	0.0	183.4	4.5	0.000	0.000	1.841	46.515	11706	13.2	4.171	376	8.0	16.5	8.4	0.018	2796	2685	20m.my8031_rel_o2.cy9
100	2769	0	0.0	182.8	4.5	0.000	0.000	1.835	46.416	11541	13.2	4.169	381	8.0	16.5	8.4	0.015	2751	2653	20m.my8031_rel_native.cy9
100	2808	0	0.0	185.9	4.6	0.000	0.000	1.865	47.194	11688	13.3	4.163	379	8.0	16.5	8.4	0.017	2797	2685	20m.my8031_rel.cy9
100	2944	0	0.0	184.3	4.6	0.000	0.000	1.849	46.747	12218	12.8	4.150	348	8.0	16.5	8.4	0.023	2925	2797	20m.my8031_rel_o2_lto.cy9
100	2991	0	0.0	182.0	4.5	0.000	0.000	1.828	46.269	12407	12.8	4.148	342	8.0	16.5	8.4	0.023	2975	2844	20m.my8031_rel_native_lto.cy9
100	2972	0	0.0	185.2	4.6	0.000	0.000	1.860	47.064	12344	12.9	4.153	347	8.0	16.5	8.4	0.022	2957	2829	20m.my8031_rel_lto.cy9
q500.1
q500.1: range queries with 500 insert/s per client
Performance metrics for all DBMS, not just the ones listed above. Some are normalized by throughput, others are not. Legend for results is here.
ips	qps	rps	rmbps	wps	wmbps	rpq	rkbpq	wpi	wkbpi	csps	cpups	cspq	cpupq	dbgb1	dbgb2	rss	maxop	p50	p99	tag
499	2907	0	0.0	49.2	1.6	0.000	0.000	0.099	3.201	11699	13.4	4.024	369	8.4	17.0	8.8	0.019	2893	2777	20m.my8031_rel_withdbg.cy9
499	2815	0	0.0	49.8	1.6	0.000	0.000	0.100	3.230	11353	13.4	4.033	381	8.4	17.0	8.8	0.026	2797	2687	20m.my8031_rel_o2.cy9
498	2763	0	0.0	50.0	1.6	0.000	0.000	0.100	3.246	11163	13.4	4.040	388	8.4	17.0	8.8	0.018	2749	2637	20m.my8031_rel_native.cy9
499	2797	0	0.0	48.2	1.5	0.000	0.000	0.097	3.151	11267	13.4	4.028	383	8.4	17.0	8.8	0.018	2781	2683	20m.my8031_rel.cy9
498	2931	0	0.0	50.1	1.6	0.000	0.000	0.101	3.261	11811	13.4	4.029	366	8.4	17.0	8.8	0.021	2925	2781	20m.my8031_rel_o2_lto.cy9
498	2911	0	0.0	52.6	1.7	0.000	0.000	0.106	3.408	11736	13.3	4.031	365	8.4	17.0	8.8	0.020	2908	2781	20m.my8031_rel_native_lto.cy9
499	2945	0	0.0	49.2	1.6	0.000	0.000	0.099	3.212	11871	13.4	4.031	364	8.4	17.0	8.8	0.023	2926	2813	20m.my8031_rel_lto.cy9
q1000.1
q1000.1: range queries with 1000 insert/s per client
Performance metrics for all DBMS, not just the ones listed above. Some are normalized by throughput, others are not. Legend for results is here.
ips	qps	rps	rmbps	wps	wmbps	rpq	rkbpq	wpi	wkbpi	csps	cpups	cspq	cpupq	dbgb1	dbgb2	rss	maxop	p50	p99	tag
998	2915	0	0.0	157.3	4.4	0.000	0.000	0.158	4.563	12193	13.6	4.183	373	8.8	17.4	9.2	0.020	2893	2764	20m.my8031_rel_withdbg.cy9
998	2817	0	0.0	156.0	4.4	0.000	0.000	0.156	4.531	11801	13.8	4.190	392	8.8	17.4	9.2	0.019	2797	2685	20m.my8031_rel_o2.cy9
996	2760	0	0.0	155.5	4.4	0.000	0.000	0.156	4.527	11594	13.6	4.201	394	8.8	17.4	9.2	0.019	2749	2637	20m.my8031_rel_native.cy9
998	2805	0	0.0	155.4	4.4	0.000	0.000	0.156	4.525	11742	13.7	4.186	391	8.8	17.4	9.2	0.018	2783	2669	20m.my8031_rel.cy9
997	2934	0	0.0	156.0	4.4	0.000	0.000	0.156	4.528	12248	13.5	4.174	368	8.8	17.4	9.2	0.026	2925	2781	20m.my8031_rel_o2_lto.cy9
997	2937	0	0.0	157.2	4.4	0.000	0.000	0.158	4.558	12257	13.5	4.173	368	8.8	17.4	9.2	0.026	2925	2797	20m.my8031_rel_native_lto.cy9
998	2948	0	0.0	156.9	4.4	0.000	0.000	0.157	4.557	12305	13.5	4.173	366	8.8	17.4	9.2	0.024	2940	2812	20m.my8031_rel_lto.cy9
l.i0
- l.i0: load without secondary indexes
- Legend for results is here.
- Each entry lists the percentage of responses that fit in that bucket (slower than max time for previous bucket, faster than min time for next bucket).
Insert response time histogram
256us	1ms	4ms	16ms	64ms	256ms	1s	4s	16s	gt	max	tag
0.000	0.000	99.438	0.422	0.136	0.003	0.000	0.000	0.000	0.000	0.079	my8031_rel_withdbg.cy9
0.000	0.000	99.409	0.451	0.136	0.003	0.000	0.000	0.000	0.000	0.083	my8031_rel_o2.cy9
0.000	0.000	99.416	0.440	0.140	0.003	0.000	0.000	0.000	0.000	0.076	my8031_rel_native.cy9
0.000	0.000	99.440	0.451	0.106	0.003	0.000	0.000	0.000	0.000	0.098	my8031_rel.cy9
0.000	0.000	99.436	0.411	0.149	0.004	0.000	0.000	0.000	0.000	0.101	my8031_rel_o2_lto.cy9
0.000	0.000	99.436	0.415	0.146	0.003	0.000	0.000	0.000	0.000	0.094	my8031_rel_native_lto.cy9
0.000	0.000	99.458	0.384	0.154	0.003	0.000	0.000	0.000	0.000	0.105	my8031_rel_lto.cy9
l.x
- l.x: create secondary indexes
- Legend for results is here.
- Each entry lists the percentage of responses that fit in that bucket (slower than max time for previous bucket, faster than min time for next bucket).
TODO - determine whether there is data for create index response time
l.i1
- l.i1: continue load after secondary indexes created
- Legend for results is here.
- Each entry lists the percentage of responses that fit in that bucket (slower than max time for previous bucket, faster than min time for next bucket).
Insert response time histogram
256us	1ms	4ms	16ms	64ms	256ms	1s	4s	16s	gt	max	tag
0.000	0.000	98.575	1.123	0.301	0.001	0.000	0.000	0.000	0.000	0.071	my8031_rel_withdbg.cy9
0.000	0.000	98.555	1.150	0.294	0.001	0.000	0.000	0.000	0.000	0.072	my8031_rel_o2.cy9
0.000	0.000	98.568	1.143	0.288	0.002	0.000	0.000	0.000	0.000	0.072	my8031_rel_native.cy9
0.000	0.000	98.553	1.151	0.296	0.001	0.000	0.000	0.000	0.000	0.070	my8031_rel.cy9
0.000	0.000	98.573	1.128	0.297	0.002	0.000	0.000	0.000	0.000	0.083	my8031_rel_o2_lto.cy9
0.000	0.000	98.599	1.094	0.306	0.002	0.000	0.000	0.000	0.000	0.079	my8031_rel_native_lto.cy9
0.000	0.000	98.596	1.094	0.308	0.002	0.000	0.000	0.000	0.000	0.086	my8031_rel_lto.cy9
q100.1
- q100.1: range queries with 100 insert/s per client
- Legend for results is here.
- Each entry lists the percentage of responses that fit in that bucket (slower than max time for previous bucket, faster than min time for next bucket).
Query response time histogram
256us	1ms	4ms	16ms	64ms	256ms	1s	4s	16s	gt	max	tag
9.571	90.428	nonzero	nonzero	nonzero	0.000	0.000	0.000	0.000	0.000	0.022	my8031_rel_withdbg.cy9
3.871	96.129	nonzero	nonzero	nonzero	0.000	0.000	0.000	0.000	0.000	0.018	my8031_rel_o2.cy9
3.162	96.837	nonzero	nonzero	0.000	0.000	0.000	0.000	0.000	0.000	0.015	my8031_rel_native.cy9
3.633	96.366	nonzero	nonzero	nonzero	0.000	0.000	0.000	0.000	0.000	0.017	my8031_rel.cy9
17.186	82.813	nonzero	nonzero	nonzero	0.000	0.000	0.000	0.000	0.000	0.023	my8031_rel_o2_lto.cy9
20.410	79.590	nonzero	nonzero	nonzero	0.000	0.000	0.000	0.000	0.000	0.023	my8031_rel_native_lto.cy9
19.882	80.117	nonzero	nonzero	nonzero	0.000	0.000	0.000	0.000	0.000	0.022	my8031_rel_lto.cy9
Insert response time histogram
256us	1ms	4ms	16ms	64ms	256ms	1s	4s	16s	gt	max	tag
0.000	0.000	98.833	0.472	0.694	0.000	0.000	0.000	0.000	0.000	0.026	my8031_rel_withdbg.cy9
0.000	0.000	98.722	0.611	0.667	0.000	0.000	0.000	0.000	0.000	0.026	my8031_rel_o2.cy9
0.000	0.000	98.917	0.500	0.583	0.000	0.000	0.000	0.000	0.000	0.026	my8031_rel_native.cy9
0.000	0.000	98.528	0.861	0.611	0.000	0.000	0.000	0.000	0.000	0.029	my8031_rel.cy9
0.000	0.000	99.028	0.278	0.694	0.000	0.000	0.000	0.000	0.000	0.034	my8031_rel_o2_lto.cy9
0.000	0.000	98.972	0.444	0.583	0.000	0.000	0.000	0.000	0.000	0.027	my8031_rel_native_lto.cy9
0.000	0.000	98.917	0.444	0.639	0.000	0.000	0.000	0.000	0.000	0.030	my8031_rel_lto.cy9
q500.1
- q500.1: range queries with 500 insert/s per client
- Legend for results is here.
- Each entry lists the percentage of responses that fit in that bucket (slower than max time for previous bucket, faster than min time for next bucket).
Query response time histogram
256us	1ms	4ms	16ms	64ms	256ms	1s	4s	16s	gt	max	tag
12.500	87.498	0.001	0.001	nonzero	0.000	0.000	0.000	0.000	0.000	0.019	my8031_rel_withdbg.cy9
4.052	95.946	0.001	0.001	nonzero	0.000	0.000	0.000	0.000	0.000	0.026	my8031_rel_o2.cy9
2.848	97.151	0.001	0.001	nonzero	0.000	0.000	0.000	0.000	0.000	0.018	my8031_rel_native.cy9
3.733	96.266	nonzero	0.001	nonzero	0.000	0.000	0.000	0.000	0.000	0.018	my8031_rel.cy9
15.853	84.145	0.001	nonzero	nonzero	0.000	0.000	0.000	0.000	0.000	0.021	my8031_rel_o2_lto.cy9
15.760	84.239	0.001	0.001	nonzero	0.000	0.000	0.000	0.000	0.000	0.020	my8031_rel_native_lto.cy9
17.958	82.040	nonzero	0.001	nonzero	0.000	0.000	0.000	0.000	0.000	0.023	my8031_rel_lto.cy9
Insert response time histogram
256us	1ms	4ms	16ms	64ms	256ms	1s	4s	16s	gt	max	tag
0.000	0.000	98.822	0.728	0.450	0.000	0.000	0.000	0.000	0.000	0.025	my8031_rel_withdbg.cy9
0.000	0.000	98.744	0.744	0.511	0.000	0.000	0.000	0.000	0.000	0.029	my8031_rel_o2.cy9
0.000	0.000	99.133	0.322	0.544	0.000	0.000	0.000	0.000	0.000	0.026	my8031_rel_native.cy9
0.000	0.000	98.983	0.483	0.533	0.000	0.000	0.000	0.000	0.000	0.025	my8031_rel.cy9
0.000	0.000	98.883	0.617	0.500	0.000	0.000	0.000	0.000	0.000	0.031	my8031_rel_o2_lto.cy9
0.000	0.000	99.122	0.317	0.561	0.000	0.000	0.000	0.000	0.000	0.028	my8031_rel_native_lto.cy9
0.000	0.000	99.028	0.433	0.539	0.000	0.000	0.000	0.000	0.000	0.027	my8031_rel_lto.cy9
q1000.1
- q1000.1: range queries with 1000 insert/s per client
- Legend for results is here.
- Each entry lists the percentage of responses that fit in that bucket (slower than max time for previous bucket, faster than min time for next bucket).
Query response time histogram
256us	1ms	4ms	16ms	64ms	256ms	1s	4s	16s	gt	max	tag
12.216	87.781	0.001	0.001	nonzero	0.000	0.000	0.000	0.000	0.000	0.020	my8031_rel_withdbg.cy9
4.239	95.759	0.001	nonzero	nonzero	0.000	0.000	0.000	0.000	0.000	0.019	my8031_rel_o2.cy9
4.150	95.847	0.001	nonzero	nonzero	0.000	0.000	0.000	0.000	0.000	0.019	my8031_rel_native.cy9
4.301	95.698	0.001	nonzero	nonzero	0.000	0.000	0.000	0.000	0.000	0.018	my8031_rel.cy9
15.620	84.378	0.001	nonzero	0.001	0.000	0.000	0.000	0.000	0.000	0.026	my8031_rel_o2_lto.cy9
16.314	83.684	0.001	0.001	nonzero	0.000	0.000	0.000	0.000	0.000	0.026	my8031_rel_native_lto.cy9
17.887	82.111	0.001	nonzero	nonzero	0.000	0.000	0.000	0.000	0.000	0.024	my8031_rel_lto.cy9
Insert response time histogram
256us	1ms	4ms	16ms	64ms	256ms	1s	4s	16s	gt	max	tag
0.000	0.000	99.167	0.572	0.261	0.000	0.000	0.000	0.000	0.000	0.026	my8031_rel_withdbg.cy9
0.000	0.000	99.317	0.378	0.306	0.000	0.000	0.000	0.000	0.000	0.026	my8031_rel_o2.cy9
0.000	0.000	99.264	0.456	0.281	0.000	0.000	0.000	0.000	0.000	0.030	my8031_rel_native.cy9
0.000	0.000	99.364	0.361	0.275	0.000	0.000	0.000	0.000	0.000	0.026	my8031_rel.cy9
0.000	0.000	99.231	0.483	0.286	0.000	0.000	0.000	0.000	0.000	0.031	my8031_rel_o2_lto.cy9
0.000	0.000	99.183	0.558	0.258	0.000	0.000	0.000	0.000	0.000	0.031	my8031_rel_native_lto.cy9
0.000	0.000	99.344	0.369	0.286	0.000	0.000	0.000	0.000	0.000	0.030	my8031_rel_lto.cy9