Introduction
This is a report for the insert benchmark with 20M docs and 1 client(s). It is generated by scripts (bash, awk, sed) and Tufte might not be impressed. An overview of the insert benchmark is here and a short update is here. Below, by DBMS, I mean DBMS+version.config. An example is my8020.c10b40 where my means MySQL, 8020 is version 8.0.20 and c10b40 is the name for the configuration file.
The test server has 8 AMD cores, 16G RAM and an NVMe SSD. It is described here as the Beelink. The benchmark was run with 1 client and there were 1 or 2 connections per client (1 for queries, 1 for inserts). The benchmark loads 20M rows without secondary indexes, creates secondary indexes, loads another 20M rows then does 3 read+write tests for one hour each that do queries as fast as possible with 100, 500 and then 1000 writes/second/client concurrent with the queries. There is 1 table. The database is cached by the OS but not by InnoDB. Clients and the DBMS share one server. The per-database configs are in the per-database subdirectories here.
The tested DBMS are:
- my8031_rel_withdbg.cy9_1g - InnoDB and MySQL 8.0.31, the cy9_1g config and compiled with CMAKE_BUILD_TYPE=RelWitDebInfo -O2 -flto
- my8031_rel_o2.cy9_1g - InnoDB and MySQL 8.0.31, the cy9_1g config and compiled with CMAKE_BUILD_TYPE=Release -O2
- my8031_rel_native.cy9_1g - InnoDB and MySQL 8.0.31, the cy9_1g config and compiled with CMAKE_BUILD_TYPE=Release -O3 -march=native -mtune=native
- my8031_rel.cy9_1g - InnoDB and MySQL 8.0.31, the cy9_1g config and compiled with CMAKE_BUILD_TYPE=Release -O3
- my8031_rel_o2_lto.cy9_1g - InnoDB and MySQL 8.0.31, the cy9_1g config and compiled with CMAKE_BUILD_TYPE=Release -O2 -flto
- my8031_rel_native_lto.cy9_1g - InnoDB and MySQL 8.0.31, the cy9_1g config and compiled with CMAKE_BUILD_TYPE=Release -O3 -flto -march=native -mtune=native
- my8031_rel_lto.cy9_1g - InnoDB and MySQL 8.0.31, the cy9_1g config and compiled with CMAKE_BUILD_TYPE=Release -O3 -flto
Contents
- Summary
- l.i0: load without secondary indexes
- l.x: create secondary indexes
- l.i1: continue load after secondary indexes created
- q100.1: range queries with 100 insert/s per client
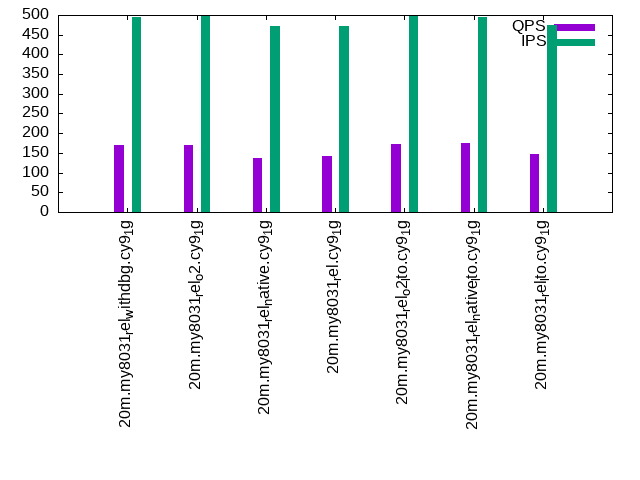
- q500.1: range queries with 500 insert/s per client
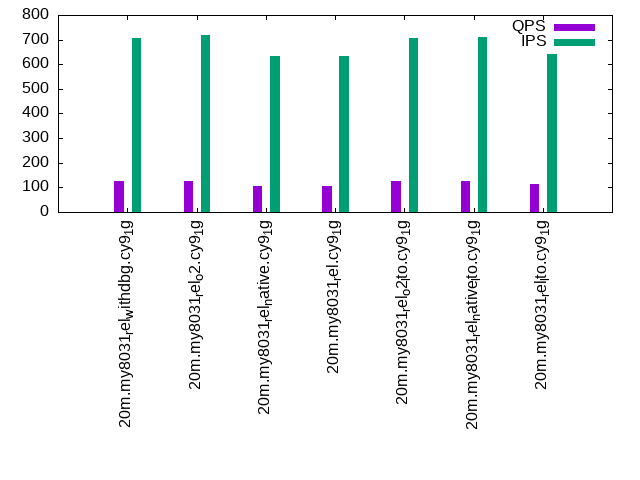
- q1000.1: range queries with 1000 insert/s per client
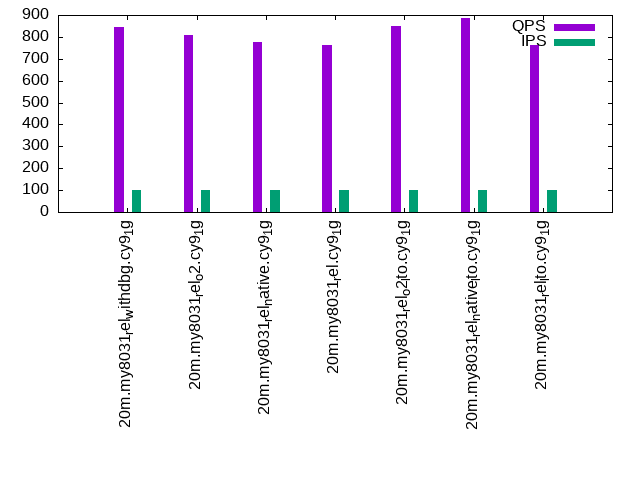
Summary
The numbers are inserts/s for l.i0 and l.i1, indexed docs (or rows) /s for l.x and queries/s for q*.2. The values are the average rate over the entire test for inserts (IPS) and queries (QPS). The range of values for IPS and QPS is split into 3 parts: bottom 25%, middle 50%, top 25%. Values in the bottom 25% have a red background, values in the top 25% have a green background and values in the middle have no color. A gray background is used for values that can be ignored because the DBMS did not sustain the target insert rate. Red backgrounds are not used when the minimum value is within 80% of the max value.
| dbms | l.i0 | l.x | l.i1 | q100.1 | q500.1 | q1000.1 |
|---|---|---|---|---|---|---|
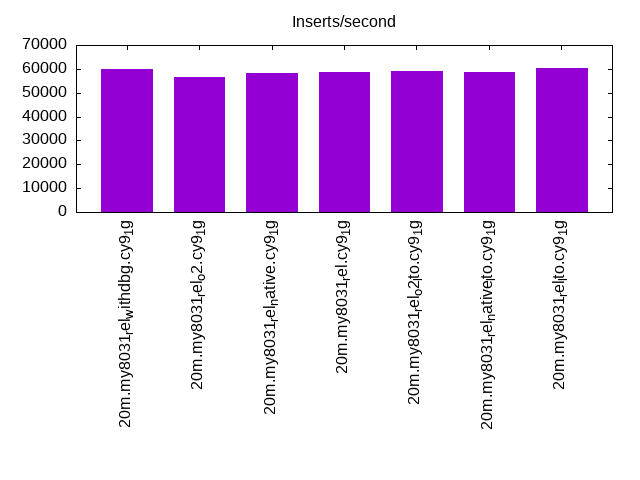
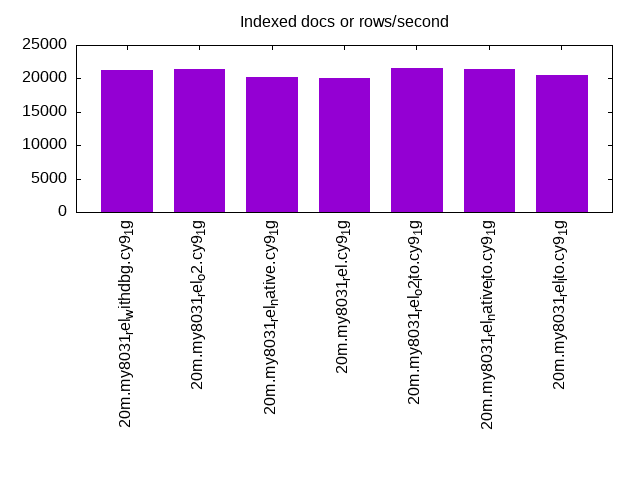
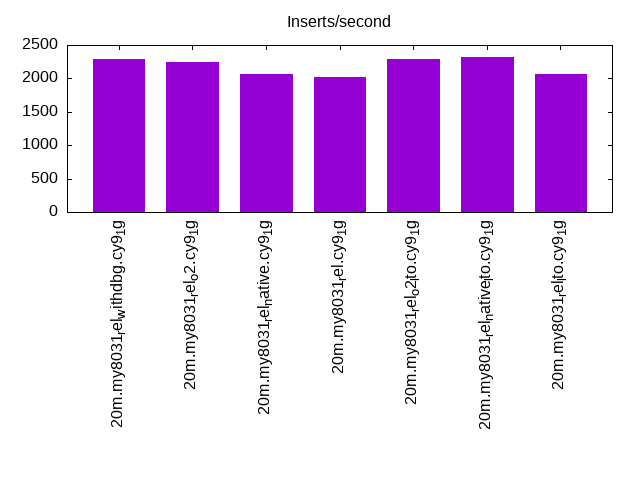
| 20m.my8031_rel_withdbg.cy9_1g | 59880 | 21202 | 2294 | 845 | 171 | 126 |
| 20m.my8031_rel_o2.cy9_1g | 56497 | 21383 | 2246 | 809 | 171 | 124 |
| 20m.my8031_rel_native.cy9_1g | 58309 | 20181 | 2066 | 776 | 136 | 104 |
| 20m.my8031_rel.cy9_1g | 58824 | 20040 | 2016 | 764 | 142 | 106 |
| 20m.my8031_rel_o2_lto.cy9_1g | 59172 | 21590 | 2287 | 851 | 172 | 126 |
| 20m.my8031_rel_native_lto.cy9_1g | 58480 | 21360 | 2314 | 885 | 174 | 126 |
| 20m.my8031_rel_lto.cy9_1g | 60423 | 20448 | 2062 | 761 | 147 | 112 |
This table has relative throughput, throughput for the DBMS relative to the DBMS in the first line, using the absolute throughput from the previous table.
| dbms | l.i0 | l.x | l.i1 | q100.1 | q500.1 | q1000.1 |
|---|---|---|---|---|---|---|
| 20m.my8031_rel_withdbg.cy9_1g | 1.00 | 1.00 | 1.00 | 1.00 | 1.00 | 1.00 |
| 20m.my8031_rel_o2.cy9_1g | 0.94 | 1.01 | 0.98 | 0.96 | 1.00 | 0.98 |
| 20m.my8031_rel_native.cy9_1g | 0.97 | 0.95 | 0.90 | 0.92 | 0.80 | 0.83 |
| 20m.my8031_rel.cy9_1g | 0.98 | 0.95 | 0.88 | 0.90 | 0.83 | 0.84 |
| 20m.my8031_rel_o2_lto.cy9_1g | 0.99 | 1.02 | 1.00 | 1.01 | 1.01 | 1.00 |
| 20m.my8031_rel_native_lto.cy9_1g | 0.98 | 1.01 | 1.01 | 1.05 | 1.02 | 1.00 |
| 20m.my8031_rel_lto.cy9_1g | 1.01 | 0.96 | 0.90 | 0.90 | 0.86 | 0.89 |
This lists the average rate of inserts/s for the tests that do inserts concurrent with queries. For such tests the query rate is listed in the table above. The read+write tests are setup so that the insert rate should match the target rate every second. Cells that are not at least 95% of the target have a red background to indicate a failure to satisfy the target.
| dbms | q100.1 | q500.1 | q1000.1 |
|---|---|---|---|
| my8031_rel_withdbg.cy9_1g | 100 | 496 | 707 |
| my8031_rel_o2.cy9_1g | 100 | 497 | 719 |
| my8031_rel_native.cy9_1g | 100 | 471 | 635 |
| my8031_rel.cy9_1g | 100 | 473 | 635 |
| my8031_rel_o2_lto.cy9_1g | 100 | 498 | 708 |
| my8031_rel_native_lto.cy9_1g | 100 | 496 | 709 |
| my8031_rel_lto.cy9_1g | 100 | 474 | 640 |
| target | 100 | 500 | 1000 |
l.i0
l.i0: load without secondary indexes. Graphs for performance per 1-second interval are here.
Average throughput:
Insert response time histogram: each cell has the percentage of responses that take <= the time in the header and max is the max response time in seconds. For the max column values in the top 25% of the range have a red background and in the bottom 25% of the range have a green background. The red background is not used when the min value is within 80% of the max value.
| dbms | 256us | 1ms | 4ms | 16ms | 64ms | 256ms | 1s | 4s | 16s | gt | max |
|---|---|---|---|---|---|---|---|---|---|---|---|
| my8031_rel_withdbg.cy9_1g | 99.398 | 0.454 | 0.144 | 0.005 | 0.089 | ||||||
| my8031_rel_o2.cy9_1g | 99.386 | 0.466 | 0.143 | 0.005 | 0.092 | ||||||
| my8031_rel_native.cy9_1g | 99.387 | 0.459 | 0.148 | 0.005 | 0.094 | ||||||
| my8031_rel.cy9_1g | 99.391 | 0.458 | 0.143 | 0.008 | 0.143 | ||||||
| my8031_rel_o2_lto.cy9_1g | 99.395 | 0.470 | 0.132 | 0.003 | 0.098 | ||||||
| my8031_rel_native_lto.cy9_1g | 99.394 | 0.471 | 0.132 | 0.003 | 0.123 | ||||||
| my8031_rel_lto.cy9_1g | 99.395 | 0.445 | 0.151 | 0.008 | 0.116 |
Performance metrics for the DBMS listed above. Some are normalized by throughput, others are not. Legend for results is here.
ips	qps	rps	rmbps	wps	wmbps	rpq	rkbpq	wpi	wkbpi	csps	cpups	cspq	cpupq	dbgb1	dbgb2	rss	maxop	p50	p99	tag
59880	0	0	0.0	175.2	18.2	0.000	0.000	0.003	0.312	7109	20.7	0.119	28	1.3	9.9	1.3	0.089	60455	53241	20m.my8031_rel_withdbg.cy9_1g
56497	0	0	0.0	168.4	17.2	0.000	0.000	0.003	0.313	6785	20.9	0.120	30	1.3	9.9	1.4	0.092	57035	50542	20m.my8031_rel_o2.cy9_1g
58309	0	0	0.0	171.6	17.8	0.000	0.000	0.003	0.312	6964	20.9	0.119	29	1.3	9.9	1.4	0.094	58833	41140	20m.my8031_rel_native.cy9_1g
58824	0	0	0.0	173.8	17.9	0.000	0.000	0.003	0.312	7027	20.8	0.119	28	1.3	9.9	1.4	0.143	59533	48666	20m.my8031_rel.cy9_1g
59172	0	0	0.0	173.9	18.1	0.000	0.000	0.003	0.312	7064	20.7	0.119	28	1.3	9.9	1.3	0.098	59832	49646	20m.my8031_rel_o2_lto.cy9_1g
58480	0	0	0.0	172.4	17.8	0.000	0.000	0.003	0.311	6975	21.1	0.119	29	1.3	9.9	1.3	0.123	58933	49444	20m.my8031_rel_native_lto.cy9_1g
60423	0	0	0.0	178.6	18.4	0.000	0.000	0.003	0.312	7197	21.0	0.119	28	1.3	9.9	1.4	0.116	61231	50042	20m.my8031_rel_lto.cy9_1g
l.x
l.x: create secondary indexes.
Average throughput:
Performance metrics for the DBMS listed above. Some are normalized by throughput, others are not. Legend for results is here.
ips	qps	rps	rmbps	wps	wmbps	rpq	rkbpq	wpi	wkbpi	csps	cpups	cspq	cpupq	dbgb1	dbgb2	rss	maxop	p50	p99	tag
21202	0	110	7.3	575.0	23.7	0.005	0.355	0.027	1.145	4363	8.0	0.206	30	3.0	11.5	1.5	0.013	NA	NA	20m.my8031_rel_withdbg.cy9_1g
21383	0	111	7.4	577.0	23.9	0.005	0.355	0.027	1.146	4396	8.2	0.206	31	3.0	11.5	1.5	0.015	NA	NA	20m.my8031_rel_o2.cy9_1g
20181	0	104	7.0	542.7	22.4	0.005	0.354	0.027	1.137	4178	7.3	0.207	29	3.0	11.5	1.5	0.017	NA	NA	20m.my8031_rel_native.cy9_1g
20040	0	104	6.9	541.8	22.4	0.005	0.354	0.027	1.144	4162	7.7	0.208	31	3.0	11.5	1.5	0.012	NA	NA	20m.my8031_rel.cy9_1g
21590	0	111	7.5	578.2	23.9	0.005	0.354	0.027	1.132	4418	7.9	0.205	29	3.0	11.5	1.5	0.012	NA	NA	20m.my8031_rel_o2_lto.cy9_1g
21360	0	110	7.4	575.6	23.7	0.005	0.354	0.027	1.137	4408	6.8	0.206	25	3.0	11.5	1.5	0.012	NA	NA	20m.my8031_rel_native_lto.cy9_1g
20448	0	106	7.1	550.3	22.7	0.005	0.354	0.027	1.135	4261	5.9	0.208	23	3.0	11.5	1.5	0.014	NA	NA	20m.my8031_rel_lto.cy9_1g
l.i1
l.i1: continue load after secondary indexes created. Graphs for performance per 1-second interval are here.
Average throughput:
Insert response time histogram: each cell has the percentage of responses that take <= the time in the header and max is the max response time in seconds. For the max column values in the top 25% of the range have a red background and in the bottom 25% of the range have a green background. The red background is not used when the min value is within 80% of the max value.
| dbms | 256us | 1ms | 4ms | 16ms | 64ms | 256ms | 1s | 4s | 16s | gt | max |
|---|---|---|---|---|---|---|---|---|---|---|---|
| my8031_rel_withdbg.cy9_1g | 0.409 | 59.982 | 34.099 | 5.362 | 0.127 | 0.021 | 0.001 | 4.808 | |||
| my8031_rel_o2.cy9_1g | 0.250 | 58.865 | 35.349 | 5.383 | 0.132 | 0.021 | nonzero | 4.191 | |||
| my8031_rel_native.cy9_1g | 0.273 | 57.452 | 35.008 | 7.081 | 0.154 | 0.031 | nonzero | 4.130 | |||
| my8031_rel.cy9_1g | 0.309 | 57.037 | 34.867 | 7.587 | 0.168 | 0.031 | 0.001 | 5.966 | |||
| my8031_rel_o2_lto.cy9_1g | 0.427 | 59.720 | 34.291 | 5.418 | 0.118 | 0.025 | 3.718 | ||||
| my8031_rel_native_lto.cy9_1g | 0.472 | 60.394 | 33.578 | 5.409 | 0.122 | 0.025 | 3.057 | ||||
| my8031_rel_lto.cy9_1g | 0.464 | 58.181 | 33.658 | 7.508 | 0.157 | 0.030 | 0.001 | 4.873 |
Performance metrics for the DBMS listed above. Some are normalized by throughput, others are not. Legend for results is here.
ips	qps	rps	rmbps	wps	wmbps	rpq	rkbpq	wpi	wkbpi	csps	cpups	cspq	cpupq	dbgb1	dbgb2	rss	maxop	p50	p99	tag
2294	0	0	0.0	1040.0	21.2	0.000	0.000	0.453	9.457	5901	8.1	2.572	283	7.7	16.3	1.5	4.808	2397	50	20m.my8031_rel_withdbg.cy9_1g
2246	0	0	0.0	1033.9	21.0	0.000	0.000	0.460	9.566	5856	8.2	2.607	292	7.7	16.3	1.5	4.191	2347	50	20m.my8031_rel_o2.cy9_1g
2066	0	0	0.0	917.8	18.8	0.000	0.001	0.444	9.302	5304	7.5	2.567	290	7.7	16.3	1.5	4.130	2197	50	20m.my8031_rel_native.cy9_1g
2016	0	0	0.0	891.9	18.3	0.000	0.000	0.442	9.276	5177	7.3	2.568	290	7.7	16.3	1.5	5.966	2098	0	20m.my8031_rel.cy9_1g
2287	0	0	0.0	1041.0	21.2	0.000	0.000	0.455	9.487	5886	8.1	2.574	283	7.7	16.3	1.5	3.718	2397	50	20m.my8031_rel_o2_lto.cy9_1g
2314	0	0	0.0	1039.1	21.2	0.000	0.001	0.449	9.377	5875	8.0	2.539	277	7.7	16.3	1.5	3.057	2447	50	20m.my8031_rel_native_lto.cy9_1g
2062	0	0	0.0	897.0	18.4	0.000	0.000	0.435	9.154	5191	7.2	2.517	279	7.7	16.3	1.5	4.873	2148	0	20m.my8031_rel_lto.cy9_1g
q100.1
q100.1: range queries with 100 insert/s per client. Graphs for performance per 1-second interval are here.
Average throughput:
Query response time histogram: each cell has the percentage of responses that take <= the time in the header and max is the max response time in seconds. For max values in the top 25% of the range have a red background and in the bottom 25% of the range have a green background. The red background is not used when the min value is within 80% of the max value.
| dbms | 256us | 1ms | 4ms | 16ms | 64ms | 256ms | 1s | 4s | 16s | gt | max |
|---|---|---|---|---|---|---|---|---|---|---|---|
| my8031_rel_withdbg.cy9_1g | 1.683 | 93.488 | 0.630 | 2.496 | 1.656 | 0.047 | nonzero | 0.472 | |||
| my8031_rel_o2.cy9_1g | 1.000 | 93.914 | 0.691 | 2.634 | 1.708 | 0.053 | nonzero | 0.262 | |||
| my8031_rel_native.cy9_1g | 0.968 | 93.853 | 0.705 | 2.577 | 1.819 | 0.079 | nonzero | 0.302 | |||
| my8031_rel.cy9_1g | 0.940 | 93.720 | 0.733 | 2.667 | 1.859 | 0.081 | nonzero | 0.288 | |||
| my8031_rel_o2_lto.cy9_1g | 1.968 | 93.192 | 0.639 | 2.540 | 1.614 | 0.046 | nonzero | 0.312 | |||
| my8031_rel_native_lto.cy9_1g | 3.380 | 92.025 | 0.601 | 2.418 | 1.531 | 0.046 | nonzero | 0.272 | |||
| my8031_rel_lto.cy9_1g | 2.825 | 91.908 | 0.658 | 2.636 | 1.885 | 0.086 | 0.002 | 0.457 |
Insert response time histogram: each cell has the percentage of responses that take <= the time in the header and max is the max response time in seconds. For max values in the top 25% of the range have a red background and in the bottom 25% of the range have a green background. The red background is not used when the min value is within 80% of the max value.
| dbms | 256us | 1ms | 4ms | 16ms | 64ms | 256ms | 1s | 4s | 16s | gt | max |
|---|---|---|---|---|---|---|---|---|---|---|---|
| my8031_rel_withdbg.cy9_1g | 0.111 | 42.750 | 12.056 | 38.056 | 7.028 | 0.552 | |||||
| my8031_rel_o2.cy9_1g | 0.028 | 38.250 | 13.694 | 40.750 | 7.278 | 0.705 | |||||
| my8031_rel_native.cy9_1g | 0.083 | 38.778 | 13.278 | 38.333 | 9.528 | 0.659 | |||||
| my8031_rel.cy9_1g | 0.083 | 36.278 | 14.389 | 39.778 | 9.472 | 0.892 | |||||
| my8031_rel_o2_lto.cy9_1g | 0.056 | 41.083 | 12.111 | 39.861 | 6.889 | 0.522 | |||||
| my8031_rel_native_lto.cy9_1g | 0.306 | 45.750 | 12.667 | 34.306 | 6.972 | 0.843 | |||||
| my8031_rel_lto.cy9_1g | 0.472 | 36.806 | 12.111 | 39.944 | 10.639 | 0.028 | 1.175 |
Performance metrics for the DBMS listed above. Some are normalized by throughput, others are not. Legend for results is here.
ips	qps	rps	rmbps	wps	wmbps	rpq	rkbpq	wpi	wkbpi	csps	cpups	cspq	cpupq	dbgb1	dbgb2	rss	maxop	p50	p99	tag
100	845	1	0.0	673.4	12.4	0.001	0.017	6.747	127.146	7079	7.3	8.381	691	7.9	16.5	1.5	0.472	719	32	20m.my8031_rel_withdbg.cy9_1g
100	809	1	0.0	671.7	12.3	0.002	0.022	6.730	126.570	6956	7.2	8.602	712	7.9	16.5	1.5	0.262	863	32	20m.my8031_rel_o2.cy9_1g
100	776	1	0.0	657.1	12.1	0.001	0.020	6.584	124.100	6746	7.1	8.698	732	7.9	16.5	1.5	0.302	607	32	20m.my8031_rel_native.cy9_1g
100	764	1	0.0	662.4	12.2	0.002	0.026	6.638	124.962	6729	7.0	8.811	733	7.9	16.5	1.5	0.288	703	16	20m.my8031_rel.cy9_1g
100	851	1	0.0	670.1	12.3	0.001	0.020	6.715	126.419	7095	7.3	8.334	686	7.9	16.5	1.5	0.312	735	32	20m.my8031_rel_o2_lto.cy9_1g
100	885	1	0.0	673.4	12.4	0.001	0.016	6.748	126.866	7234	7.3	8.174	660	7.9	16.5	1.5	0.272	640	32	20m.my8031_rel_native_lto.cy9_1g
100	761	1	0.0	660.9	12.2	0.002	0.025	6.622	124.922	6713	6.8	8.817	714	7.9	16.5	1.5	0.457	527	16	20m.my8031_rel_lto.cy9_1g
q500.1
q500.1: range queries with 500 insert/s per client. Graphs for performance per 1-second interval are here.
Average throughput:
Query response time histogram: each cell has the percentage of responses that take <= the time in the header and max is the max response time in seconds. For max values in the top 25% of the range have a red background and in the bottom 25% of the range have a green background. The red background is not used when the min value is within 80% of the max value.
| dbms | 256us | 1ms | 4ms | 16ms | 64ms | 256ms | 1s | 4s | 16s | gt | max |
|---|---|---|---|---|---|---|---|---|---|---|---|
| my8031_rel_withdbg.cy9_1g | 0.341 | 64.116 | 2.668 | 21.157 | 11.473 | 0.245 | nonzero | 0.264 | |||
| my8031_rel_o2.cy9_1g | 0.104 | 64.107 | 3.021 | 21.205 | 11.284 | 0.280 | 0.176 | ||||
| my8031_rel_native.cy9_1g | 0.202 | 61.008 | 3.079 | 20.243 | 14.655 | 0.810 | 0.003 | 0.340 | |||
| my8031_rel.cy9_1g | 0.204 | 62.339 | 2.907 | 19.705 | 14.114 | 0.729 | 0.001 | 0.312 | |||
| my8031_rel_o2_lto.cy9_1g | 0.281 | 64.456 | 2.610 | 21.008 | 11.394 | 0.250 | 0.160 | ||||
| my8031_rel_native_lto.cy9_1g | 0.651 | 64.514 | 2.421 | 20.840 | 11.350 | 0.225 | 0.223 | ||||
| my8031_rel_lto.cy9_1g | 0.664 | 63.198 | 2.544 | 19.525 | 13.426 | 0.643 | 0.001 | 0.301 |
Insert response time histogram: each cell has the percentage of responses that take <= the time in the header and max is the max response time in seconds. For max values in the top 25% of the range have a red background and in the bottom 25% of the range have a green background. The red background is not used when the min value is within 80% of the max value.
| dbms | 256us | 1ms | 4ms | 16ms | 64ms | 256ms | 1s | 4s | 16s | gt | max |
|---|---|---|---|---|---|---|---|---|---|---|---|
| my8031_rel_withdbg.cy9_1g | 0.044 | 16.144 | 28.383 | 55.228 | 0.200 | 0.684 | |||||
| my8031_rel_o2.cy9_1g | 0.056 | 16.528 | 29.544 | 53.661 | 0.211 | 0.562 | |||||
| my8031_rel_native.cy9_1g | 0.056 | 15.194 | 25.978 | 57.583 | 1.189 | 0.747 | |||||
| my8031_rel.cy9_1g | 0.083 | 14.750 | 25.911 | 58.239 | 1.017 | 0.634 | |||||
| my8031_rel_o2_lto.cy9_1g | 0.083 | 17.039 | 27.317 | 55.389 | 0.172 | 0.438 | |||||
| my8031_rel_native_lto.cy9_1g | 0.044 | 17.817 | 26.950 | 54.989 | 0.200 | 0.592 | |||||
| my8031_rel_lto.cy9_1g | 0.061 | 15.367 | 25.172 | 58.206 | 1.194 | 0.826 |
Performance metrics for the DBMS listed above. Some are normalized by throughput, others are not. Legend for results is here.
ips	qps	rps	rmbps	wps	wmbps	rpq	rkbpq	wpi	wkbpi	csps	cpups	cspq	cpupq	dbgb1	dbgb2	rss	maxop	p50	p99	tag
496	171	5	0.1	1008.0	19.2	0.029	0.464	2.031	39.677	6349	5.7	37.109	2665	8.3	16.9	1.5	0.264	96	48	20m.my8031_rel_withdbg.cy9_1g
497	171	5	0.1	1007.1	19.2	0.029	0.402	2.027	39.574	6338	5.7	37.089	2668	8.3	16.9	1.5	0.176	96	48	20m.my8031_rel_o2.cy9_1g
471	136	5	0.1	880.9	16.9	0.036	0.485	1.872	36.781	5599	4.9	41.256	2889	8.3	16.9	1.5	0.340	80	32	20m.my8031_rel_native.cy9_1g
473	142	5	0.1	890.5	17.1	0.032	0.452	1.883	36.980	5672	5.0	40.087	2827	8.3	16.9	1.5	0.312	80	32	20m.my8031_rel.cy9_1g
498	172	6	0.1	1008.0	19.2	0.032	0.449	2.026	39.585	6345	5.6	36.912	2606	8.3	16.9	1.5	0.160	96	48	20m.my8031_rel_o2_lto.cy9_1g
496	174	4	0.1	1012.6	19.3	0.024	0.412	2.040	39.820	6383	5.6	36.684	2575	8.3	16.9	1.5	0.223	96	48	20m.my8031_rel_native_lto.cy9_1g
474	147	5	0.1	911.4	17.4	0.034	0.497	1.922	37.626	5782	5.1	39.229	2768	8.3	16.9	1.5	0.301	80	16	20m.my8031_rel_lto.cy9_1g
q1000.1
q1000.1: range queries with 1000 insert/s per client. Graphs for performance per 1-second interval are here.
Average throughput:
Query response time histogram: each cell has the percentage of responses that take <= the time in the header and max is the max response time in seconds. For max values in the top 25% of the range have a red background and in the bottom 25% of the range have a green background. The red background is not used when the min value is within 80% of the max value.
| dbms | 256us | 1ms | 4ms | 16ms | 64ms | 256ms | 1s | 4s | 16s | gt | max |
|---|---|---|---|---|---|---|---|---|---|---|---|
| my8031_rel_withdbg.cy9_1g | 0.074 | 54.312 | 5.418 | 23.604 | 15.974 | 0.618 | 0.001 | 0.274 | |||
| my8031_rel_o2.cy9_1g | 0.022 | 52.034 | 6.588 | 24.644 | 16.072 | 0.640 | 0.206 | ||||
| my8031_rel_native.cy9_1g | 0.016 | 51.100 | 6.046 | 22.600 | 18.774 | 1.454 | 0.010 | 0.481 | |||
| my8031_rel.cy9_1g | 0.026 | 51.998 | 5.972 | 21.885 | 18.642 | 1.473 | 0.005 | 0.474 | |||
| my8031_rel_o2_lto.cy9_1g | 0.054 | 53.821 | 5.441 | 24.037 | 16.069 | 0.578 | nonzero | 0.309 | |||
| my8031_rel_native_lto.cy9_1g | 0.140 | 54.417 | 5.027 | 23.830 | 15.972 | 0.615 | nonzero | 0.279 | |||
| my8031_rel_lto.cy9_1g | 0.129 | 54.338 | 4.776 | 21.816 | 17.771 | 1.160 | 0.010 | 0.478 |
Insert response time histogram: each cell has the percentage of responses that take <= the time in the header and max is the max response time in seconds. For max values in the top 25% of the range have a red background and in the bottom 25% of the range have a green background. The red background is not used when the min value is within 80% of the max value.
| dbms | 256us | 1ms | 4ms | 16ms | 64ms | 256ms | 1s | 4s | 16s | gt | max |
|---|---|---|---|---|---|---|---|---|---|---|---|
| my8031_rel_withdbg.cy9_1g | 0.017 | 23.019 | 30.853 | 45.942 | 0.169 | 0.451 | |||||
| my8031_rel_o2.cy9_1g | 21.514 | 33.208 | 45.194 | 0.083 | 0.376 | ||||||
| my8031_rel_native.cy9_1g | 0.003 | 20.133 | 29.211 | 49.719 | 0.933 | 0.739 | |||||
| my8031_rel.cy9_1g | 0.011 | 20.322 | 29.144 | 49.628 | 0.894 | 0.706 | |||||
| my8031_rel_o2_lto.cy9_1g | 0.011 | 22.306 | 31.200 | 46.350 | 0.133 | 0.476 | |||||
| my8031_rel_native_lto.cy9_1g | 0.008 | 22.656 | 30.997 | 46.144 | 0.194 | 0.424 | |||||
| my8031_rel_lto.cy9_1g | 0.022 | 21.589 | 28.228 | 49.319 | 0.842 | 0.970 |
Performance metrics for the DBMS listed above. Some are normalized by throughput, others are not. Legend for results is here.
ips	qps	rps	rmbps	wps	wmbps	rpq	rkbpq	wpi	wkbpi	csps	cpups	cspq	cpupq	dbgb1	dbgb2	rss	maxop	p50	p99	tag
707	126	3	0.0	1018.5	19.6	0.022	0.341	1.440	28.431	6232	5.9	49.425	3743	8.8	17.3	1.5	0.274	80	32	20m.my8031_rel_withdbg.cy9_1g
719	124	3	0.0	1018.5	19.7	0.023	0.336	1.416	28.007	6239	6.0	50.235	3865	8.8	17.3	1.5	0.206	80	32	20m.my8031_rel_o2.cy9_1g
635	104	2	0.0	887.3	17.2	0.022	0.321	1.397	27.657	5510	5.2	52.726	3981	8.8	17.3	1.5	0.481	64	16	20m.my8031_rel_native.cy9_1g
635	106	3	0.0	890.9	17.2	0.024	0.355	1.404	27.801	5523	5.2	52.305	3939	8.8	17.3	1.5	0.474	64	16	20m.my8031_rel.cy9_1g
708	126	3	0.0	1020.0	19.7	0.024	0.364	1.440	28.461	6241	5.9	49.528	3746	8.8	17.3	1.5	0.309	80	32	20m.my8031_rel_o2_lto.cy9_1g
709	126	2	0.0	1024.6	19.7	0.020	0.322	1.444	28.488	6265	5.9	49.642	3740	8.8	17.3	1.5	0.279	80	32	20m.my8031_rel_native_lto.cy9_1g
640	112	3	0.0	923.0	17.8	0.023	0.353	1.442	28.453	5701	5.3	50.995	3793	8.8	17.3	1.5	0.478	64	16	20m.my8031_rel_lto.cy9_1g
l.i0
l.i0: load without secondary indexes
Performance metrics for all DBMS, not just the ones listed above. Some are normalized by throughput, others are not. Legend for results is here.
ips	qps	rps	rmbps	wps	wmbps	rpq	rkbpq	wpi	wkbpi	csps	cpups	cspq	cpupq	dbgb1	dbgb2	rss	maxop	p50	p99	tag
59880	0	0	0.0	175.2	18.2	0.000	0.000	0.003	0.312	7109	20.7	0.119	28	1.3	9.9	1.3	0.089	60455	53241	20m.my8031_rel_withdbg.cy9_1g
56497	0	0	0.0	168.4	17.2	0.000	0.000	0.003	0.313	6785	20.9	0.120	30	1.3	9.9	1.4	0.092	57035	50542	20m.my8031_rel_o2.cy9_1g
58309	0	0	0.0	171.6	17.8	0.000	0.000	0.003	0.312	6964	20.9	0.119	29	1.3	9.9	1.4	0.094	58833	41140	20m.my8031_rel_native.cy9_1g
58824	0	0	0.0	173.8	17.9	0.000	0.000	0.003	0.312	7027	20.8	0.119	28	1.3	9.9	1.4	0.143	59533	48666	20m.my8031_rel.cy9_1g
59172	0	0	0.0	173.9	18.1	0.000	0.000	0.003	0.312	7064	20.7	0.119	28	1.3	9.9	1.3	0.098	59832	49646	20m.my8031_rel_o2_lto.cy9_1g
58480	0	0	0.0	172.4	17.8	0.000	0.000	0.003	0.311	6975	21.1	0.119	29	1.3	9.9	1.3	0.123	58933	49444	20m.my8031_rel_native_lto.cy9_1g
60423	0	0	0.0	178.6	18.4	0.000	0.000	0.003	0.312	7197	21.0	0.119	28	1.3	9.9	1.4	0.116	61231	50042	20m.my8031_rel_lto.cy9_1g
l.x
l.x: create secondary indexes
Performance metrics for all DBMS, not just the ones listed above. Some are normalized by throughput, others are not. Legend for results is here.
ips	qps	rps	rmbps	wps	wmbps	rpq	rkbpq	wpi	wkbpi	csps	cpups	cspq	cpupq	dbgb1	dbgb2	rss	maxop	p50	p99	tag
21202	0	110	7.3	575.0	23.7	0.005	0.355	0.027	1.145	4363	8.0	0.206	30	3.0	11.5	1.5	0.013	NA	NA	20m.my8031_rel_withdbg.cy9_1g
21383	0	111	7.4	577.0	23.9	0.005	0.355	0.027	1.146	4396	8.2	0.206	31	3.0	11.5	1.5	0.015	NA	NA	20m.my8031_rel_o2.cy9_1g
20181	0	104	7.0	542.7	22.4	0.005	0.354	0.027	1.137	4178	7.3	0.207	29	3.0	11.5	1.5	0.017	NA	NA	20m.my8031_rel_native.cy9_1g
20040	0	104	6.9	541.8	22.4	0.005	0.354	0.027	1.144	4162	7.7	0.208	31	3.0	11.5	1.5	0.012	NA	NA	20m.my8031_rel.cy9_1g
21590	0	111	7.5	578.2	23.9	0.005	0.354	0.027	1.132	4418	7.9	0.205	29	3.0	11.5	1.5	0.012	NA	NA	20m.my8031_rel_o2_lto.cy9_1g
21360	0	110	7.4	575.6	23.7	0.005	0.354	0.027	1.137	4408	6.8	0.206	25	3.0	11.5	1.5	0.012	NA	NA	20m.my8031_rel_native_lto.cy9_1g
20448	0	106	7.1	550.3	22.7	0.005	0.354	0.027	1.135	4261	5.9	0.208	23	3.0	11.5	1.5	0.014	NA	NA	20m.my8031_rel_lto.cy9_1g
l.i1
l.i1: continue load after secondary indexes created
Performance metrics for all DBMS, not just the ones listed above. Some are normalized by throughput, others are not. Legend for results is here.
ips	qps	rps	rmbps	wps	wmbps	rpq	rkbpq	wpi	wkbpi	csps	cpups	cspq	cpupq	dbgb1	dbgb2	rss	maxop	p50	p99	tag
2294	0	0	0.0	1040.0	21.2	0.000	0.000	0.453	9.457	5901	8.1	2.572	283	7.7	16.3	1.5	4.808	2397	50	20m.my8031_rel_withdbg.cy9_1g
2246	0	0	0.0	1033.9	21.0	0.000	0.000	0.460	9.566	5856	8.2	2.607	292	7.7	16.3	1.5	4.191	2347	50	20m.my8031_rel_o2.cy9_1g
2066	0	0	0.0	917.8	18.8	0.000	0.001	0.444	9.302	5304	7.5	2.567	290	7.7	16.3	1.5	4.130	2197	50	20m.my8031_rel_native.cy9_1g
2016	0	0	0.0	891.9	18.3	0.000	0.000	0.442	9.276	5177	7.3	2.568	290	7.7	16.3	1.5	5.966	2098	0	20m.my8031_rel.cy9_1g
2287	0	0	0.0	1041.0	21.2	0.000	0.000	0.455	9.487	5886	8.1	2.574	283	7.7	16.3	1.5	3.718	2397	50	20m.my8031_rel_o2_lto.cy9_1g
2314	0	0	0.0	1039.1	21.2	0.000	0.001	0.449	9.377	5875	8.0	2.539	277	7.7	16.3	1.5	3.057	2447	50	20m.my8031_rel_native_lto.cy9_1g
2062	0	0	0.0	897.0	18.4	0.000	0.000	0.435	9.154	5191	7.2	2.517	279	7.7	16.3	1.5	4.873	2148	0	20m.my8031_rel_lto.cy9_1g
q100.1
q100.1: range queries with 100 insert/s per client
Performance metrics for all DBMS, not just the ones listed above. Some are normalized by throughput, others are not. Legend for results is here.
ips	qps	rps	rmbps	wps	wmbps	rpq	rkbpq	wpi	wkbpi	csps	cpups	cspq	cpupq	dbgb1	dbgb2	rss	maxop	p50	p99	tag
100	845	1	0.0	673.4	12.4	0.001	0.017	6.747	127.146	7079	7.3	8.381	691	7.9	16.5	1.5	0.472	719	32	20m.my8031_rel_withdbg.cy9_1g
100	809	1	0.0	671.7	12.3	0.002	0.022	6.730	126.570	6956	7.2	8.602	712	7.9	16.5	1.5	0.262	863	32	20m.my8031_rel_o2.cy9_1g
100	776	1	0.0	657.1	12.1	0.001	0.020	6.584	124.100	6746	7.1	8.698	732	7.9	16.5	1.5	0.302	607	32	20m.my8031_rel_native.cy9_1g
100	764	1	0.0	662.4	12.2	0.002	0.026	6.638	124.962	6729	7.0	8.811	733	7.9	16.5	1.5	0.288	703	16	20m.my8031_rel.cy9_1g
100	851	1	0.0	670.1	12.3	0.001	0.020	6.715	126.419	7095	7.3	8.334	686	7.9	16.5	1.5	0.312	735	32	20m.my8031_rel_o2_lto.cy9_1g
100	885	1	0.0	673.4	12.4	0.001	0.016	6.748	126.866	7234	7.3	8.174	660	7.9	16.5	1.5	0.272	640	32	20m.my8031_rel_native_lto.cy9_1g
100	761	1	0.0	660.9	12.2	0.002	0.025	6.622	124.922	6713	6.8	8.817	714	7.9	16.5	1.5	0.457	527	16	20m.my8031_rel_lto.cy9_1g
q500.1
q500.1: range queries with 500 insert/s per client
Performance metrics for all DBMS, not just the ones listed above. Some are normalized by throughput, others are not. Legend for results is here.
ips	qps	rps	rmbps	wps	wmbps	rpq	rkbpq	wpi	wkbpi	csps	cpups	cspq	cpupq	dbgb1	dbgb2	rss	maxop	p50	p99	tag
496	171	5	0.1	1008.0	19.2	0.029	0.464	2.031	39.677	6349	5.7	37.109	2665	8.3	16.9	1.5	0.264	96	48	20m.my8031_rel_withdbg.cy9_1g
497	171	5	0.1	1007.1	19.2	0.029	0.402	2.027	39.574	6338	5.7	37.089	2668	8.3	16.9	1.5	0.176	96	48	20m.my8031_rel_o2.cy9_1g
471	136	5	0.1	880.9	16.9	0.036	0.485	1.872	36.781	5599	4.9	41.256	2889	8.3	16.9	1.5	0.340	80	32	20m.my8031_rel_native.cy9_1g
473	142	5	0.1	890.5	17.1	0.032	0.452	1.883	36.980	5672	5.0	40.087	2827	8.3	16.9	1.5	0.312	80	32	20m.my8031_rel.cy9_1g
498	172	6	0.1	1008.0	19.2	0.032	0.449	2.026	39.585	6345	5.6	36.912	2606	8.3	16.9	1.5	0.160	96	48	20m.my8031_rel_o2_lto.cy9_1g
496	174	4	0.1	1012.6	19.3	0.024	0.412	2.040	39.820	6383	5.6	36.684	2575	8.3	16.9	1.5	0.223	96	48	20m.my8031_rel_native_lto.cy9_1g
474	147	5	0.1	911.4	17.4	0.034	0.497	1.922	37.626	5782	5.1	39.229	2768	8.3	16.9	1.5	0.301	80	16	20m.my8031_rel_lto.cy9_1g
q1000.1
q1000.1: range queries with 1000 insert/s per client
Performance metrics for all DBMS, not just the ones listed above. Some are normalized by throughput, others are not. Legend for results is here.
ips	qps	rps	rmbps	wps	wmbps	rpq	rkbpq	wpi	wkbpi	csps	cpups	cspq	cpupq	dbgb1	dbgb2	rss	maxop	p50	p99	tag
707	126	3	0.0	1018.5	19.6	0.022	0.341	1.440	28.431	6232	5.9	49.425	3743	8.8	17.3	1.5	0.274	80	32	20m.my8031_rel_withdbg.cy9_1g
719	124	3	0.0	1018.5	19.7	0.023	0.336	1.416	28.007	6239	6.0	50.235	3865	8.8	17.3	1.5	0.206	80	32	20m.my8031_rel_o2.cy9_1g
635	104	2	0.0	887.3	17.2	0.022	0.321	1.397	27.657	5510	5.2	52.726	3981	8.8	17.3	1.5	0.481	64	16	20m.my8031_rel_native.cy9_1g
635	106	3	0.0	890.9	17.2	0.024	0.355	1.404	27.801	5523	5.2	52.305	3939	8.8	17.3	1.5	0.474	64	16	20m.my8031_rel.cy9_1g
708	126	3	0.0	1020.0	19.7	0.024	0.364	1.440	28.461	6241	5.9	49.528	3746	8.8	17.3	1.5	0.309	80	32	20m.my8031_rel_o2_lto.cy9_1g
709	126	2	0.0	1024.6	19.7	0.020	0.322	1.444	28.488	6265	5.9	49.642	3740	8.8	17.3	1.5	0.279	80	32	20m.my8031_rel_native_lto.cy9_1g
640	112	3	0.0	923.0	17.8	0.023	0.353	1.442	28.453	5701	5.3	50.995	3793	8.8	17.3	1.5	0.478	64	16	20m.my8031_rel_lto.cy9_1g
l.i0
- l.i0: load without secondary indexes
- Legend for results is here.
- Each entry lists the percentage of responses that fit in that bucket (slower than max time for previous bucket, faster than min time for next bucket).
Insert response time histogram
256us	1ms	4ms	16ms	64ms	256ms	1s	4s	16s	gt	max	tag
0.000	0.000	99.398	0.454	0.144	0.005	0.000	0.000	0.000	0.000	0.089	my8031_rel_withdbg.cy9_1g
0.000	0.000	99.386	0.466	0.143	0.005	0.000	0.000	0.000	0.000	0.092	my8031_rel_o2.cy9_1g
0.000	0.000	99.387	0.459	0.148	0.005	0.000	0.000	0.000	0.000	0.094	my8031_rel_native.cy9_1g
0.000	0.000	99.391	0.458	0.143	0.008	0.000	0.000	0.000	0.000	0.143	my8031_rel.cy9_1g
0.000	0.000	99.395	0.470	0.132	0.003	0.000	0.000	0.000	0.000	0.098	my8031_rel_o2_lto.cy9_1g
0.000	0.000	99.394	0.471	0.132	0.003	0.000	0.000	0.000	0.000	0.123	my8031_rel_native_lto.cy9_1g
0.000	0.000	99.395	0.445	0.151	0.008	0.000	0.000	0.000	0.000	0.116	my8031_rel_lto.cy9_1g
l.x
- l.x: create secondary indexes
- Legend for results is here.
- Each entry lists the percentage of responses that fit in that bucket (slower than max time for previous bucket, faster than min time for next bucket).
TODO - determine whether there is data for create index response time
l.i1
- l.i1: continue load after secondary indexes created
- Legend for results is here.
- Each entry lists the percentage of responses that fit in that bucket (slower than max time for previous bucket, faster than min time for next bucket).
Insert response time histogram
256us	1ms	4ms	16ms	64ms	256ms	1s	4s	16s	gt	max	tag
0.000	0.000	0.409	59.982	34.099	5.362	0.127	0.021	0.001	0.000	4.808	my8031_rel_withdbg.cy9_1g
0.000	0.000	0.250	58.865	35.349	5.383	0.132	0.021	nonzero	0.000	4.191	my8031_rel_o2.cy9_1g
0.000	0.000	0.273	57.452	35.008	7.081	0.154	0.031	nonzero	0.000	4.130	my8031_rel_native.cy9_1g
0.000	0.000	0.309	57.037	34.867	7.587	0.168	0.031	0.001	0.000	5.966	my8031_rel.cy9_1g
0.000	0.000	0.427	59.720	34.291	5.418	0.118	0.025	0.000	0.000	3.718	my8031_rel_o2_lto.cy9_1g
0.000	0.000	0.472	60.394	33.578	5.409	0.122	0.025	0.000	0.000	3.057	my8031_rel_native_lto.cy9_1g
0.000	0.000	0.464	58.181	33.658	7.508	0.157	0.030	0.001	0.000	4.873	my8031_rel_lto.cy9_1g
q100.1
- q100.1: range queries with 100 insert/s per client
- Legend for results is here.
- Each entry lists the percentage of responses that fit in that bucket (slower than max time for previous bucket, faster than min time for next bucket).
Query response time histogram
256us	1ms	4ms	16ms	64ms	256ms	1s	4s	16s	gt	max	tag
1.683	93.488	0.630	2.496	1.656	0.047	nonzero	0.000	0.000	0.000	0.472	my8031_rel_withdbg.cy9_1g
1.000	93.914	0.691	2.634	1.708	0.053	nonzero	0.000	0.000	0.000	0.262	my8031_rel_o2.cy9_1g
0.968	93.853	0.705	2.577	1.819	0.079	nonzero	0.000	0.000	0.000	0.302	my8031_rel_native.cy9_1g
0.940	93.720	0.733	2.667	1.859	0.081	nonzero	0.000	0.000	0.000	0.288	my8031_rel.cy9_1g
1.968	93.192	0.639	2.540	1.614	0.046	nonzero	0.000	0.000	0.000	0.312	my8031_rel_o2_lto.cy9_1g
3.380	92.025	0.601	2.418	1.531	0.046	nonzero	0.000	0.000	0.000	0.272	my8031_rel_native_lto.cy9_1g
2.825	91.908	0.658	2.636	1.885	0.086	0.002	0.000	0.000	0.000	0.457	my8031_rel_lto.cy9_1g
Insert response time histogram
256us	1ms	4ms	16ms	64ms	256ms	1s	4s	16s	gt	max	tag
0.000	0.000	0.111	42.750	12.056	38.056	7.028	0.000	0.000	0.000	0.552	my8031_rel_withdbg.cy9_1g
0.000	0.000	0.028	38.250	13.694	40.750	7.278	0.000	0.000	0.000	0.705	my8031_rel_o2.cy9_1g
0.000	0.000	0.083	38.778	13.278	38.333	9.528	0.000	0.000	0.000	0.659	my8031_rel_native.cy9_1g
0.000	0.000	0.083	36.278	14.389	39.778	9.472	0.000	0.000	0.000	0.892	my8031_rel.cy9_1g
0.000	0.000	0.056	41.083	12.111	39.861	6.889	0.000	0.000	0.000	0.522	my8031_rel_o2_lto.cy9_1g
0.000	0.000	0.306	45.750	12.667	34.306	6.972	0.000	0.000	0.000	0.843	my8031_rel_native_lto.cy9_1g
0.000	0.000	0.472	36.806	12.111	39.944	10.639	0.028	0.000	0.000	1.175	my8031_rel_lto.cy9_1g
q500.1
- q500.1: range queries with 500 insert/s per client
- Legend for results is here.
- Each entry lists the percentage of responses that fit in that bucket (slower than max time for previous bucket, faster than min time for next bucket).
Query response time histogram
256us	1ms	4ms	16ms	64ms	256ms	1s	4s	16s	gt	max	tag
0.341	64.116	2.668	21.157	11.473	0.245	nonzero	0.000	0.000	0.000	0.264	my8031_rel_withdbg.cy9_1g
0.104	64.107	3.021	21.205	11.284	0.280	0.000	0.000	0.000	0.000	0.176	my8031_rel_o2.cy9_1g
0.202	61.008	3.079	20.243	14.655	0.810	0.003	0.000	0.000	0.000	0.340	my8031_rel_native.cy9_1g
0.204	62.339	2.907	19.705	14.114	0.729	0.001	0.000	0.000	0.000	0.312	my8031_rel.cy9_1g
0.281	64.456	2.610	21.008	11.394	0.250	0.000	0.000	0.000	0.000	0.160	my8031_rel_o2_lto.cy9_1g
0.651	64.514	2.421	20.840	11.350	0.225	0.000	0.000	0.000	0.000	0.223	my8031_rel_native_lto.cy9_1g
0.664	63.198	2.544	19.525	13.426	0.643	0.001	0.000	0.000	0.000	0.301	my8031_rel_lto.cy9_1g
Insert response time histogram
256us	1ms	4ms	16ms	64ms	256ms	1s	4s	16s	gt	max	tag
0.000	0.000	0.044	16.144	28.383	55.228	0.200	0.000	0.000	0.000	0.684	my8031_rel_withdbg.cy9_1g
0.000	0.000	0.056	16.528	29.544	53.661	0.211	0.000	0.000	0.000	0.562	my8031_rel_o2.cy9_1g
0.000	0.000	0.056	15.194	25.978	57.583	1.189	0.000	0.000	0.000	0.747	my8031_rel_native.cy9_1g
0.000	0.000	0.083	14.750	25.911	58.239	1.017	0.000	0.000	0.000	0.634	my8031_rel.cy9_1g
0.000	0.000	0.083	17.039	27.317	55.389	0.172	0.000	0.000	0.000	0.438	my8031_rel_o2_lto.cy9_1g
0.000	0.000	0.044	17.817	26.950	54.989	0.200	0.000	0.000	0.000	0.592	my8031_rel_native_lto.cy9_1g
0.000	0.000	0.061	15.367	25.172	58.206	1.194	0.000	0.000	0.000	0.826	my8031_rel_lto.cy9_1g
q1000.1
- q1000.1: range queries with 1000 insert/s per client
- Legend for results is here.
- Each entry lists the percentage of responses that fit in that bucket (slower than max time for previous bucket, faster than min time for next bucket).
Query response time histogram
256us	1ms	4ms	16ms	64ms	256ms	1s	4s	16s	gt	max	tag
0.074	54.312	5.418	23.604	15.974	0.618	0.001	0.000	0.000	0.000	0.274	my8031_rel_withdbg.cy9_1g
0.022	52.034	6.588	24.644	16.072	0.640	0.000	0.000	0.000	0.000	0.206	my8031_rel_o2.cy9_1g
0.016	51.100	6.046	22.600	18.774	1.454	0.010	0.000	0.000	0.000	0.481	my8031_rel_native.cy9_1g
0.026	51.998	5.972	21.885	18.642	1.473	0.005	0.000	0.000	0.000	0.474	my8031_rel.cy9_1g
0.054	53.821	5.441	24.037	16.069	0.578	nonzero	0.000	0.000	0.000	0.309	my8031_rel_o2_lto.cy9_1g
0.140	54.417	5.027	23.830	15.972	0.615	nonzero	0.000	0.000	0.000	0.279	my8031_rel_native_lto.cy9_1g
0.129	54.338	4.776	21.816	17.771	1.160	0.010	0.000	0.000	0.000	0.478	my8031_rel_lto.cy9_1g
Insert response time histogram
256us	1ms	4ms	16ms	64ms	256ms	1s	4s	16s	gt	max	tag
0.000	0.000	0.017	23.019	30.853	45.942	0.169	0.000	0.000	0.000	0.451	my8031_rel_withdbg.cy9_1g
0.000	0.000	0.000	21.514	33.208	45.194	0.083	0.000	0.000	0.000	0.376	my8031_rel_o2.cy9_1g
0.000	0.000	0.003	20.133	29.211	49.719	0.933	0.000	0.000	0.000	0.739	my8031_rel_native.cy9_1g
0.000	0.000	0.011	20.322	29.144	49.628	0.894	0.000	0.000	0.000	0.706	my8031_rel.cy9_1g
0.000	0.000	0.011	22.306	31.200	46.350	0.133	0.000	0.000	0.000	0.476	my8031_rel_o2_lto.cy9_1g
0.000	0.000	0.008	22.656	30.997	46.144	0.194	0.000	0.000	0.000	0.424	my8031_rel_native_lto.cy9_1g
0.000	0.000	0.022	21.589	28.228	49.319	0.842	0.000	0.000	0.000	0.970	my8031_rel_lto.cy9_1g