Introduction
This is a report for the insert benchmark with 20M docs and 4 client(s). It is generated by scripts (bash, awk, sed) and Tufte might not be impressed. An overview of the insert benchmark is here and a short update is here. Below, by DBMS, I mean DBMS+version.config. An example is my8020.c10b40 where my means MySQL, 8020 is version 8.0.20 and c10b40 is the name for the configuration file.
The test server has 8 AMD cores, 16G RAM and an NVMe SSD. It is described here as the Beelink. The benchmark was run with 4 clients and there were 1 or 2 connections per client (1 for queries, 1 for inserts). The benchmark loads 20M rows without secondary indexes, creates secondary indexes, loads another 20M rows then does 3 read+write tests for one hour each that do queries as fast as possible with 100, 500 and then 1000 writes/second/client concurrent with the queries. There is 1 table per client. The database is cached by the storage engine and the only IO is for writes. Clients and the DBMS share one server. The per-database configs are in the per-database subdirectories here.
The tested DBMS are:
- my8022_rel_native_lto.cy9 - InnoDB and MySQL 8.0.22, the cy9 config and compiled with CMAKE_BUILD_TYPE=Release -O3 -flto
- my8028_rel_native_lto.cy9 - InnoDB and MySQL 8.0.28, the cy9 config and compiled with CMAKE_BUILD_TYPE=Release -O3 -flto
- my8031_rel_native_lto.cy9 - InnoDB and MySQL 8.0.31, the cy9 config and compiled with CMAKE_BUILD_TYPE=Release -O3 -flto
- my8032_rel_native_lto.cy9 - InnoDB and MySQL 8.0.32, the cy9 config and compiled with CMAKE_BUILD_TYPE=Release -O3 -flto
Contents
- Summary
- l.i0: load without secondary indexes
- l.x: create secondary indexes
- l.i1: continue load after secondary indexes created
- q100.1: range queries with 100 insert/s per client
- q500.1: range queries with 500 insert/s per client
- q1000.1: range queries with 1000 insert/s per client
Summary
The numbers are inserts/s for l.i0 and l.i1, indexed docs (or rows) /s for l.x and queries/s for q*.2. The values are the average rate over the entire test for inserts (IPS) and queries (QPS). The range of values for IPS and QPS is split into 3 parts: bottom 25%, middle 50%, top 25%. Values in the bottom 25% have a red background, values in the top 25% have a green background and values in the middle have no color. A gray background is used for values that can be ignored because the DBMS did not sustain the target insert rate. Red backgrounds are not used when the minimum value is within 80% of the max value.
| dbms | l.i0 | l.x | l.i1 | q100.1 | q500.1 | q1000.1 |
|---|---|---|---|---|---|---|
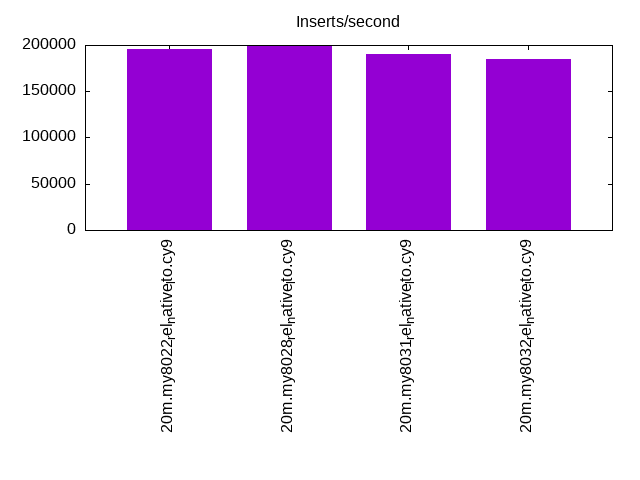
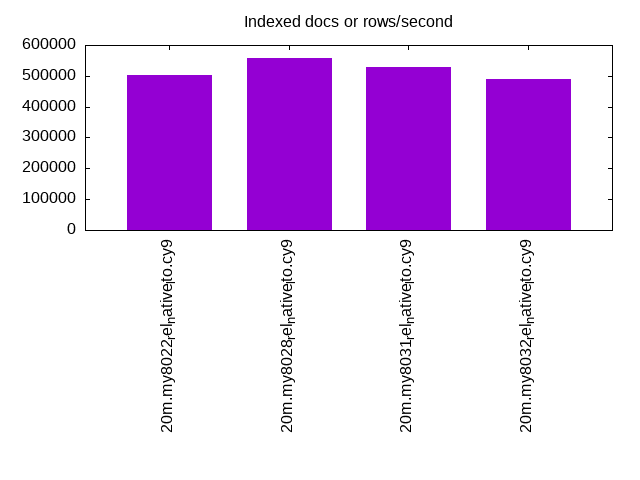
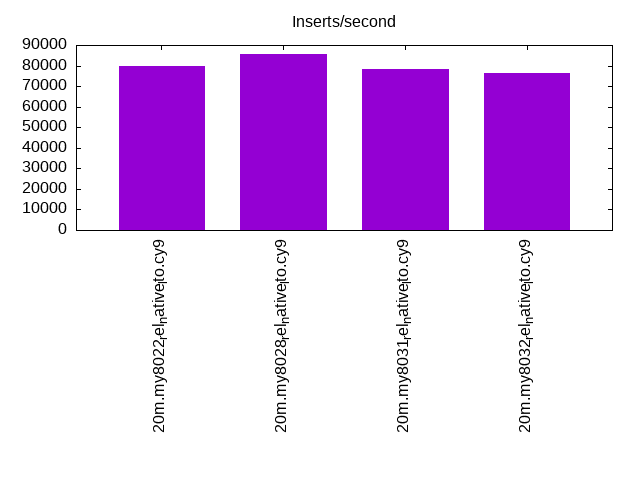
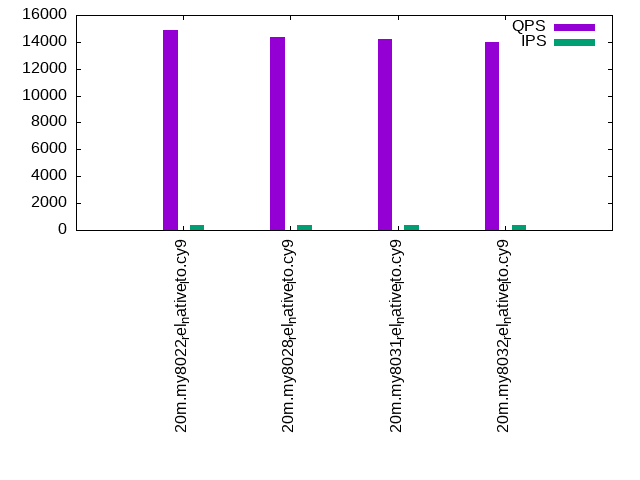
| 20m.my8022_rel_native_lto.cy9 | 196078 | 502500 | 79681 | 14888 | 14817 | 14821 |
| 20m.my8028_rel_native_lto.cy9 | 200000 | 558333 | 85470 | 14344 | 14365 | 14360 |
| 20m.my8031_rel_native_lto.cy9 | 190476 | 528947 | 78125 | 14250 | 14001 | 14105 |
| 20m.my8032_rel_native_lto.cy9 | 185185 | 490244 | 76336 | 14026 | 13943 | 13979 |
This table has relative throughput, throughput for the DBMS relative to the DBMS in the first line, using the absolute throughput from the previous table.
| dbms | l.i0 | l.x | l.i1 | q100.1 | q500.1 | q1000.1 |
|---|---|---|---|---|---|---|
| 20m.my8022_rel_native_lto.cy9 | 1.00 | 1.00 | 1.00 | 1.00 | 1.00 | 1.00 |
| 20m.my8028_rel_native_lto.cy9 | 1.02 | 1.11 | 1.07 | 0.96 | 0.97 | 0.97 |
| 20m.my8031_rel_native_lto.cy9 | 0.97 | 1.05 | 0.98 | 0.96 | 0.94 | 0.95 |
| 20m.my8032_rel_native_lto.cy9 | 0.94 | 0.98 | 0.96 | 0.94 | 0.94 | 0.94 |
This lists the average rate of inserts/s for the tests that do inserts concurrent with queries. For such tests the query rate is listed in the table above. The read+write tests are setup so that the insert rate should match the target rate every second. Cells that are not at least 95% of the target have a red background to indicate a failure to satisfy the target.
| dbms | q100.1 | q500.1 | q1000.1 |
|---|---|---|---|
| my8022_rel_native_lto.cy9 | 399 | 1994 | 3989 |
| my8028_rel_native_lto.cy9 | 399 | 1994 | 3989 |
| my8031_rel_native_lto.cy9 | 399 | 1994 | 3989 |
| my8032_rel_native_lto.cy9 | 399 | 1994 | 3989 |
| target | 400 | 2000 | 4000 |
l.i0
l.i0: load without secondary indexes. Graphs for performance per 1-second interval are here.
Average throughput:
Insert response time histogram: each cell has the percentage of responses that take <= the time in the header and max is the max response time in seconds. For the max column values in the top 25% of the range have a red background and in the bottom 25% of the range have a green background. The red background is not used when the min value is within 80% of the max value.
| dbms | 256us | 1ms | 4ms | 16ms | 64ms | 256ms | 1s | 4s | 16s | gt | max |
|---|---|---|---|---|---|---|---|---|---|---|---|
| my8022_rel_native_lto.cy9 | 98.776 | 1.004 | 0.202 | 0.017 | 0.124 | ||||||
| my8028_rel_native_lto.cy9 | 99.275 | 0.622 | 0.084 | 0.019 | 0.123 | ||||||
| my8031_rel_native_lto.cy9 | 99.252 | 0.615 | 0.118 | 0.015 | 0.116 | ||||||
| my8032_rel_native_lto.cy9 | 99.231 | 0.623 | 0.126 | 0.019 | 0.109 |
Performance metrics for the DBMS listed above. Some are normalized by throughput, others are not. Legend for results is here.
ips	qps	rps	rmbps	wps	wmbps	rpq	rkbpq	wpi	wkbpi	csps	cpups	cspq	cpupq	dbgb1	dbgb2	rss	maxop	p50	p99	tag
196078	0	0	0.0	356.4	53.0	0.000	0.000	0.002	0.277	22211	67.5	0.113	28	1.3	9.9	2.5	0.124	56938	21977	20m.my8022_rel_native_lto.cy9
200000	0	0	0.0	371.4	53.8	0.000	0.000	0.002	0.276	22502	68.5	0.113	27	1.3	9.9	2.5	0.123	57937	37759	20m.my8028_rel_native_lto.cy9
190476	0	0	0.0	340.6	52.8	0.000	0.000	0.002	0.284	21537	68.6	0.113	29	1.3	9.9	2.5	0.116	55240	35462	20m.my8031_rel_native_lto.cy9
185185	0	0	0.0	336.3	51.0	0.000	0.000	0.002	0.282	20197	65.1	0.109	28	1.3	9.9	2.5	0.109	53142	31482	20m.my8032_rel_native_lto.cy9
l.x
l.x: create secondary indexes.
Average throughput:
Performance metrics for the DBMS listed above. Some are normalized by throughput, others are not. Legend for results is here.
ips	qps	rps	rmbps	wps	wmbps	rpq	rkbpq	wpi	wkbpi	csps	cpups	cspq	cpupq	dbgb1	dbgb2	rss	maxop	p50	p99	tag
502500	0	0	0.0	4354.6	357.2	0.000	0.000	0.009	0.728	20064	44.1	0.040	7	3.0	11.6	2.8	0.003	NA	NA	20m.my8022_rel_native_lto.cy9
558333	0	3026	198.2	10988.6	528.0	0.005	0.363	0.020	0.968	29828	84.6	0.053	12	3.0	11.6	3.5	0.008	NA	NA	20m.my8028_rel_native_lto.cy9
528947	0	3021	198.1	7962.1	479.6	0.006	0.383	0.015	0.928	25282	85.2	0.048	13	3.0	11.6	3.5	0.010	NA	NA	20m.my8031_rel_native_lto.cy9
490244	0	2646	173.3	8692.5	448.2	0.005	0.362	0.018	0.936	26015	86.1	0.053	14	3.0	11.6	3.7	0.009	NA	NA	20m.my8032_rel_native_lto.cy9
l.i1
l.i1: continue load after secondary indexes created. Graphs for performance per 1-second interval are here.
Average throughput:
Insert response time histogram: each cell has the percentage of responses that take <= the time in the header and max is the max response time in seconds. For the max column values in the top 25% of the range have a red background and in the bottom 25% of the range have a green background. The red background is not used when the min value is within 80% of the max value.
| dbms | 256us | 1ms | 4ms | 16ms | 64ms | 256ms | 1s | 4s | 16s | gt | max |
|---|---|---|---|---|---|---|---|---|---|---|---|
| my8022_rel_native_lto.cy9 | 97.767 | 1.807 | 0.400 | 0.027 | 0.120 | ||||||
| my8028_rel_native_lto.cy9 | 98.337 | 1.434 | 0.220 | 0.009 | 0.116 | ||||||
| my8031_rel_native_lto.cy9 | 98.139 | 1.602 | 0.249 | 0.009 | 0.121 | ||||||
| my8032_rel_native_lto.cy9 | 98.075 | 1.663 | 0.251 | 0.011 | 0.109 |
Performance metrics for the DBMS listed above. Some are normalized by throughput, others are not. Legend for results is here.
ips	qps	rps	rmbps	wps	wmbps	rpq	rkbpq	wpi	wkbpi	csps	cpups	cspq	cpupq	dbgb1	dbgb2	rss	maxop	p50	p99	tag
79681	0	366	5.7	1574.4	84.1	0.005	0.073	0.020	1.080	20472	58.2	0.257	58	7.9	16.5	8.4	0.120	21326	999	20m.my8022_rel_native_lto.cy9
85470	0	397	6.2	1656.1	89.5	0.005	0.074	0.019	1.073	22537	60.5	0.264	57	7.9	16.5	8.4	0.116	22538	1398	20m.my8028_rel_native_lto.cy9
78125	0	358	5.6	1835.2	95.9	0.005	0.073	0.023	1.257	21421	59.0	0.274	60	7.9	16.5	8.4	0.121	20486	1798	20m.my8031_rel_native_lto.cy9
76336	0	352	5.5	1810.8	94.8	0.005	0.074	0.024	1.272	21085	58.9	0.276	62	7.9	16.5	8.4	0.109	20178	1498	20m.my8032_rel_native_lto.cy9
q100.1
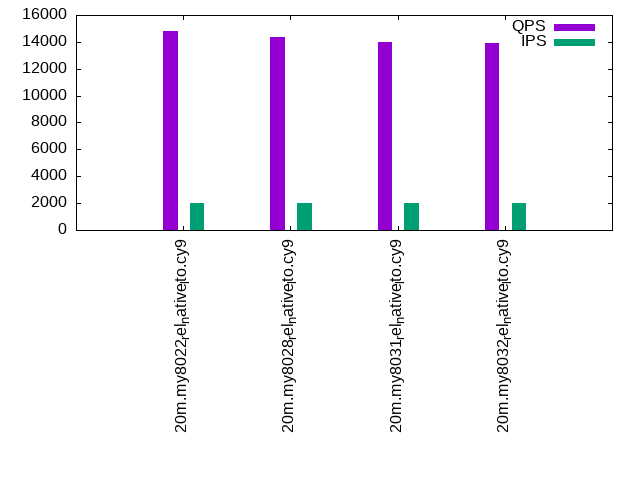
q100.1: range queries with 100 insert/s per client. Graphs for performance per 1-second interval are here.
Average throughput:
Query response time histogram: each cell has the percentage of responses that take <= the time in the header and max is the max response time in seconds. For max values in the top 25% of the range have a red background and in the bottom 25% of the range have a green background. The red background is not used when the min value is within 80% of the max value.
| dbms | 256us | 1ms | 4ms | 16ms | 64ms | 256ms | 1s | 4s | 16s | gt | max |
|---|---|---|---|---|---|---|---|---|---|---|---|
| my8022_rel_native_lto.cy9 | 56.665 | 43.329 | 0.005 | nonzero | nonzero | 0.023 | |||||
| my8028_rel_native_lto.cy9 | 52.248 | 47.746 | 0.005 | nonzero | nonzero | 0.022 | |||||
| my8031_rel_native_lto.cy9 | 52.194 | 47.801 | 0.005 | nonzero | nonzero | 0.026 | |||||
| my8032_rel_native_lto.cy9 | 49.467 | 50.527 | 0.005 | nonzero | nonzero | 0.022 |
Insert response time histogram: each cell has the percentage of responses that take <= the time in the header and max is the max response time in seconds. For max values in the top 25% of the range have a red background and in the bottom 25% of the range have a green background. The red background is not used when the min value is within 80% of the max value.
| dbms | 256us | 1ms | 4ms | 16ms | 64ms | 256ms | 1s | 4s | 16s | gt | max |
|---|---|---|---|---|---|---|---|---|---|---|---|
| my8022_rel_native_lto.cy9 | 98.556 | 0.562 | 0.882 | 0.030 | |||||||
| my8028_rel_native_lto.cy9 | 98.389 | 0.868 | 0.743 | 0.024 | |||||||
| my8031_rel_native_lto.cy9 | 98.639 | 0.562 | 0.799 | 0.030 | |||||||
| my8032_rel_native_lto.cy9 | 98.285 | 0.965 | 0.750 | 0.029 |
Performance metrics for the DBMS listed above. Some are normalized by throughput, others are not. Legend for results is here.
ips	qps	rps	rmbps	wps	wmbps	rpq	rkbpq	wpi	wkbpi	csps	cpups	cspq	cpupq	dbgb1	dbgb2	rss	maxop	p50	p99	tag
399	14888	0	0.0	214.9	5.7	0.000	0.000	0.539	14.597	57226	50.5	3.844	271	8.4	17.0	8.9	0.023	3741	3310	20m.my8022_rel_native_lto.cy9
399	14344	0	0.0	217.5	5.7	0.000	0.000	0.545	14.702	55256	50.4	3.852	281	8.4	17.0	8.8	0.022	3596	3196	20m.my8028_rel_native_lto.cy9
399	14250	0	0.0	224.0	6.0	0.000	0.000	0.562	15.343	55058	50.2	3.864	282	8.4	17.0	8.8	0.026	3532	2894	20m.my8031_rel_native_lto.cy9
399	14026	0	0.0	222.9	5.9	0.000	0.000	0.559	15.249	54269	50.2	3.869	286	8.4	17.0	8.8	0.022	3564	2893	20m.my8032_rel_native_lto.cy9
q500.1
q500.1: range queries with 500 insert/s per client. Graphs for performance per 1-second interval are here.
Average throughput:
Query response time histogram: each cell has the percentage of responses that take <= the time in the header and max is the max response time in seconds. For max values in the top 25% of the range have a red background and in the bottom 25% of the range have a green background. The red background is not used when the min value is within 80% of the max value.
| dbms | 256us | 1ms | 4ms | 16ms | 64ms | 256ms | 1s | 4s | 16s | gt | max |
|---|---|---|---|---|---|---|---|---|---|---|---|
| my8022_rel_native_lto.cy9 | 56.239 | 43.745 | 0.014 | 0.001 | 0.001 | 0.031 | |||||
| my8028_rel_native_lto.cy9 | 52.880 | 47.102 | 0.016 | 0.001 | nonzero | 0.021 | |||||
| my8031_rel_native_lto.cy9 | 48.953 | 51.030 | 0.016 | 0.001 | nonzero | 0.021 | |||||
| my8032_rel_native_lto.cy9 | 47.990 | 51.993 | 0.016 | 0.002 | nonzero | 0.023 |
Insert response time histogram: each cell has the percentage of responses that take <= the time in the header and max is the max response time in seconds. For max values in the top 25% of the range have a red background and in the bottom 25% of the range have a green background. The red background is not used when the min value is within 80% of the max value.
| dbms | 256us | 1ms | 4ms | 16ms | 64ms | 256ms | 1s | 4s | 16s | gt | max |
|---|---|---|---|---|---|---|---|---|---|---|---|
| my8022_rel_native_lto.cy9 | 95.454 | 4.085 | 0.413 | 0.049 | 0.106 | ||||||
| my8028_rel_native_lto.cy9 | 97.739 | 1.946 | 0.303 | 0.013 | 0.103 | ||||||
| my8031_rel_native_lto.cy9 | 97.372 | 2.233 | 0.354 | 0.040 | 0.108 | ||||||
| my8032_rel_native_lto.cy9 | 95.213 | 4.362 | 0.375 | 0.050 | 0.109 |
Performance metrics for the DBMS listed above. Some are normalized by throughput, others are not. Legend for results is here.
ips	qps	rps	rmbps	wps	wmbps	rpq	rkbpq	wpi	wkbpi	csps	cpups	cspq	cpupq	dbgb1	dbgb2	rss	maxop	p50	p99	tag
1994	14817	0	0.0	158.1	5.1	0.000	0.000	0.079	2.598	56285	51.4	3.799	278	9.5	18.0	9.8	0.031	3774	3342	20m.my8022_rel_native_lto.cy9
1994	14365	0	0.0	189.9	5.9	0.000	0.000	0.095	3.007	54889	51.3	3.821	286	9.5	18.0	9.7	0.021	3532	3133	20m.my8028_rel_native_lto.cy9
1994	14001	0	0.0	242.7	7.3	0.000	0.000	0.122	3.770	53742	51.2	3.838	293	9.5	18.0	9.8	0.021	3404	2893	20m.my8031_rel_native_lto.cy9
1994	13943	0	0.0	244.2	7.4	0.000	0.000	0.122	3.794	53492	51.2	3.836	294	9.5	18.0	9.8	0.023	3436	2877	20m.my8032_rel_native_lto.cy9
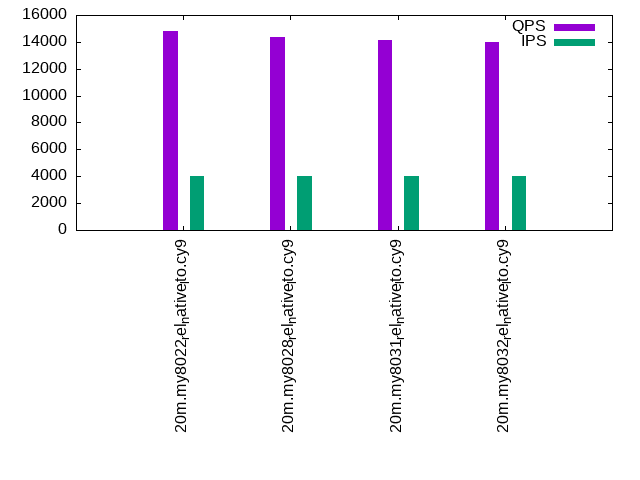
q1000.1
q1000.1: range queries with 1000 insert/s per client. Graphs for performance per 1-second interval are here.
Average throughput:
Query response time histogram: each cell has the percentage of responses that take <= the time in the header and max is the max response time in seconds. For max values in the top 25% of the range have a red background and in the bottom 25% of the range have a green background. The red background is not used when the min value is within 80% of the max value.
| dbms | 256us | 1ms | 4ms | 16ms | 64ms | 256ms | 1s | 4s | 16s | gt | max |
|---|---|---|---|---|---|---|---|---|---|---|---|
| my8022_rel_native_lto.cy9 | 56.828 | 43.140 | 0.028 | 0.003 | nonzero | 0.030 | |||||
| my8028_rel_native_lto.cy9 | 52.516 | 47.454 | 0.026 | 0.003 | nonzero | 0.021 | |||||
| my8031_rel_native_lto.cy9 | 49.477 | 50.487 | 0.033 | 0.002 | nonzero | 0.020 | |||||
| my8032_rel_native_lto.cy9 | 47.786 | 52.176 | 0.035 | 0.003 | nonzero | 0.020 |
Insert response time histogram: each cell has the percentage of responses that take <= the time in the header and max is the max response time in seconds. For max values in the top 25% of the range have a red background and in the bottom 25% of the range have a green background. The red background is not used when the min value is within 80% of the max value.
| dbms | 256us | 1ms | 4ms | 16ms | 64ms | 256ms | 1s | 4s | 16s | gt | max |
|---|---|---|---|---|---|---|---|---|---|---|---|
| my8022_rel_native_lto.cy9 | 95.199 | 4.572 | 0.165 | 0.065 | 0.122 | ||||||
| my8028_rel_native_lto.cy9 | 94.956 | 4.787 | 0.151 | 0.106 | 0.112 | ||||||
| my8031_rel_native_lto.cy9 | 97.936 | 1.935 | 0.114 | 0.015 | 0.108 | ||||||
| my8032_rel_native_lto.cy9 | 97.426 | 2.424 | 0.126 | 0.024 | 0.108 |
Performance metrics for the DBMS listed above. Some are normalized by throughput, others are not. Legend for results is here.
ips	qps	rps	rmbps	wps	wmbps	rpq	rkbpq	wpi	wkbpi	csps	cpups	cspq	cpupq	dbgb1	dbgb2	rss	maxop	p50	p99	tag
3989	14821	0	0.0	334.6	9.7	0.000	0.000	0.084	2.494	55809	52.6	3.766	284	10.0	18.6	10.4	0.030	3740	3310	20m.my8022_rel_native_lto.cy9
3989	14360	0	0.0	322.9	9.4	0.000	0.000	0.081	2.416	54313	52.6	3.782	293	10.1	18.6	10.3	0.021	3574	3165	20m.my8028_rel_native_lto.cy9
3989	14105	0	0.0	372.7	10.8	0.000	0.000	0.093	2.784	53652	52.6	3.804	298	10.0	18.6	10.3	0.020	3486	2925	20m.my8031_rel_native_lto.cy9
3989	13979	0	0.0	370.5	10.8	0.000	0.000	0.093	2.773	53159	52.8	3.803	302	10.1	18.6	10.3	0.020	3436	2925	20m.my8032_rel_native_lto.cy9
l.i0
l.i0: load without secondary indexes
Performance metrics for all DBMS, not just the ones listed above. Some are normalized by throughput, others are not. Legend for results is here.
ips	qps	rps	rmbps	wps	wmbps	rpq	rkbpq	wpi	wkbpi	csps	cpups	cspq	cpupq	dbgb1	dbgb2	rss	maxop	p50	p99	tag
196078	0	0	0.0	356.4	53.0	0.000	0.000	0.002	0.277	22211	67.5	0.113	28	1.3	9.9	2.5	0.124	56938	21977	20m.my8022_rel_native_lto.cy9
200000	0	0	0.0	371.4	53.8	0.000	0.000	0.002	0.276	22502	68.5	0.113	27	1.3	9.9	2.5	0.123	57937	37759	20m.my8028_rel_native_lto.cy9
190476	0	0	0.0	340.6	52.8	0.000	0.000	0.002	0.284	21537	68.6	0.113	29	1.3	9.9	2.5	0.116	55240	35462	20m.my8031_rel_native_lto.cy9
185185	0	0	0.0	336.3	51.0	0.000	0.000	0.002	0.282	20197	65.1	0.109	28	1.3	9.9	2.5	0.109	53142	31482	20m.my8032_rel_native_lto.cy9
l.x
l.x: create secondary indexes
Performance metrics for all DBMS, not just the ones listed above. Some are normalized by throughput, others are not. Legend for results is here.
ips	qps	rps	rmbps	wps	wmbps	rpq	rkbpq	wpi	wkbpi	csps	cpups	cspq	cpupq	dbgb1	dbgb2	rss	maxop	p50	p99	tag
502500	0	0	0.0	4354.6	357.2	0.000	0.000	0.009	0.728	20064	44.1	0.040	7	3.0	11.6	2.8	0.003	NA	NA	20m.my8022_rel_native_lto.cy9
558333	0	3026	198.2	10988.6	528.0	0.005	0.363	0.020	0.968	29828	84.6	0.053	12	3.0	11.6	3.5	0.008	NA	NA	20m.my8028_rel_native_lto.cy9
528947	0	3021	198.1	7962.1	479.6	0.006	0.383	0.015	0.928	25282	85.2	0.048	13	3.0	11.6	3.5	0.010	NA	NA	20m.my8031_rel_native_lto.cy9
490244	0	2646	173.3	8692.5	448.2	0.005	0.362	0.018	0.936	26015	86.1	0.053	14	3.0	11.6	3.7	0.009	NA	NA	20m.my8032_rel_native_lto.cy9
l.i1
l.i1: continue load after secondary indexes created
Performance metrics for all DBMS, not just the ones listed above. Some are normalized by throughput, others are not. Legend for results is here.
ips	qps	rps	rmbps	wps	wmbps	rpq	rkbpq	wpi	wkbpi	csps	cpups	cspq	cpupq	dbgb1	dbgb2	rss	maxop	p50	p99	tag
79681	0	366	5.7	1574.4	84.1	0.005	0.073	0.020	1.080	20472	58.2	0.257	58	7.9	16.5	8.4	0.120	21326	999	20m.my8022_rel_native_lto.cy9
85470	0	397	6.2	1656.1	89.5	0.005	0.074	0.019	1.073	22537	60.5	0.264	57	7.9	16.5	8.4	0.116	22538	1398	20m.my8028_rel_native_lto.cy9
78125	0	358	5.6	1835.2	95.9	0.005	0.073	0.023	1.257	21421	59.0	0.274	60	7.9	16.5	8.4	0.121	20486	1798	20m.my8031_rel_native_lto.cy9
76336	0	352	5.5	1810.8	94.8	0.005	0.074	0.024	1.272	21085	58.9	0.276	62	7.9	16.5	8.4	0.109	20178	1498	20m.my8032_rel_native_lto.cy9
q100.1
q100.1: range queries with 100 insert/s per client
Performance metrics for all DBMS, not just the ones listed above. Some are normalized by throughput, others are not. Legend for results is here.
ips	qps	rps	rmbps	wps	wmbps	rpq	rkbpq	wpi	wkbpi	csps	cpups	cspq	cpupq	dbgb1	dbgb2	rss	maxop	p50	p99	tag
399	14888	0	0.0	214.9	5.7	0.000	0.000	0.539	14.597	57226	50.5	3.844	271	8.4	17.0	8.9	0.023	3741	3310	20m.my8022_rel_native_lto.cy9
399	14344	0	0.0	217.5	5.7	0.000	0.000	0.545	14.702	55256	50.4	3.852	281	8.4	17.0	8.8	0.022	3596	3196	20m.my8028_rel_native_lto.cy9
399	14250	0	0.0	224.0	6.0	0.000	0.000	0.562	15.343	55058	50.2	3.864	282	8.4	17.0	8.8	0.026	3532	2894	20m.my8031_rel_native_lto.cy9
399	14026	0	0.0	222.9	5.9	0.000	0.000	0.559	15.249	54269	50.2	3.869	286	8.4	17.0	8.8	0.022	3564	2893	20m.my8032_rel_native_lto.cy9
q500.1
q500.1: range queries with 500 insert/s per client
Performance metrics for all DBMS, not just the ones listed above. Some are normalized by throughput, others are not. Legend for results is here.
ips	qps	rps	rmbps	wps	wmbps	rpq	rkbpq	wpi	wkbpi	csps	cpups	cspq	cpupq	dbgb1	dbgb2	rss	maxop	p50	p99	tag
1994	14817	0	0.0	158.1	5.1	0.000	0.000	0.079	2.598	56285	51.4	3.799	278	9.5	18.0	9.8	0.031	3774	3342	20m.my8022_rel_native_lto.cy9
1994	14365	0	0.0	189.9	5.9	0.000	0.000	0.095	3.007	54889	51.3	3.821	286	9.5	18.0	9.7	0.021	3532	3133	20m.my8028_rel_native_lto.cy9
1994	14001	0	0.0	242.7	7.3	0.000	0.000	0.122	3.770	53742	51.2	3.838	293	9.5	18.0	9.8	0.021	3404	2893	20m.my8031_rel_native_lto.cy9
1994	13943	0	0.0	244.2	7.4	0.000	0.000	0.122	3.794	53492	51.2	3.836	294	9.5	18.0	9.8	0.023	3436	2877	20m.my8032_rel_native_lto.cy9
q1000.1
q1000.1: range queries with 1000 insert/s per client
Performance metrics for all DBMS, not just the ones listed above. Some are normalized by throughput, others are not. Legend for results is here.
ips	qps	rps	rmbps	wps	wmbps	rpq	rkbpq	wpi	wkbpi	csps	cpups	cspq	cpupq	dbgb1	dbgb2	rss	maxop	p50	p99	tag
3989	14821	0	0.0	334.6	9.7	0.000	0.000	0.084	2.494	55809	52.6	3.766	284	10.0	18.6	10.4	0.030	3740	3310	20m.my8022_rel_native_lto.cy9
3989	14360	0	0.0	322.9	9.4	0.000	0.000	0.081	2.416	54313	52.6	3.782	293	10.1	18.6	10.3	0.021	3574	3165	20m.my8028_rel_native_lto.cy9
3989	14105	0	0.0	372.7	10.8	0.000	0.000	0.093	2.784	53652	52.6	3.804	298	10.0	18.6	10.3	0.020	3486	2925	20m.my8031_rel_native_lto.cy9
3989	13979	0	0.0	370.5	10.8	0.000	0.000	0.093	2.773	53159	52.8	3.803	302	10.1	18.6	10.3	0.020	3436	2925	20m.my8032_rel_native_lto.cy9
l.i0
- l.i0: load without secondary indexes
- Legend for results is here.
- Each entry lists the percentage of responses that fit in that bucket (slower than max time for previous bucket, faster than min time for next bucket).
Insert response time histogram
256us	1ms	4ms	16ms	64ms	256ms	1s	4s	16s	gt	max	tag
0.000	0.000	98.776	1.004	0.202	0.017	0.000	0.000	0.000	0.000	0.124	my8022_rel_native_lto.cy9
0.000	0.000	99.275	0.622	0.084	0.019	0.000	0.000	0.000	0.000	0.123	my8028_rel_native_lto.cy9
0.000	0.000	99.252	0.615	0.118	0.015	0.000	0.000	0.000	0.000	0.116	my8031_rel_native_lto.cy9
0.000	0.000	99.231	0.623	0.126	0.019	0.000	0.000	0.000	0.000	0.109	my8032_rel_native_lto.cy9
l.x
- l.x: create secondary indexes
- Legend for results is here.
- Each entry lists the percentage of responses that fit in that bucket (slower than max time for previous bucket, faster than min time for next bucket).
TODO - determine whether there is data for create index response time
l.i1
- l.i1: continue load after secondary indexes created
- Legend for results is here.
- Each entry lists the percentage of responses that fit in that bucket (slower than max time for previous bucket, faster than min time for next bucket).
Insert response time histogram
256us	1ms	4ms	16ms	64ms	256ms	1s	4s	16s	gt	max	tag
0.000	0.000	97.767	1.807	0.400	0.027	0.000	0.000	0.000	0.000	0.120	my8022_rel_native_lto.cy9
0.000	0.000	98.337	1.434	0.220	0.009	0.000	0.000	0.000	0.000	0.116	my8028_rel_native_lto.cy9
0.000	0.000	98.139	1.602	0.249	0.009	0.000	0.000	0.000	0.000	0.121	my8031_rel_native_lto.cy9
0.000	0.000	98.075	1.663	0.251	0.011	0.000	0.000	0.000	0.000	0.109	my8032_rel_native_lto.cy9
q100.1
- q100.1: range queries with 100 insert/s per client
- Legend for results is here.
- Each entry lists the percentage of responses that fit in that bucket (slower than max time for previous bucket, faster than min time for next bucket).
Query response time histogram
256us	1ms	4ms	16ms	64ms	256ms	1s	4s	16s	gt	max	tag
56.665	43.329	0.005	nonzero	nonzero	0.000	0.000	0.000	0.000	0.000	0.023	my8022_rel_native_lto.cy9
52.248	47.746	0.005	nonzero	nonzero	0.000	0.000	0.000	0.000	0.000	0.022	my8028_rel_native_lto.cy9
52.194	47.801	0.005	nonzero	nonzero	0.000	0.000	0.000	0.000	0.000	0.026	my8031_rel_native_lto.cy9
49.467	50.527	0.005	nonzero	nonzero	0.000	0.000	0.000	0.000	0.000	0.022	my8032_rel_native_lto.cy9
Insert response time histogram
256us	1ms	4ms	16ms	64ms	256ms	1s	4s	16s	gt	max	tag
0.000	0.000	98.556	0.562	0.882	0.000	0.000	0.000	0.000	0.000	0.030	my8022_rel_native_lto.cy9
0.000	0.000	98.389	0.868	0.743	0.000	0.000	0.000	0.000	0.000	0.024	my8028_rel_native_lto.cy9
0.000	0.000	98.639	0.562	0.799	0.000	0.000	0.000	0.000	0.000	0.030	my8031_rel_native_lto.cy9
0.000	0.000	98.285	0.965	0.750	0.000	0.000	0.000	0.000	0.000	0.029	my8032_rel_native_lto.cy9
q500.1
- q500.1: range queries with 500 insert/s per client
- Legend for results is here.
- Each entry lists the percentage of responses that fit in that bucket (slower than max time for previous bucket, faster than min time for next bucket).
Query response time histogram
256us	1ms	4ms	16ms	64ms	256ms	1s	4s	16s	gt	max	tag
56.239	43.745	0.014	0.001	0.001	0.000	0.000	0.000	0.000	0.000	0.031	my8022_rel_native_lto.cy9
52.880	47.102	0.016	0.001	nonzero	0.000	0.000	0.000	0.000	0.000	0.021	my8028_rel_native_lto.cy9
48.953	51.030	0.016	0.001	nonzero	0.000	0.000	0.000	0.000	0.000	0.021	my8031_rel_native_lto.cy9
47.990	51.993	0.016	0.002	nonzero	0.000	0.000	0.000	0.000	0.000	0.023	my8032_rel_native_lto.cy9
Insert response time histogram
256us	1ms	4ms	16ms	64ms	256ms	1s	4s	16s	gt	max	tag
0.000	0.000	95.454	4.085	0.413	0.049	0.000	0.000	0.000	0.000	0.106	my8022_rel_native_lto.cy9
0.000	0.000	97.739	1.946	0.303	0.013	0.000	0.000	0.000	0.000	0.103	my8028_rel_native_lto.cy9
0.000	0.000	97.372	2.233	0.354	0.040	0.000	0.000	0.000	0.000	0.108	my8031_rel_native_lto.cy9
0.000	0.000	95.213	4.362	0.375	0.050	0.000	0.000	0.000	0.000	0.109	my8032_rel_native_lto.cy9
q1000.1
- q1000.1: range queries with 1000 insert/s per client
- Legend for results is here.
- Each entry lists the percentage of responses that fit in that bucket (slower than max time for previous bucket, faster than min time for next bucket).
Query response time histogram
256us	1ms	4ms	16ms	64ms	256ms	1s	4s	16s	gt	max	tag
56.828	43.140	0.028	0.003	nonzero	0.000	0.000	0.000	0.000	0.000	0.030	my8022_rel_native_lto.cy9
52.516	47.454	0.026	0.003	nonzero	0.000	0.000	0.000	0.000	0.000	0.021	my8028_rel_native_lto.cy9
49.477	50.487	0.033	0.002	nonzero	0.000	0.000	0.000	0.000	0.000	0.020	my8031_rel_native_lto.cy9
47.786	52.176	0.035	0.003	nonzero	0.000	0.000	0.000	0.000	0.000	0.020	my8032_rel_native_lto.cy9
Insert response time histogram
256us	1ms	4ms	16ms	64ms	256ms	1s	4s	16s	gt	max	tag
0.000	0.000	95.199	4.572	0.165	0.065	0.000	0.000	0.000	0.000	0.122	my8022_rel_native_lto.cy9
0.000	0.000	94.956	4.787	0.151	0.106	0.000	0.000	0.000	0.000	0.112	my8028_rel_native_lto.cy9
0.000	0.000	97.936	1.935	0.114	0.015	0.000	0.000	0.000	0.000	0.108	my8031_rel_native_lto.cy9
0.000	0.000	97.426	2.424	0.126	0.024	0.000	0.000	0.000	0.000	0.108	my8032_rel_native_lto.cy9