Introduction
This is a report for the insert benchmark with 20M docs and 4 client(s). It is generated by scripts (bash, awk, sed) and Tufte might not be impressed. An overview of the insert benchmark is here and a short update is here. Below, by DBMS, I mean DBMS+version.config. An example is my8020.c10b40 where my means MySQL, 8020 is version 8.0.20 and c10b40 is the name for the configuration file.
The test server has 8 AMD cores, 16G RAM and an NVMe SSD. It is described here as the Beelink. The benchmark was run with 4 clients and there were 1 or 2 connections per client (1 for queries, 1 for inserts). The benchmark loads 20M rows without secondary indexes, creates secondary indexes, loads another 20M rows then does 3 read+write tests for one hour each that do queries as fast as possible with 100, 500 and then 1000 writes/second/client concurrent with the queries. There is 1 table. The database is cached by the OS but not by InnoDB. Clients and the DBMS share one server. The per-database configs are in the per-database subdirectories here.
The tested DBMS are:
- my8022_rel_native_lto.cy9_1g - InnoDB and MySQL 8.0.22, the cy9_1g config and compiled with CMAKE_BUILD_TYPE=Release -O3 -flto
- my8028_rel_native_lto.cy9_1g - InnoDB and MySQL 8.0.28, the cy9_1g config and compiled with CMAKE_BUILD_TYPE=Release -O3 -flto
- my8031_rel_native_lto.cy9_1g - InnoDB and MySQL 8.0.31, the cy9_1g config and compiled with CMAKE_BUILD_TYPE=Release -O3 -flto
- my8032_rel_native_lto.cy9_1g - InnoDB and MySQL 8.0.32, the cy9_1g config and compiled with CMAKE_BUILD_TYPE=Release -O3 -flto
Contents
- Summary
- l.i0: load without secondary indexes
- l.x: create secondary indexes
- l.i1: continue load after secondary indexes created
- q100.1: range queries with 100 insert/s per client
- q500.1: range queries with 500 insert/s per client
- q1000.1: range queries with 1000 insert/s per client
Summary
The numbers are inserts/s for l.i0 and l.i1, indexed docs (or rows) /s for l.x and queries/s for q*.2. The values are the average rate over the entire test for inserts (IPS) and queries (QPS). The range of values for IPS and QPS is split into 3 parts: bottom 25%, middle 50%, top 25%. Values in the bottom 25% have a red background, values in the top 25% have a green background and values in the middle have no color. A gray background is used for values that can be ignored because the DBMS did not sustain the target insert rate. Red backgrounds are not used when the minimum value is within 80% of the max value.
| dbms | l.i0 | l.x | l.i1 | q100.1 | q500.1 | q1000.1 |
|---|---|---|---|---|---|---|
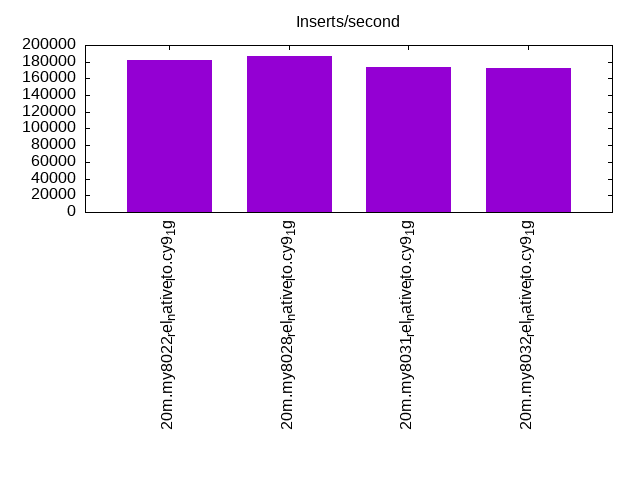
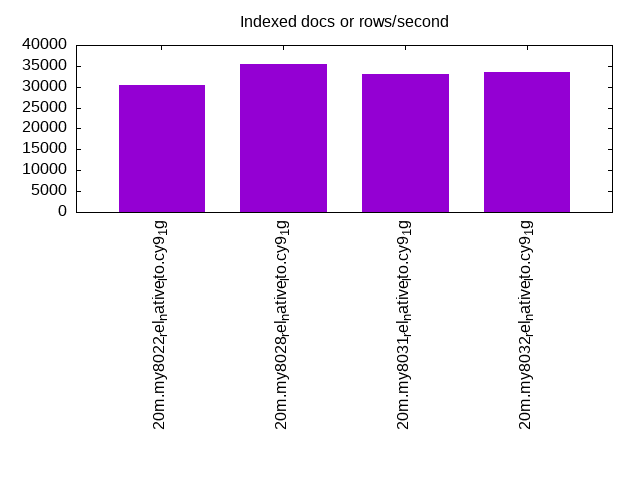
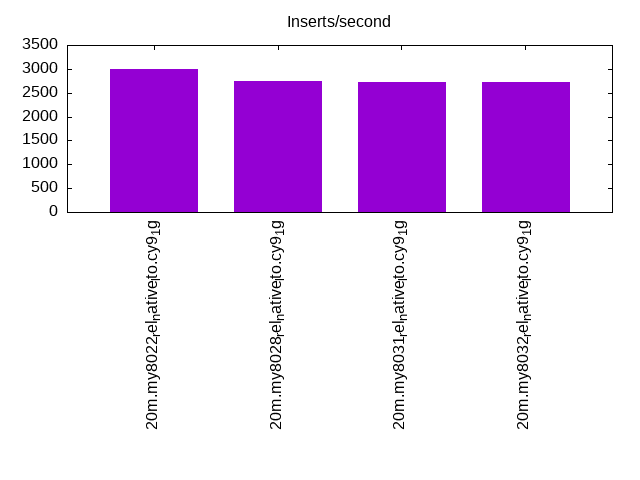
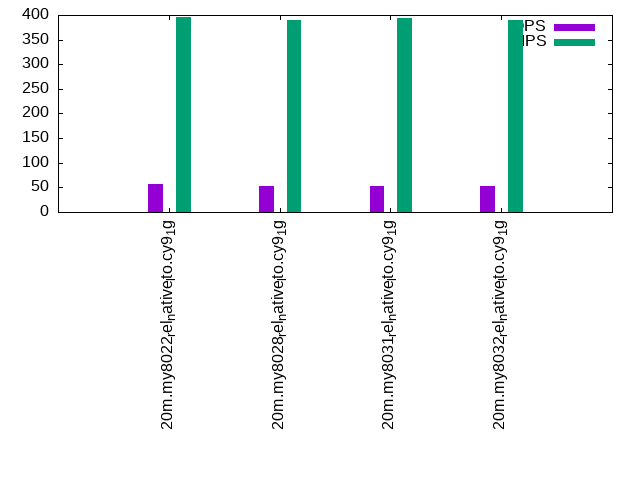
| 20m.my8022_rel_native_lto.cy9_1g | 181818 | 30454 | 3007 | 57 | 45 | 29 |
| 20m.my8028_rel_native_lto.cy9_1g | 186916 | 35512 | 2747 | 52 | 41 | 26 |
| 20m.my8031_rel_native_lto.cy9_1g | 173913 | 33005 | 2720 | 52 | 40 | 26 |
| 20m.my8032_rel_native_lto.cy9_1g | 172414 | 33612 | 2721 | 52 | 40 | 25 |
This table has relative throughput, throughput for the DBMS relative to the DBMS in the first line, using the absolute throughput from the previous table.
| dbms | l.i0 | l.x | l.i1 | q100.1 | q500.1 | q1000.1 |
|---|---|---|---|---|---|---|
| 20m.my8022_rel_native_lto.cy9_1g | 1.00 | 1.00 | 1.00 | 1.00 | 1.00 | 1.00 |
| 20m.my8028_rel_native_lto.cy9_1g | 1.03 | 1.17 | 0.91 | 0.91 | 0.91 | 0.90 |
| 20m.my8031_rel_native_lto.cy9_1g | 0.96 | 1.08 | 0.90 | 0.91 | 0.89 | 0.90 |
| 20m.my8032_rel_native_lto.cy9_1g | 0.95 | 1.10 | 0.90 | 0.91 | 0.89 | 0.86 |
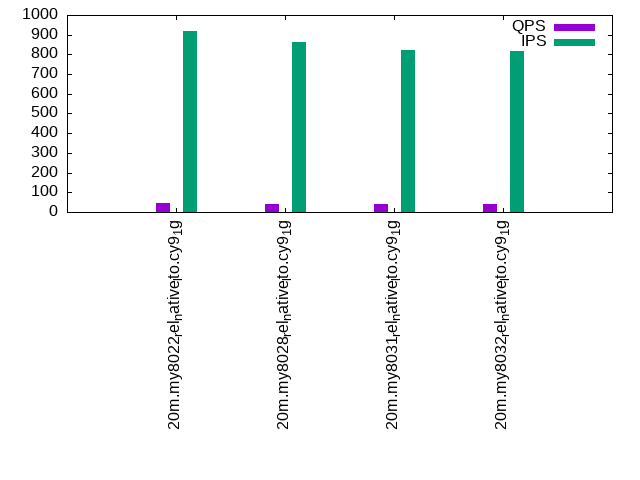
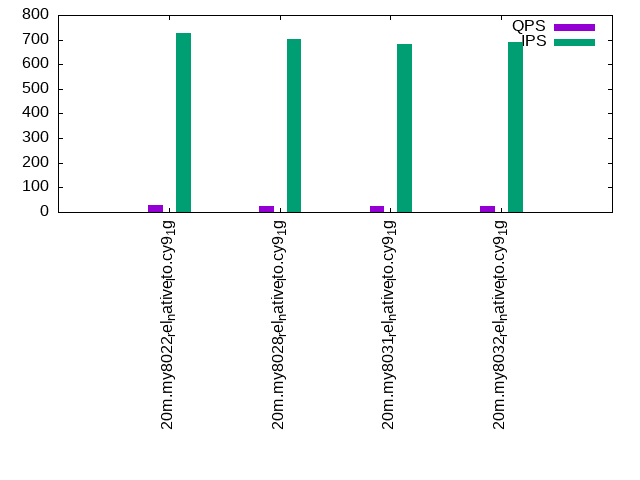
This lists the average rate of inserts/s for the tests that do inserts concurrent with queries. For such tests the query rate is listed in the table above. The read+write tests are setup so that the insert rate should match the target rate every second. Cells that are not at least 95% of the target have a red background to indicate a failure to satisfy the target.
| dbms | q100.1 | q500.1 | q1000.1 |
|---|---|---|---|
| my8022_rel_native_lto.cy9_1g | 395 | 920 | 726 |
| my8028_rel_native_lto.cy9_1g | 390 | 864 | 702 |
| my8031_rel_native_lto.cy9_1g | 394 | 822 | 681 |
| my8032_rel_native_lto.cy9_1g | 390 | 815 | 689 |
| target | 400 | 2000 | 4000 |
l.i0
l.i0: load without secondary indexes. Graphs for performance per 1-second interval are here.
Average throughput:
Insert response time histogram: each cell has the percentage of responses that take <= the time in the header and max is the max response time in seconds. For the max column values in the top 25% of the range have a red background and in the bottom 25% of the range have a green background. The red background is not used when the min value is within 80% of the max value.
| dbms | 256us | 1ms | 4ms | 16ms | 64ms | 256ms | 1s | 4s | 16s | gt | max |
|---|---|---|---|---|---|---|---|---|---|---|---|
| my8022_rel_native_lto.cy9_1g | 98.133 | 1.395 | 0.445 | 0.026 | 0.145 | ||||||
| my8028_rel_native_lto.cy9_1g | 98.527 | 1.230 | 0.215 | 0.028 | 0.171 | ||||||
| my8031_rel_native_lto.cy9_1g | 98.093 | 1.511 | 0.367 | 0.029 | 0.156 | ||||||
| my8032_rel_native_lto.cy9_1g | 98.221 | 1.407 | 0.348 | 0.024 | 0.134 |
Performance metrics for the DBMS listed above. Some are normalized by throughput, others are not. Legend for results is here.
ips	qps	rps	rmbps	wps	wmbps	rpq	rkbpq	wpi	wkbpi	csps	cpups	cspq	cpupq	dbgb1	dbgb2	rss	maxop	p50	p99	tag
181818	0	0	0.0	424.9	53.5	0.000	0.000	0.002	0.301	19779	61.1	0.109	27	1.3	9.9	1.3	0.145	55240	7590	20m.my8022_rel_native_lto.cy9_1g
186916	0	0	0.0	406.4	53.0	0.000	0.000	0.002	0.290	20084	62.7	0.107	27	1.3	9.9	1.4	0.171	56739	24972	20m.my8028_rel_native_lto.cy9_1g
173913	0	0	0.0	427.0	49.7	0.000	0.000	0.002	0.293	18990	59.5	0.109	27	1.3	9.9	1.4	0.156	53342	20977	20m.my8031_rel_native_lto.cy9_1g
172414	0	0	0.0	414.4	49.4	0.000	0.000	0.002	0.293	18829	61.0	0.109	28	1.3	9.9	1.4	0.134	51464	2597	20m.my8032_rel_native_lto.cy9_1g
l.x
l.x: create secondary indexes.
Average throughput:
Performance metrics for the DBMS listed above. Some are normalized by throughput, others are not. Legend for results is here.
ips	qps	rps	rmbps	wps	wmbps	rpq	rkbpq	wpi	wkbpi	csps	cpups	cspq	cpupq	dbgb1	dbgb2	rss	maxop	p50	p99	tag
30454	0	0	0.0	704.4	23.3	0.000	0.000	0.023	0.783	5065	4.5	0.166	12	3.0	11.6	1.5	0.045	NA	NA	20m.my8022_rel_native_lto.cy9_1g
35512	0	187	12.3	1107.4	35.9	0.005	0.354	0.031	1.035	9998	9.1	0.282	20	3.0	11.6	1.5	0.067	NA	NA	20m.my8028_rel_native_lto.cy9_1g
33005	0	174	11.4	1040.4	33.5	0.005	0.355	0.032	1.039	9533	8.8	0.289	21	3.0	11.6	1.5	0.176	NA	NA	20m.my8031_rel_native_lto.cy9_1g
33612	0	178	11.6	1056.9	34.1	0.005	0.355	0.031	1.040	9660	9.4	0.287	22	3.0	11.6	1.5	0.109	NA	NA	20m.my8032_rel_native_lto.cy9_1g
l.i1
l.i1: continue load after secondary indexes created. Graphs for performance per 1-second interval are here.
Average throughput:
Insert response time histogram: each cell has the percentage of responses that take <= the time in the header and max is the max response time in seconds. For the max column values in the top 25% of the range have a red background and in the bottom 25% of the range have a green background. The red background is not used when the min value is within 80% of the max value.
| dbms | 256us | 1ms | 4ms | 16ms | 64ms | 256ms | 1s | 4s | 16s | gt | max |
|---|---|---|---|---|---|---|---|---|---|---|---|
| my8022_rel_native_lto.cy9_1g | 0.164 | 23.970 | 39.358 | 34.927 | 1.372 | 0.183 | 0.026 | 8.675 | |||
| my8028_rel_native_lto.cy9_1g | 0.083 | 18.202 | 41.086 | 38.687 | 1.737 | 0.175 | 0.030 | 8.359 | |||
| my8031_rel_native_lto.cy9_1g | 0.032 | 19.195 | 39.892 | 38.727 | 1.943 | 0.182 | 0.029 | 7.840 | |||
| my8032_rel_native_lto.cy9_1g | 0.024 | 19.519 | 39.928 | 38.296 | 2.022 | 0.182 | 0.029 | 7.601 |
Performance metrics for the DBMS listed above. Some are normalized by throughput, others are not. Legend for results is here.
ips	qps	rps	rmbps	wps	wmbps	rpq	rkbpq	wpi	wkbpi	csps	cpups	cspq	cpupq	dbgb1	dbgb2	rss	maxop	p50	p99	tag
3007	0	0	0.0	1050.8	19.5	0.000	0.000	0.349	6.629	10102	10.5	3.360	279	7.8	16.4	1.5	8.675	600	0	20m.my8022_rel_native_lto.cy9_1g
2747	0	0	0.0	972.4	17.5	0.000	0.000	0.354	6.513	6218	10.4	2.263	303	7.8	16.4	1.5	8.359	600	0	20m.my8028_rel_native_lto.cy9_1g
2720	0	0	0.0	977.5	18.2	0.000	0.001	0.359	6.845	6377	11.1	2.345	326	7.8	16.4	1.5	7.840	599	0	20m.my8031_rel_native_lto.cy9_1g
2721	0	0	0.0	976.6	18.2	0.000	0.001	0.359	6.837	6371	11.1	2.342	326	7.8	16.4	1.5	7.601	599	0	20m.my8032_rel_native_lto.cy9_1g
q100.1
q100.1: range queries with 100 insert/s per client. Graphs for performance per 1-second interval are here.
Average throughput:
Query response time histogram: each cell has the percentage of responses that take <= the time in the header and max is the max response time in seconds. For max values in the top 25% of the range have a red background and in the bottom 25% of the range have a green background. The red background is not used when the min value is within 80% of the max value.
| dbms | 256us | 1ms | 4ms | 16ms | 64ms | 256ms | 1s | 4s | 16s | gt | max |
|---|---|---|---|---|---|---|---|---|---|---|---|
| my8022_rel_native_lto.cy9_1g | 0.002 | 12.479 | 3.837 | 8.888 | 35.083 | 37.113 | 2.599 | 0.928 | |||
| my8028_rel_native_lto.cy9_1g | 0.003 | 11.239 | 2.980 | 7.970 | 34.181 | 40.190 | 3.432 | 0.004 | 1.705 | ||
| my8031_rel_native_lto.cy9_1g | 0.001 | 10.760 | 3.322 | 7.495 | 34.154 | 40.941 | 3.322 | 0.004 | 1.958 | ||
| my8032_rel_native_lto.cy9_1g | 10.999 | 3.704 | 7.575 | 33.813 | 40.556 | 3.349 | 0.004 | 1.516 |
Insert response time histogram: each cell has the percentage of responses that take <= the time in the header and max is the max response time in seconds. For max values in the top 25% of the range have a red background and in the bottom 25% of the range have a green background. The red background is not used when the min value is within 80% of the max value.
| dbms | 256us | 1ms | 4ms | 16ms | 64ms | 256ms | 1s | 4s | 16s | gt | max |
|---|---|---|---|---|---|---|---|---|---|---|---|
| my8022_rel_native_lto.cy9_1g | 0.236 | 1.764 | 31.153 | 64.486 | 2.361 | 1.722 | |||||
| my8028_rel_native_lto.cy9_1g | 0.007 | 0.188 | 1.472 | 31.042 | 63.472 | 3.819 | 2.223 | ||||
| my8031_rel_native_lto.cy9_1g | 0.250 | 1.410 | 30.444 | 64.715 | 3.181 | 2.190 | |||||
| my8032_rel_native_lto.cy9_1g | 0.250 | 1.472 | 30.194 | 64.319 | 3.764 | 2.361 |
Performance metrics for the DBMS listed above. Some are normalized by throughput, others are not. Legend for results is here.
ips	qps	rps	rmbps	wps	wmbps	rpq	rkbpq	wpi	wkbpi	csps	cpups	cspq	cpupq	dbgb1	dbgb2	rss	maxop	p50	p99	tag
395	57	7	0.1	1148.9	15.4	0.118	1.964	2.906	39.874	10832	4.5	189.045	6283	8.4	17.0	1.5	0.928	16	0	20m.my8022_rel_native_lto.cy9_1g
390	52	9	0.1	1121.3	14.7	0.167	2.776	2.872	38.477	7286	4.7	140.920	7272	8.4	17.0	1.5	1.705	16	0	20m.my8028_rel_native_lto.cy9_1g
394	52	10	0.2	1125.3	14.9	0.194	3.008	2.856	38.671	7479	4.9	144.374	7568	8.4	17.0	1.5	1.958	16	0	20m.my8031_rel_native_lto.cy9_1g
390	52	10	0.2	1124.0	14.9	0.202	3.125	2.885	39.042	7463	4.9	144.625	7597	8.4	17.0	1.5	1.516	16	0	20m.my8032_rel_native_lto.cy9_1g
q500.1
q500.1: range queries with 500 insert/s per client. Graphs for performance per 1-second interval are here.
Average throughput:
Query response time histogram: each cell has the percentage of responses that take <= the time in the header and max is the max response time in seconds. For max values in the top 25% of the range have a red background and in the bottom 25% of the range have a green background. The red background is not used when the min value is within 80% of the max value.
| dbms | 256us | 1ms | 4ms | 16ms | 64ms | 256ms | 1s | 4s | 16s | gt | max |
|---|---|---|---|---|---|---|---|---|---|---|---|
| my8022_rel_native_lto.cy9_1g | 0.002 | 8.054 | 3.718 | 6.849 | 32.270 | 44.149 | 4.953 | 0.005 | 1.688 | ||
| my8028_rel_native_lto.cy9_1g | 0.001 | 7.663 | 3.119 | 6.196 | 30.676 | 45.849 | 6.487 | 0.011 | 1.521 | ||
| my8031_rel_native_lto.cy9_1g | 7.248 | 3.636 | 6.152 | 30.114 | 45.625 | 7.200 | 0.025 | 1.804 | |||
| my8032_rel_native_lto.cy9_1g | 0.001 | 7.274 | 3.752 | 6.099 | 29.644 | 45.800 | 7.405 | 0.026 | 2.255 |
Insert response time histogram: each cell has the percentage of responses that take <= the time in the header and max is the max response time in seconds. For max values in the top 25% of the range have a red background and in the bottom 25% of the range have a green background. The red background is not used when the min value is within 80% of the max value.
| dbms | 256us | 1ms | 4ms | 16ms | 64ms | 256ms | 1s | 4s | 16s | gt | max |
|---|---|---|---|---|---|---|---|---|---|---|---|
| my8022_rel_native_lto.cy9_1g | 0.007 | 2.126 | 8.885 | 58.833 | 30.010 | 0.139 | 2.197 | ||||
| my8028_rel_native_lto.cy9_1g | 0.004 | 1.931 | 9.361 | 56.069 | 32.149 | 0.486 | 1.755 | ||||
| my8031_rel_native_lto.cy9_1g | 1.717 | 8.447 | 54.721 | 34.513 | 0.603 | 3.191 | |||||
| my8032_rel_native_lto.cy9_1g | 0.003 | 1.801 | 7.972 | 54.844 | 34.675 | 0.704 | 2.429 |
Performance metrics for the DBMS listed above. Some are normalized by throughput, others are not. Legend for results is here.
ips	qps	rps	rmbps	wps	wmbps	rpq	rkbpq	wpi	wkbpi	csps	cpups	cspq	cpupq	dbgb1	dbgb2	rss	maxop	p50	p99	tag
920	45	5	0.1	1139.4	15.7	0.108	1.942	1.238	17.457	10839	5.5	240.327	9756	9.5	18.0	1.5	1.688	16	0	20m.my8022_rel_native_lto.cy9_1g
864	41	7	0.1	1093.7	14.6	0.162	2.867	1.266	17.360	7219	5.7	174.789	11041	9.4	18.0	1.5	1.521	16	0	20m.my8028_rel_native_lto.cy9_1g
822	40	8	0.1	1056.2	14.4	0.188	3.150	1.286	17.908	7143	5.9	177.685	11741	9.4	18.0	1.5	1.804	16	0	20m.my8031_rel_native_lto.cy9_1g
815	40	8	0.1	1042.3	14.2	0.195	3.202	1.279	17.826	7056	5.9	177.281	11859	9.4	18.0	1.5	2.255	16	0	20m.my8032_rel_native_lto.cy9_1g
q1000.1
q1000.1: range queries with 1000 insert/s per client. Graphs for performance per 1-second interval are here.
Average throughput:
Query response time histogram: each cell has the percentage of responses that take <= the time in the header and max is the max response time in seconds. For max values in the top 25% of the range have a red background and in the bottom 25% of the range have a green background. The red background is not used when the min value is within 80% of the max value.
| dbms | 256us | 1ms | 4ms | 16ms | 64ms | 256ms | 1s | 4s | 16s | gt | max |
|---|---|---|---|---|---|---|---|---|---|---|---|
| my8022_rel_native_lto.cy9_1g | 0.001 | 7.034 | 3.756 | 5.134 | 22.464 | 44.055 | 17.508 | 0.049 | 2.727 | ||
| my8028_rel_native_lto.cy9_1g | 6.188 | 3.101 | 4.823 | 21.088 | 43.925 | 20.672 | 0.202 | 3.071 | |||
| my8031_rel_native_lto.cy9_1g | 5.954 | 3.536 | 4.881 | 21.441 | 43.382 | 20.611 | 0.196 | 2.911 | |||
| my8032_rel_native_lto.cy9_1g | 5.776 | 3.538 | 4.805 | 21.000 | 43.917 | 20.743 | 0.222 | 2.805 |
Insert response time histogram: each cell has the percentage of responses that take <= the time in the header and max is the max response time in seconds. For max values in the top 25% of the range have a red background and in the bottom 25% of the range have a green background. The red background is not used when the min value is within 80% of the max value.
| dbms | 256us | 1ms | 4ms | 16ms | 64ms | 256ms | 1s | 4s | 16s | gt | max |
|---|---|---|---|---|---|---|---|---|---|---|---|
| my8022_rel_native_lto.cy9_1g | 0.007 | 4.298 | 4.597 | 44.341 | 46.415 | 0.342 | 2.714 | ||||
| my8028_rel_native_lto.cy9_1g | 0.003 | 3.545 | 5.970 | 45.978 | 43.019 | 1.485 | 3.039 | ||||
| my8031_rel_native_lto.cy9_1g | 0.001 | 3.568 | 5.683 | 45.146 | 44.061 | 1.542 | 3.582 | ||||
| my8032_rel_native_lto.cy9_1g | 0.001 | 3.581 | 5.759 | 45.425 | 43.694 | 1.541 | 2.760 |
Performance metrics for the DBMS listed above. Some are normalized by throughput, others are not. Legend for results is here.
ips	qps	rps	rmbps	wps	wmbps	rpq	rkbpq	wpi	wkbpi	csps	cpups	cspq	cpupq	dbgb1	dbgb2	rss	maxop	p50	p99	tag
726	29	2	0.0	756.6	10.8	0.062	1.121	1.042	15.157	5615	4.4	195.644	12265	10.0	18.6	1.5	2.727	0	0	20m.my8022_rel_native_lto.cy9_1g
702	26	3	0.1	722.5	9.9	0.123	2.178	1.029	14.504	4909	4.5	192.508	14117	10.0	18.6	1.4	3.071	0	0	20m.my8028_rel_native_lto.cy9_1g
681	26	4	0.1	714.4	10.0	0.167	2.883	1.048	15.054	5022	4.8	196.943	15059	10.0	18.6	1.4	2.911	0	0	20m.my8031_rel_native_lto.cy9_1g
689	25	4	0.1	716.5	10.0	0.173	2.991	1.040	14.915	5038	4.8	199.126	15178	10.0	18.6	1.4	2.805	0	0	20m.my8032_rel_native_lto.cy9_1g
l.i0
l.i0: load without secondary indexes
Performance metrics for all DBMS, not just the ones listed above. Some are normalized by throughput, others are not. Legend for results is here.
ips	qps	rps	rmbps	wps	wmbps	rpq	rkbpq	wpi	wkbpi	csps	cpups	cspq	cpupq	dbgb1	dbgb2	rss	maxop	p50	p99	tag
181818	0	0	0.0	424.9	53.5	0.000	0.000	0.002	0.301	19779	61.1	0.109	27	1.3	9.9	1.3	0.145	55240	7590	20m.my8022_rel_native_lto.cy9_1g
186916	0	0	0.0	406.4	53.0	0.000	0.000	0.002	0.290	20084	62.7	0.107	27	1.3	9.9	1.4	0.171	56739	24972	20m.my8028_rel_native_lto.cy9_1g
173913	0	0	0.0	427.0	49.7	0.000	0.000	0.002	0.293	18990	59.5	0.109	27	1.3	9.9	1.4	0.156	53342	20977	20m.my8031_rel_native_lto.cy9_1g
172414	0	0	0.0	414.4	49.4	0.000	0.000	0.002	0.293	18829	61.0	0.109	28	1.3	9.9	1.4	0.134	51464	2597	20m.my8032_rel_native_lto.cy9_1g
l.x
l.x: create secondary indexes
Performance metrics for all DBMS, not just the ones listed above. Some are normalized by throughput, others are not. Legend for results is here.
ips	qps	rps	rmbps	wps	wmbps	rpq	rkbpq	wpi	wkbpi	csps	cpups	cspq	cpupq	dbgb1	dbgb2	rss	maxop	p50	p99	tag
30454	0	0	0.0	704.4	23.3	0.000	0.000	0.023	0.783	5065	4.5	0.166	12	3.0	11.6	1.5	0.045	NA	NA	20m.my8022_rel_native_lto.cy9_1g
35512	0	187	12.3	1107.4	35.9	0.005	0.354	0.031	1.035	9998	9.1	0.282	20	3.0	11.6	1.5	0.067	NA	NA	20m.my8028_rel_native_lto.cy9_1g
33005	0	174	11.4	1040.4	33.5	0.005	0.355	0.032	1.039	9533	8.8	0.289	21	3.0	11.6	1.5	0.176	NA	NA	20m.my8031_rel_native_lto.cy9_1g
33612	0	178	11.6	1056.9	34.1	0.005	0.355	0.031	1.040	9660	9.4	0.287	22	3.0	11.6	1.5	0.109	NA	NA	20m.my8032_rel_native_lto.cy9_1g
l.i1
l.i1: continue load after secondary indexes created
Performance metrics for all DBMS, not just the ones listed above. Some are normalized by throughput, others are not. Legend for results is here.
ips	qps	rps	rmbps	wps	wmbps	rpq	rkbpq	wpi	wkbpi	csps	cpups	cspq	cpupq	dbgb1	dbgb2	rss	maxop	p50	p99	tag
3007	0	0	0.0	1050.8	19.5	0.000	0.000	0.349	6.629	10102	10.5	3.360	279	7.8	16.4	1.5	8.675	600	0	20m.my8022_rel_native_lto.cy9_1g
2747	0	0	0.0	972.4	17.5	0.000	0.000	0.354	6.513	6218	10.4	2.263	303	7.8	16.4	1.5	8.359	600	0	20m.my8028_rel_native_lto.cy9_1g
2720	0	0	0.0	977.5	18.2	0.000	0.001	0.359	6.845	6377	11.1	2.345	326	7.8	16.4	1.5	7.840	599	0	20m.my8031_rel_native_lto.cy9_1g
2721	0	0	0.0	976.6	18.2	0.000	0.001	0.359	6.837	6371	11.1	2.342	326	7.8	16.4	1.5	7.601	599	0	20m.my8032_rel_native_lto.cy9_1g
q100.1
q100.1: range queries with 100 insert/s per client
Performance metrics for all DBMS, not just the ones listed above. Some are normalized by throughput, others are not. Legend for results is here.
ips	qps	rps	rmbps	wps	wmbps	rpq	rkbpq	wpi	wkbpi	csps	cpups	cspq	cpupq	dbgb1	dbgb2	rss	maxop	p50	p99	tag
395	57	7	0.1	1148.9	15.4	0.118	1.964	2.906	39.874	10832	4.5	189.045	6283	8.4	17.0	1.5	0.928	16	0	20m.my8022_rel_native_lto.cy9_1g
390	52	9	0.1	1121.3	14.7	0.167	2.776	2.872	38.477	7286	4.7	140.920	7272	8.4	17.0	1.5	1.705	16	0	20m.my8028_rel_native_lto.cy9_1g
394	52	10	0.2	1125.3	14.9	0.194	3.008	2.856	38.671	7479	4.9	144.374	7568	8.4	17.0	1.5	1.958	16	0	20m.my8031_rel_native_lto.cy9_1g
390	52	10	0.2	1124.0	14.9	0.202	3.125	2.885	39.042	7463	4.9	144.625	7597	8.4	17.0	1.5	1.516	16	0	20m.my8032_rel_native_lto.cy9_1g
q500.1
q500.1: range queries with 500 insert/s per client
Performance metrics for all DBMS, not just the ones listed above. Some are normalized by throughput, others are not. Legend for results is here.
ips	qps	rps	rmbps	wps	wmbps	rpq	rkbpq	wpi	wkbpi	csps	cpups	cspq	cpupq	dbgb1	dbgb2	rss	maxop	p50	p99	tag
920	45	5	0.1	1139.4	15.7	0.108	1.942	1.238	17.457	10839	5.5	240.327	9756	9.5	18.0	1.5	1.688	16	0	20m.my8022_rel_native_lto.cy9_1g
864	41	7	0.1	1093.7	14.6	0.162	2.867	1.266	17.360	7219	5.7	174.789	11041	9.4	18.0	1.5	1.521	16	0	20m.my8028_rel_native_lto.cy9_1g
822	40	8	0.1	1056.2	14.4	0.188	3.150	1.286	17.908	7143	5.9	177.685	11741	9.4	18.0	1.5	1.804	16	0	20m.my8031_rel_native_lto.cy9_1g
815	40	8	0.1	1042.3	14.2	0.195	3.202	1.279	17.826	7056	5.9	177.281	11859	9.4	18.0	1.5	2.255	16	0	20m.my8032_rel_native_lto.cy9_1g
q1000.1
q1000.1: range queries with 1000 insert/s per client
Performance metrics for all DBMS, not just the ones listed above. Some are normalized by throughput, others are not. Legend for results is here.
ips	qps	rps	rmbps	wps	wmbps	rpq	rkbpq	wpi	wkbpi	csps	cpups	cspq	cpupq	dbgb1	dbgb2	rss	maxop	p50	p99	tag
726	29	2	0.0	756.6	10.8	0.062	1.121	1.042	15.157	5615	4.4	195.644	12265	10.0	18.6	1.5	2.727	0	0	20m.my8022_rel_native_lto.cy9_1g
702	26	3	0.1	722.5	9.9	0.123	2.178	1.029	14.504	4909	4.5	192.508	14117	10.0	18.6	1.4	3.071	0	0	20m.my8028_rel_native_lto.cy9_1g
681	26	4	0.1	714.4	10.0	0.167	2.883	1.048	15.054	5022	4.8	196.943	15059	10.0	18.6	1.4	2.911	0	0	20m.my8031_rel_native_lto.cy9_1g
689	25	4	0.1	716.5	10.0	0.173	2.991	1.040	14.915	5038	4.8	199.126	15178	10.0	18.6	1.4	2.805	0	0	20m.my8032_rel_native_lto.cy9_1g
l.i0
- l.i0: load without secondary indexes
- Legend for results is here.
- Each entry lists the percentage of responses that fit in that bucket (slower than max time for previous bucket, faster than min time for next bucket).
Insert response time histogram
256us	1ms	4ms	16ms	64ms	256ms	1s	4s	16s	gt	max	tag
0.000	0.000	98.133	1.395	0.445	0.026	0.000	0.000	0.000	0.000	0.145	my8022_rel_native_lto.cy9_1g
0.000	0.000	98.527	1.230	0.215	0.028	0.000	0.000	0.000	0.000	0.171	my8028_rel_native_lto.cy9_1g
0.000	0.000	98.093	1.511	0.367	0.029	0.000	0.000	0.000	0.000	0.156	my8031_rel_native_lto.cy9_1g
0.000	0.000	98.221	1.407	0.348	0.024	0.000	0.000	0.000	0.000	0.134	my8032_rel_native_lto.cy9_1g
l.x
- l.x: create secondary indexes
- Legend for results is here.
- Each entry lists the percentage of responses that fit in that bucket (slower than max time for previous bucket, faster than min time for next bucket).
TODO - determine whether there is data for create index response time
l.i1
- l.i1: continue load after secondary indexes created
- Legend for results is here.
- Each entry lists the percentage of responses that fit in that bucket (slower than max time for previous bucket, faster than min time for next bucket).
Insert response time histogram
256us	1ms	4ms	16ms	64ms	256ms	1s	4s	16s	gt	max	tag
0.000	0.000	0.164	23.970	39.358	34.927	1.372	0.183	0.026	0.000	8.675	my8022_rel_native_lto.cy9_1g
0.000	0.000	0.083	18.202	41.086	38.687	1.737	0.175	0.030	0.000	8.359	my8028_rel_native_lto.cy9_1g
0.000	0.000	0.032	19.195	39.892	38.727	1.943	0.182	0.029	0.000	7.840	my8031_rel_native_lto.cy9_1g
0.000	0.000	0.024	19.519	39.928	38.296	2.022	0.182	0.029	0.000	7.601	my8032_rel_native_lto.cy9_1g
q100.1
- q100.1: range queries with 100 insert/s per client
- Legend for results is here.
- Each entry lists the percentage of responses that fit in that bucket (slower than max time for previous bucket, faster than min time for next bucket).
Query response time histogram
256us	1ms	4ms	16ms	64ms	256ms	1s	4s	16s	gt	max	tag
0.002	12.479	3.837	8.888	35.083	37.113	2.599	0.000	0.000	0.000	0.928	my8022_rel_native_lto.cy9_1g
0.003	11.239	2.980	7.970	34.181	40.190	3.432	0.004	0.000	0.000	1.705	my8028_rel_native_lto.cy9_1g
0.001	10.760	3.322	7.495	34.154	40.941	3.322	0.004	0.000	0.000	1.958	my8031_rel_native_lto.cy9_1g
0.000	10.999	3.704	7.575	33.813	40.556	3.349	0.004	0.000	0.000	1.516	my8032_rel_native_lto.cy9_1g
Insert response time histogram
256us	1ms	4ms	16ms	64ms	256ms	1s	4s	16s	gt	max	tag
0.000	0.000	0.000	0.236	1.764	31.153	64.486	2.361	0.000	0.000	1.722	my8022_rel_native_lto.cy9_1g
0.000	0.000	0.007	0.188	1.472	31.042	63.472	3.819	0.000	0.000	2.223	my8028_rel_native_lto.cy9_1g
0.000	0.000	0.000	0.250	1.410	30.444	64.715	3.181	0.000	0.000	2.190	my8031_rel_native_lto.cy9_1g
0.000	0.000	0.000	0.250	1.472	30.194	64.319	3.764	0.000	0.000	2.361	my8032_rel_native_lto.cy9_1g
q500.1
- q500.1: range queries with 500 insert/s per client
- Legend for results is here.
- Each entry lists the percentage of responses that fit in that bucket (slower than max time for previous bucket, faster than min time for next bucket).
Query response time histogram
256us	1ms	4ms	16ms	64ms	256ms	1s	4s	16s	gt	max	tag
0.002	8.054	3.718	6.849	32.270	44.149	4.953	0.005	0.000	0.000	1.688	my8022_rel_native_lto.cy9_1g
0.001	7.663	3.119	6.196	30.676	45.849	6.487	0.011	0.000	0.000	1.521	my8028_rel_native_lto.cy9_1g
0.000	7.248	3.636	6.152	30.114	45.625	7.200	0.025	0.000	0.000	1.804	my8031_rel_native_lto.cy9_1g
0.001	7.274	3.752	6.099	29.644	45.800	7.405	0.026	0.000	0.000	2.255	my8032_rel_native_lto.cy9_1g
Insert response time histogram
256us	1ms	4ms	16ms	64ms	256ms	1s	4s	16s	gt	max	tag
0.000	0.000	0.007	2.126	8.885	58.833	30.010	0.139	0.000	0.000	2.197	my8022_rel_native_lto.cy9_1g
0.000	0.000	0.004	1.931	9.361	56.069	32.149	0.486	0.000	0.000	1.755	my8028_rel_native_lto.cy9_1g
0.000	0.000	0.000	1.717	8.447	54.721	34.513	0.603	0.000	0.000	3.191	my8031_rel_native_lto.cy9_1g
0.000	0.000	0.003	1.801	7.972	54.844	34.675	0.704	0.000	0.000	2.429	my8032_rel_native_lto.cy9_1g
q1000.1
- q1000.1: range queries with 1000 insert/s per client
- Legend for results is here.
- Each entry lists the percentage of responses that fit in that bucket (slower than max time for previous bucket, faster than min time for next bucket).
Query response time histogram
256us	1ms	4ms	16ms	64ms	256ms	1s	4s	16s	gt	max	tag
0.001	7.034	3.756	5.134	22.464	44.055	17.508	0.049	0.000	0.000	2.727	my8022_rel_native_lto.cy9_1g
0.000	6.188	3.101	4.823	21.088	43.925	20.672	0.202	0.000	0.000	3.071	my8028_rel_native_lto.cy9_1g
0.000	5.954	3.536	4.881	21.441	43.382	20.611	0.196	0.000	0.000	2.911	my8031_rel_native_lto.cy9_1g
0.000	5.776	3.538	4.805	21.000	43.917	20.743	0.222	0.000	0.000	2.805	my8032_rel_native_lto.cy9_1g
Insert response time histogram
256us	1ms	4ms	16ms	64ms	256ms	1s	4s	16s	gt	max	tag
0.000	0.000	0.007	4.298	4.597	44.341	46.415	0.342	0.000	0.000	2.714	my8022_rel_native_lto.cy9_1g
0.000	0.000	0.003	3.545	5.970	45.978	43.019	1.485	0.000	0.000	3.039	my8028_rel_native_lto.cy9_1g
0.000	0.000	0.001	3.568	5.683	45.146	44.061	1.542	0.000	0.000	3.582	my8031_rel_native_lto.cy9_1g
0.000	0.000	0.001	3.581	5.759	45.425	43.694	1.541	0.000	0.000	2.760	my8032_rel_native_lto.cy9_1g