Introduction
This is a report for the insert benchmark with 20M docs and 4 client(s). It is generated by scripts (bash, awk, sed) and Tufte might not be impressed. An overview of the insert benchmark is here and a short update is here. Below, by DBMS, I mean DBMS+version.config. An example is my8020.c10b40 where my means MySQL, 8020 is version 8.0.20 and c10b40 is the name for the configuration file.
The test server has 8 AMD cores, 16G RAM and an NVMe SSD. It is described here as the Beelink. The benchmark was run with 4 clients and there were 1 or 2 connections per client (1 for queries, 1 for inserts). The benchmark loads 20M rows without secondary indexes, creates secondary indexes, loads another 20M rows then does 3 read+write tests for one hour each that do queries as fast as possible with 100, 500 and then 1000 writes/second/client concurrent with the queries. There is 1 table. The database is cached by the storage engine and the only IO is for writes. Clients and the DBMS share one server. The per-database configs are in the per-database subdirectories here.
The tested DBMS are:
- my5651_rel.cy8 - InnoDB and MySQL 5.6.51, the cy8 config and compiled with CMAKE_BUILD_TYPE=Release -O3
- my5740_rel_native_lto.cy8 - InnoDB and MySQL 5.7.40, the cy8 config and compiled with CMAKE_BUILD_TYPE=Release -O3 -flto
- my8022_rel_native_lto.cy9 - InnoDB and MySQL 8.0.22, the cy9 config and compiled with CMAKE_BUILD_TYPE=Release -O3 -flto
- my8028_rel_native_lto.cy9 - InnoDB and MySQL 8.0.28, the cy9 config and compiled with CMAKE_BUILD_TYPE=Release -O3 -flto
- my8031_rel_native_lto.cy9 - InnoDB and MySQL 8.0.31, the cy9 config and compiled with CMAKE_BUILD_TYPE=Release -O3 -flto
- my8032_rel_native_lto.cy9 - InnoDB and MySQL 8.0.32, the cy9 config and compiled with CMAKE_BUILD_TYPE=Release -O3 -flto
Contents
- Summary
- l.i0: load without secondary indexes
- l.x: create secondary indexes
- l.i1: continue load after secondary indexes created
- q100.1: range queries with 100 insert/s per client
- q500.1: range queries with 500 insert/s per client
- q1000.1: range queries with 1000 insert/s per client
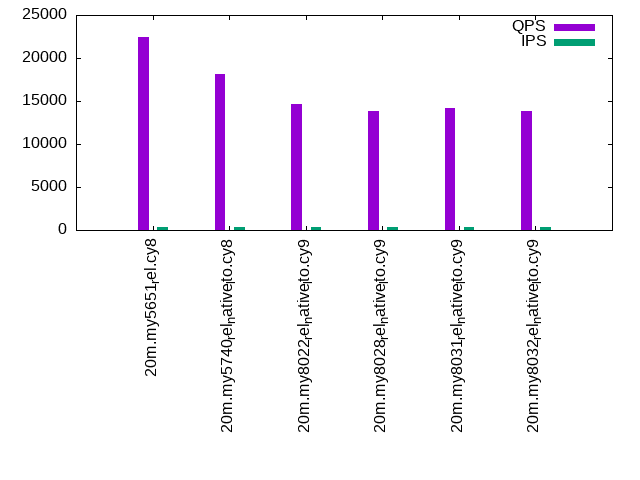
Summary
The numbers are inserts/s for l.i0 and l.i1, indexed docs (or rows) /s for l.x and queries/s for q*.2. The values are the average rate over the entire test for inserts (IPS) and queries (QPS). The range of values for IPS and QPS is split into 3 parts: bottom 25%, middle 50%, top 25%. Values in the bottom 25% have a red background, values in the top 25% have a green background and values in the middle have no color. A gray background is used for values that can be ignored because the DBMS did not sustain the target insert rate. Red backgrounds are not used when the minimum value is within 80% of the max value.
| dbms | l.i0 | l.x | l.i1 | q100.1 | q500.1 | q1000.1 |
|---|---|---|---|---|---|---|
| 20m.my5651_rel.cy8 | 190476 | 116185 | 85470 | 22438 | 22194 | 22350 |
| 20m.my5740_rel_native_lto.cy8 | 168067 | 146715 | 74074 | 18140 | 18109 | 18019 |
| 20m.my8022_rel_native_lto.cy9 | 132450 | 128025 | 63291 | 14645 | 14606 | 14554 |
| 20m.my8028_rel_native_lto.cy9 | 142857 | 166116 | 72202 | 13780 | 13906 | 13676 |
| 20m.my8031_rel_native_lto.cy9 | 131579 | 159524 | 65359 | 14173 | 14182 | 13910 |
| 20m.my8032_rel_native_lto.cy9 | 126582 | 189623 | 64102 | 13814 | 13732 | 13765 |
This table has relative throughput, throughput for the DBMS relative to the DBMS in the first line, using the absolute throughput from the previous table.
| dbms | l.i0 | l.x | l.i1 | q100.1 | q500.1 | q1000.1 |
|---|---|---|---|---|---|---|
| 20m.my5651_rel.cy8 | 1.00 | 1.00 | 1.00 | 1.00 | 1.00 | 1.00 |
| 20m.my5740_rel_native_lto.cy8 | 0.88 | 1.26 | 0.87 | 0.81 | 0.82 | 0.81 |
| 20m.my8022_rel_native_lto.cy9 | 0.70 | 1.10 | 0.74 | 0.65 | 0.66 | 0.65 |
| 20m.my8028_rel_native_lto.cy9 | 0.75 | 1.43 | 0.84 | 0.61 | 0.63 | 0.61 |
| 20m.my8031_rel_native_lto.cy9 | 0.69 | 1.37 | 0.76 | 0.63 | 0.64 | 0.62 |
| 20m.my8032_rel_native_lto.cy9 | 0.66 | 1.63 | 0.75 | 0.62 | 0.62 | 0.62 |
This lists the average rate of inserts/s for the tests that do inserts concurrent with queries. For such tests the query rate is listed in the table above. The read+write tests are setup so that the insert rate should match the target rate every second. Cells that are not at least 95% of the target have a red background to indicate a failure to satisfy the target.
| dbms | q100.1 | q500.1 | q1000.1 |
|---|---|---|---|
| my5651_rel.cy8 | 399 | 1993 | 3989 |
| my5740_rel_native_lto.cy8 | 399 | 1994 | 3989 |
| my8022_rel_native_lto.cy9 | 399 | 1994 | 3989 |
| my8028_rel_native_lto.cy9 | 399 | 1994 | 3989 |
| my8031_rel_native_lto.cy9 | 399 | 1993 | 3989 |
| my8032_rel_native_lto.cy9 | 399 | 1994 | 3989 |
| target | 400 | 2000 | 4000 |
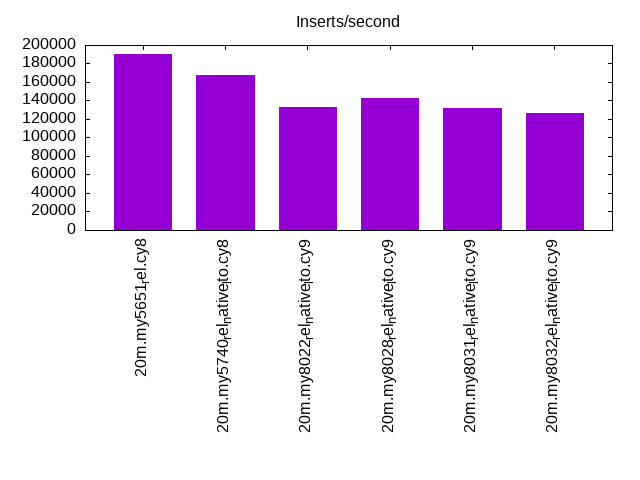
l.i0
l.i0: load without secondary indexes. Graphs for performance per 1-second interval are here.
Average throughput:
Insert response time histogram: each cell has the percentage of responses that take <= the time in the header and max is the max response time in seconds. For the max column values in the top 25% of the range have a red background and in the bottom 25% of the range have a green background. The red background is not used when the min value is within 80% of the max value.
| dbms | 256us | 1ms | 4ms | 16ms | 64ms | 256ms | 1s | 4s | 16s | gt | max |
|---|---|---|---|---|---|---|---|---|---|---|---|
| my5651_rel.cy8 | 6.710 | 92.888 | 0.221 | 0.168 | 0.013 | 0.192 | |||||
| my5740_rel_native_lto.cy8 | 0.533 | 97.984 | 0.607 | 0.862 | 0.013 | 0.112 | |||||
| my8022_rel_native_lto.cy9 | 98.284 | 0.485 | 1.217 | 0.014 | 0.116 | ||||||
| my8028_rel_native_lto.cy9 | 98.202 | 0.857 | 0.923 | 0.017 | 0.116 | ||||||
| my8031_rel_native_lto.cy9 | 98.024 | 1.011 | 0.951 | 0.013 | 0.119 | ||||||
| my8032_rel_native_lto.cy9 | 97.864 | 1.192 | 0.928 | 0.015 | 0.121 |
Performance metrics for the DBMS listed above. Some are normalized by throughput, others are not. Legend for results is here.
ips	qps	rps	rmbps	wps	wmbps	rpq	rkbpq	wpi	wkbpi	csps	cpups	cspq	cpupq	dbgb1	dbgb2	rss	maxop	p50	p99	tag
190476	0	1552	6.1	141.8	60.8	0.008	0.033	0.001	0.327	21358	62.0	0.112	26	2.5	43.0	2.9	0.192	52262	16182	20m.my5651_rel.cy8
168067	0	0	0.0	322.9	59.7	0.000	0.000	0.002	0.364	16625	60.4	0.099	29	2.4	42.9	3.1	0.112	45351	6593	20m.my5740_rel_native_lto.cy8
132450	0	0	0.0	466.1	53.0	0.000	0.000	0.004	0.410	13687	57.2	0.103	35	2.4	11.0	3.3	0.116	35273	10588	20m.my8022_rel_native_lto.cy9
142857	0	0	0.0	474.2	56.1	0.000	0.000	0.003	0.402	14852	59.5	0.104	33	2.4	10.9	3.2	0.116	38458	32664	20m.my8028_rel_native_lto.cy9
131579	0	0	0.0	447.9	52.9	0.000	0.000	0.003	0.411	13865	58.3	0.105	35	2.4	10.9	3.3	0.119	35376	28369	20m.my8031_rel_native_lto.cy9
126582	0	0	0.0	443.4	51.4	0.000	0.000	0.004	0.416	13463	58.4	0.106	37	2.4	11.0	3.3	0.121	34063	28879	20m.my8032_rel_native_lto.cy9
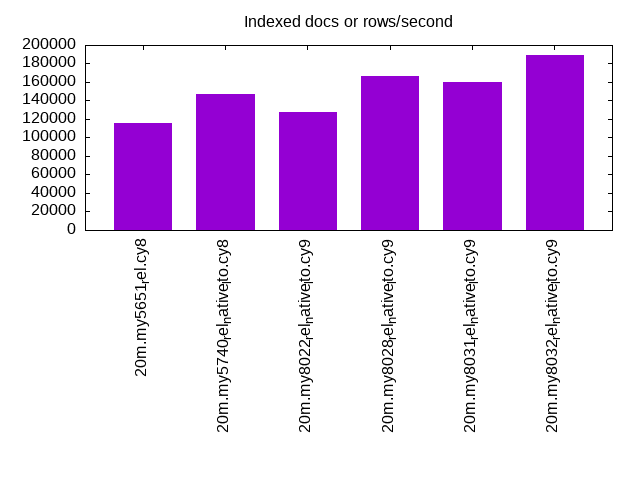
l.x
l.x: create secondary indexes.
Average throughput:
Performance metrics for the DBMS listed above. Some are normalized by throughput, others are not. Legend for results is here.
ips	qps	rps	rmbps	wps	wmbps	rpq	rkbpq	wpi	wkbpi	csps	cpups	cspq	cpupq	dbgb1	dbgb2	rss	maxop	p50	p99	tag
116185	0	18	0.1	1642.2	129.6	0.000	0.001	0.014	1.142	4894	11.9	0.042	8	3.9	44.4	4.3	0.009	NA	NA	20m.my5651_rel.cy8
146715	0	0	0.0	1976.5	138.2	0.000	0.000	0.013	0.965	10320	13.0	0.070	7	4.0	44.5	4.5	0.019	NA	NA	20m.my5740_rel_native_lto.cy8
128025	0	0	0.0	1382.0	106.0	0.000	0.000	0.011	0.848	7380	12.4	0.058	8	4.0	12.6	3.8	0.024	NA	NA	20m.my8022_rel_native_lto.cy9
166116	0	863	57.8	3439.5	176.2	0.005	0.356	0.021	1.086	11790	42.5	0.071	20	4.0	12.6	4.1	0.010	NA	NA	20m.my8028_rel_native_lto.cy9
159524	0	830	55.5	3115.0	166.3	0.005	0.356	0.020	1.068	11364	42.6	0.071	21	4.0	12.6	4.5	0.017	NA	NA	20m.my8031_rel_native_lto.cy9
189623	0	987	66.0	3543.6	194.0	0.005	0.357	0.019	1.048	12982	41.0	0.068	17	4.0	12.6	4.6	0.010	NA	NA	20m.my8032_rel_native_lto.cy9
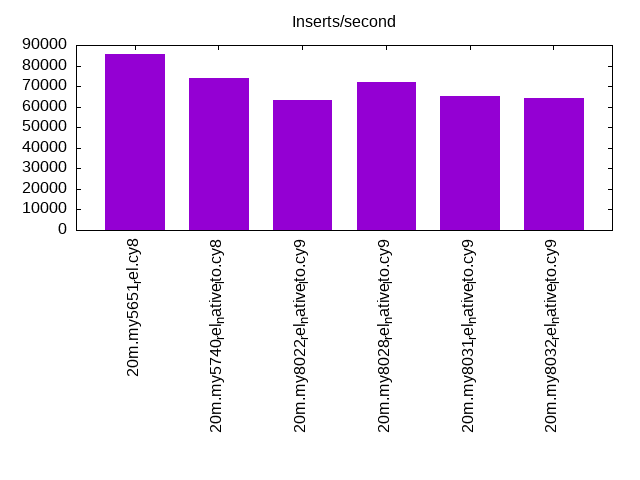
l.i1
l.i1: continue load after secondary indexes created. Graphs for performance per 1-second interval are here.
Average throughput:
Insert response time histogram: each cell has the percentage of responses that take <= the time in the header and max is the max response time in seconds. For the max column values in the top 25% of the range have a red background and in the bottom 25% of the range have a green background. The red background is not used when the min value is within 80% of the max value.
| dbms | 256us | 1ms | 4ms | 16ms | 64ms | 256ms | 1s | 4s | 16s | gt | max |
|---|---|---|---|---|---|---|---|---|---|---|---|
| my5651_rel.cy8 | 98.425 | 1.210 | 0.360 | 0.006 | 0.108 | ||||||
| my5740_rel_native_lto.cy8 | 96.942 | 2.211 | 0.842 | 0.006 | 0.108 | ||||||
| my8022_rel_native_lto.cy9 | 97.247 | 1.276 | 1.315 | 0.162 | 0.247 | ||||||
| my8028_rel_native_lto.cy9 | 97.232 | 1.896 | 0.859 | 0.014 | 0.115 | ||||||
| my8031_rel_native_lto.cy9 | 96.827 | 2.266 | 0.885 | 0.022 | 0.104 | ||||||
| my8032_rel_native_lto.cy9 | 96.707 | 2.365 | 0.895 | 0.033 | 0.104 |
Performance metrics for the DBMS listed above. Some are normalized by throughput, others are not. Legend for results is here.
ips	qps	rps	rmbps	wps	wmbps	rpq	rkbpq	wpi	wkbpi	csps	cpups	cspq	cpupq	dbgb1	dbgb2	rss	maxop	p50	p99	tag
85470	0	1304	5.1	215.9	63.5	0.015	0.061	0.003	0.761	20879	59.1	0.244	55	10.4	50.9	9.8	0.108	22544	1948	20m.my5651_rel.cy8
74074	0	0	0.0	1008.4	77.7	0.000	0.000	0.014	1.074	17536	56.3	0.237	61	10.2	50.7	9.8	0.108	19278	1099	20m.my5740_rel_native_lto.cy8
63291	0	293	4.6	1519.7	79.6	0.005	0.074	0.024	1.287	16499	51.4	0.261	65	10.1	18.7	10.0	0.247	17480	300	20m.my8022_rel_native_lto.cy9
72202	0	335	5.2	1638.2	87.8	0.005	0.074	0.023	1.246	19879	56.2	0.275	62	10.1	18.7	9.9	0.115	18879	899	20m.my8028_rel_native_lto.cy9
65359	0	302	4.7	1865.3	95.2	0.005	0.074	0.029	1.492	19235	55.4	0.294	68	10.1	18.7	10.0	0.104	17130	849	20m.my8031_rel_native_lto.cy9
64102	0	297	4.6	1847.1	93.9	0.005	0.074	0.029	1.500	19121	55.6	0.298	69	10.1	18.7	10.0	0.104	16981	800	20m.my8032_rel_native_lto.cy9
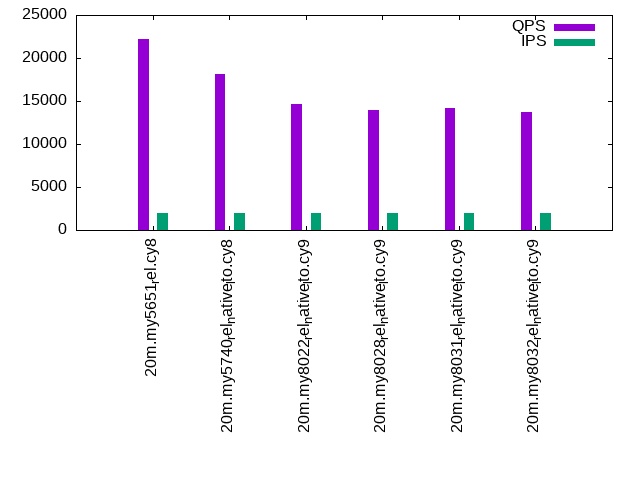
q100.1
q100.1: range queries with 100 insert/s per client. Graphs for performance per 1-second interval are here.
Average throughput:
Query response time histogram: each cell has the percentage of responses that take <= the time in the header and max is the max response time in seconds. For max values in the top 25% of the range have a red background and in the bottom 25% of the range have a green background. The red background is not used when the min value is within 80% of the max value.
| dbms | 256us | 1ms | 4ms | 16ms | 64ms | 256ms | 1s | 4s | 16s | gt | max |
|---|---|---|---|---|---|---|---|---|---|---|---|
| my5651_rel.cy8 | 95.354 | 4.631 | 0.009 | 0.006 | 0.013 | ||||||
| my5740_rel_native_lto.cy8 | 82.226 | 17.770 | 0.003 | 0.001 | nonzero | 0.021 | |||||
| my8022_rel_native_lto.cy9 | 54.529 | 45.465 | 0.005 | nonzero | 0.001 | 0.030 | |||||
| my8028_rel_native_lto.cy9 | 46.721 | 53.273 | 0.005 | 0.001 | nonzero | 0.021 | |||||
| my8031_rel_native_lto.cy9 | 51.317 | 48.677 | 0.005 | 0.001 | nonzero | 0.022 | |||||
| my8032_rel_native_lto.cy9 | 47.113 | 52.881 | 0.005 | 0.001 | nonzero | 0.021 |
Insert response time histogram: each cell has the percentage of responses that take <= the time in the header and max is the max response time in seconds. For max values in the top 25% of the range have a red background and in the bottom 25% of the range have a green background. The red background is not used when the min value is within 80% of the max value.
| dbms | 256us | 1ms | 4ms | 16ms | 64ms | 256ms | 1s | 4s | 16s | gt | max |
|---|---|---|---|---|---|---|---|---|---|---|---|
| my5651_rel.cy8 | 88.618 | 11.368 | 0.014 | 0.020 | |||||||
| my5740_rel_native_lto.cy8 | 98.486 | 1.000 | 0.514 | 0.025 | |||||||
| my8022_rel_native_lto.cy9 | 98.201 | 0.917 | 0.882 | 0.039 | |||||||
| my8028_rel_native_lto.cy9 | 98.340 | 0.986 | 0.674 | 0.034 | |||||||
| my8031_rel_native_lto.cy9 | 98.479 | 0.819 | 0.701 | 0.030 | |||||||
| my8032_rel_native_lto.cy9 | 98.347 | 1.076 | 0.576 | 0.029 |
Performance metrics for the DBMS listed above. Some are normalized by throughput, others are not. Legend for results is here.
ips	qps	rps	rmbps	wps	wmbps	rpq	rkbpq	wpi	wkbpi	csps	cpups	cspq	cpupq	dbgb1	dbgb2	rss	maxop	p50	p99	tag
399	22438	7	0.0	175.0	5.5	0.000	0.001	0.439	14.175	86008	50.0	3.833	178	10.8	51.3	10.1	0.013	5562	5098	20m.my5651_rel.cy8
399	18140	0	0.0	74.4	2.3	0.000	0.000	0.187	5.967	69403	51.0	3.826	225	10.5	51.1	10.1	0.021	4443	3820	20m.my5740_rel_native_lto.cy8
399	14645	0	0.0	229.5	6.0	0.000	0.000	0.576	15.398	56253	50.3	3.841	275	10.5	19.1	10.3	0.030	3628	3212	20m.my8022_rel_native_lto.cy9
399	13780	0	0.0	240.4	6.2	0.000	0.000	0.603	15.896	53178	50.3	3.859	292	10.5	19.0	10.3	0.021	3420	3053	20m.my8028_rel_native_lto.cy9
399	14173	0	0.0	233.5	6.1	0.000	0.000	0.585	15.657	54856	50.0	3.870	282	10.5	19.1	10.3	0.022	3614	2941	20m.my8031_rel_native_lto.cy9
399	13814	0	0.0	236.8	6.2	0.000	0.000	0.594	15.882	53470	50.0	3.871	290	10.5	19.1	10.3	0.021	3468	2814	20m.my8032_rel_native_lto.cy9
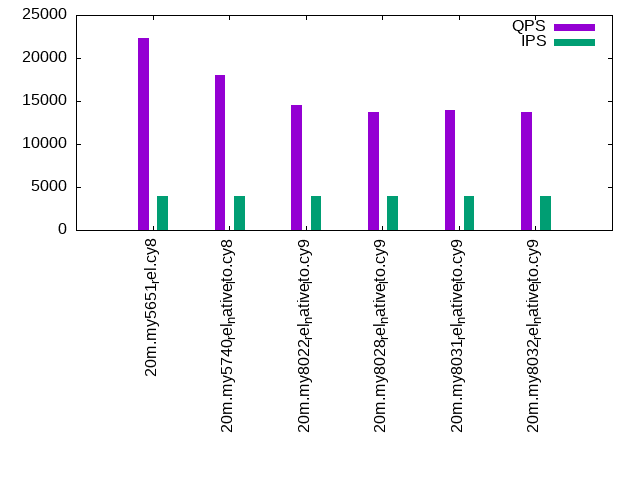
q500.1
q500.1: range queries with 500 insert/s per client. Graphs for performance per 1-second interval are here.
Average throughput:
Query response time histogram: each cell has the percentage of responses that take <= the time in the header and max is the max response time in seconds. For max values in the top 25% of the range have a red background and in the bottom 25% of the range have a green background. The red background is not used when the min value is within 80% of the max value.
| dbms | 256us | 1ms | 4ms | 16ms | 64ms | 256ms | 1s | 4s | 16s | gt | max |
|---|---|---|---|---|---|---|---|---|---|---|---|
| my5651_rel.cy8 | 94.935 | 5.033 | 0.023 | 0.009 | 0.012 | ||||||
| my5740_rel_native_lto.cy8 | 82.612 | 17.374 | 0.011 | 0.001 | 0.001 | 0.023 | |||||
| my8022_rel_native_lto.cy9 | 54.701 | 45.279 | 0.016 | 0.002 | 0.001 | 0.032 | |||||
| my8028_rel_native_lto.cy9 | 48.002 | 51.978 | 0.018 | 0.002 | 0.001 | 0.026 | |||||
| my8031_rel_native_lto.cy9 | 51.351 | 48.630 | 0.017 | 0.002 | nonzero | 0.022 | |||||
| my8032_rel_native_lto.cy9 | 45.772 | 54.209 | 0.016 | 0.003 | 0.001 | 0.023 |
Insert response time histogram: each cell has the percentage of responses that take <= the time in the header and max is the max response time in seconds. For max values in the top 25% of the range have a red background and in the bottom 25% of the range have a green background. The red background is not used when the min value is within 80% of the max value.
| dbms | 256us | 1ms | 4ms | 16ms | 64ms | 256ms | 1s | 4s | 16s | gt | max |
|---|---|---|---|---|---|---|---|---|---|---|---|
| my5651_rel.cy8 | 96.213 | 3.775 | 0.013 | 0.038 | |||||||
| my5740_rel_native_lto.cy8 | 98.647 | 0.924 | 0.429 | 0.047 | |||||||
| my8022_rel_native_lto.cy9 | 95.453 | 3.592 | 0.922 | 0.033 | 0.106 | ||||||
| my8028_rel_native_lto.cy9 | 96.568 | 2.772 | 0.633 | 0.026 | 0.113 | ||||||
| my8031_rel_native_lto.cy9 | 97.493 | 2.056 | 0.438 | 0.014 | 0.103 | ||||||
| my8032_rel_native_lto.cy9 | 95.810 | 3.501 | 0.676 | 0.013 | 0.103 |
Performance metrics for the DBMS listed above. Some are normalized by throughput, others are not. Legend for results is here.
ips	qps	rps	rmbps	wps	wmbps	rpq	rkbpq	wpi	wkbpi	csps	cpups	cspq	cpupq	dbgb1	dbgb2	rss	maxop	p50	p99	tag
1993	22194	34	0.1	12.8	1.4	0.002	0.006	0.006	0.731	84290	50.7	3.798	183	11.7	52.2	10.6	0.012	5514	5034	20m.my5651_rel.cy8
1994	18109	0	0.0	69.3	2.9	0.000	0.000	0.035	1.474	68835	51.7	3.801	228	11.4	51.9	10.8	0.023	4555	3917	20m.my5740_rel_native_lto.cy8
1994	14606	0	0.0	182.4	5.6	0.000	0.000	0.091	2.878	55533	51.2	3.802	280	11.4	20.0	11.1	0.032	3628	3214	20m.my8022_rel_native_lto.cy9
1994	13906	0	0.0	214.3	6.4	0.000	0.000	0.107	3.275	53140	51.3	3.821	295	11.4	19.9	11.0	0.026	3452	3053	20m.my8028_rel_native_lto.cy9
1993	14182	0	0.0	221.3	6.7	0.000	0.000	0.111	3.423	54456	51.0	3.840	288	11.3	19.9	10.9	0.022	3582	2942	20m.my8031_rel_native_lto.cy9
1994	13732	0	0.0	224.1	6.8	0.000	0.000	0.112	3.477	52655	51.1	3.835	298	11.4	20.0	10.9	0.023	3404	2781	20m.my8032_rel_native_lto.cy9
q1000.1
q1000.1: range queries with 1000 insert/s per client. Graphs for performance per 1-second interval are here.
Average throughput:
Query response time histogram: each cell has the percentage of responses that take <= the time in the header and max is the max response time in seconds. For max values in the top 25% of the range have a red background and in the bottom 25% of the range have a green background. The red background is not used when the min value is within 80% of the max value.
| dbms | 256us | 1ms | 4ms | 16ms | 64ms | 256ms | 1s | 4s | 16s | gt | max |
|---|---|---|---|---|---|---|---|---|---|---|---|
| my5651_rel.cy8 | 95.003 | 4.962 | 0.027 | 0.008 | 0.014 | ||||||
| my5740_rel_native_lto.cy8 | 82.806 | 17.160 | 0.030 | 0.004 | nonzero | 0.026 | |||||
| my8022_rel_native_lto.cy9 | 55.126 | 44.834 | 0.034 | 0.005 | 0.001 | 0.033 | |||||
| my8028_rel_native_lto.cy9 | 45.540 | 54.413 | 0.041 | 0.006 | 0.001 | 0.022 | |||||
| my8031_rel_native_lto.cy9 | 47.252 | 52.713 | 0.030 | 0.005 | 0.001 | 0.025 | |||||
| my8032_rel_native_lto.cy9 | 45.556 | 54.405 | 0.034 | 0.005 | 0.001 | 0.022 |
Insert response time histogram: each cell has the percentage of responses that take <= the time in the header and max is the max response time in seconds. For max values in the top 25% of the range have a red background and in the bottom 25% of the range have a green background. The red background is not used when the min value is within 80% of the max value.
| dbms | 256us | 1ms | 4ms | 16ms | 64ms | 256ms | 1s | 4s | 16s | gt | max |
|---|---|---|---|---|---|---|---|---|---|---|---|
| my5651_rel.cy8 | 97.505 | 2.482 | 0.013 | 0.039 | |||||||
| my5740_rel_native_lto.cy8 | 98.358 | 1.304 | 0.338 | 0.049 | |||||||
| my8022_rel_native_lto.cy9 | 95.903 | 3.419 | 0.663 | 0.015 | 0.110 | ||||||
| my8028_rel_native_lto.cy9 | 96.617 | 2.954 | 0.399 | 0.030 | 0.109 | ||||||
| my8031_rel_native_lto.cy9 | 93.794 | 5.615 | 0.572 | 0.019 | 0.107 | ||||||
| my8032_rel_native_lto.cy9 | 96.369 | 3.216 | 0.406 | 0.009 | 0.105 |
Performance metrics for the DBMS listed above. Some are normalized by throughput, others are not. Legend for results is here.
ips	qps	rps	rmbps	wps	wmbps	rpq	rkbpq	wpi	wkbpi	csps	cpups	cspq	cpupq	dbgb1	dbgb2	rss	maxop	p50	p99	tag
3989	22350	70	0.3	52.4	3.4	0.003	0.014	0.013	0.864	84243	51.6	3.769	185	13.0	53.5	10.6	0.014	5580	5050	20m.my5651_rel.cy8
3989	18019	2	0.0	87.9	4.2	0.000	0.002	0.022	1.090	67761	52.7	3.761	234	12.7	53.3	10.9	0.026	4555	3884	20m.my5740_rel_native_lto.cy8
3989	14554	1	0.0	325.0	10.0	0.000	0.002	0.081	2.568	54743	52.5	3.761	289	12.8	21.4	11.1	0.033	3644	3196	20m.my8022_rel_native_lto.cy9
3989	13676	2	0.0	311.3	9.6	0.000	0.002	0.078	2.469	51758	52.4	3.785	307	12.7	21.3	11.1	0.022	3372	2989	20m.my8028_rel_native_lto.cy9
3989	13910	2	0.0	395.2	12.0	0.000	0.002	0.099	3.080	52858	52.6	3.800	303	12.8	21.3	11.1	0.025	3454	2893	20m.my8031_rel_native_lto.cy9
3989	13765	1	0.0	391.4	11.8	0.000	0.002	0.098	3.036	52304	52.6	3.800	306	12.7	21.3	11.1	0.022	3516	2909	20m.my8032_rel_native_lto.cy9
l.i0
l.i0: load without secondary indexes
Performance metrics for all DBMS, not just the ones listed above. Some are normalized by throughput, others are not. Legend for results is here.
ips	qps	rps	rmbps	wps	wmbps	rpq	rkbpq	wpi	wkbpi	csps	cpups	cspq	cpupq	dbgb1	dbgb2	rss	maxop	p50	p99	tag
190476	0	1552	6.1	141.8	60.8	0.008	0.033	0.001	0.327	21358	62.0	0.112	26	2.5	43.0	2.9	0.192	52262	16182	20m.my5651_rel.cy8
168067	0	0	0.0	322.9	59.7	0.000	0.000	0.002	0.364	16625	60.4	0.099	29	2.4	42.9	3.1	0.112	45351	6593	20m.my5740_rel_native_lto.cy8
132450	0	0	0.0	466.1	53.0	0.000	0.000	0.004	0.410	13687	57.2	0.103	35	2.4	11.0	3.3	0.116	35273	10588	20m.my8022_rel_native_lto.cy9
142857	0	0	0.0	474.2	56.1	0.000	0.000	0.003	0.402	14852	59.5	0.104	33	2.4	10.9	3.2	0.116	38458	32664	20m.my8028_rel_native_lto.cy9
131579	0	0	0.0	447.9	52.9	0.000	0.000	0.003	0.411	13865	58.3	0.105	35	2.4	10.9	3.3	0.119	35376	28369	20m.my8031_rel_native_lto.cy9
126582	0	0	0.0	443.4	51.4	0.000	0.000	0.004	0.416	13463	58.4	0.106	37	2.4	11.0	3.3	0.121	34063	28879	20m.my8032_rel_native_lto.cy9
l.x
l.x: create secondary indexes
Performance metrics for all DBMS, not just the ones listed above. Some are normalized by throughput, others are not. Legend for results is here.
ips	qps	rps	rmbps	wps	wmbps	rpq	rkbpq	wpi	wkbpi	csps	cpups	cspq	cpupq	dbgb1	dbgb2	rss	maxop	p50	p99	tag
116185	0	18	0.1	1642.2	129.6	0.000	0.001	0.014	1.142	4894	11.9	0.042	8	3.9	44.4	4.3	0.009	NA	NA	20m.my5651_rel.cy8
146715	0	0	0.0	1976.5	138.2	0.000	0.000	0.013	0.965	10320	13.0	0.070	7	4.0	44.5	4.5	0.019	NA	NA	20m.my5740_rel_native_lto.cy8
128025	0	0	0.0	1382.0	106.0	0.000	0.000	0.011	0.848	7380	12.4	0.058	8	4.0	12.6	3.8	0.024	NA	NA	20m.my8022_rel_native_lto.cy9
166116	0	863	57.8	3439.5	176.2	0.005	0.356	0.021	1.086	11790	42.5	0.071	20	4.0	12.6	4.1	0.010	NA	NA	20m.my8028_rel_native_lto.cy9
159524	0	830	55.5	3115.0	166.3	0.005	0.356	0.020	1.068	11364	42.6	0.071	21	4.0	12.6	4.5	0.017	NA	NA	20m.my8031_rel_native_lto.cy9
189623	0	987	66.0	3543.6	194.0	0.005	0.357	0.019	1.048	12982	41.0	0.068	17	4.0	12.6	4.6	0.010	NA	NA	20m.my8032_rel_native_lto.cy9
l.i1
l.i1: continue load after secondary indexes created
Performance metrics for all DBMS, not just the ones listed above. Some are normalized by throughput, others are not. Legend for results is here.
ips	qps	rps	rmbps	wps	wmbps	rpq	rkbpq	wpi	wkbpi	csps	cpups	cspq	cpupq	dbgb1	dbgb2	rss	maxop	p50	p99	tag
85470	0	1304	5.1	215.9	63.5	0.015	0.061	0.003	0.761	20879	59.1	0.244	55	10.4	50.9	9.8	0.108	22544	1948	20m.my5651_rel.cy8
74074	0	0	0.0	1008.4	77.7	0.000	0.000	0.014	1.074	17536	56.3	0.237	61	10.2	50.7	9.8	0.108	19278	1099	20m.my5740_rel_native_lto.cy8
63291	0	293	4.6	1519.7	79.6	0.005	0.074	0.024	1.287	16499	51.4	0.261	65	10.1	18.7	10.0	0.247	17480	300	20m.my8022_rel_native_lto.cy9
72202	0	335	5.2	1638.2	87.8	0.005	0.074	0.023	1.246	19879	56.2	0.275	62	10.1	18.7	9.9	0.115	18879	899	20m.my8028_rel_native_lto.cy9
65359	0	302	4.7	1865.3	95.2	0.005	0.074	0.029	1.492	19235	55.4	0.294	68	10.1	18.7	10.0	0.104	17130	849	20m.my8031_rel_native_lto.cy9
64102	0	297	4.6	1847.1	93.9	0.005	0.074	0.029	1.500	19121	55.6	0.298	69	10.1	18.7	10.0	0.104	16981	800	20m.my8032_rel_native_lto.cy9
q100.1
q100.1: range queries with 100 insert/s per client
Performance metrics for all DBMS, not just the ones listed above. Some are normalized by throughput, others are not. Legend for results is here.
ips	qps	rps	rmbps	wps	wmbps	rpq	rkbpq	wpi	wkbpi	csps	cpups	cspq	cpupq	dbgb1	dbgb2	rss	maxop	p50	p99	tag
399	22438	7	0.0	175.0	5.5	0.000	0.001	0.439	14.175	86008	50.0	3.833	178	10.8	51.3	10.1	0.013	5562	5098	20m.my5651_rel.cy8
399	18140	0	0.0	74.4	2.3	0.000	0.000	0.187	5.967	69403	51.0	3.826	225	10.5	51.1	10.1	0.021	4443	3820	20m.my5740_rel_native_lto.cy8
399	14645	0	0.0	229.5	6.0	0.000	0.000	0.576	15.398	56253	50.3	3.841	275	10.5	19.1	10.3	0.030	3628	3212	20m.my8022_rel_native_lto.cy9
399	13780	0	0.0	240.4	6.2	0.000	0.000	0.603	15.896	53178	50.3	3.859	292	10.5	19.0	10.3	0.021	3420	3053	20m.my8028_rel_native_lto.cy9
399	14173	0	0.0	233.5	6.1	0.000	0.000	0.585	15.657	54856	50.0	3.870	282	10.5	19.1	10.3	0.022	3614	2941	20m.my8031_rel_native_lto.cy9
399	13814	0	0.0	236.8	6.2	0.000	0.000	0.594	15.882	53470	50.0	3.871	290	10.5	19.1	10.3	0.021	3468	2814	20m.my8032_rel_native_lto.cy9
q500.1
q500.1: range queries with 500 insert/s per client
Performance metrics for all DBMS, not just the ones listed above. Some are normalized by throughput, others are not. Legend for results is here.
ips	qps	rps	rmbps	wps	wmbps	rpq	rkbpq	wpi	wkbpi	csps	cpups	cspq	cpupq	dbgb1	dbgb2	rss	maxop	p50	p99	tag
1993	22194	34	0.1	12.8	1.4	0.002	0.006	0.006	0.731	84290	50.7	3.798	183	11.7	52.2	10.6	0.012	5514	5034	20m.my5651_rel.cy8
1994	18109	0	0.0	69.3	2.9	0.000	0.000	0.035	1.474	68835	51.7	3.801	228	11.4	51.9	10.8	0.023	4555	3917	20m.my5740_rel_native_lto.cy8
1994	14606	0	0.0	182.4	5.6	0.000	0.000	0.091	2.878	55533	51.2	3.802	280	11.4	20.0	11.1	0.032	3628	3214	20m.my8022_rel_native_lto.cy9
1994	13906	0	0.0	214.3	6.4	0.000	0.000	0.107	3.275	53140	51.3	3.821	295	11.4	19.9	11.0	0.026	3452	3053	20m.my8028_rel_native_lto.cy9
1993	14182	0	0.0	221.3	6.7	0.000	0.000	0.111	3.423	54456	51.0	3.840	288	11.3	19.9	10.9	0.022	3582	2942	20m.my8031_rel_native_lto.cy9
1994	13732	0	0.0	224.1	6.8	0.000	0.000	0.112	3.477	52655	51.1	3.835	298	11.4	20.0	10.9	0.023	3404	2781	20m.my8032_rel_native_lto.cy9
q1000.1
q1000.1: range queries with 1000 insert/s per client
Performance metrics for all DBMS, not just the ones listed above. Some are normalized by throughput, others are not. Legend for results is here.
ips	qps	rps	rmbps	wps	wmbps	rpq	rkbpq	wpi	wkbpi	csps	cpups	cspq	cpupq	dbgb1	dbgb2	rss	maxop	p50	p99	tag
3989	22350	70	0.3	52.4	3.4	0.003	0.014	0.013	0.864	84243	51.6	3.769	185	13.0	53.5	10.6	0.014	5580	5050	20m.my5651_rel.cy8
3989	18019	2	0.0	87.9	4.2	0.000	0.002	0.022	1.090	67761	52.7	3.761	234	12.7	53.3	10.9	0.026	4555	3884	20m.my5740_rel_native_lto.cy8
3989	14554	1	0.0	325.0	10.0	0.000	0.002	0.081	2.568	54743	52.5	3.761	289	12.8	21.4	11.1	0.033	3644	3196	20m.my8022_rel_native_lto.cy9
3989	13676	2	0.0	311.3	9.6	0.000	0.002	0.078	2.469	51758	52.4	3.785	307	12.7	21.3	11.1	0.022	3372	2989	20m.my8028_rel_native_lto.cy9
3989	13910	2	0.0	395.2	12.0	0.000	0.002	0.099	3.080	52858	52.6	3.800	303	12.8	21.3	11.1	0.025	3454	2893	20m.my8031_rel_native_lto.cy9
3989	13765	1	0.0	391.4	11.8	0.000	0.002	0.098	3.036	52304	52.6	3.800	306	12.7	21.3	11.1	0.022	3516	2909	20m.my8032_rel_native_lto.cy9
l.i0
- l.i0: load without secondary indexes
- Legend for results is here.
- Each entry lists the percentage of responses that fit in that bucket (slower than max time for previous bucket, faster than min time for next bucket).
Insert response time histogram
256us	1ms	4ms	16ms	64ms	256ms	1s	4s	16s	gt	max	tag
0.000	6.710	92.888	0.221	0.168	0.013	0.000	0.000	0.000	0.000	0.192	my5651_rel.cy8
0.000	0.533	97.984	0.607	0.862	0.013	0.000	0.000	0.000	0.000	0.112	my5740_rel_native_lto.cy8
0.000	0.000	98.284	0.485	1.217	0.014	0.000	0.000	0.000	0.000	0.116	my8022_rel_native_lto.cy9
0.000	0.000	98.202	0.857	0.923	0.017	0.000	0.000	0.000	0.000	0.116	my8028_rel_native_lto.cy9
0.000	0.000	98.024	1.011	0.951	0.013	0.000	0.000	0.000	0.000	0.119	my8031_rel_native_lto.cy9
0.000	0.000	97.864	1.192	0.928	0.015	0.000	0.000	0.000	0.000	0.121	my8032_rel_native_lto.cy9
l.x
- l.x: create secondary indexes
- Legend for results is here.
- Each entry lists the percentage of responses that fit in that bucket (slower than max time for previous bucket, faster than min time for next bucket).
TODO - determine whether there is data for create index response time
l.i1
- l.i1: continue load after secondary indexes created
- Legend for results is here.
- Each entry lists the percentage of responses that fit in that bucket (slower than max time for previous bucket, faster than min time for next bucket).
Insert response time histogram
256us	1ms	4ms	16ms	64ms	256ms	1s	4s	16s	gt	max	tag
0.000	0.000	98.425	1.210	0.360	0.006	0.000	0.000	0.000	0.000	0.108	my5651_rel.cy8
0.000	0.000	96.942	2.211	0.842	0.006	0.000	0.000	0.000	0.000	0.108	my5740_rel_native_lto.cy8
0.000	0.000	97.247	1.276	1.315	0.162	0.000	0.000	0.000	0.000	0.247	my8022_rel_native_lto.cy9
0.000	0.000	97.232	1.896	0.859	0.014	0.000	0.000	0.000	0.000	0.115	my8028_rel_native_lto.cy9
0.000	0.000	96.827	2.266	0.885	0.022	0.000	0.000	0.000	0.000	0.104	my8031_rel_native_lto.cy9
0.000	0.000	96.707	2.365	0.895	0.033	0.000	0.000	0.000	0.000	0.104	my8032_rel_native_lto.cy9
q100.1
- q100.1: range queries with 100 insert/s per client
- Legend for results is here.
- Each entry lists the percentage of responses that fit in that bucket (slower than max time for previous bucket, faster than min time for next bucket).
Query response time histogram
256us	1ms	4ms	16ms	64ms	256ms	1s	4s	16s	gt	max	tag
95.354	4.631	0.009	0.006	0.000	0.000	0.000	0.000	0.000	0.000	0.013	my5651_rel.cy8
82.226	17.770	0.003	0.001	nonzero	0.000	0.000	0.000	0.000	0.000	0.021	my5740_rel_native_lto.cy8
54.529	45.465	0.005	nonzero	0.001	0.000	0.000	0.000	0.000	0.000	0.030	my8022_rel_native_lto.cy9
46.721	53.273	0.005	0.001	nonzero	0.000	0.000	0.000	0.000	0.000	0.021	my8028_rel_native_lto.cy9
51.317	48.677	0.005	0.001	nonzero	0.000	0.000	0.000	0.000	0.000	0.022	my8031_rel_native_lto.cy9
47.113	52.881	0.005	0.001	nonzero	0.000	0.000	0.000	0.000	0.000	0.021	my8032_rel_native_lto.cy9
Insert response time histogram
256us	1ms	4ms	16ms	64ms	256ms	1s	4s	16s	gt	max	tag
0.000	0.000	88.618	11.368	0.014	0.000	0.000	0.000	0.000	0.000	0.020	my5651_rel.cy8
0.000	0.000	98.486	1.000	0.514	0.000	0.000	0.000	0.000	0.000	0.025	my5740_rel_native_lto.cy8
0.000	0.000	98.201	0.917	0.882	0.000	0.000	0.000	0.000	0.000	0.039	my8022_rel_native_lto.cy9
0.000	0.000	98.340	0.986	0.674	0.000	0.000	0.000	0.000	0.000	0.034	my8028_rel_native_lto.cy9
0.000	0.000	98.479	0.819	0.701	0.000	0.000	0.000	0.000	0.000	0.030	my8031_rel_native_lto.cy9
0.000	0.000	98.347	1.076	0.576	0.000	0.000	0.000	0.000	0.000	0.029	my8032_rel_native_lto.cy9
q500.1
- q500.1: range queries with 500 insert/s per client
- Legend for results is here.
- Each entry lists the percentage of responses that fit in that bucket (slower than max time for previous bucket, faster than min time for next bucket).
Query response time histogram
256us	1ms	4ms	16ms	64ms	256ms	1s	4s	16s	gt	max	tag
94.935	5.033	0.023	0.009	0.000	0.000	0.000	0.000	0.000	0.000	0.012	my5651_rel.cy8
82.612	17.374	0.011	0.001	0.001	0.000	0.000	0.000	0.000	0.000	0.023	my5740_rel_native_lto.cy8
54.701	45.279	0.016	0.002	0.001	0.000	0.000	0.000	0.000	0.000	0.032	my8022_rel_native_lto.cy9
48.002	51.978	0.018	0.002	0.001	0.000	0.000	0.000	0.000	0.000	0.026	my8028_rel_native_lto.cy9
51.351	48.630	0.017	0.002	nonzero	0.000	0.000	0.000	0.000	0.000	0.022	my8031_rel_native_lto.cy9
45.772	54.209	0.016	0.003	0.001	0.000	0.000	0.000	0.000	0.000	0.023	my8032_rel_native_lto.cy9
Insert response time histogram
256us	1ms	4ms	16ms	64ms	256ms	1s	4s	16s	gt	max	tag
0.000	0.000	96.213	3.775	0.013	0.000	0.000	0.000	0.000	0.000	0.038	my5651_rel.cy8
0.000	0.000	98.647	0.924	0.429	0.000	0.000	0.000	0.000	0.000	0.047	my5740_rel_native_lto.cy8
0.000	0.000	95.453	3.592	0.922	0.033	0.000	0.000	0.000	0.000	0.106	my8022_rel_native_lto.cy9
0.000	0.000	96.568	2.772	0.633	0.026	0.000	0.000	0.000	0.000	0.113	my8028_rel_native_lto.cy9
0.000	0.000	97.493	2.056	0.438	0.014	0.000	0.000	0.000	0.000	0.103	my8031_rel_native_lto.cy9
0.000	0.000	95.810	3.501	0.676	0.013	0.000	0.000	0.000	0.000	0.103	my8032_rel_native_lto.cy9
q1000.1
- q1000.1: range queries with 1000 insert/s per client
- Legend for results is here.
- Each entry lists the percentage of responses that fit in that bucket (slower than max time for previous bucket, faster than min time for next bucket).
Query response time histogram
256us	1ms	4ms	16ms	64ms	256ms	1s	4s	16s	gt	max	tag
95.003	4.962	0.027	0.008	0.000	0.000	0.000	0.000	0.000	0.000	0.014	my5651_rel.cy8
82.806	17.160	0.030	0.004	nonzero	0.000	0.000	0.000	0.000	0.000	0.026	my5740_rel_native_lto.cy8
55.126	44.834	0.034	0.005	0.001	0.000	0.000	0.000	0.000	0.000	0.033	my8022_rel_native_lto.cy9
45.540	54.413	0.041	0.006	0.001	0.000	0.000	0.000	0.000	0.000	0.022	my8028_rel_native_lto.cy9
47.252	52.713	0.030	0.005	0.001	0.000	0.000	0.000	0.000	0.000	0.025	my8031_rel_native_lto.cy9
45.556	54.405	0.034	0.005	0.001	0.000	0.000	0.000	0.000	0.000	0.022	my8032_rel_native_lto.cy9
Insert response time histogram
256us	1ms	4ms	16ms	64ms	256ms	1s	4s	16s	gt	max	tag
0.000	0.000	97.505	2.482	0.013	0.000	0.000	0.000	0.000	0.000	0.039	my5651_rel.cy8
0.000	0.000	98.358	1.304	0.338	0.000	0.000	0.000	0.000	0.000	0.049	my5740_rel_native_lto.cy8
0.000	0.000	95.903	3.419	0.663	0.015	0.000	0.000	0.000	0.000	0.110	my8022_rel_native_lto.cy9
0.000	0.000	96.617	2.954	0.399	0.030	0.000	0.000	0.000	0.000	0.109	my8028_rel_native_lto.cy9
0.000	0.000	93.794	5.615	0.572	0.019	0.000	0.000	0.000	0.000	0.107	my8031_rel_native_lto.cy9
0.000	0.000	96.369	3.216	0.406	0.009	0.000	0.000	0.000	0.000	0.105	my8032_rel_native_lto.cy9