Introduction
This is a report for the insert benchmark with 20M docs and 4 client(s). It is generated by scripts (bash, awk, sed) and Tufte might not be impressed. An overview of the insert benchmark is here and a short update is here. Below, by DBMS, I mean DBMS+version.config. An example is my8020.c10b40 where my means MySQL, 8020 is version 8.0.20 and c10b40 is the name for the configuration file.
The test server has 8 AMD cores, 16G RAM and an NVMe SSD. It is described here as the Beelink. The benchmark was run with 4 clients and there were 1 or 2 connections per client (1 for queries, 1 for inserts). The benchmark loads 20M rows without secondary indexes, creates secondary indexes, loads another 20M rows then does 3 read+write tests for one hour each that do queries as fast as possible with 100, 500 and then 1000 writes/second/client concurrent with the queries. There is 1 table. The database is cached by the OS page cache but not the storage engine. Clients and the DBMS share one server. The per-database configs are in the per-database subdirectories here.
The tested DBMS are:
- my5651_rel.cy8_1g - InnoDB and MySQL 5.6.51, the cy8_1g config and compiled with CMAKE_BUILD_TYPE=Release -O3
- my5740_rel.cy8_1g - InnoDB and MySQL 5.7.40, the cy8_1g config and compiled with CMAKE_BUILD_TYPE=Release -O3
- my8022_rel.cy9_1g - InnoDB and MySQL 8.0.22, the cy9_1g config and compiled with CMAKE_BUILD_TYPE=Release -O3
- my8028_rel.cy9_1g - InnoDB and MySQL 8.0.28, the cy9_1g config and compiled with CMAKE_BUILD_TYPE=Release -O3
- my8031_rel.cy9_1g - InnoDB and MySQL 8.0.31, the cy9_1g config and compiled with CMAKE_BUILD_TYPE=Release -O3
Contents
- Summary
- l.i0: load without secondary indexes
- l.x: create secondary indexes
- l.i1: continue load after secondary indexes created
- q100.1: range queries with 100 insert/s per client
- q500.1: range queries with 500 insert/s per client
- q1000.1: range queries with 1000 insert/s per client
Summary
The numbers are inserts/s for l.i0 and l.i1, indexed docs (or rows) /s for l.x and queries/s for q*.2. The values are the average rate over the entire test for inserts (IPS) and queries (QPS). The range of values for IPS and QPS is split into 3 parts: bottom 25%, middle 50%, top 25%. Values in the bottom 25% have a red background, values in the top 25% have a green background and values in the middle have no color. A gray background is used for values that can be ignored because the DBMS did not sustain the target insert rate. Red backgrounds are not used when the minimum value is within 80% of the max value.
| dbms | l.i0 | l.x | l.i1 | q100.1 | q500.1 | q1000.1 |
|---|---|---|---|---|---|---|
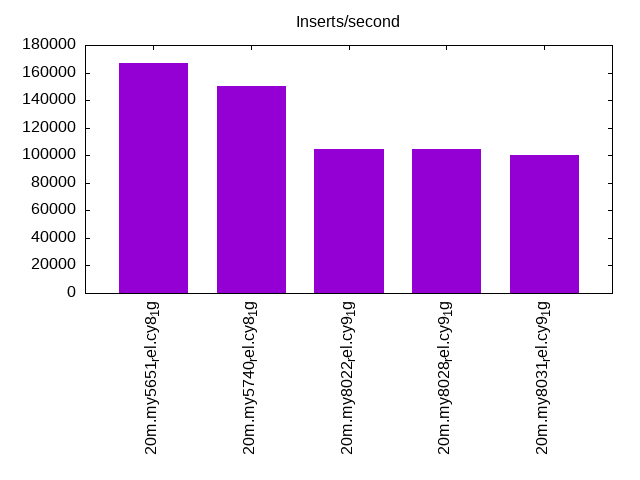
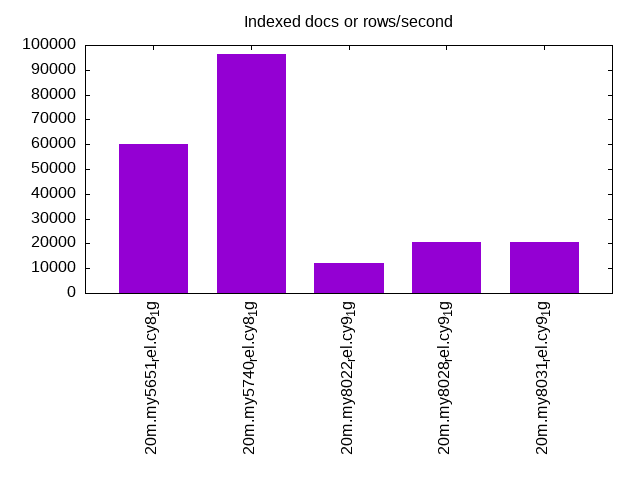
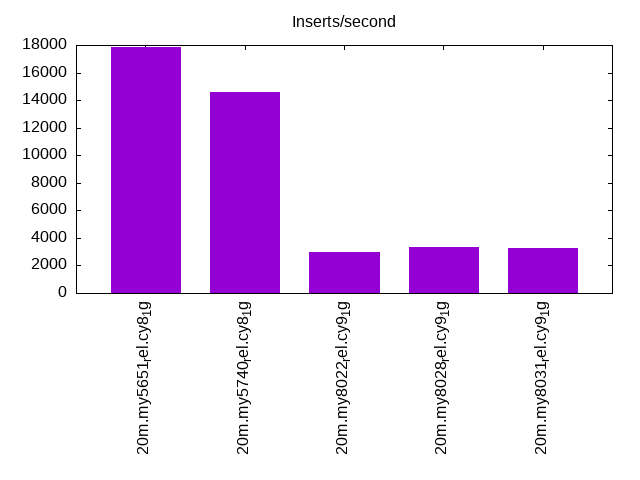
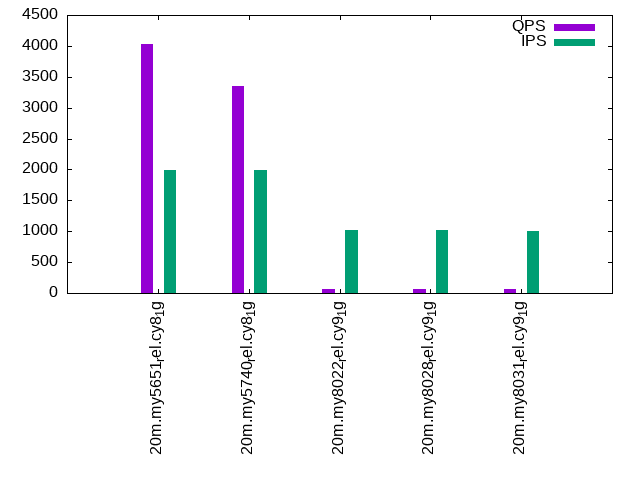
| 20m.my5651_rel.cy8_1g | 166667 | 60180 | 17825 | 7602 | 4032 | 515 |
| 20m.my5740_rel.cy8_1g | 150376 | 96172 | 14556 | 5176 | 3353 | 289 |
| 20m.my8022_rel.cy9_1g | 104712 | 11986 | 2982 | 105 | 71 | 45 |
| 20m.my8028_rel.cy9_1g | 104712 | 20427 | 3324 | 114 | 71 | 46 |
| 20m.my8031_rel.cy9_1g | 100000 | 20489 | 3254 | 117 | 68 | 44 |
This table has relative throughput, throughput for the DBMS relative to the DBMS in the first line, using the absolute throughput from the previous table.
| dbms | l.i0 | l.x | l.i1 | q100.1 | q500.1 | q1000.1 |
|---|---|---|---|---|---|---|
| 20m.my5651_rel.cy8_1g | 1.00 | 1.00 | 1.00 | 1.00 | 1.00 | 1.00 |
| 20m.my5740_rel.cy8_1g | 0.90 | 1.60 | 0.82 | 0.68 | 0.83 | 0.56 |
| 20m.my8022_rel.cy9_1g | 0.63 | 0.20 | 0.17 | 0.01 | 0.02 | 0.09 |
| 20m.my8028_rel.cy9_1g | 0.63 | 0.34 | 0.19 | 0.01 | 0.02 | 0.09 |
| 20m.my8031_rel.cy9_1g | 0.60 | 0.34 | 0.18 | 0.02 | 0.02 | 0.09 |
This lists the average rate of inserts/s for the tests that do inserts concurrent with queries. For such tests the query rate is listed in the table above. The read+write tests are setup so that the insert rate should match the target rate every second. Cells that are not at least 95% of the target have a red background to indicate a failure to satisfy the target.
| dbms | q100.1 | q500.1 | q1000.1 |
|---|---|---|---|
| my5651_rel.cy8_1g | 399 | 1994 | 3865 |
| my5740_rel.cy8_1g | 399 | 1994 | 2750 |
| my8022_rel.cy9_1g | 399 | 1017 | 738 |
| my8028_rel.cy9_1g | 399 | 1017 | 681 |
| my8031_rel.cy9_1g | 399 | 998 | 675 |
| target | 400 | 2000 | 4000 |
l.i0
l.i0: load without secondary indexes. Graphs for performance per 1-second interval are here.
Average throughput:
Insert response time histogram: each cell has the percentage of responses that take <= the time in the header and max is the max response time in seconds. For the max column values in the top 25% of the range have a red background and in the bottom 25% of the range have a green background. The red background is not used when the min value is within 80% of the max value.
| dbms | 256us | 1ms | 4ms | 16ms | 64ms | 256ms | 1s | 4s | 16s | gt | max |
|---|---|---|---|---|---|---|---|---|---|---|---|
| my5651_rel.cy8_1g | 5.399 | 91.320 | 3.022 | 0.246 | 0.013 | 0.106 | |||||
| my5740_rel.cy8_1g | 0.252 | 95.237 | 3.583 | 0.910 | 0.017 | 0.116 | |||||
| my8022_rel.cy9_1g | 95.183 | 2.427 | 2.184 | 0.205 | 0.161 | ||||||
| my8028_rel.cy9_1g | 93.737 | 4.054 | 2.050 | 0.159 | 0.185 | ||||||
| my8031_rel.cy9_1g | 91.709 | 6.193 | 1.991 | 0.107 | 0.203 |
Performance metrics for the DBMS listed above. Some are normalized by throughput, others are not. Legend for results is here.
ips	qps	rps	rmbps	wps	wmbps	rpq	rkbpq	wpi	wkbpi	csps	cpups	cspq	cpupq	dbgb1	dbgb2	rss	maxop	p50	p99	tag
166667	0	1354	5.3	209.1	75.8	0.008	0.032	0.001	0.466	19953	56.9	0.120	27	2.5	43.0	1.0	0.106	43853	12087	20m.my5651_rel.cy8_1g
150376	0	0	0.0	218.2	66.8	0.000	0.000	0.001	0.455	15699	56.0	0.104	30	2.4	42.9	1.2	0.116	40156	25980	20m.my5740_rel.cy8_1g
104712	0	0	0.0	523.9	48.3	0.000	0.000	0.005	0.472	12747	49.1	0.122	38	2.4	10.9	1.3	0.161	28468	7389	20m.my8022_rel.cy9_1g
104712	0	0	0.0	515.0	47.5	0.000	0.000	0.005	0.465	13111	48.4	0.125	37	2.4	10.9	1.4	0.185	28568	4295	20m.my8028_rel.cy9_1g
100000	0	0	0.0	509.9	46.3	0.000	0.000	0.005	0.474	12780	49.2	0.128	39	2.4	11.0	1.4	0.203	27281	13895	20m.my8031_rel.cy9_1g
l.x
l.x: create secondary indexes.
Average throughput:
Performance metrics for the DBMS listed above. Some are normalized by throughput, others are not. Legend for results is here.
ips	qps	rps	rmbps	wps	wmbps	rpq	rkbpq	wpi	wkbpi	csps	cpups	cspq	cpupq	dbgb1	dbgb2	rss	maxop	p50	p99	tag
60180	0	22	0.1	343.0	60.9	0.000	0.001	0.006	1.036	2025	7.2	0.034	10	3.9	44.4	1.1	0.012	NA	NA	20m.my5651_rel.cy8_1g
96172	0	0	0.0	335.5	87.5	0.000	0.000	0.003	0.932	4878	9.2	0.051	8	4.0	44.5	1.3	0.021	NA	NA	20m.my5740_rel.cy8_1g
11986	0	0	0.0	309.9	10.8	0.000	0.000	0.026	0.922	2299	1.4	0.192	9	4.0	12.6	1.5	0.078	NA	NA	20m.my8022_rel.cy9_1g
20427	0	106	7.1	566.7	23.2	0.005	0.355	0.028	1.163	4270	7.1	0.209	28	4.0	12.6	1.5	0.054	NA	NA	20m.my8028_rel.cy9_1g
20489	0	106	7.1	564.9	23.1	0.005	0.354	0.028	1.152	4452	7.8	0.217	30	4.0	12.6	1.5	0.017	NA	NA	20m.my8031_rel.cy9_1g
l.i1
l.i1: continue load after secondary indexes created. Graphs for performance per 1-second interval are here.
Average throughput:
Insert response time histogram: each cell has the percentage of responses that take <= the time in the header and max is the max response time in seconds. For the max column values in the top 25% of the range have a red background and in the bottom 25% of the range have a green background. The red background is not used when the min value is within 80% of the max value.
| dbms | 256us | 1ms | 4ms | 16ms | 64ms | 256ms | 1s | 4s | 16s | gt | max |
|---|---|---|---|---|---|---|---|---|---|---|---|
| my5651_rel.cy8_1g | 2.620 | 83.451 | 13.202 | 0.653 | 0.074 | 0.916 | |||||
| my5740_rel.cy8_1g | 0.937 | 73.127 | 25.139 | 0.713 | 0.080 | 0.004 | 1.221 | ||||
| my8022_rel.cy9_1g | 0.120 | 28.754 | 37.953 | 30.336 | 2.638 | 0.166 | 0.034 | 9.802 | |||
| my8028_rel.cy9_1g | 0.067 | 23.566 | 44.660 | 30.607 | 0.927 | 0.144 | 0.028 | 6.820 | |||
| my8031_rel.cy9_1g | 0.004 | 21.808 | 46.379 | 30.457 | 1.155 | 0.173 | 0.023 | 8.779 |
Performance metrics for the DBMS listed above. Some are normalized by throughput, others are not. Legend for results is here.
ips	qps	rps	rmbps	wps	wmbps	rpq	rkbpq	wpi	wkbpi	csps	cpups	cspq	cpupq	dbgb1	dbgb2	rss	maxop	p50	p99	tag
17825	0	286	1.1	3075.5	125.3	0.016	0.064	0.173	7.199	12933	38.2	0.726	171	10.5	51.0	1.1	0.916	4697	150	20m.my5651_rel.cy8_1g
14556	0	0	0.0	2707.9	104.9	0.000	0.000	0.186	7.381	10341	38.3	0.710	210	10.4	50.9	1.3	1.221	3796	150	20m.my5740_rel.cy8_1g
2982	0	0	0.0	935.0	20.4	0.000	0.002	0.314	7.013	8937	11.0	2.997	295	10.4	19.0	1.5	9.802	550	0	20m.my8022_rel.cy9_1g
3324	0	0	0.0	999.1	21.8	0.000	0.002	0.301	6.700	6527	13.0	1.963	313	10.4	19.0	1.5	6.820	699	0	20m.my8028_rel.cy9_1g
3254	0	0	0.0	995.7	22.4	0.000	0.002	0.306	7.049	6629	13.9	2.038	342	10.5	19.0	1.5	8.779	699	0	20m.my8031_rel.cy9_1g
q100.1
q100.1: range queries with 100 insert/s per client. Graphs for performance per 1-second interval are here.
Average throughput:

Query response time histogram: each cell has the percentage of responses that take <= the time in the header and max is the max response time in seconds. For max values in the top 25% of the range have a red background and in the bottom 25% of the range have a green background. The red background is not used when the min value is within 80% of the max value.
| dbms | 256us | 1ms | 4ms | 16ms | 64ms | 256ms | 1s | 4s | 16s | gt | max |
|---|---|---|---|---|---|---|---|---|---|---|---|
| my5651_rel.cy8_1g | 22.359 | 75.984 | 0.409 | 1.011 | 0.231 | 0.006 | nonzero | 0.367 | |||
| my5740_rel.cy8_1g | 15.514 | 82.074 | 0.236 | 1.653 | 0.426 | 0.096 | 0.001 | 0.765 | |||
| my8022_rel.cy9_1g | 0.026 | 26.328 | 2.719 | 21.601 | 33.036 | 14.477 | 1.812 | 0.001 | 1.272 | ||
| my8028_rel.cy9_1g | 0.004 | 23.682 | 3.655 | 25.917 | 32.630 | 12.452 | 1.660 | 0.983 | |||
| my8031_rel.cy9_1g | 0.002 | 23.483 | 4.024 | 25.631 | 32.815 | 12.605 | 1.438 | 0.001 | 1.213 |
Insert response time histogram: each cell has the percentage of responses that take <= the time in the header and max is the max response time in seconds. For max values in the top 25% of the range have a red background and in the bottom 25% of the range have a green background. The red background is not used when the min value is within 80% of the max value.
| dbms | 256us | 1ms | 4ms | 16ms | 64ms | 256ms | 1s | 4s | 16s | gt | max |
|---|---|---|---|---|---|---|---|---|---|---|---|
| my5651_rel.cy8_1g | 3.181 | 44.486 | 46.465 | 5.174 | 0.694 | 0.818 | |||||
| my5740_rel.cy8_1g | 23.542 | 48.194 | 12.417 | 10.479 | 5.340 | 0.028 | 1.426 | ||||
| my8022_rel.cy9_1g | 0.438 | 3.188 | 49.833 | 45.361 | 1.181 | 1.892 | |||||
| my8028_rel.cy9_1g | 0.007 | 0.139 | 2.250 | 50.319 | 45.347 | 1.938 | 1.873 | ||||
| my8031_rel.cy9_1g | 0.243 | 2.278 | 51.396 | 44.340 | 1.743 | 1.825 |
Performance metrics for the DBMS listed above. Some are normalized by throughput, others are not. Legend for results is here.
ips	qps	rps	rmbps	wps	wmbps	rpq	rkbpq	wpi	wkbpi	csps	cpups	cspq	cpupq	dbgb1	dbgb2	rss	maxop	p50	p99	tag
399	7602	16	0.2	1272.8	38.0	0.002	0.022	3.192	97.661	32417	38.0	4.265	400	11.0	51.5	1.1	0.367	1966	80	20m.my5651_rel.cy8_1g
399	5176	9	0.1	1320.9	36.6	0.002	0.030	3.312	93.868	24140	28.7	4.664	444	10.8	51.4	1.3	0.765	1358	32	20m.my5740_rel.cy8_1g
399	105	8	0.1	967.9	16.1	0.081	1.357	2.427	41.304	8230	5.2	78.304	3958	10.9	19.5	1.5	1.272	16	0	20m.my8022_rel.cy9_1g
399	114	9	0.2	1006.4	16.7	0.082	1.365	2.524	42.961	6931	5.7	60.746	3997	10.9	19.5	1.5	0.983	16	0	20m.my8028_rel.cy9_1g
399	117	12	0.2	1016.1	17.1	0.101	1.648	2.549	43.842	7167	6.1	61.361	4178	10.9	19.5	1.5	1.213	16	0	20m.my8031_rel.cy9_1g
q500.1
q500.1: range queries with 500 insert/s per client. Graphs for performance per 1-second interval are here.
Average throughput:
Query response time histogram: each cell has the percentage of responses that take <= the time in the header and max is the max response time in seconds. For max values in the top 25% of the range have a red background and in the bottom 25% of the range have a green background. The red background is not used when the min value is within 80% of the max value.
| dbms | 256us | 1ms | 4ms | 16ms | 64ms | 256ms | 1s | 4s | 16s | gt | max |
|---|---|---|---|---|---|---|---|---|---|---|---|
| my5651_rel.cy8_1g | 8.784 | 83.324 | 2.549 | 4.969 | 0.374 | 0.054 | |||||
| my5740_rel.cy8_1g | 5.486 | 87.228 | 1.627 | 4.961 | 0.606 | 0.092 | nonzero | 0.304 | |||
| my8022_rel.cy9_1g | 0.013 | 21.532 | 4.540 | 15.348 | 32.011 | 22.527 | 4.026 | 0.002 | 1.809 | ||
| my8028_rel.cy9_1g | 0.005 | 17.435 | 3.187 | 19.673 | 33.961 | 21.781 | 3.955 | 0.003 | 1.387 | ||
| my8031_rel.cy9_1g | 0.001 | 16.680 | 3.573 | 18.602 | 33.552 | 23.455 | 4.132 | 0.005 | 1.617 |
Insert response time histogram: each cell has the percentage of responses that take <= the time in the header and max is the max response time in seconds. For max values in the top 25% of the range have a red background and in the bottom 25% of the range have a green background. The red background is not used when the min value is within 80% of the max value.
| dbms | 256us | 1ms | 4ms | 16ms | 64ms | 256ms | 1s | 4s | 16s | gt | max |
|---|---|---|---|---|---|---|---|---|---|---|---|
| my5651_rel.cy8_1g | 2.992 | 69.412 | 27.492 | 0.104 | 0.098 | ||||||
| my5740_rel.cy8_1g | 1.800 | 67.033 | 28.062 | 3.086 | 0.018 | 0.358 | |||||
| my8022_rel.cy9_1g | 0.007 | 3.212 | 9.150 | 62.864 | 24.696 | 0.071 | 1.542 | ||||
| my8028_rel.cy9_1g | 0.004 | 1.733 | 8.936 | 65.165 | 24.062 | 0.099 | 1.616 | ||||
| my8031_rel.cy9_1g | 1.807 | 8.549 | 64.833 | 24.643 | 0.168 | 1.538 |
Performance metrics for the DBMS listed above. Some are normalized by throughput, others are not. Legend for results is here.
ips	qps	rps	rmbps	wps	wmbps	rpq	rkbpq	wpi	wkbpi	csps	cpups	cspq	cpupq	dbgb1	dbgb2	rss	maxop	p50	p99	tag
1994	4032	70	0.8	3910.1	119.4	0.017	0.195	1.961	61.325	25814	32.1	6.402	637	12.0	52.5	1.1	0.054	991	815	20m.my5651_rel.cy8_1g
1994	3353	40	0.7	3809.2	114.5	0.012	0.208	1.910	58.806	23581	27.7	7.032	661	11.9	52.4	1.3	0.304	847	447	20m.my5740_rel.cy8_1g
1017	71	8	0.1	989.4	17.1	0.107	1.774	0.973	17.206	8319	6.4	117.002	7201	12.0	20.5	1.5	1.809	16	0	20m.my8022_rel.cy9_1g
1017	71	8	0.1	1006.0	17.1	0.106	1.744	0.989	17.242	6925	6.9	97.258	7753	12.0	20.6	1.5	1.387	16	0	20m.my8028_rel.cy9_1g
998	68	8	0.1	977.1	16.9	0.115	1.947	0.979	17.315	6915	7.3	101.846	8601	12.0	20.6	1.5	1.617	16	0	20m.my8031_rel.cy9_1g
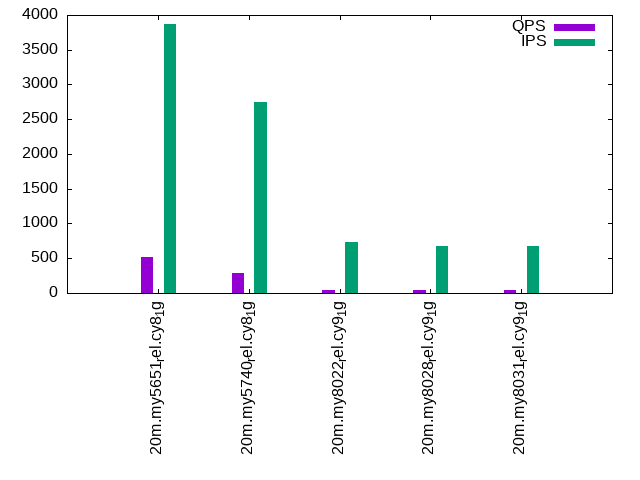
q1000.1
q1000.1: range queries with 1000 insert/s per client. Graphs for performance per 1-second interval are here.
Average throughput:
Query response time histogram: each cell has the percentage of responses that take <= the time in the header and max is the max response time in seconds. For max values in the top 25% of the range have a red background and in the bottom 25% of the range have a green background. The red background is not used when the min value is within 80% of the max value.
| dbms | 256us | 1ms | 4ms | 16ms | 64ms | 256ms | 1s | 4s | 16s | gt | max |
|---|---|---|---|---|---|---|---|---|---|---|---|
| my5651_rel.cy8_1g | 5.055 | 50.512 | 25.216 | 8.930 | 6.617 | 3.648 | 0.022 | 0.587 | |||
| my5740_rel.cy8_1g | 1.586 | 62.575 | 15.196 | 6.782 | 6.933 | 6.266 | 0.662 | nonzero | 1.236 | ||
| my8022_rel.cy9_1g | 0.013 | 21.803 | 4.867 | 8.874 | 25.768 | 28.185 | 10.458 | 0.033 | 1.999 | ||
| my8028_rel.cy9_1g | 0.002 | 16.672 | 2.383 | 12.757 | 31.724 | 26.656 | 9.747 | 0.060 | 1.814 | ||
| my8031_rel.cy9_1g | 0.001 | 16.193 | 2.776 | 12.150 | 30.744 | 28.022 | 10.042 | 0.071 | 2.167 |
Insert response time histogram: each cell has the percentage of responses that take <= the time in the header and max is the max response time in seconds. For max values in the top 25% of the range have a red background and in the bottom 25% of the range have a green background. The red background is not used when the min value is within 80% of the max value.
| dbms | 256us | 1ms | 4ms | 16ms | 64ms | 256ms | 1s | 4s | 16s | gt | max |
|---|---|---|---|---|---|---|---|---|---|---|---|
| my5651_rel.cy8_1g | 1.959 | 46.322 | 31.585 | 19.590 | 0.543 | 0.597 | |||||
| my5740_rel.cy8_1g | 0.028 | 33.881 | 34.898 | 25.641 | 5.532 | 0.019 | 1.678 | ||||
| my8022_rel.cy9_1g | 0.002 | 4.201 | 5.972 | 46.533 | 42.635 | 0.658 | 1.898 | ||||
| my8028_rel.cy9_1g | 0.003 | 1.944 | 3.789 | 51.136 | 41.592 | 1.536 | 2.723 | ||||
| my8031_rel.cy9_1g | 2.006 | 3.700 | 50.059 | 42.707 | 1.528 | 2.661 |
Performance metrics for the DBMS listed above. Some are normalized by throughput, others are not. Legend for results is here.
ips	qps	rps	rmbps	wps	wmbps	rpq	rkbpq	wpi	wkbpi	csps	cpups	cspq	cpupq	dbgb1	dbgb2	rss	maxop	p50	p99	tag
3865	515	100	0.9	2839.3	86.0	0.193	1.777	0.735	22.778	11694	15.4	22.694	2391	13.7	54.2	1.1	0.587	96	16	20m.my5651_rel.cy8_1g
2750	289	30	0.6	1896.1	55.1	0.104	1.993	0.689	20.523	8296	11.2	28.736	3104	13.6	54.1	1.2	1.236	64	0	20m.my5740_rel.cy8_1g
738	45	4	0.1	712.8	12.1	0.087	1.517	0.966	16.798	6157	4.6	137.733	8233	13.7	22.2	1.5	1.999	16	0	20m.my8022_rel.cy9_1g
681	46	4	0.1	695.9	11.8	0.092	1.624	1.021	17.668	4954	5.0	108.160	8734	13.7	22.3	1.4	1.814	16	0	20m.my8028_rel.cy9_1g
675	44	5	0.1	683.4	11.7	0.106	1.918	1.012	17.776	5049	5.2	113.982	9390	13.7	22.3	1.3	2.167	16	0	20m.my8031_rel.cy9_1g
l.i0
l.i0: load without secondary indexes
Performance metrics for all DBMS, not just the ones listed above. Some are normalized by throughput, others are not. Legend for results is here.
ips	qps	rps	rmbps	wps	wmbps	rpq	rkbpq	wpi	wkbpi	csps	cpups	cspq	cpupq	dbgb1	dbgb2	rss	maxop	p50	p99	tag
166667	0	1354	5.3	209.1	75.8	0.008	0.032	0.001	0.466	19953	56.9	0.120	27	2.5	43.0	1.0	0.106	43853	12087	20m.my5651_rel.cy8_1g
150376	0	0	0.0	218.2	66.8	0.000	0.000	0.001	0.455	15699	56.0	0.104	30	2.4	42.9	1.2	0.116	40156	25980	20m.my5740_rel.cy8_1g
104712	0	0	0.0	523.9	48.3	0.000	0.000	0.005	0.472	12747	49.1	0.122	38	2.4	10.9	1.3	0.161	28468	7389	20m.my8022_rel.cy9_1g
104712	0	0	0.0	515.0	47.5	0.000	0.000	0.005	0.465	13111	48.4	0.125	37	2.4	10.9	1.4	0.185	28568	4295	20m.my8028_rel.cy9_1g
100000	0	0	0.0	509.9	46.3	0.000	0.000	0.005	0.474	12780	49.2	0.128	39	2.4	11.0	1.4	0.203	27281	13895	20m.my8031_rel.cy9_1g
l.x
l.x: create secondary indexes
Performance metrics for all DBMS, not just the ones listed above. Some are normalized by throughput, others are not. Legend for results is here.
ips	qps	rps	rmbps	wps	wmbps	rpq	rkbpq	wpi	wkbpi	csps	cpups	cspq	cpupq	dbgb1	dbgb2	rss	maxop	p50	p99	tag
60180	0	22	0.1	343.0	60.9	0.000	0.001	0.006	1.036	2025	7.2	0.034	10	3.9	44.4	1.1	0.012	NA	NA	20m.my5651_rel.cy8_1g
96172	0	0	0.0	335.5	87.5	0.000	0.000	0.003	0.932	4878	9.2	0.051	8	4.0	44.5	1.3	0.021	NA	NA	20m.my5740_rel.cy8_1g
11986	0	0	0.0	309.9	10.8	0.000	0.000	0.026	0.922	2299	1.4	0.192	9	4.0	12.6	1.5	0.078	NA	NA	20m.my8022_rel.cy9_1g
20427	0	106	7.1	566.7	23.2	0.005	0.355	0.028	1.163	4270	7.1	0.209	28	4.0	12.6	1.5	0.054	NA	NA	20m.my8028_rel.cy9_1g
20489	0	106	7.1	564.9	23.1	0.005	0.354	0.028	1.152	4452	7.8	0.217	30	4.0	12.6	1.5	0.017	NA	NA	20m.my8031_rel.cy9_1g
l.i1
l.i1: continue load after secondary indexes created
Performance metrics for all DBMS, not just the ones listed above. Some are normalized by throughput, others are not. Legend for results is here.
ips	qps	rps	rmbps	wps	wmbps	rpq	rkbpq	wpi	wkbpi	csps	cpups	cspq	cpupq	dbgb1	dbgb2	rss	maxop	p50	p99	tag
17825	0	286	1.1	3075.5	125.3	0.016	0.064	0.173	7.199	12933	38.2	0.726	171	10.5	51.0	1.1	0.916	4697	150	20m.my5651_rel.cy8_1g
14556	0	0	0.0	2707.9	104.9	0.000	0.000	0.186	7.381	10341	38.3	0.710	210	10.4	50.9	1.3	1.221	3796	150	20m.my5740_rel.cy8_1g
2982	0	0	0.0	935.0	20.4	0.000	0.002	0.314	7.013	8937	11.0	2.997	295	10.4	19.0	1.5	9.802	550	0	20m.my8022_rel.cy9_1g
3324	0	0	0.0	999.1	21.8	0.000	0.002	0.301	6.700	6527	13.0	1.963	313	10.4	19.0	1.5	6.820	699	0	20m.my8028_rel.cy9_1g
3254	0	0	0.0	995.7	22.4	0.000	0.002	0.306	7.049	6629	13.9	2.038	342	10.5	19.0	1.5	8.779	699	0	20m.my8031_rel.cy9_1g
q100.1
q100.1: range queries with 100 insert/s per client
Performance metrics for all DBMS, not just the ones listed above. Some are normalized by throughput, others are not. Legend for results is here.
ips	qps	rps	rmbps	wps	wmbps	rpq	rkbpq	wpi	wkbpi	csps	cpups	cspq	cpupq	dbgb1	dbgb2	rss	maxop	p50	p99	tag
399	7602	16	0.2	1272.8	38.0	0.002	0.022	3.192	97.661	32417	38.0	4.265	400	11.0	51.5	1.1	0.367	1966	80	20m.my5651_rel.cy8_1g
399	5176	9	0.1	1320.9	36.6	0.002	0.030	3.312	93.868	24140	28.7	4.664	444	10.8	51.4	1.3	0.765	1358	32	20m.my5740_rel.cy8_1g
399	105	8	0.1	967.9	16.1	0.081	1.357	2.427	41.304	8230	5.2	78.304	3958	10.9	19.5	1.5	1.272	16	0	20m.my8022_rel.cy9_1g
399	114	9	0.2	1006.4	16.7	0.082	1.365	2.524	42.961	6931	5.7	60.746	3997	10.9	19.5	1.5	0.983	16	0	20m.my8028_rel.cy9_1g
399	117	12	0.2	1016.1	17.1	0.101	1.648	2.549	43.842	7167	6.1	61.361	4178	10.9	19.5	1.5	1.213	16	0	20m.my8031_rel.cy9_1g
q500.1
q500.1: range queries with 500 insert/s per client
Performance metrics for all DBMS, not just the ones listed above. Some are normalized by throughput, others are not. Legend for results is here.
ips	qps	rps	rmbps	wps	wmbps	rpq	rkbpq	wpi	wkbpi	csps	cpups	cspq	cpupq	dbgb1	dbgb2	rss	maxop	p50	p99	tag
1994	4032	70	0.8	3910.1	119.4	0.017	0.195	1.961	61.325	25814	32.1	6.402	637	12.0	52.5	1.1	0.054	991	815	20m.my5651_rel.cy8_1g
1994	3353	40	0.7	3809.2	114.5	0.012	0.208	1.910	58.806	23581	27.7	7.032	661	11.9	52.4	1.3	0.304	847	447	20m.my5740_rel.cy8_1g
1017	71	8	0.1	989.4	17.1	0.107	1.774	0.973	17.206	8319	6.4	117.002	7201	12.0	20.5	1.5	1.809	16	0	20m.my8022_rel.cy9_1g
1017	71	8	0.1	1006.0	17.1	0.106	1.744	0.989	17.242	6925	6.9	97.258	7753	12.0	20.6	1.5	1.387	16	0	20m.my8028_rel.cy9_1g
998	68	8	0.1	977.1	16.9	0.115	1.947	0.979	17.315	6915	7.3	101.846	8601	12.0	20.6	1.5	1.617	16	0	20m.my8031_rel.cy9_1g
q1000.1
q1000.1: range queries with 1000 insert/s per client
Performance metrics for all DBMS, not just the ones listed above. Some are normalized by throughput, others are not. Legend for results is here.
ips	qps	rps	rmbps	wps	wmbps	rpq	rkbpq	wpi	wkbpi	csps	cpups	cspq	cpupq	dbgb1	dbgb2	rss	maxop	p50	p99	tag
3865	515	100	0.9	2839.3	86.0	0.193	1.777	0.735	22.778	11694	15.4	22.694	2391	13.7	54.2	1.1	0.587	96	16	20m.my5651_rel.cy8_1g
2750	289	30	0.6	1896.1	55.1	0.104	1.993	0.689	20.523	8296	11.2	28.736	3104	13.6	54.1	1.2	1.236	64	0	20m.my5740_rel.cy8_1g
738	45	4	0.1	712.8	12.1	0.087	1.517	0.966	16.798	6157	4.6	137.733	8233	13.7	22.2	1.5	1.999	16	0	20m.my8022_rel.cy9_1g
681	46	4	0.1	695.9	11.8	0.092	1.624	1.021	17.668	4954	5.0	108.160	8734	13.7	22.3	1.4	1.814	16	0	20m.my8028_rel.cy9_1g
675	44	5	0.1	683.4	11.7	0.106	1.918	1.012	17.776	5049	5.2	113.982	9390	13.7	22.3	1.3	2.167	16	0	20m.my8031_rel.cy9_1g
l.i0
- l.i0: load without secondary indexes
- Legend for results is here.
- Each entry lists the percentage of responses that fit in that bucket (slower than max time for previous bucket, faster than min time for next bucket).
Insert response time histogram
256us	1ms	4ms	16ms	64ms	256ms	1s	4s	16s	gt	max	tag
0.000	5.399	91.320	3.022	0.246	0.013	0.000	0.000	0.000	0.000	0.106	my5651_rel.cy8_1g
0.000	0.252	95.237	3.583	0.910	0.017	0.000	0.000	0.000	0.000	0.116	my5740_rel.cy8_1g
0.000	0.000	95.183	2.427	2.184	0.205	0.000	0.000	0.000	0.000	0.161	my8022_rel.cy9_1g
0.000	0.000	93.737	4.054	2.050	0.159	0.000	0.000	0.000	0.000	0.185	my8028_rel.cy9_1g
0.000	0.000	91.709	6.193	1.991	0.107	0.000	0.000	0.000	0.000	0.203	my8031_rel.cy9_1g
l.x
- l.x: create secondary indexes
- Legend for results is here.
- Each entry lists the percentage of responses that fit in that bucket (slower than max time for previous bucket, faster than min time for next bucket).
TODO - determine whether there is data for create index response time
l.i1
- l.i1: continue load after secondary indexes created
- Legend for results is here.
- Each entry lists the percentage of responses that fit in that bucket (slower than max time for previous bucket, faster than min time for next bucket).
Insert response time histogram
256us	1ms	4ms	16ms	64ms	256ms	1s	4s	16s	gt	max	tag
0.000	0.000	2.620	83.451	13.202	0.653	0.074	0.000	0.000	0.000	0.916	my5651_rel.cy8_1g
0.000	0.000	0.937	73.127	25.139	0.713	0.080	0.004	0.000	0.000	1.221	my5740_rel.cy8_1g
0.000	0.000	0.120	28.754	37.953	30.336	2.638	0.166	0.034	0.000	9.802	my8022_rel.cy9_1g
0.000	0.000	0.067	23.566	44.660	30.607	0.927	0.144	0.028	0.000	6.820	my8028_rel.cy9_1g
0.000	0.000	0.004	21.808	46.379	30.457	1.155	0.173	0.023	0.000	8.779	my8031_rel.cy9_1g
q100.1
- q100.1: range queries with 100 insert/s per client
- Legend for results is here.
- Each entry lists the percentage of responses that fit in that bucket (slower than max time for previous bucket, faster than min time for next bucket).
Query response time histogram
256us	1ms	4ms	16ms	64ms	256ms	1s	4s	16s	gt	max	tag
22.359	75.984	0.409	1.011	0.231	0.006	nonzero	0.000	0.000	0.000	0.367	my5651_rel.cy8_1g
15.514	82.074	0.236	1.653	0.426	0.096	0.001	0.000	0.000	0.000	0.765	my5740_rel.cy8_1g
0.026	26.328	2.719	21.601	33.036	14.477	1.812	0.001	0.000	0.000	1.272	my8022_rel.cy9_1g
0.004	23.682	3.655	25.917	32.630	12.452	1.660	0.000	0.000	0.000	0.983	my8028_rel.cy9_1g
0.002	23.483	4.024	25.631	32.815	12.605	1.438	0.001	0.000	0.000	1.213	my8031_rel.cy9_1g
Insert response time histogram
256us	1ms	4ms	16ms	64ms	256ms	1s	4s	16s	gt	max	tag
0.000	0.000	3.181	44.486	46.465	5.174	0.694	0.000	0.000	0.000	0.818	my5651_rel.cy8_1g
0.000	0.000	23.542	48.194	12.417	10.479	5.340	0.028	0.000	0.000	1.426	my5740_rel.cy8_1g
0.000	0.000	0.000	0.438	3.188	49.833	45.361	1.181	0.000	0.000	1.892	my8022_rel.cy9_1g
0.000	0.000	0.007	0.139	2.250	50.319	45.347	1.938	0.000	0.000	1.873	my8028_rel.cy9_1g
0.000	0.000	0.000	0.243	2.278	51.396	44.340	1.743	0.000	0.000	1.825	my8031_rel.cy9_1g
q500.1
- q500.1: range queries with 500 insert/s per client
- Legend for results is here.
- Each entry lists the percentage of responses that fit in that bucket (slower than max time for previous bucket, faster than min time for next bucket).
Query response time histogram
256us	1ms	4ms	16ms	64ms	256ms	1s	4s	16s	gt	max	tag
8.784	83.324	2.549	4.969	0.374	0.000	0.000	0.000	0.000	0.000	0.054	my5651_rel.cy8_1g
5.486	87.228	1.627	4.961	0.606	0.092	nonzero	0.000	0.000	0.000	0.304	my5740_rel.cy8_1g
0.013	21.532	4.540	15.348	32.011	22.527	4.026	0.002	0.000	0.000	1.809	my8022_rel.cy9_1g
0.005	17.435	3.187	19.673	33.961	21.781	3.955	0.003	0.000	0.000	1.387	my8028_rel.cy9_1g
0.001	16.680	3.573	18.602	33.552	23.455	4.132	0.005	0.000	0.000	1.617	my8031_rel.cy9_1g
Insert response time histogram
256us	1ms	4ms	16ms	64ms	256ms	1s	4s	16s	gt	max	tag
0.000	0.000	2.992	69.412	27.492	0.104	0.000	0.000	0.000	0.000	0.098	my5651_rel.cy8_1g
0.000	0.000	1.800	67.033	28.062	3.086	0.018	0.000	0.000	0.000	0.358	my5740_rel.cy8_1g
0.000	0.000	0.007	3.212	9.150	62.864	24.696	0.071	0.000	0.000	1.542	my8022_rel.cy9_1g
0.000	0.000	0.004	1.733	8.936	65.165	24.062	0.099	0.000	0.000	1.616	my8028_rel.cy9_1g
0.000	0.000	0.000	1.807	8.549	64.833	24.643	0.168	0.000	0.000	1.538	my8031_rel.cy9_1g
q1000.1
- q1000.1: range queries with 1000 insert/s per client
- Legend for results is here.
- Each entry lists the percentage of responses that fit in that bucket (slower than max time for previous bucket, faster than min time for next bucket).
Query response time histogram
256us	1ms	4ms	16ms	64ms	256ms	1s	4s	16s	gt	max	tag
5.055	50.512	25.216	8.930	6.617	3.648	0.022	0.000	0.000	0.000	0.587	my5651_rel.cy8_1g
1.586	62.575	15.196	6.782	6.933	6.266	0.662	nonzero	0.000	0.000	1.236	my5740_rel.cy8_1g
0.013	21.803	4.867	8.874	25.768	28.185	10.458	0.033	0.000	0.000	1.999	my8022_rel.cy9_1g
0.002	16.672	2.383	12.757	31.724	26.656	9.747	0.060	0.000	0.000	1.814	my8028_rel.cy9_1g
0.001	16.193	2.776	12.150	30.744	28.022	10.042	0.071	0.000	0.000	2.167	my8031_rel.cy9_1g
Insert response time histogram
256us	1ms	4ms	16ms	64ms	256ms	1s	4s	16s	gt	max	tag
0.000	0.000	1.959	46.322	31.585	19.590	0.543	0.000	0.000	0.000	0.597	my5651_rel.cy8_1g
0.000	0.000	0.028	33.881	34.898	25.641	5.532	0.019	0.000	0.000	1.678	my5740_rel.cy8_1g
0.000	0.000	0.002	4.201	5.972	46.533	42.635	0.658	0.000	0.000	1.898	my8022_rel.cy9_1g
0.000	0.000	0.003	1.944	3.789	51.136	41.592	1.536	0.000	0.000	2.723	my8028_rel.cy9_1g
0.000	0.000	0.000	2.006	3.700	50.059	42.707	1.528	0.000	0.000	2.661	my8031_rel.cy9_1g