Introduction
This is a report for the insert benchmark with 20M docs and 1 client(s). It is generated by scripts (bash, awk, sed) and Tufte might not be impressed. An overview of the insert benchmark is here and a short update is here. Below, by DBMS, I mean DBMS+version.config. An example is my8020.c10b40 where my means MySQL, 8020 is version 8.0.20 and c10b40 is the name for the configuration file.
The test server has 8 AMD cores, 16G RAM and an NVMe SSD. It is described here as the Beelink. The benchmark was run with 1 client and there were 1 or 2 connections per client (1 for queries, 1 for inserts). The benchmark loads 20M rows without secondary indexes, creates secondary indexes, loads another 20M rows then does 3 read+write tests for one hour each that do queries as fast as possible with 100, 500 and then 1000 writes/second/client concurrent with the queries. There is 1 table. The database is cached by the storage engine and the only IO is for writes. Clients and the DBMS share one server. The per-database configs are in the per-database subdirectories here.
The tested DBMS are:
- my5651_rel.cy8 - InnoDB and MySQL 5.6.51, the cy8 config and compiled with CMAKE_BUILD_TYPE=Release -O3
- my5740_rel_native_lto.cy8 - InnoDB and MySQL 5.7.40, the cy8 config and compiled with CMAKE_BUILD_TYPE=Release -O3 -flto
- my8022_rel_native_lto.cy9 - InnoDB and MySQL 8.0.22, the cy9 config and compiled with CMAKE_BUILD_TYPE=Release -O3 -flto
- my8028_rel_native_lto.cy9 - InnoDB and MySQL 8.0.28, the cy9 config and compiled with CMAKE_BUILD_TYPE=Release -O3 -flto
- my8031_rel_native_lto.cy9 - InnoDB and MySQL 8.0.31, the cy9 config and compiled with CMAKE_BUILD_TYPE=Release -O3 -flto
- my8032_rel_native_lto.cy9 - InnoDB and MySQL 8.0.32, the cy9 config and compiled with CMAKE_BUILD_TYPE=Release -O3 -flto
Contents
- Summary
- l.i0: load without secondary indexes
- l.x: create secondary indexes
- l.i1: continue load after secondary indexes created
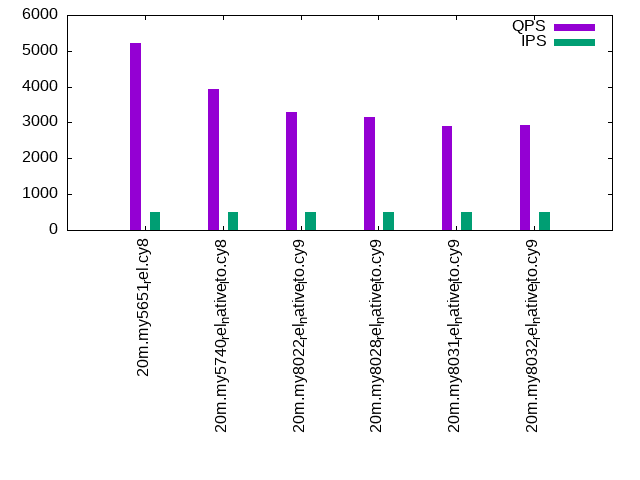
- q100.1: range queries with 100 insert/s per client
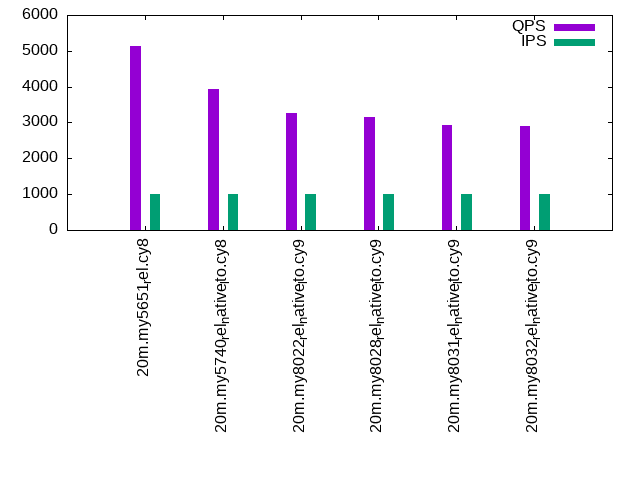
- q500.1: range queries with 500 insert/s per client
- q1000.1: range queries with 1000 insert/s per client
Summary
The numbers are inserts/s for l.i0 and l.i1, indexed docs (or rows) /s for l.x and queries/s for q*.2. The values are the average rate over the entire test for inserts (IPS) and queries (QPS). The range of values for IPS and QPS is split into 3 parts: bottom 25%, middle 50%, top 25%. Values in the bottom 25% have a red background, values in the top 25% have a green background and values in the middle have no color. A gray background is used for values that can be ignored because the DBMS did not sustain the target insert rate. Red backgrounds are not used when the minimum value is within 80% of the max value.
| dbms | l.i0 | l.x | l.i1 | q100.1 | q500.1 | q1000.1 |
|---|---|---|---|---|---|---|
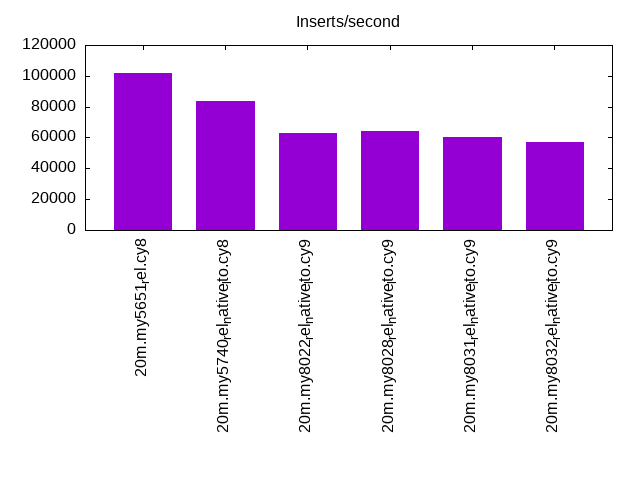
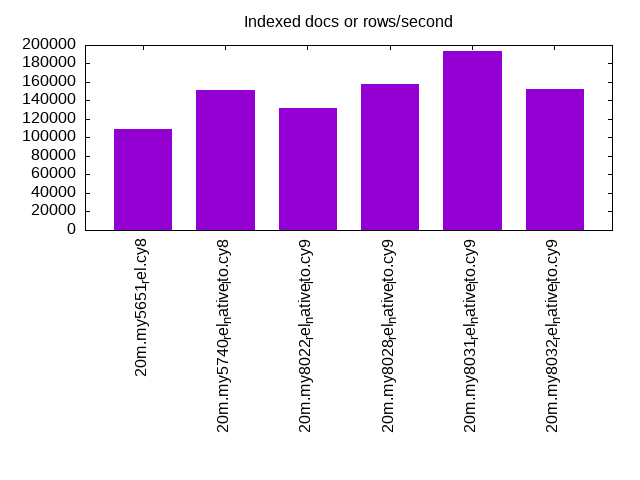
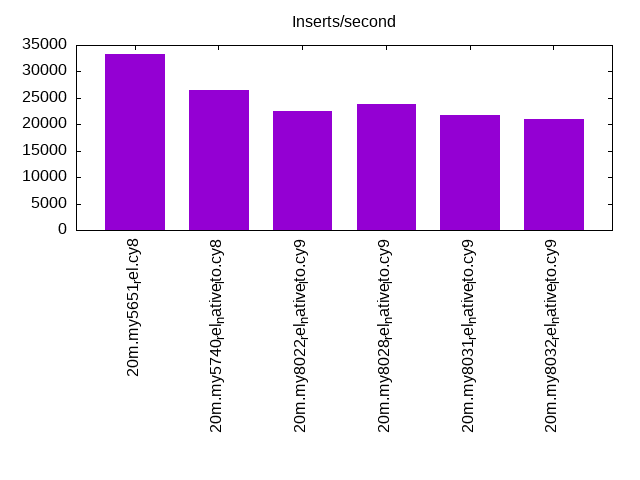
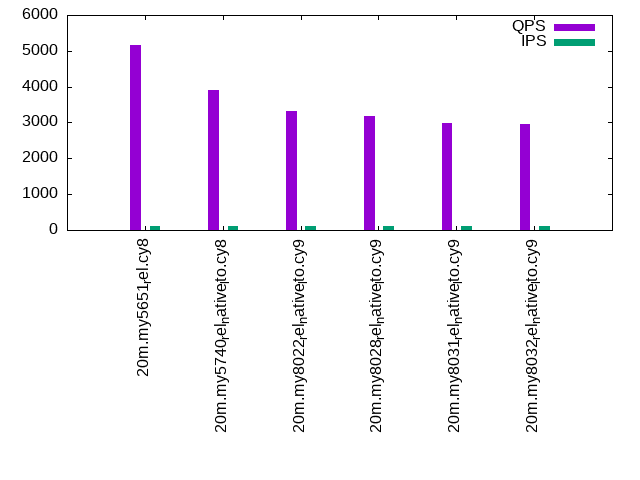
| 20m.my5651_rel.cy8 | 101523 | 109239 | 33389 | 5158 | 5218 | 5141 |
| 20m.my5740_rel_native_lto.cy8 | 83682 | 151128 | 26560 | 3910 | 3942 | 3925 |
| 20m.my8022_rel_native_lto.cy9 | 63091 | 131372 | 22522 | 3315 | 3291 | 3273 |
| 20m.my8028_rel_native_lto.cy9 | 64516 | 158268 | 23895 | 3181 | 3162 | 3152 |
| 20m.my8031_rel_native_lto.cy9 | 60423 | 193269 | 21786 | 2991 | 2911 | 2937 |
| 20m.my8032_rel_native_lto.cy9 | 57143 | 152273 | 20920 | 2946 | 2918 | 2908 |
This table has relative throughput, throughput for the DBMS relative to the DBMS in the first line, using the absolute throughput from the previous table.
| dbms | l.i0 | l.x | l.i1 | q100.1 | q500.1 | q1000.1 |
|---|---|---|---|---|---|---|
| 20m.my5651_rel.cy8 | 1.00 | 1.00 | 1.00 | 1.00 | 1.00 | 1.00 |
| 20m.my5740_rel_native_lto.cy8 | 0.82 | 1.38 | 0.80 | 0.76 | 0.76 | 0.76 |
| 20m.my8022_rel_native_lto.cy9 | 0.62 | 1.20 | 0.67 | 0.64 | 0.63 | 0.64 |
| 20m.my8028_rel_native_lto.cy9 | 0.64 | 1.45 | 0.72 | 0.62 | 0.61 | 0.61 |
| 20m.my8031_rel_native_lto.cy9 | 0.60 | 1.77 | 0.65 | 0.58 | 0.56 | 0.57 |
| 20m.my8032_rel_native_lto.cy9 | 0.56 | 1.39 | 0.63 | 0.57 | 0.56 | 0.57 |
This lists the average rate of inserts/s for the tests that do inserts concurrent with queries. For such tests the query rate is listed in the table above. The read+write tests are setup so that the insert rate should match the target rate every second. Cells that are not at least 95% of the target have a red background to indicate a failure to satisfy the target.
| dbms | q100.1 | q500.1 | q1000.1 |
|---|---|---|---|
| my5651_rel.cy8 | 100 | 499 | 997 |
| my5740_rel_native_lto.cy8 | 100 | 498 | 997 |
| my8022_rel_native_lto.cy9 | 100 | 499 | 997 |
| my8028_rel_native_lto.cy9 | 100 | 499 | 997 |
| my8031_rel_native_lto.cy9 | 100 | 498 | 997 |
| my8032_rel_native_lto.cy9 | 100 | 498 | 997 |
| target | 100 | 500 | 1000 |
l.i0
l.i0: load without secondary indexes. Graphs for performance per 1-second interval are here.
Average throughput:
Insert response time histogram: each cell has the percentage of responses that take <= the time in the header and max is the max response time in seconds. For the max column values in the top 25% of the range have a red background and in the bottom 25% of the range have a green background. The red background is not used when the min value is within 80% of the max value.
| dbms | 256us | 1ms | 4ms | 16ms | 64ms | 256ms | 1s | 4s | 16s | gt | max |
|---|---|---|---|---|---|---|---|---|---|---|---|
| my5651_rel.cy8 | 93.142 | 6.749 | 0.103 | 0.002 | 0.003 | 0.101 | |||||
| my5740_rel_native_lto.cy8 | 2.161 | 97.486 | 0.205 | 0.145 | 0.002 | 0.104 | |||||
| my8022_rel_native_lto.cy9 | 99.581 | 0.238 | 0.178 | 0.004 | 0.097 | ||||||
| my8028_rel_native_lto.cy9 | 99.460 | 0.393 | 0.144 | 0.003 | 0.073 | ||||||
| my8031_rel_native_lto.cy9 | 99.436 | 0.415 | 0.146 | 0.003 | 0.094 | ||||||
| my8032_rel_native_lto.cy9 | 99.414 | 0.441 | 0.142 | 0.003 | 0.070 |
Performance metrics for the DBMS listed above. Some are normalized by throughput, others are not. Legend for results is here.
ips	qps	rps	rmbps	wps	wmbps	rpq	rkbpq	wpi	wkbpi	csps	cpups	cspq	cpupq	dbgb1	dbgb2	rss	maxop	p50	p99	tag
101523	0	888	3.5	53.7	23.1	0.009	0.035	0.001	0.233	11612	22.3	0.114	18	1.3	41.8	2.1	0.101	101887	87502	20m.my5651_rel.cy8
83682	0	0	0.0	131.6	21.3	0.000	0.000	0.002	0.261	8355	21.6	0.100	21	1.3	41.8	2.3	0.104	84701	50745	20m.my5740_rel_native_lto.cy8
63091	0	0	0.0	181.2	18.4	0.000	0.000	0.003	0.299	6560	21.1	0.104	27	1.3	9.9	2.5	0.097	63656	43515	20m.my8022_rel_native_lto.cy9
64516	0	0	0.0	185.0	18.8	0.000	0.000	0.003	0.299	6909	21.6	0.107	27	1.3	9.9	2.5	0.073	64694	57464	20m.my8028_rel_native_lto.cy9
60423	0	0	0.0	190.9	18.3	0.000	0.000	0.003	0.310	6656	20.4	0.110	27	1.3	9.9	2.5	0.094	60550	52941	20m.my8031_rel_native_lto.cy9
57143	0	0	0.0	183.9	17.4	0.000	0.000	0.003	0.312	6383	20.4	0.112	29	1.3	9.9	2.5	0.070	57437	39346	20m.my8032_rel_native_lto.cy9
l.x
l.x: create secondary indexes.
Average throughput:
Performance metrics for the DBMS listed above. Some are normalized by throughput, others are not. Legend for results is here.
ips	qps	rps	rmbps	wps	wmbps	rpq	rkbpq	wpi	wkbpi	csps	cpups	cspq	cpupq	dbgb1	dbgb2	rss	maxop	p50	p99	tag
109239	0	25	0.1	1287.3	114.0	0.000	0.001	0.012	1.068	3921	11.7	0.036	9	2.7	43.2	3.5	0.009	NA	NA	20m.my5651_rel.cy8
151128	0	0	0.0	1661.7	134.2	0.000	0.000	0.011	0.909	9434	13.4	0.062	7	3.0	43.5	3.7	0.019	NA	NA	20m.my5740_rel_native_lto.cy8
131372	0	0	0.0	1048.1	102.9	0.000	0.000	0.008	0.802	6849	12.8	0.052	8	3.0	11.5	3.0	0.019	NA	NA	20m.my8022_rel_native_lto.cy9
158268	0	829	55.5	2879.7	161.2	0.005	0.359	0.018	1.043	10453	43.7	0.066	22	3.0	11.5	3.8	0.011	NA	NA	20m.my8028_rel_native_lto.cy9
193269	0	1036	69.3	2890.9	191.1	0.005	0.367	0.015	1.012	12261	43.7	0.063	18	3.0	11.5	3.9	0.020	NA	NA	20m.my8031_rel_native_lto.cy9
152273	0	797	53.3	2769.8	155.0	0.005	0.359	0.018	1.042	10504	43.2	0.069	23	3.0	11.5	3.9	0.019	NA	NA	20m.my8032_rel_native_lto.cy9
l.i1
l.i1: continue load after secondary indexes created. Graphs for performance per 1-second interval are here.
Average throughput:
Insert response time histogram: each cell has the percentage of responses that take <= the time in the header and max is the max response time in seconds. For the max column values in the top 25% of the range have a red background and in the bottom 25% of the range have a green background. The red background is not used when the min value is within 80% of the max value.
| dbms | 256us | 1ms | 4ms | 16ms | 64ms | 256ms | 1s | 4s | 16s | gt | max |
|---|---|---|---|---|---|---|---|---|---|---|---|
| my5651_rel.cy8 | 99.438 | 0.556 | 0.006 | nonzero | 0.093 | ||||||
| my5740_rel_native_lto.cy8 | 98.867 | 0.904 | 0.229 | 0.001 | 0.067 | ||||||
| my8022_rel_native_lto.cy9 | 98.837 | 0.786 | 0.368 | 0.009 | 0.077 | ||||||
| my8028_rel_native_lto.cy9 | 98.721 | 0.997 | 0.281 | 0.001 | 0.092 | ||||||
| my8031_rel_native_lto.cy9 | 98.599 | 1.094 | 0.306 | 0.002 | 0.079 | ||||||
| my8032_rel_native_lto.cy9 | 98.561 | 1.132 | 0.306 | nonzero | 0.070 |
Performance metrics for the DBMS listed above. Some are normalized by throughput, others are not. Legend for results is here.
ips	qps	rps	rmbps	wps	wmbps	rpq	rkbpq	wpi	wkbpi	csps	cpups	cspq	cpupq	dbgb1	dbgb2	rss	maxop	p50	p99	tag
33389	0	587	2.3	94.1	21.5	0.018	0.070	0.003	0.659	7900	17.3	0.237	41	7.9	48.4	7.9	0.093	34311	8391	20m.my5651_rel.cy8
26560	0	0	0.0	612.0	32.6	0.000	0.000	0.023	1.255	7157	16.1	0.269	48	7.9	48.4	8.2	0.067	27169	5193	20m.my5740_rel_native_lto.cy8
22522	0	104	1.6	900.2	34.9	0.005	0.074	0.040	1.586	6805	15.5	0.302	55	7.9	16.4	8.3	0.077	23624	1099	20m.my8022_rel_native_lto.cy9
23895	0	110	1.7	937.9	36.6	0.005	0.074	0.039	1.568	8025	15.9	0.336	53	7.9	16.4	8.3	0.092	24623	1548	20m.my8028_rel_native_lto.cy9
21786	0	101	1.6	957.0	37.7	0.005	0.074	0.044	1.773	7863	15.8	0.361	58	7.9	16.4	8.3	0.079	22425	1599	20m.my8031_rel_native_lto.cy9
20920	0	96	1.5	925.5	36.4	0.005	0.074	0.044	1.781	7605	15.5	0.364	59	7.9	16.4	8.3	0.070	21587	1649	20m.my8032_rel_native_lto.cy9
q100.1
q100.1: range queries with 100 insert/s per client. Graphs for performance per 1-second interval are here.
Average throughput:
Query response time histogram: each cell has the percentage of responses that take <= the time in the header and max is the max response time in seconds. For max values in the top 25% of the range have a red background and in the bottom 25% of the range have a green background. The red background is not used when the min value is within 80% of the max value.
| dbms | 256us | 1ms | 4ms | 16ms | 64ms | 256ms | 1s | 4s | 16s | gt | max |
|---|---|---|---|---|---|---|---|---|---|---|---|
| my5651_rel.cy8 | 94.306 | 5.691 | 0.001 | 0.002 | 0.012 | ||||||
| my5740_rel_native_lto.cy8 | 65.268 | 34.732 | nonzero | nonzero | 0.015 | ||||||
| my8022_rel_native_lto.cy9 | 33.847 | 66.152 | nonzero | nonzero | nonzero | 0.025 | |||||
| my8028_rel_native_lto.cy9 | 28.701 | 71.298 | nonzero | nonzero | nonzero | 0.017 | |||||
| my8031_rel_native_lto.cy9 | 20.410 | 79.590 | nonzero | nonzero | nonzero | 0.023 | |||||
| my8032_rel_native_lto.cy9 | 16.936 | 83.063 | nonzero | nonzero | nonzero | 0.017 |
Insert response time histogram: each cell has the percentage of responses that take <= the time in the header and max is the max response time in seconds. For max values in the top 25% of the range have a red background and in the bottom 25% of the range have a green background. The red background is not used when the min value is within 80% of the max value.
| dbms | 256us | 1ms | 4ms | 16ms | 64ms | 256ms | 1s | 4s | 16s | gt | max |
|---|---|---|---|---|---|---|---|---|---|---|---|
| my5651_rel.cy8 | 56.667 | 43.250 | 0.083 | 0.019 | |||||||
| my5740_rel_native_lto.cy8 | 98.861 | 0.750 | 0.389 | 0.028 | |||||||
| my8022_rel_native_lto.cy9 | 98.861 | 0.444 | 0.694 | 0.028 | |||||||
| my8028_rel_native_lto.cy9 | 99.167 | 0.194 | 0.639 | 0.022 | |||||||
| my8031_rel_native_lto.cy9 | 98.972 | 0.444 | 0.583 | 0.027 | |||||||
| my8032_rel_native_lto.cy9 | 98.583 | 0.778 | 0.639 | 0.025 |
Performance metrics for the DBMS listed above. Some are normalized by throughput, others are not. Legend for results is here.
ips	qps	rps	rmbps	wps	wmbps	rpq	rkbpq	wpi	wkbpi	csps	cpups	cspq	cpupq	dbgb1	dbgb2	rss	maxop	p50	p99	tag
100	5158	2	0.0	172.7	5.2	0.000	0.001	1.731	53.483	20425	12.9	3.960	200	8.0	48.5	8.0	0.012	5129	4971	20m.my5651_rel.cy8
100	3910	0	0.0	34.4	0.9	0.000	0.000	0.346	9.499	15244	12.5	3.899	256	8.0	48.5	8.2	0.015	3882	3676	20m.my5740_rel_native_lto.cy8
100	3315	0	0.0	157.5	3.9	0.000	0.000	1.580	40.084	13175	12.6	3.974	304	8.0	16.5	8.4	0.025	3308	3117	20m.my8022_rel_native_lto.cy9
100	3181	0	0.0	160.4	3.9	0.000	0.000	1.608	40.537	12851	12.9	4.041	324	8.0	16.5	8.4	0.017	3165	3036	20m.my8028_rel_native_lto.cy9
100	2991	0	0.0	182.0	4.5	0.000	0.000	1.828	46.269	12407	12.8	4.148	342	8.0	16.5	8.4	0.023	2975	2844	20m.my8031_rel_native_lto.cy9
100	2946	0	0.0	184.5	4.6	0.000	0.000	1.850	46.800	12259	12.8	4.160	348	8.0	16.5	8.4	0.017	2925	2781	20m.my8032_rel_native_lto.cy9
q500.1
q500.1: range queries with 500 insert/s per client. Graphs for performance per 1-second interval are here.
Average throughput:
Query response time histogram: each cell has the percentage of responses that take <= the time in the header and max is the max response time in seconds. For max values in the top 25% of the range have a red background and in the bottom 25% of the range have a green background. The red background is not used when the min value is within 80% of the max value.
| dbms | 256us | 1ms | 4ms | 16ms | 64ms | 256ms | 1s | 4s | 16s | gt | max |
|---|---|---|---|---|---|---|---|---|---|---|---|
| my5651_rel.cy8 | 94.665 | 5.331 | 0.002 | 0.002 | 0.011 | ||||||
| my5740_rel_native_lto.cy8 | 65.939 | 34.061 | nonzero | nonzero | nonzero | 0.019 | |||||
| my8022_rel_native_lto.cy9 | 32.447 | 67.551 | 0.001 | nonzero | nonzero | 0.025 | |||||
| my8028_rel_native_lto.cy9 | 27.688 | 72.310 | 0.001 | 0.001 | nonzero | 0.021 | |||||
| my8031_rel_native_lto.cy9 | 15.760 | 84.239 | 0.001 | 0.001 | nonzero | 0.020 | |||||
| my8032_rel_native_lto.cy9 | 14.606 | 85.392 | nonzero | 0.001 | nonzero | 0.018 |
Insert response time histogram: each cell has the percentage of responses that take <= the time in the header and max is the max response time in seconds. For max values in the top 25% of the range have a red background and in the bottom 25% of the range have a green background. The red background is not used when the min value is within 80% of the max value.
| dbms | 256us | 1ms | 4ms | 16ms | 64ms | 256ms | 1s | 4s | 16s | gt | max |
|---|---|---|---|---|---|---|---|---|---|---|---|
| my5651_rel.cy8 | 90.033 | 9.961 | 0.006 | 0.017 | |||||||
| my5740_rel_native_lto.cy8 | 99.033 | 0.478 | 0.489 | 0.030 | |||||||
| my8022_rel_native_lto.cy9 | 98.983 | 0.428 | 0.589 | 0.036 | |||||||
| my8028_rel_native_lto.cy9 | 99.139 | 0.428 | 0.433 | 0.027 | |||||||
| my8031_rel_native_lto.cy9 | 99.122 | 0.317 | 0.561 | 0.028 | |||||||
| my8032_rel_native_lto.cy9 | 99.072 | 0.394 | 0.533 | 0.026 |
Performance metrics for the DBMS listed above. Some are normalized by throughput, others are not. Legend for results is here.
ips	qps	rps	rmbps	wps	wmbps	rpq	rkbpq	wpi	wkbpi	csps	cpups	cspq	cpupq	dbgb1	dbgb2	rss	maxop	p50	p99	tag
499	5218	9	0.0	2.7	0.4	0.002	0.007	0.005	0.908	20163	12.9	3.864	198	8.4	48.9	8.3	0.011	5178	5019	20m.my5651_rel.cy8
498	3942	0	0.0	26.1	1.0	0.000	0.000	0.052	2.032	15420	13.1	3.912	266	8.4	48.9	8.6	0.019	3916	3692	20m.my5740_rel_native_lto.cy8
499	3291	0	0.0	43.7	1.3	0.000	0.000	0.088	2.764	12928	13.2	3.928	321	8.4	16.9	8.8	0.025	3276	3117	20m.my8022_rel_native_lto.cy9
499	3162	0	0.0	42.1	1.3	0.000	0.000	0.084	2.663	12469	13.3	3.944	337	8.4	17.0	8.8	0.021	3149	3021	20m.my8028_rel_native_lto.cy9
498	2911	0	0.0	52.6	1.7	0.000	0.000	0.106	3.408	11736	13.3	4.031	365	8.4	17.0	8.8	0.020	2908	2781	20m.my8031_rel_native_lto.cy9
498	2918	0	0.0	47.5	1.5	0.000	0.000	0.095	3.111	11775	13.4	4.036	367	8.4	17.0	8.8	0.018	2909	2797	20m.my8032_rel_native_lto.cy9
q1000.1
q1000.1: range queries with 1000 insert/s per client. Graphs for performance per 1-second interval are here.
Average throughput:
Query response time histogram: each cell has the percentage of responses that take <= the time in the header and max is the max response time in seconds. For max values in the top 25% of the range have a red background and in the bottom 25% of the range have a green background. The red background is not used when the min value is within 80% of the max value.
| dbms | 256us | 1ms | 4ms | 16ms | 64ms | 256ms | 1s | 4s | 16s | gt | max |
|---|---|---|---|---|---|---|---|---|---|---|---|
| my5651_rel.cy8 | 93.912 | 6.084 | 0.002 | 0.002 | 0.011 | ||||||
| my5740_rel_native_lto.cy8 | 65.516 | 34.484 | nonzero | nonzero | nonzero | 0.018 | |||||
| my8022_rel_native_lto.cy9 | 31.884 | 68.115 | 0.001 | nonzero | 0.001 | 0.029 | |||||
| my8028_rel_native_lto.cy9 | 27.716 | 72.283 | 0.001 | nonzero | nonzero | 0.019 | |||||
| my8031_rel_native_lto.cy9 | 16.314 | 83.684 | 0.001 | 0.001 | nonzero | 0.026 | |||||
| my8032_rel_native_lto.cy9 | 13.649 | 86.349 | 0.001 | 0.001 | nonzero | 0.018 |
Insert response time histogram: each cell has the percentage of responses that take <= the time in the header and max is the max response time in seconds. For max values in the top 25% of the range have a red background and in the bottom 25% of the range have a green background. The red background is not used when the min value is within 80% of the max value.
| dbms | 256us | 1ms | 4ms | 16ms | 64ms | 256ms | 1s | 4s | 16s | gt | max |
|---|---|---|---|---|---|---|---|---|---|---|---|
| my5651_rel.cy8 | 94.831 | 5.169 | 0.016 | ||||||||
| my5740_rel_native_lto.cy8 | 99.361 | 0.411 | 0.228 | 0.023 | |||||||
| my8022_rel_native_lto.cy9 | 99.314 | 0.369 | 0.317 | 0.034 | |||||||
| my8028_rel_native_lto.cy9 | 99.392 | 0.333 | 0.275 | 0.027 | |||||||
| my8031_rel_native_lto.cy9 | 99.183 | 0.558 | 0.258 | 0.031 | |||||||
| my8032_rel_native_lto.cy9 | 99.194 | 0.544 | 0.261 | 0.027 |
Performance metrics for the DBMS listed above. Some are normalized by throughput, others are not. Legend for results is here.
ips	qps	rps	rmbps	wps	wmbps	rpq	rkbpq	wpi	wkbpi	csps	cpups	cspq	cpupq	dbgb1	dbgb2	rss	maxop	p50	p99	tag
997	5141	18	0.1	3.0	0.6	0.003	0.014	0.003	0.613	20018	13.0	3.894	202	8.8	49.3	8.7	0.011	5116	4970	20m.my5651_rel.cy8
997	3925	0	0.0	40.6	1.5	0.000	0.000	0.041	1.496	15496	13.6	3.948	277	8.9	49.4	9.0	0.018	3884	3645	20m.my5740_rel_native_lto.cy8
997	3273	0	0.0	85.5	2.6	0.000	0.000	0.086	2.634	13050	13.4	3.987	328	8.8	17.4	9.2	0.029	3260	3102	20m.my8022_rel_native_lto.cy9
997	3152	0	0.0	96.8	2.9	0.000	0.000	0.097	2.950	12692	13.5	4.027	343	8.8	17.4	9.2	0.019	3134	3020	20m.my8028_rel_native_lto.cy9
997	2937	0	0.0	157.2	4.4	0.000	0.000	0.158	4.558	12257	13.5	4.173	368	8.8	17.4	9.2	0.026	2925	2797	20m.my8031_rel_native_lto.cy9
997	2908	0	0.0	155.4	4.4	0.000	0.000	0.156	4.512	12167	13.5	4.183	371	8.8	17.4	9.2	0.018	2893	2749	20m.my8032_rel_native_lto.cy9
l.i0
l.i0: load without secondary indexes
Performance metrics for all DBMS, not just the ones listed above. Some are normalized by throughput, others are not. Legend for results is here.
ips	qps	rps	rmbps	wps	wmbps	rpq	rkbpq	wpi	wkbpi	csps	cpups	cspq	cpupq	dbgb1	dbgb2	rss	maxop	p50	p99	tag
101523	0	888	3.5	53.7	23.1	0.009	0.035	0.001	0.233	11612	22.3	0.114	18	1.3	41.8	2.1	0.101	101887	87502	20m.my5651_rel.cy8
83682	0	0	0.0	131.6	21.3	0.000	0.000	0.002	0.261	8355	21.6	0.100	21	1.3	41.8	2.3	0.104	84701	50745	20m.my5740_rel_native_lto.cy8
63091	0	0	0.0	181.2	18.4	0.000	0.000	0.003	0.299	6560	21.1	0.104	27	1.3	9.9	2.5	0.097	63656	43515	20m.my8022_rel_native_lto.cy9
64516	0	0	0.0	185.0	18.8	0.000	0.000	0.003	0.299	6909	21.6	0.107	27	1.3	9.9	2.5	0.073	64694	57464	20m.my8028_rel_native_lto.cy9
60423	0	0	0.0	190.9	18.3	0.000	0.000	0.003	0.310	6656	20.4	0.110	27	1.3	9.9	2.5	0.094	60550	52941	20m.my8031_rel_native_lto.cy9
57143	0	0	0.0	183.9	17.4	0.000	0.000	0.003	0.312	6383	20.4	0.112	29	1.3	9.9	2.5	0.070	57437	39346	20m.my8032_rel_native_lto.cy9
l.x
l.x: create secondary indexes
Performance metrics for all DBMS, not just the ones listed above. Some are normalized by throughput, others are not. Legend for results is here.
ips	qps	rps	rmbps	wps	wmbps	rpq	rkbpq	wpi	wkbpi	csps	cpups	cspq	cpupq	dbgb1	dbgb2	rss	maxop	p50	p99	tag
109239	0	25	0.1	1287.3	114.0	0.000	0.001	0.012	1.068	3921	11.7	0.036	9	2.7	43.2	3.5	0.009	NA	NA	20m.my5651_rel.cy8
151128	0	0	0.0	1661.7	134.2	0.000	0.000	0.011	0.909	9434	13.4	0.062	7	3.0	43.5	3.7	0.019	NA	NA	20m.my5740_rel_native_lto.cy8
131372	0	0	0.0	1048.1	102.9	0.000	0.000	0.008	0.802	6849	12.8	0.052	8	3.0	11.5	3.0	0.019	NA	NA	20m.my8022_rel_native_lto.cy9
158268	0	829	55.5	2879.7	161.2	0.005	0.359	0.018	1.043	10453	43.7	0.066	22	3.0	11.5	3.8	0.011	NA	NA	20m.my8028_rel_native_lto.cy9
193269	0	1036	69.3	2890.9	191.1	0.005	0.367	0.015	1.012	12261	43.7	0.063	18	3.0	11.5	3.9	0.020	NA	NA	20m.my8031_rel_native_lto.cy9
152273	0	797	53.3	2769.8	155.0	0.005	0.359	0.018	1.042	10504	43.2	0.069	23	3.0	11.5	3.9	0.019	NA	NA	20m.my8032_rel_native_lto.cy9
l.i1
l.i1: continue load after secondary indexes created
Performance metrics for all DBMS, not just the ones listed above. Some are normalized by throughput, others are not. Legend for results is here.
ips	qps	rps	rmbps	wps	wmbps	rpq	rkbpq	wpi	wkbpi	csps	cpups	cspq	cpupq	dbgb1	dbgb2	rss	maxop	p50	p99	tag
33389	0	587	2.3	94.1	21.5	0.018	0.070	0.003	0.659	7900	17.3	0.237	41	7.9	48.4	7.9	0.093	34311	8391	20m.my5651_rel.cy8
26560	0	0	0.0	612.0	32.6	0.000	0.000	0.023	1.255	7157	16.1	0.269	48	7.9	48.4	8.2	0.067	27169	5193	20m.my5740_rel_native_lto.cy8
22522	0	104	1.6	900.2	34.9	0.005	0.074	0.040	1.586	6805	15.5	0.302	55	7.9	16.4	8.3	0.077	23624	1099	20m.my8022_rel_native_lto.cy9
23895	0	110	1.7	937.9	36.6	0.005	0.074	0.039	1.568	8025	15.9	0.336	53	7.9	16.4	8.3	0.092	24623	1548	20m.my8028_rel_native_lto.cy9
21786	0	101	1.6	957.0	37.7	0.005	0.074	0.044	1.773	7863	15.8	0.361	58	7.9	16.4	8.3	0.079	22425	1599	20m.my8031_rel_native_lto.cy9
20920	0	96	1.5	925.5	36.4	0.005	0.074	0.044	1.781	7605	15.5	0.364	59	7.9	16.4	8.3	0.070	21587	1649	20m.my8032_rel_native_lto.cy9
q100.1
q100.1: range queries with 100 insert/s per client
Performance metrics for all DBMS, not just the ones listed above. Some are normalized by throughput, others are not. Legend for results is here.
ips	qps	rps	rmbps	wps	wmbps	rpq	rkbpq	wpi	wkbpi	csps	cpups	cspq	cpupq	dbgb1	dbgb2	rss	maxop	p50	p99	tag
100	5158	2	0.0	172.7	5.2	0.000	0.001	1.731	53.483	20425	12.9	3.960	200	8.0	48.5	8.0	0.012	5129	4971	20m.my5651_rel.cy8
100	3910	0	0.0	34.4	0.9	0.000	0.000	0.346	9.499	15244	12.5	3.899	256	8.0	48.5	8.2	0.015	3882	3676	20m.my5740_rel_native_lto.cy8
100	3315	0	0.0	157.5	3.9	0.000	0.000	1.580	40.084	13175	12.6	3.974	304	8.0	16.5	8.4	0.025	3308	3117	20m.my8022_rel_native_lto.cy9
100	3181	0	0.0	160.4	3.9	0.000	0.000	1.608	40.537	12851	12.9	4.041	324	8.0	16.5	8.4	0.017	3165	3036	20m.my8028_rel_native_lto.cy9
100	2991	0	0.0	182.0	4.5	0.000	0.000	1.828	46.269	12407	12.8	4.148	342	8.0	16.5	8.4	0.023	2975	2844	20m.my8031_rel_native_lto.cy9
100	2946	0	0.0	184.5	4.6	0.000	0.000	1.850	46.800	12259	12.8	4.160	348	8.0	16.5	8.4	0.017	2925	2781	20m.my8032_rel_native_lto.cy9
q500.1
q500.1: range queries with 500 insert/s per client
Performance metrics for all DBMS, not just the ones listed above. Some are normalized by throughput, others are not. Legend for results is here.
ips	qps	rps	rmbps	wps	wmbps	rpq	rkbpq	wpi	wkbpi	csps	cpups	cspq	cpupq	dbgb1	dbgb2	rss	maxop	p50	p99	tag
499	5218	9	0.0	2.7	0.4	0.002	0.007	0.005	0.908	20163	12.9	3.864	198	8.4	48.9	8.3	0.011	5178	5019	20m.my5651_rel.cy8
498	3942	0	0.0	26.1	1.0	0.000	0.000	0.052	2.032	15420	13.1	3.912	266	8.4	48.9	8.6	0.019	3916	3692	20m.my5740_rel_native_lto.cy8
499	3291	0	0.0	43.7	1.3	0.000	0.000	0.088	2.764	12928	13.2	3.928	321	8.4	16.9	8.8	0.025	3276	3117	20m.my8022_rel_native_lto.cy9
499	3162	0	0.0	42.1	1.3	0.000	0.000	0.084	2.663	12469	13.3	3.944	337	8.4	17.0	8.8	0.021	3149	3021	20m.my8028_rel_native_lto.cy9
498	2911	0	0.0	52.6	1.7	0.000	0.000	0.106	3.408	11736	13.3	4.031	365	8.4	17.0	8.8	0.020	2908	2781	20m.my8031_rel_native_lto.cy9
498	2918	0	0.0	47.5	1.5	0.000	0.000	0.095	3.111	11775	13.4	4.036	367	8.4	17.0	8.8	0.018	2909	2797	20m.my8032_rel_native_lto.cy9
q1000.1
q1000.1: range queries with 1000 insert/s per client
Performance metrics for all DBMS, not just the ones listed above. Some are normalized by throughput, others are not. Legend for results is here.
ips	qps	rps	rmbps	wps	wmbps	rpq	rkbpq	wpi	wkbpi	csps	cpups	cspq	cpupq	dbgb1	dbgb2	rss	maxop	p50	p99	tag
997	5141	18	0.1	3.0	0.6	0.003	0.014	0.003	0.613	20018	13.0	3.894	202	8.8	49.3	8.7	0.011	5116	4970	20m.my5651_rel.cy8
997	3925	0	0.0	40.6	1.5	0.000	0.000	0.041	1.496	15496	13.6	3.948	277	8.9	49.4	9.0	0.018	3884	3645	20m.my5740_rel_native_lto.cy8
997	3273	0	0.0	85.5	2.6	0.000	0.000	0.086	2.634	13050	13.4	3.987	328	8.8	17.4	9.2	0.029	3260	3102	20m.my8022_rel_native_lto.cy9
997	3152	0	0.0	96.8	2.9	0.000	0.000	0.097	2.950	12692	13.5	4.027	343	8.8	17.4	9.2	0.019	3134	3020	20m.my8028_rel_native_lto.cy9
997	2937	0	0.0	157.2	4.4	0.000	0.000	0.158	4.558	12257	13.5	4.173	368	8.8	17.4	9.2	0.026	2925	2797	20m.my8031_rel_native_lto.cy9
997	2908	0	0.0	155.4	4.4	0.000	0.000	0.156	4.512	12167	13.5	4.183	371	8.8	17.4	9.2	0.018	2893	2749	20m.my8032_rel_native_lto.cy9
l.i0
- l.i0: load without secondary indexes
- Legend for results is here.
- Each entry lists the percentage of responses that fit in that bucket (slower than max time for previous bucket, faster than min time for next bucket).
Insert response time histogram
256us	1ms	4ms	16ms	64ms	256ms	1s	4s	16s	gt	max	tag
0.000	93.142	6.749	0.103	0.002	0.003	0.000	0.000	0.000	0.000	0.101	my5651_rel.cy8
0.000	2.161	97.486	0.205	0.145	0.002	0.000	0.000	0.000	0.000	0.104	my5740_rel_native_lto.cy8
0.000	0.000	99.581	0.238	0.178	0.004	0.000	0.000	0.000	0.000	0.097	my8022_rel_native_lto.cy9
0.000	0.000	99.460	0.393	0.144	0.003	0.000	0.000	0.000	0.000	0.073	my8028_rel_native_lto.cy9
0.000	0.000	99.436	0.415	0.146	0.003	0.000	0.000	0.000	0.000	0.094	my8031_rel_native_lto.cy9
0.000	0.000	99.414	0.441	0.142	0.003	0.000	0.000	0.000	0.000	0.070	my8032_rel_native_lto.cy9
l.x
- l.x: create secondary indexes
- Legend for results is here.
- Each entry lists the percentage of responses that fit in that bucket (slower than max time for previous bucket, faster than min time for next bucket).
TODO - determine whether there is data for create index response time
l.i1
- l.i1: continue load after secondary indexes created
- Legend for results is here.
- Each entry lists the percentage of responses that fit in that bucket (slower than max time for previous bucket, faster than min time for next bucket).
Insert response time histogram
256us	1ms	4ms	16ms	64ms	256ms	1s	4s	16s	gt	max	tag
0.000	0.000	99.438	0.556	0.006	nonzero	0.000	0.000	0.000	0.000	0.093	my5651_rel.cy8
0.000	0.000	98.867	0.904	0.229	0.001	0.000	0.000	0.000	0.000	0.067	my5740_rel_native_lto.cy8
0.000	0.000	98.837	0.786	0.368	0.009	0.000	0.000	0.000	0.000	0.077	my8022_rel_native_lto.cy9
0.000	0.000	98.721	0.997	0.281	0.001	0.000	0.000	0.000	0.000	0.092	my8028_rel_native_lto.cy9
0.000	0.000	98.599	1.094	0.306	0.002	0.000	0.000	0.000	0.000	0.079	my8031_rel_native_lto.cy9
0.000	0.000	98.561	1.132	0.306	nonzero	0.000	0.000	0.000	0.000	0.070	my8032_rel_native_lto.cy9
q100.1
- q100.1: range queries with 100 insert/s per client
- Legend for results is here.
- Each entry lists the percentage of responses that fit in that bucket (slower than max time for previous bucket, faster than min time for next bucket).
Query response time histogram
256us	1ms	4ms	16ms	64ms	256ms	1s	4s	16s	gt	max	tag
94.306	5.691	0.001	0.002	0.000	0.000	0.000	0.000	0.000	0.000	0.012	my5651_rel.cy8
65.268	34.732	nonzero	nonzero	0.000	0.000	0.000	0.000	0.000	0.000	0.015	my5740_rel_native_lto.cy8
33.847	66.152	nonzero	nonzero	nonzero	0.000	0.000	0.000	0.000	0.000	0.025	my8022_rel_native_lto.cy9
28.701	71.298	nonzero	nonzero	nonzero	0.000	0.000	0.000	0.000	0.000	0.017	my8028_rel_native_lto.cy9
20.410	79.590	nonzero	nonzero	nonzero	0.000	0.000	0.000	0.000	0.000	0.023	my8031_rel_native_lto.cy9
16.936	83.063	nonzero	nonzero	nonzero	0.000	0.000	0.000	0.000	0.000	0.017	my8032_rel_native_lto.cy9
Insert response time histogram
256us	1ms	4ms	16ms	64ms	256ms	1s	4s	16s	gt	max	tag
0.000	0.000	56.667	43.250	0.083	0.000	0.000	0.000	0.000	0.000	0.019	my5651_rel.cy8
0.000	0.000	98.861	0.750	0.389	0.000	0.000	0.000	0.000	0.000	0.028	my5740_rel_native_lto.cy8
0.000	0.000	98.861	0.444	0.694	0.000	0.000	0.000	0.000	0.000	0.028	my8022_rel_native_lto.cy9
0.000	0.000	99.167	0.194	0.639	0.000	0.000	0.000	0.000	0.000	0.022	my8028_rel_native_lto.cy9
0.000	0.000	98.972	0.444	0.583	0.000	0.000	0.000	0.000	0.000	0.027	my8031_rel_native_lto.cy9
0.000	0.000	98.583	0.778	0.639	0.000	0.000	0.000	0.000	0.000	0.025	my8032_rel_native_lto.cy9
q500.1
- q500.1: range queries with 500 insert/s per client
- Legend for results is here.
- Each entry lists the percentage of responses that fit in that bucket (slower than max time for previous bucket, faster than min time for next bucket).
Query response time histogram
256us	1ms	4ms	16ms	64ms	256ms	1s	4s	16s	gt	max	tag
94.665	5.331	0.002	0.002	0.000	0.000	0.000	0.000	0.000	0.000	0.011	my5651_rel.cy8
65.939	34.061	nonzero	nonzero	nonzero	0.000	0.000	0.000	0.000	0.000	0.019	my5740_rel_native_lto.cy8
32.447	67.551	0.001	nonzero	nonzero	0.000	0.000	0.000	0.000	0.000	0.025	my8022_rel_native_lto.cy9
27.688	72.310	0.001	0.001	nonzero	0.000	0.000	0.000	0.000	0.000	0.021	my8028_rel_native_lto.cy9
15.760	84.239	0.001	0.001	nonzero	0.000	0.000	0.000	0.000	0.000	0.020	my8031_rel_native_lto.cy9
14.606	85.392	nonzero	0.001	nonzero	0.000	0.000	0.000	0.000	0.000	0.018	my8032_rel_native_lto.cy9
Insert response time histogram
256us	1ms	4ms	16ms	64ms	256ms	1s	4s	16s	gt	max	tag
0.000	0.000	90.033	9.961	0.006	0.000	0.000	0.000	0.000	0.000	0.017	my5651_rel.cy8
0.000	0.000	99.033	0.478	0.489	0.000	0.000	0.000	0.000	0.000	0.030	my5740_rel_native_lto.cy8
0.000	0.000	98.983	0.428	0.589	0.000	0.000	0.000	0.000	0.000	0.036	my8022_rel_native_lto.cy9
0.000	0.000	99.139	0.428	0.433	0.000	0.000	0.000	0.000	0.000	0.027	my8028_rel_native_lto.cy9
0.000	0.000	99.122	0.317	0.561	0.000	0.000	0.000	0.000	0.000	0.028	my8031_rel_native_lto.cy9
0.000	0.000	99.072	0.394	0.533	0.000	0.000	0.000	0.000	0.000	0.026	my8032_rel_native_lto.cy9
q1000.1
- q1000.1: range queries with 1000 insert/s per client
- Legend for results is here.
- Each entry lists the percentage of responses that fit in that bucket (slower than max time for previous bucket, faster than min time for next bucket).
Query response time histogram
256us	1ms	4ms	16ms	64ms	256ms	1s	4s	16s	gt	max	tag
93.912	6.084	0.002	0.002	0.000	0.000	0.000	0.000	0.000	0.000	0.011	my5651_rel.cy8
65.516	34.484	nonzero	nonzero	nonzero	0.000	0.000	0.000	0.000	0.000	0.018	my5740_rel_native_lto.cy8
31.884	68.115	0.001	nonzero	0.001	0.000	0.000	0.000	0.000	0.000	0.029	my8022_rel_native_lto.cy9
27.716	72.283	0.001	nonzero	nonzero	0.000	0.000	0.000	0.000	0.000	0.019	my8028_rel_native_lto.cy9
16.314	83.684	0.001	0.001	nonzero	0.000	0.000	0.000	0.000	0.000	0.026	my8031_rel_native_lto.cy9
13.649	86.349	0.001	0.001	nonzero	0.000	0.000	0.000	0.000	0.000	0.018	my8032_rel_native_lto.cy9
Insert response time histogram
256us	1ms	4ms	16ms	64ms	256ms	1s	4s	16s	gt	max	tag
0.000	0.000	94.831	5.169	0.000	0.000	0.000	0.000	0.000	0.000	0.016	my5651_rel.cy8
0.000	0.000	99.361	0.411	0.228	0.000	0.000	0.000	0.000	0.000	0.023	my5740_rel_native_lto.cy8
0.000	0.000	99.314	0.369	0.317	0.000	0.000	0.000	0.000	0.000	0.034	my8022_rel_native_lto.cy9
0.000	0.000	99.392	0.333	0.275	0.000	0.000	0.000	0.000	0.000	0.027	my8028_rel_native_lto.cy9
0.000	0.000	99.183	0.558	0.258	0.000	0.000	0.000	0.000	0.000	0.031	my8031_rel_native_lto.cy9
0.000	0.000	99.194	0.544	0.261	0.000	0.000	0.000	0.000	0.000	0.027	my8032_rel_native_lto.cy9