Introduction
This is a report for the insert benchmark with 20M docs and 1 client(s). It is generated by scripts (bash, awk, sed) and Tufte might not be impressed. An overview of the insert benchmark is here and a short update is here. Below, by DBMS, I mean DBMS+version.config. An example is my8020.c10b40 where my means MySQL, 8020 is version 8.0.20 and c10b40 is the name for the configuration file.
The test server has 8 AMD cores, 16G RAM and an NVMe SSD. It is described here as the Beelink. The benchmark was run with 1 client and there were 1 or 2 connections per client (1 for queries, 1 for inserts). The benchmark loads 20M rows without secondary indexes, creates secondary indexes, loads another 20M rows then does 3 read+write tests for one hour each that do queries as fast as possible with 100, 500 and then 1000 writes/second/client concurrent with the queries. There is 1 table. The database is cached by the OS but not by InnoDB. Clients and the DBMS share one server. The per-database configs are in the per-database subdirectories here.
The tested DBMS are:
- my5651_rel.cy8_1g - InnoDB and MySQL 5.6.51, the cy8_1g config and compiled with CMAKE_BUILD_TYPE=Release -O3
- my5740_rel_native_lto.cy8_1g - InnoDB and MySQL 5.7.40, the cy8_1g config and compiled with CMAKE_BUILD_TYPE=Release -O3 -flto
- my8022_rel_native_lto.cy9_1g - InnoDB and MySQL 8.0.22, the cy9_1g config and compiled with CMAKE_BUILD_TYPE=Release -O3 -flto
- my8028_rel_native_lto.cy9_1g - InnoDB and MySQL 8.0.28, the cy9_1g config and compiled with CMAKE_BUILD_TYPE=Release -O3 -flto
- my8031_rel_native_lto.cy9_1g - InnoDB and MySQL 8.0.31, the cy9_1g config and compiled with CMAKE_BUILD_TYPE=Release -O3 -flto
- my8032_rel_native_lto.cy9_1g - InnoDB and MySQL 8.0.32, the cy9_1g config and compiled with CMAKE_BUILD_TYPE=Release -O3 -flto
Contents
- Summary
- l.i0: load without secondary indexes
- l.x: create secondary indexes
- l.i1: continue load after secondary indexes created
- q100.1: range queries with 100 insert/s per client
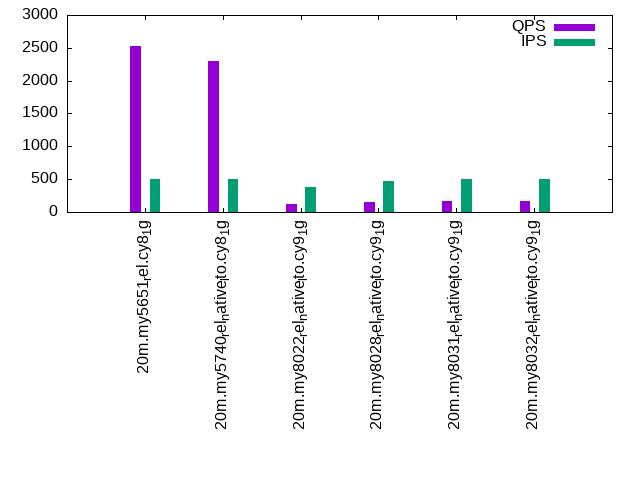
- q500.1: range queries with 500 insert/s per client
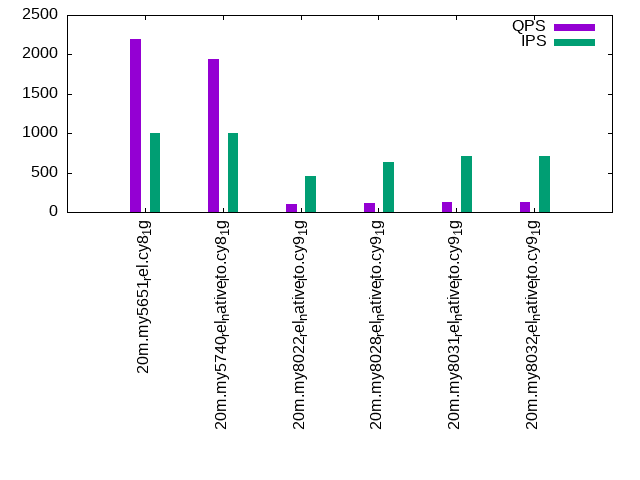
- q1000.1: range queries with 1000 insert/s per client
Summary
The numbers are inserts/s for l.i0 and l.i1, indexed docs (or rows) /s for l.x and queries/s for q*.2. The values are the average rate over the entire test for inserts (IPS) and queries (QPS). The range of values for IPS and QPS is split into 3 parts: bottom 25%, middle 50%, top 25%. Values in the bottom 25% have a red background, values in the top 25% have a green background and values in the middle have no color. A gray background is used for values that can be ignored because the DBMS did not sustain the target insert rate. Red backgrounds are not used when the minimum value is within 80% of the max value.
| dbms | l.i0 | l.x | l.i1 | q100.1 | q500.1 | q1000.1 |
|---|---|---|---|---|---|---|
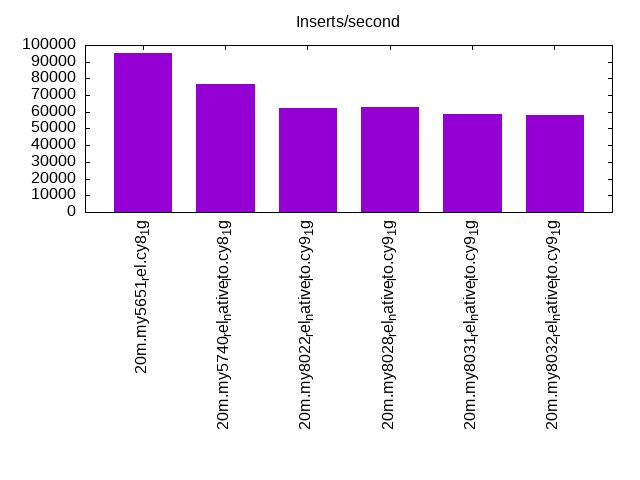
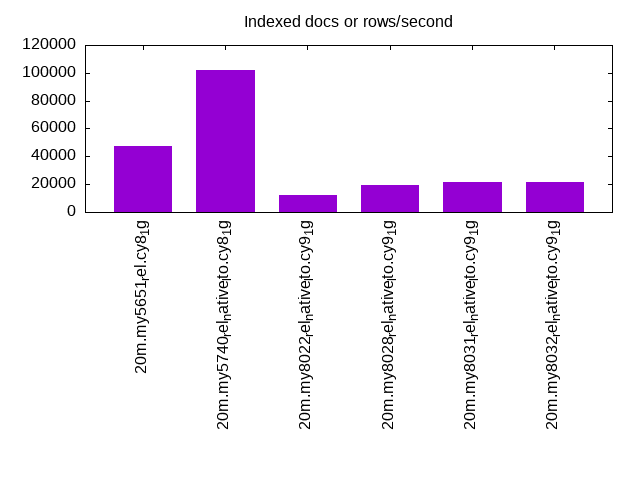
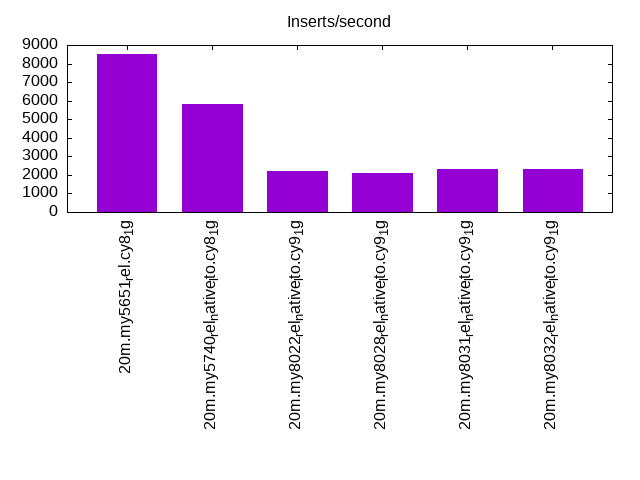
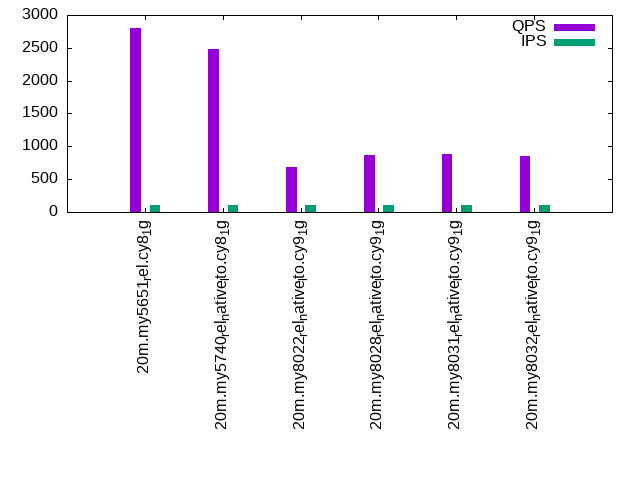
| 20m.my5651_rel.cy8_1g | 95238 | 47518 | 8507 | 2802 | 2535 | 2200 |
| 20m.my5740_rel_native_lto.cy8_1g | 76628 | 102030 | 5831 | 2480 | 2295 | 1946 |
| 20m.my8022_rel_native_lto.cy9_1g | 62500 | 12539 | 2184 | 684 | 125 | 98 |
| 20m.my8028_rel_native_lto.cy9_1g | 62696 | 19706 | 2111 | 861 | 146 | 114 |
| 20m.my8031_rel_native_lto.cy9_1g | 58480 | 21360 | 2314 | 885 | 174 | 126 |
| 20m.my8032_rel_native_lto.cy9_1g | 58140 | 21360 | 2326 | 854 | 174 | 125 |
This table has relative throughput, throughput for the DBMS relative to the DBMS in the first line, using the absolute throughput from the previous table.
| dbms | l.i0 | l.x | l.i1 | q100.1 | q500.1 | q1000.1 |
|---|---|---|---|---|---|---|
| 20m.my5651_rel.cy8_1g | 1.00 | 1.00 | 1.00 | 1.00 | 1.00 | 1.00 |
| 20m.my5740_rel_native_lto.cy8_1g | 0.80 | 2.15 | 0.69 | 0.89 | 0.91 | 0.88 |
| 20m.my8022_rel_native_lto.cy9_1g | 0.66 | 0.26 | 0.26 | 0.24 | 0.05 | 0.04 |
| 20m.my8028_rel_native_lto.cy9_1g | 0.66 | 0.41 | 0.25 | 0.31 | 0.06 | 0.05 |
| 20m.my8031_rel_native_lto.cy9_1g | 0.61 | 0.45 | 0.27 | 0.32 | 0.07 | 0.06 |
| 20m.my8032_rel_native_lto.cy9_1g | 0.61 | 0.45 | 0.27 | 0.30 | 0.07 | 0.06 |
This lists the average rate of inserts/s for the tests that do inserts concurrent with queries. For such tests the query rate is listed in the table above. The read+write tests are setup so that the insert rate should match the target rate every second. Cells that are not at least 95% of the target have a red background to indicate a failure to satisfy the target.
| dbms | q100.1 | q500.1 | q1000.1 |
|---|---|---|---|
| my5651_rel.cy8_1g | 100 | 499 | 998 |
| my5740_rel_native_lto.cy8_1g | 100 | 499 | 998 |
| my8022_rel_native_lto.cy9_1g | 100 | 378 | 457 |
| my8028_rel_native_lto.cy9_1g | 100 | 472 | 640 |
| my8031_rel_native_lto.cy9_1g | 100 | 496 | 709 |
| my8032_rel_native_lto.cy9_1g | 100 | 495 | 711 |
| target | 100 | 500 | 1000 |
l.i0
l.i0: load without secondary indexes. Graphs for performance per 1-second interval are here.
Average throughput:
Insert response time histogram: each cell has the percentage of responses that take <= the time in the header and max is the max response time in seconds. For the max column values in the top 25% of the range have a red background and in the bottom 25% of the range have a green background. The red background is not used when the min value is within 80% of the max value.
| dbms | 256us | 1ms | 4ms | 16ms | 64ms | 256ms | 1s | 4s | 16s | gt | max |
|---|---|---|---|---|---|---|---|---|---|---|---|
| my5651_rel.cy8_1g | 88.171 | 11.202 | 0.615 | 0.009 | 0.003 | 0.097 | |||||
| my5740_rel_native_lto.cy8_1g | 3.449 | 94.827 | 1.572 | 0.151 | 0.001 | 0.066 | |||||
| my8022_rel_native_lto.cy9_1g | 99.564 | 0.243 | 0.178 | 0.015 | 0.104 | ||||||
| my8028_rel_native_lto.cy9_1g | 99.440 | 0.415 | 0.137 | 0.009 | 0.104 | ||||||
| my8031_rel_native_lto.cy9_1g | 99.394 | 0.471 | 0.132 | 0.003 | 0.123 | ||||||
| my8032_rel_native_lto.cy9_1g | 99.379 | 0.450 | 0.169 | 0.002 | 0.127 |
Performance metrics for the DBMS listed above. Some are normalized by throughput, others are not. Legend for results is here.
ips	qps	rps	rmbps	wps	wmbps	rpq	rkbpq	wpi	wkbpi	csps	cpups	cspq	cpupq	dbgb1	dbgb2	rss	maxop	p50	p99	tag
95238	0	838	3.3	71.4	26.6	0.009	0.035	0.001	0.286	11187	21.7	0.117	18	1.3	41.8	1.0	0.097	98709	59635	20m.my5651_rel.cy8_1g
76628	0	0	0.0	103.3	21.5	0.000	0.000	0.001	0.287	7909	20.6	0.103	22	1.3	41.8	1.1	0.066	76559	67326	20m.my5740_rel_native_lto.cy8_1g
62500	0	0	0.0	161.4	18.3	0.000	0.000	0.003	0.299	7011	21.2	0.112	27	1.3	9.9	1.3	0.104	63029	54239	20m.my8022_rel_native_lto.cy9_1g
62696	0	0	0.0	165.0	18.4	0.000	0.000	0.003	0.300	7088	21.5	0.113	27	1.3	9.9	1.3	0.104	63412	53473	20m.my8028_rel_native_lto.cy9_1g
58480	0	0	0.0	172.4	17.8	0.000	0.000	0.003	0.311	6975	21.1	0.119	29	1.3	9.9	1.3	0.123	58933	49444	20m.my8031_rel_native_lto.cy9_1g
58140	0	0	0.0	173.2	17.8	0.000	0.000	0.003	0.313	6964	20.9	0.120	29	1.3	9.9	1.4	0.127	58734	44452	20m.my8032_rel_native_lto.cy9_1g
l.x
l.x: create secondary indexes.
Average throughput:
Performance metrics for the DBMS listed above. Some are normalized by throughput, others are not. Legend for results is here.
ips	qps	rps	rmbps	wps	wmbps	rpq	rkbpq	wpi	wkbpi	csps	cpups	cspq	cpupq	dbgb1	dbgb2	rss	maxop	p50	p99	tag
47518	0	24	0.1	345.7	48.4	0.001	0.002	0.007	1.042	2089	6.3	0.044	11	2.7	43.2	1.1	0.012	NA	NA	20m.my5651_rel.cy8_1g
102030	0	0	0.0	342.1	91.7	0.000	0.000	0.003	0.921	4960	9.7	0.049	8	3.0	43.5	1.3	0.012	NA	NA	20m.my5740_rel_native_lto.cy8_1g
12539	0	0	0.0	317.8	11.2	0.000	0.000	0.025	0.914	2385	1.5	0.190	10	3.0	11.5	1.5	0.028	NA	NA	20m.my8022_rel_native_lto.cy9_1g
19706	0	102	6.8	543.4	22.2	0.005	0.355	0.028	1.154	4024	6.9	0.204	28	3.0	11.5	1.4	0.018	NA	NA	20m.my8028_rel_native_lto.cy9_1g
21360	0	110	7.4	575.6	23.7	0.005	0.354	0.027	1.137	4408	6.8	0.206	25	3.0	11.5	1.5	0.012	NA	NA	20m.my8031_rel_native_lto.cy9_1g
21360	0	110	7.4	574.4	23.7	0.005	0.354	0.027	1.137	4396	7.9	0.206	30	3.0	11.5	1.5	0.034	NA	NA	20m.my8032_rel_native_lto.cy9_1g
l.i1
l.i1: continue load after secondary indexes created. Graphs for performance per 1-second interval are here.
Average throughput:
Insert response time histogram: each cell has the percentage of responses that take <= the time in the header and max is the max response time in seconds. For the max column values in the top 25% of the range have a red background and in the bottom 25% of the range have a green background. The red background is not used when the min value is within 80% of the max value.
| dbms | 256us | 1ms | 4ms | 16ms | 64ms | 256ms | 1s | 4s | 16s | gt | max |
|---|---|---|---|---|---|---|---|---|---|---|---|
| my5651_rel.cy8_1g | 42.650 | 52.828 | 4.460 | 0.056 | 0.005 | 0.871 | |||||
| my5740_rel_native_lto.cy8_1g | 2.020 | 88.421 | 9.481 | 0.072 | 0.006 | 0.574 | |||||
| my8022_rel_native_lto.cy9_1g | 1.053 | 60.669 | 31.998 | 5.946 | 0.289 | 0.046 | nonzero | 4.122 | |||
| my8028_rel_native_lto.cy9_1g | 0.737 | 58.761 | 32.865 | 7.417 | 0.208 | 0.012 | nonzero | 7.464 | |||
| my8031_rel_native_lto.cy9_1g | 0.472 | 60.394 | 33.578 | 5.409 | 0.122 | 0.025 | 3.057 | ||||
| my8032_rel_native_lto.cy9_1g | 0.567 | 60.553 | 33.355 | 5.378 | 0.123 | 0.025 | 3.897 |
Performance metrics for the DBMS listed above. Some are normalized by throughput, others are not. Legend for results is here.
ips	qps	rps	rmbps	wps	wmbps	rpq	rkbpq	wpi	wkbpi	csps	cpups	cspq	cpupq	dbgb1	dbgb2	rss	maxop	p50	p99	tag
8507	0	154	0.6	1769.3	66.7	0.018	0.072	0.208	8.031	5908	14.9	0.695	140	7.7	48.2	1.1	0.871	8640	1000	20m.my5651_rel.cy8_1g
5831	0	0	0.0	1398.4	50.1	0.000	0.001	0.240	8.805	5025	13.9	0.862	191	7.7	48.3	1.3	0.574	5843	1398	20m.my5740_rel_native_lto.cy8_1g
2184	0	0	0.0	1063.6	21.4	0.000	0.000	0.487	10.032	5786	6.8	2.650	249	7.7	16.3	1.5	4.122	2347	50	20m.my8022_rel_native_lto.cy9_1g
2111	0	0	0.0	902.1	18.1	0.000	0.000	0.427	8.769	5066	6.9	2.400	262	7.7	16.3	1.5	7.464	2197	50	20m.my8028_rel_native_lto.cy9_1g
2314	0	0	0.0	1039.1	21.2	0.000	0.001	0.449	9.377	5875	8.0	2.539	277	7.7	16.3	1.5	3.057	2447	50	20m.my8031_rel_native_lto.cy9_1g
2326	0	0	0.0	1041.3	21.3	0.000	0.000	0.448	9.360	5887	8.0	2.531	275	7.7	16.3	1.5	3.897	2447	50	20m.my8032_rel_native_lto.cy9_1g
q100.1
q100.1: range queries with 100 insert/s per client. Graphs for performance per 1-second interval are here.
Average throughput:
Query response time histogram: each cell has the percentage of responses that take <= the time in the header and max is the max response time in seconds. For max values in the top 25% of the range have a red background and in the bottom 25% of the range have a green background. The red background is not used when the min value is within 80% of the max value.
| dbms | 256us | 1ms | 4ms | 16ms | 64ms | 256ms | 1s | 4s | 16s | gt | max |
|---|---|---|---|---|---|---|---|---|---|---|---|
| my5651_rel.cy8_1g | 34.695 | 64.598 | 0.262 | 0.399 | 0.045 | 0.001 | 0.190 | ||||
| my5740_rel_native_lto.cy8_1g | 19.704 | 79.537 | 0.191 | 0.565 | 0.003 | 0.057 | |||||
| my8022_rel_native_lto.cy9_1g | 7.094 | 88.051 | 0.446 | 2.188 | 2.006 | 0.214 | 0.001 | 0.387 | |||
| my8028_rel_native_lto.cy9_1g | 6.386 | 89.037 | 0.498 | 2.365 | 1.655 | 0.060 | nonzero | 0.259 | |||
| my8031_rel_native_lto.cy9_1g | 3.380 | 92.025 | 0.601 | 2.418 | 1.531 | 0.046 | nonzero | 0.272 | |||
| my8032_rel_native_lto.cy9_1g | 1.592 | 93.665 | 0.613 | 2.453 | 1.631 | 0.045 | nonzero | 0.271 |
Insert response time histogram: each cell has the percentage of responses that take <= the time in the header and max is the max response time in seconds. For max values in the top 25% of the range have a red background and in the bottom 25% of the range have a green background. The red background is not used when the min value is within 80% of the max value.
| dbms | 256us | 1ms | 4ms | 16ms | 64ms | 256ms | 1s | 4s | 16s | gt | max |
|---|---|---|---|---|---|---|---|---|---|---|---|
| my5651_rel.cy8_1g | 28.639 | 52.222 | 18.528 | 0.611 | 0.254 | ||||||
| my5740_rel_native_lto.cy8_1g | 17.694 | 71.278 | 10.139 | 0.889 | 0.121 | ||||||
| my8022_rel_native_lto.cy9_1g | 0.806 | 30.694 | 12.861 | 33.889 | 21.722 | 0.028 | 1.056 | ||||
| my8028_rel_native_lto.cy9_1g | 1.472 | 43.222 | 11.944 | 34.917 | 8.444 | 0.770 | |||||
| my8031_rel_native_lto.cy9_1g | 0.306 | 45.750 | 12.667 | 34.306 | 6.972 | 0.843 | |||||
| my8032_rel_native_lto.cy9_1g | 0.139 | 45.278 | 12.861 | 35.167 | 6.556 | 0.810 |
Performance metrics for the DBMS listed above. Some are normalized by throughput, others are not. Legend for results is here.
ips	qps	rps	rmbps	wps	wmbps	rpq	rkbpq	wpi	wkbpi	csps	cpups	cspq	cpupq	dbgb1	dbgb2	rss	maxop	p50	p99	tag
100	2802	3	0.0	477.0	14.5	0.001	0.007	4.779	148.339	11892	12.0	4.244	343	7.9	48.4	1.1	0.190	2861	911	20m.my5651_rel.cy8_1g
100	2480	1	0.0	483.2	14.5	0.000	0.006	4.841	148.704	10877	12.4	4.386	400	7.9	48.4	1.3	0.057	2525	784	20m.my5740_rel_native_lto.cy8_1g
100	684	1	0.0	633.7	11.9	0.002	0.028	6.349	121.732	6164	6.1	9.016	714	7.9	16.5	1.5	0.387	320	16	20m.my8022_rel_native_lto.cy9_1g
100	861	1	0.0	663.1	12.2	0.001	0.018	6.644	124.774	6903	6.8	8.021	632	7.9	16.5	1.5	0.259	655	32	20m.my8028_rel_native_lto.cy9_1g
100	885	1	0.0	673.4	12.4	0.001	0.016	6.748	126.866	7234	7.3	8.174	660	7.9	16.5	1.5	0.272	640	32	20m.my8031_rel_native_lto.cy9_1g
100	854	1	0.0	670.0	12.3	0.001	0.019	6.713	126.356	7094	7.3	8.309	684	7.9	16.5	1.5	0.271	703	32	20m.my8032_rel_native_lto.cy9_1g
q500.1
q500.1: range queries with 500 insert/s per client. Graphs for performance per 1-second interval are here.
Average throughput:
Query response time histogram: each cell has the percentage of responses that take <= the time in the header and max is the max response time in seconds. For max values in the top 25% of the range have a red background and in the bottom 25% of the range have a green background. The red background is not used when the min value is within 80% of the max value.
| dbms | 256us | 1ms | 4ms | 16ms | 64ms | 256ms | 1s | 4s | 16s | gt | max |
|---|---|---|---|---|---|---|---|---|---|---|---|
| my5651_rel.cy8_1g | 31.376 | 67.750 | 0.086 | 0.699 | 0.089 | nonzero | 0.089 | ||||
| my5740_rel_native_lto.cy8_1g | 17.836 | 81.281 | 0.018 | 0.864 | nonzero | 0.025 | |||||
| my8022_rel_native_lto.cy9_1g | 1.220 | 64.081 | 1.046 | 18.085 | 13.885 | 1.682 | 0.001 | 0.315 | |||
| my8028_rel_native_lto.cy9_1g | 1.203 | 62.495 | 2.012 | 19.856 | 13.826 | 0.606 | 0.002 | 0.389 | |||
| my8031_rel_native_lto.cy9_1g | 0.651 | 64.514 | 2.421 | 20.840 | 11.350 | 0.225 | 0.223 | ||||
| my8032_rel_native_lto.cy9_1g | 0.396 | 65.165 | 2.406 | 20.536 | 11.220 | 0.277 | 0.227 |
Insert response time histogram: each cell has the percentage of responses that take <= the time in the header and max is the max response time in seconds. For max values in the top 25% of the range have a red background and in the bottom 25% of the range have a green background. The red background is not used when the min value is within 80% of the max value.
| dbms | 256us | 1ms | 4ms | 16ms | 64ms | 256ms | 1s | 4s | 16s | gt | max |
|---|---|---|---|---|---|---|---|---|---|---|---|
| my5651_rel.cy8_1g | 52.606 | 42.200 | 5.183 | 0.011 | 0.073 | ||||||
| my5740_rel_native_lto.cy8_1g | 34.494 | 64.211 | 1.294 | 0.058 | |||||||
| my8022_rel_native_lto.cy9_1g | 0.328 | 21.294 | 21.061 | 44.983 | 12.333 | 0.759 | |||||
| my8028_rel_native_lto.cy9_1g | 0.483 | 14.783 | 24.261 | 59.306 | 1.167 | 0.606 | |||||
| my8031_rel_native_lto.cy9_1g | 0.044 | 17.817 | 26.950 | 54.989 | 0.200 | 0.592 | |||||
| my8032_rel_native_lto.cy9_1g | 0.067 | 18.406 | 27.517 | 53.617 | 0.394 | 0.487 |
Performance metrics for the DBMS listed above. Some are normalized by throughput, others are not. Legend for results is here.
ips	qps	rps	rmbps	wps	wmbps	rpq	rkbpq	wpi	wkbpi	csps	cpups	cspq	cpupq	dbgb1	dbgb2	rss	maxop	p50	p99	tag
499	2535	14	0.1	1173.0	35.6	0.005	0.043	2.350	73.134	12377	11.9	4.882	376	8.3	48.8	1.1	0.089	2541	2349	20m.my5651_rel.cy8_1g
499	2295	5	0.1	1148.4	34.9	0.002	0.035	2.301	71.697	11715	12.7	5.104	443	8.3	48.9	1.3	0.025	2285	2141	20m.my5740_rel_native_lto.cy8_1g
378	125	3	0.1	775.8	14.7	0.027	0.464	2.055	39.769	5075	4.1	40.734	2633	8.3	16.9	1.5	0.315	48	16	20m.my8022_rel_native_lto.cy9_1g
472	146	5	0.1	908.8	17.3	0.032	0.546	1.925	37.490	5608	4.7	38.435	2577	8.3	16.9	1.5	0.389	80	32	20m.my8028_rel_native_lto.cy9_1g
496	174	4	0.1	1012.6	19.3	0.024	0.412	2.040	39.820	6383	5.6	36.684	2575	8.3	16.9	1.5	0.223	96	48	20m.my8031_rel_native_lto.cy9_1g
495	174	5	0.1	1012.1	19.3	0.031	0.440	2.045	39.920	6361	5.6	36.665	2582	8.3	16.9	1.5	0.227	96	32	20m.my8032_rel_native_lto.cy9_1g
q1000.1
q1000.1: range queries with 1000 insert/s per client. Graphs for performance per 1-second interval are here.
Average throughput:
Query response time histogram: each cell has the percentage of responses that take <= the time in the header and max is the max response time in seconds. For max values in the top 25% of the range have a red background and in the bottom 25% of the range have a green background. The red background is not used when the min value is within 80% of the max value.
| dbms | 256us | 1ms | 4ms | 16ms | 64ms | 256ms | 1s | 4s | 16s | gt | max |
|---|---|---|---|---|---|---|---|---|---|---|---|
| my5651_rel.cy8_1g | 27.572 | 71.094 | 0.081 | 1.136 | 0.117 | nonzero | 0.123 | ||||
| my5740_rel_native_lto.cy8_1g | 16.919 | 81.654 | 0.045 | 1.292 | 0.086 | 0.004 | 0.129 | ||||
| my8022_rel_native_lto.cy9_1g | 0.454 | 59.080 | 1.901 | 19.243 | 16.540 | 2.780 | 0.003 | 0.373 | |||
| my8028_rel_native_lto.cy9_1g | 0.285 | 55.540 | 3.317 | 21.969 | 17.830 | 1.057 | 0.001 | 0.347 | |||
| my8031_rel_native_lto.cy9_1g | 0.140 | 54.417 | 5.027 | 23.830 | 15.972 | 0.615 | nonzero | 0.279 | |||
| my8032_rel_native_lto.cy9_1g | 0.053 | 54.317 | 5.133 | 23.635 | 16.250 | 0.610 | 0.001 | 0.339 |
Insert response time histogram: each cell has the percentage of responses that take <= the time in the header and max is the max response time in seconds. For max values in the top 25% of the range have a red background and in the bottom 25% of the range have a green background. The red background is not used when the min value is within 80% of the max value.
| dbms | 256us | 1ms | 4ms | 16ms | 64ms | 256ms | 1s | 4s | 16s | gt | max |
|---|---|---|---|---|---|---|---|---|---|---|---|
| my5651_rel.cy8_1g | 50.386 | 44.553 | 5.036 | 0.025 | 0.223 | ||||||
| my5740_rel_native_lto.cy8_1g | 14.858 | 82.422 | 2.400 | 0.319 | 0.165 | ||||||
| my8022_rel_native_lto.cy9_1g | 0.075 | 31.047 | 16.869 | 41.939 | 10.069 | 0.880 | |||||
| my8028_rel_native_lto.cy9_1g | 0.061 | 21.933 | 27.431 | 49.822 | 0.753 | 0.648 | |||||
| my8031_rel_native_lto.cy9_1g | 0.008 | 22.656 | 30.997 | 46.144 | 0.194 | 0.424 | |||||
| my8032_rel_native_lto.cy9_1g | 0.022 | 23.297 | 30.633 | 45.889 | 0.158 | 0.580 |
Performance metrics for the DBMS listed above. Some are normalized by throughput, others are not. Legend for results is here.
ips	qps	rps	rmbps	wps	wmbps	rpq	rkbpq	wpi	wkbpi	csps	cpups	cspq	cpupq	dbgb1	dbgb2	rss	maxop	p50	p99	tag
998	2200	25	0.2	1988.3	60.6	0.011	0.084	1.992	62.211	12684	12.2	5.767	444	8.8	49.3	1.1	0.123	2205	1933	20m.my5651_rel.cy8_1g
998	1946	8	0.1	1921.7	58.5	0.004	0.071	1.925	60.017	12622	14.0	6.486	576	8.8	49.3	1.3	0.129	2014	1183	20m.my5740_rel_native_lto.cy8_1g
457	98	2	0.0	751.9	14.3	0.018	0.295	1.644	31.924	4878	4.0	49.722	3262	8.8	17.3	1.5	0.373	48	16	20m.my8022_rel_native_lto.cy9_1g
640	114	3	0.0	923.2	17.7	0.024	0.383	1.441	28.232	5551	5.0	48.864	3521	8.8	17.3	1.5	0.347	64	16	20m.my8028_rel_native_lto.cy9_1g
709	126	2	0.0	1024.6	19.7	0.020	0.322	1.444	28.488	6265	5.9	49.642	3740	8.8	17.3	1.5	0.279	80	32	20m.my8031_rel_native_lto.cy9_1g
711	125	3	0.0	1021.2	19.7	0.025	0.367	1.437	28.369	6238	5.8	49.820	3706	8.8	17.3	1.5	0.339	80	32	20m.my8032_rel_native_lto.cy9_1g
l.i0
l.i0: load without secondary indexes
Performance metrics for all DBMS, not just the ones listed above. Some are normalized by throughput, others are not. Legend for results is here.
ips	qps	rps	rmbps	wps	wmbps	rpq	rkbpq	wpi	wkbpi	csps	cpups	cspq	cpupq	dbgb1	dbgb2	rss	maxop	p50	p99	tag
95238	0	838	3.3	71.4	26.6	0.009	0.035	0.001	0.286	11187	21.7	0.117	18	1.3	41.8	1.0	0.097	98709	59635	20m.my5651_rel.cy8_1g
76628	0	0	0.0	103.3	21.5	0.000	0.000	0.001	0.287	7909	20.6	0.103	22	1.3	41.8	1.1	0.066	76559	67326	20m.my5740_rel_native_lto.cy8_1g
62500	0	0	0.0	161.4	18.3	0.000	0.000	0.003	0.299	7011	21.2	0.112	27	1.3	9.9	1.3	0.104	63029	54239	20m.my8022_rel_native_lto.cy9_1g
62696	0	0	0.0	165.0	18.4	0.000	0.000	0.003	0.300	7088	21.5	0.113	27	1.3	9.9	1.3	0.104	63412	53473	20m.my8028_rel_native_lto.cy9_1g
58480	0	0	0.0	172.4	17.8	0.000	0.000	0.003	0.311	6975	21.1	0.119	29	1.3	9.9	1.3	0.123	58933	49444	20m.my8031_rel_native_lto.cy9_1g
58140	0	0	0.0	173.2	17.8	0.000	0.000	0.003	0.313	6964	20.9	0.120	29	1.3	9.9	1.4	0.127	58734	44452	20m.my8032_rel_native_lto.cy9_1g
l.x
l.x: create secondary indexes
Performance metrics for all DBMS, not just the ones listed above. Some are normalized by throughput, others are not. Legend for results is here.
ips	qps	rps	rmbps	wps	wmbps	rpq	rkbpq	wpi	wkbpi	csps	cpups	cspq	cpupq	dbgb1	dbgb2	rss	maxop	p50	p99	tag
47518	0	24	0.1	345.7	48.4	0.001	0.002	0.007	1.042	2089	6.3	0.044	11	2.7	43.2	1.1	0.012	NA	NA	20m.my5651_rel.cy8_1g
102030	0	0	0.0	342.1	91.7	0.000	0.000	0.003	0.921	4960	9.7	0.049	8	3.0	43.5	1.3	0.012	NA	NA	20m.my5740_rel_native_lto.cy8_1g
12539	0	0	0.0	317.8	11.2	0.000	0.000	0.025	0.914	2385	1.5	0.190	10	3.0	11.5	1.5	0.028	NA	NA	20m.my8022_rel_native_lto.cy9_1g
19706	0	102	6.8	543.4	22.2	0.005	0.355	0.028	1.154	4024	6.9	0.204	28	3.0	11.5	1.4	0.018	NA	NA	20m.my8028_rel_native_lto.cy9_1g
21360	0	110	7.4	575.6	23.7	0.005	0.354	0.027	1.137	4408	6.8	0.206	25	3.0	11.5	1.5	0.012	NA	NA	20m.my8031_rel_native_lto.cy9_1g
21360	0	110	7.4	574.4	23.7	0.005	0.354	0.027	1.137	4396	7.9	0.206	30	3.0	11.5	1.5	0.034	NA	NA	20m.my8032_rel_native_lto.cy9_1g
l.i1
l.i1: continue load after secondary indexes created
Performance metrics for all DBMS, not just the ones listed above. Some are normalized by throughput, others are not. Legend for results is here.
ips	qps	rps	rmbps	wps	wmbps	rpq	rkbpq	wpi	wkbpi	csps	cpups	cspq	cpupq	dbgb1	dbgb2	rss	maxop	p50	p99	tag
8507	0	154	0.6	1769.3	66.7	0.018	0.072	0.208	8.031	5908	14.9	0.695	140	7.7	48.2	1.1	0.871	8640	1000	20m.my5651_rel.cy8_1g
5831	0	0	0.0	1398.4	50.1	0.000	0.001	0.240	8.805	5025	13.9	0.862	191	7.7	48.3	1.3	0.574	5843	1398	20m.my5740_rel_native_lto.cy8_1g
2184	0	0	0.0	1063.6	21.4	0.000	0.000	0.487	10.032	5786	6.8	2.650	249	7.7	16.3	1.5	4.122	2347	50	20m.my8022_rel_native_lto.cy9_1g
2111	0	0	0.0	902.1	18.1	0.000	0.000	0.427	8.769	5066	6.9	2.400	262	7.7	16.3	1.5	7.464	2197	50	20m.my8028_rel_native_lto.cy9_1g
2314	0	0	0.0	1039.1	21.2	0.000	0.001	0.449	9.377	5875	8.0	2.539	277	7.7	16.3	1.5	3.057	2447	50	20m.my8031_rel_native_lto.cy9_1g
2326	0	0	0.0	1041.3	21.3	0.000	0.000	0.448	9.360	5887	8.0	2.531	275	7.7	16.3	1.5	3.897	2447	50	20m.my8032_rel_native_lto.cy9_1g
q100.1
q100.1: range queries with 100 insert/s per client
Performance metrics for all DBMS, not just the ones listed above. Some are normalized by throughput, others are not. Legend for results is here.
ips	qps	rps	rmbps	wps	wmbps	rpq	rkbpq	wpi	wkbpi	csps	cpups	cspq	cpupq	dbgb1	dbgb2	rss	maxop	p50	p99	tag
100	2802	3	0.0	477.0	14.5	0.001	0.007	4.779	148.339	11892	12.0	4.244	343	7.9	48.4	1.1	0.190	2861	911	20m.my5651_rel.cy8_1g
100	2480	1	0.0	483.2	14.5	0.000	0.006	4.841	148.704	10877	12.4	4.386	400	7.9	48.4	1.3	0.057	2525	784	20m.my5740_rel_native_lto.cy8_1g
100	684	1	0.0	633.7	11.9	0.002	0.028	6.349	121.732	6164	6.1	9.016	714	7.9	16.5	1.5	0.387	320	16	20m.my8022_rel_native_lto.cy9_1g
100	861	1	0.0	663.1	12.2	0.001	0.018	6.644	124.774	6903	6.8	8.021	632	7.9	16.5	1.5	0.259	655	32	20m.my8028_rel_native_lto.cy9_1g
100	885	1	0.0	673.4	12.4	0.001	0.016	6.748	126.866	7234	7.3	8.174	660	7.9	16.5	1.5	0.272	640	32	20m.my8031_rel_native_lto.cy9_1g
100	854	1	0.0	670.0	12.3	0.001	0.019	6.713	126.356	7094	7.3	8.309	684	7.9	16.5	1.5	0.271	703	32	20m.my8032_rel_native_lto.cy9_1g
q500.1
q500.1: range queries with 500 insert/s per client
Performance metrics for all DBMS, not just the ones listed above. Some are normalized by throughput, others are not. Legend for results is here.
ips	qps	rps	rmbps	wps	wmbps	rpq	rkbpq	wpi	wkbpi	csps	cpups	cspq	cpupq	dbgb1	dbgb2	rss	maxop	p50	p99	tag
499	2535	14	0.1	1173.0	35.6	0.005	0.043	2.350	73.134	12377	11.9	4.882	376	8.3	48.8	1.1	0.089	2541	2349	20m.my5651_rel.cy8_1g
499	2295	5	0.1	1148.4	34.9	0.002	0.035	2.301	71.697	11715	12.7	5.104	443	8.3	48.9	1.3	0.025	2285	2141	20m.my5740_rel_native_lto.cy8_1g
378	125	3	0.1	775.8	14.7	0.027	0.464	2.055	39.769	5075	4.1	40.734	2633	8.3	16.9	1.5	0.315	48	16	20m.my8022_rel_native_lto.cy9_1g
472	146	5	0.1	908.8	17.3	0.032	0.546	1.925	37.490	5608	4.7	38.435	2577	8.3	16.9	1.5	0.389	80	32	20m.my8028_rel_native_lto.cy9_1g
496	174	4	0.1	1012.6	19.3	0.024	0.412	2.040	39.820	6383	5.6	36.684	2575	8.3	16.9	1.5	0.223	96	48	20m.my8031_rel_native_lto.cy9_1g
495	174	5	0.1	1012.1	19.3	0.031	0.440	2.045	39.920	6361	5.6	36.665	2582	8.3	16.9	1.5	0.227	96	32	20m.my8032_rel_native_lto.cy9_1g
q1000.1
q1000.1: range queries with 1000 insert/s per client
Performance metrics for all DBMS, not just the ones listed above. Some are normalized by throughput, others are not. Legend for results is here.
ips	qps	rps	rmbps	wps	wmbps	rpq	rkbpq	wpi	wkbpi	csps	cpups	cspq	cpupq	dbgb1	dbgb2	rss	maxop	p50	p99	tag
998	2200	25	0.2	1988.3	60.6	0.011	0.084	1.992	62.211	12684	12.2	5.767	444	8.8	49.3	1.1	0.123	2205	1933	20m.my5651_rel.cy8_1g
998	1946	8	0.1	1921.7	58.5	0.004	0.071	1.925	60.017	12622	14.0	6.486	576	8.8	49.3	1.3	0.129	2014	1183	20m.my5740_rel_native_lto.cy8_1g
457	98	2	0.0	751.9	14.3	0.018	0.295	1.644	31.924	4878	4.0	49.722	3262	8.8	17.3	1.5	0.373	48	16	20m.my8022_rel_native_lto.cy9_1g
640	114	3	0.0	923.2	17.7	0.024	0.383	1.441	28.232	5551	5.0	48.864	3521	8.8	17.3	1.5	0.347	64	16	20m.my8028_rel_native_lto.cy9_1g
709	126	2	0.0	1024.6	19.7	0.020	0.322	1.444	28.488	6265	5.9	49.642	3740	8.8	17.3	1.5	0.279	80	32	20m.my8031_rel_native_lto.cy9_1g
711	125	3	0.0	1021.2	19.7	0.025	0.367	1.437	28.369	6238	5.8	49.820	3706	8.8	17.3	1.5	0.339	80	32	20m.my8032_rel_native_lto.cy9_1g
l.i0
- l.i0: load without secondary indexes
- Legend for results is here.
- Each entry lists the percentage of responses that fit in that bucket (slower than max time for previous bucket, faster than min time for next bucket).
Insert response time histogram
256us	1ms	4ms	16ms	64ms	256ms	1s	4s	16s	gt	max	tag
0.000	88.171	11.202	0.615	0.009	0.003	0.000	0.000	0.000	0.000	0.097	my5651_rel.cy8_1g
0.000	3.449	94.827	1.572	0.151	0.001	0.000	0.000	0.000	0.000	0.066	my5740_rel_native_lto.cy8_1g
0.000	0.000	99.564	0.243	0.178	0.015	0.000	0.000	0.000	0.000	0.104	my8022_rel_native_lto.cy9_1g
0.000	0.000	99.440	0.415	0.137	0.009	0.000	0.000	0.000	0.000	0.104	my8028_rel_native_lto.cy9_1g
0.000	0.000	99.394	0.471	0.132	0.003	0.000	0.000	0.000	0.000	0.123	my8031_rel_native_lto.cy9_1g
0.000	0.000	99.379	0.450	0.169	0.002	0.000	0.000	0.000	0.000	0.127	my8032_rel_native_lto.cy9_1g
l.x
- l.x: create secondary indexes
- Legend for results is here.
- Each entry lists the percentage of responses that fit in that bucket (slower than max time for previous bucket, faster than min time for next bucket).
TODO - determine whether there is data for create index response time
l.i1
- l.i1: continue load after secondary indexes created
- Legend for results is here.
- Each entry lists the percentage of responses that fit in that bucket (slower than max time for previous bucket, faster than min time for next bucket).
Insert response time histogram
256us	1ms	4ms	16ms	64ms	256ms	1s	4s	16s	gt	max	tag
0.000	0.000	42.650	52.828	4.460	0.056	0.005	0.000	0.000	0.000	0.871	my5651_rel.cy8_1g
0.000	0.000	2.020	88.421	9.481	0.072	0.006	0.000	0.000	0.000	0.574	my5740_rel_native_lto.cy8_1g
0.000	0.000	1.053	60.669	31.998	5.946	0.289	0.046	nonzero	0.000	4.122	my8022_rel_native_lto.cy9_1g
0.000	0.000	0.737	58.761	32.865	7.417	0.208	0.012	nonzero	0.000	7.464	my8028_rel_native_lto.cy9_1g
0.000	0.000	0.472	60.394	33.578	5.409	0.122	0.025	0.000	0.000	3.057	my8031_rel_native_lto.cy9_1g
0.000	0.000	0.567	60.553	33.355	5.378	0.123	0.025	0.000	0.000	3.897	my8032_rel_native_lto.cy9_1g
q100.1
- q100.1: range queries with 100 insert/s per client
- Legend for results is here.
- Each entry lists the percentage of responses that fit in that bucket (slower than max time for previous bucket, faster than min time for next bucket).
Query response time histogram
256us	1ms	4ms	16ms	64ms	256ms	1s	4s	16s	gt	max	tag
34.695	64.598	0.262	0.399	0.045	0.001	0.000	0.000	0.000	0.000	0.190	my5651_rel.cy8_1g
19.704	79.537	0.191	0.565	0.003	0.000	0.000	0.000	0.000	0.000	0.057	my5740_rel_native_lto.cy8_1g
7.094	88.051	0.446	2.188	2.006	0.214	0.001	0.000	0.000	0.000	0.387	my8022_rel_native_lto.cy9_1g
6.386	89.037	0.498	2.365	1.655	0.060	nonzero	0.000	0.000	0.000	0.259	my8028_rel_native_lto.cy9_1g
3.380	92.025	0.601	2.418	1.531	0.046	nonzero	0.000	0.000	0.000	0.272	my8031_rel_native_lto.cy9_1g
1.592	93.665	0.613	2.453	1.631	0.045	nonzero	0.000	0.000	0.000	0.271	my8032_rel_native_lto.cy9_1g
Insert response time histogram
256us	1ms	4ms	16ms	64ms	256ms	1s	4s	16s	gt	max	tag
0.000	0.000	28.639	52.222	18.528	0.611	0.000	0.000	0.000	0.000	0.254	my5651_rel.cy8_1g
0.000	0.000	17.694	71.278	10.139	0.889	0.000	0.000	0.000	0.000	0.121	my5740_rel_native_lto.cy8_1g
0.000	0.000	0.806	30.694	12.861	33.889	21.722	0.028	0.000	0.000	1.056	my8022_rel_native_lto.cy9_1g
0.000	0.000	1.472	43.222	11.944	34.917	8.444	0.000	0.000	0.000	0.770	my8028_rel_native_lto.cy9_1g
0.000	0.000	0.306	45.750	12.667	34.306	6.972	0.000	0.000	0.000	0.843	my8031_rel_native_lto.cy9_1g
0.000	0.000	0.139	45.278	12.861	35.167	6.556	0.000	0.000	0.000	0.810	my8032_rel_native_lto.cy9_1g
q500.1
- q500.1: range queries with 500 insert/s per client
- Legend for results is here.
- Each entry lists the percentage of responses that fit in that bucket (slower than max time for previous bucket, faster than min time for next bucket).
Query response time histogram
256us	1ms	4ms	16ms	64ms	256ms	1s	4s	16s	gt	max	tag
31.376	67.750	0.086	0.699	0.089	nonzero	0.000	0.000	0.000	0.000	0.089	my5651_rel.cy8_1g
17.836	81.281	0.018	0.864	nonzero	0.000	0.000	0.000	0.000	0.000	0.025	my5740_rel_native_lto.cy8_1g
1.220	64.081	1.046	18.085	13.885	1.682	0.001	0.000	0.000	0.000	0.315	my8022_rel_native_lto.cy9_1g
1.203	62.495	2.012	19.856	13.826	0.606	0.002	0.000	0.000	0.000	0.389	my8028_rel_native_lto.cy9_1g
0.651	64.514	2.421	20.840	11.350	0.225	0.000	0.000	0.000	0.000	0.223	my8031_rel_native_lto.cy9_1g
0.396	65.165	2.406	20.536	11.220	0.277	0.000	0.000	0.000	0.000	0.227	my8032_rel_native_lto.cy9_1g
Insert response time histogram
256us	1ms	4ms	16ms	64ms	256ms	1s	4s	16s	gt	max	tag
0.000	0.000	52.606	42.200	5.183	0.011	0.000	0.000	0.000	0.000	0.073	my5651_rel.cy8_1g
0.000	0.000	34.494	64.211	1.294	0.000	0.000	0.000	0.000	0.000	0.058	my5740_rel_native_lto.cy8_1g
0.000	0.000	0.328	21.294	21.061	44.983	12.333	0.000	0.000	0.000	0.759	my8022_rel_native_lto.cy9_1g
0.000	0.000	0.483	14.783	24.261	59.306	1.167	0.000	0.000	0.000	0.606	my8028_rel_native_lto.cy9_1g
0.000	0.000	0.044	17.817	26.950	54.989	0.200	0.000	0.000	0.000	0.592	my8031_rel_native_lto.cy9_1g
0.000	0.000	0.067	18.406	27.517	53.617	0.394	0.000	0.000	0.000	0.487	my8032_rel_native_lto.cy9_1g
q1000.1
- q1000.1: range queries with 1000 insert/s per client
- Legend for results is here.
- Each entry lists the percentage of responses that fit in that bucket (slower than max time for previous bucket, faster than min time for next bucket).
Query response time histogram
256us	1ms	4ms	16ms	64ms	256ms	1s	4s	16s	gt	max	tag
27.572	71.094	0.081	1.136	0.117	nonzero	0.000	0.000	0.000	0.000	0.123	my5651_rel.cy8_1g
16.919	81.654	0.045	1.292	0.086	0.004	0.000	0.000	0.000	0.000	0.129	my5740_rel_native_lto.cy8_1g
0.454	59.080	1.901	19.243	16.540	2.780	0.003	0.000	0.000	0.000	0.373	my8022_rel_native_lto.cy9_1g
0.285	55.540	3.317	21.969	17.830	1.057	0.001	0.000	0.000	0.000	0.347	my8028_rel_native_lto.cy9_1g
0.140	54.417	5.027	23.830	15.972	0.615	nonzero	0.000	0.000	0.000	0.279	my8031_rel_native_lto.cy9_1g
0.053	54.317	5.133	23.635	16.250	0.610	0.001	0.000	0.000	0.000	0.339	my8032_rel_native_lto.cy9_1g
Insert response time histogram
256us	1ms	4ms	16ms	64ms	256ms	1s	4s	16s	gt	max	tag
0.000	0.000	50.386	44.553	5.036	0.025	0.000	0.000	0.000	0.000	0.223	my5651_rel.cy8_1g
0.000	0.000	14.858	82.422	2.400	0.319	0.000	0.000	0.000	0.000	0.165	my5740_rel_native_lto.cy8_1g
0.000	0.000	0.075	31.047	16.869	41.939	10.069	0.000	0.000	0.000	0.880	my8022_rel_native_lto.cy9_1g
0.000	0.000	0.061	21.933	27.431	49.822	0.753	0.000	0.000	0.000	0.648	my8028_rel_native_lto.cy9_1g
0.000	0.000	0.008	22.656	30.997	46.144	0.194	0.000	0.000	0.000	0.424	my8031_rel_native_lto.cy9_1g
0.000	0.000	0.022	23.297	30.633	45.889	0.158	0.000	0.000	0.000	0.580	my8032_rel_native_lto.cy9_1g